

Abstract
Potency assessment of clinical-grade vector lots is crucial to support adeno-associated virus (AAV) vector release and is required for future marketing authorization. We have developed and validated a cell-based, quantitative potency assay that detects both transgenic expression and activity of an AAV8-hUGT1A1 vector, which is currently under clinical evaluation for the treatment of Crigler-Najjar syndrome. Potency of AAV8-hUGT1A1 was evaluated in vitro. After transduction of human hepatoma 7 (Huh7) cells, transgene-positive cells were quantified using flow cytometry and transgenic activity by a bilirubin conjugation assay. The in vitro potency of various AAV8-hUGT1A1 batches was compared with their potency in vivo. After AAV8-hUGT1A1 transduction, quantification of UGT1A1-expressing cells shows a linear dose-response relation (R2 = 0.98) with adequate intra-assay and inter-day reproducibility (coefficient of variation [CV] = 11.0% and 22.6%, respectively). In accordance, bilirubin conjugation shows a linear dose-response relation (R2 = 0.99) with adequate intra- and inter-day reproducibility in the low dose range (CV = 15.7% and 19.7%, respectively). Both in vitro potency assays reliably translate to in vivo efficacy of AAV8-hUGT1A1 vector lots. The described cell-based potency assay for AAV8-hUGT1A1 adequately determines transgenic UGT1A1 expression and activity, which is consistent with in vivo efficacy. This novel approach is suited for the determination of vector lot potency to support clinical-grade vector release.
Keywords: adeno-associated virus, AAV8, potency, quantitative potency assay, bilirubin, Crigler-Najjar syndrome, gene therapy, transduction efficiency, UGT1A1 activity
Graphical Abstract
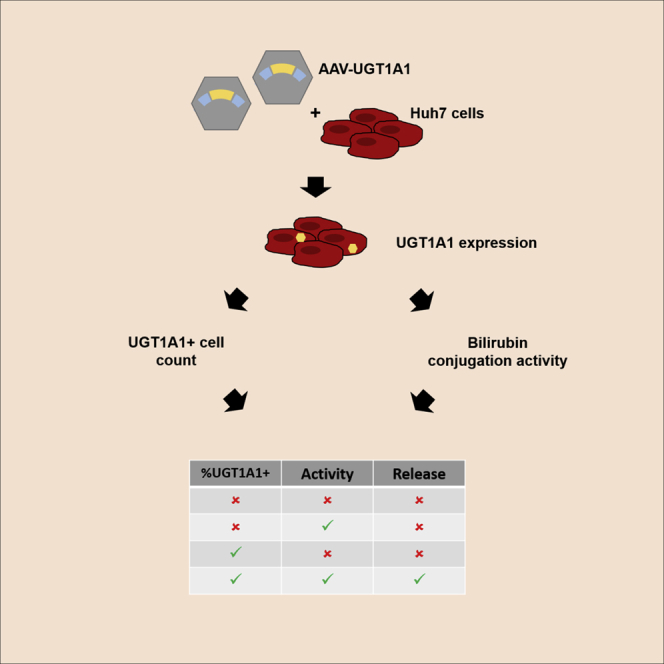
Increasing numbers of AAV-based gene therapy products proved effective in clinical studies. Potency assessment is a crucial part of quality control to release a batch and is needed for market approval. Aronson et al. show the validation of in vitro methods to assess potency of AAV8-hUGT1A1 vector batches.
Introduction
Adeno-associated virus (AAV)-mediated gene therapy has shown great potential to treat inherited monogenetic disorders, as clinical trials performed in the last decade point out.1, 2, 3, 4, 5, 6, 7, 8 An increasing number of AAV-based gene therapy medicinal products will enter clinical development, because eventually these advanced therapies will become part of the therapeutic arsenal for rare genetic diseases. One of the challenging aspects during gene therapy development is the characterization and quantification of vector potency, being one of the crucial methods of product quality control and required for marketing authorization.9 As defined by the European Medicines Agency (EMA),10 vector potency is the measurement of the biological activity using a quantitative biological assay, which is linked to the relevant biological properties and the claimed mechanism of action.
Crigler-Najjar syndrome (CN) is an ultra-rare autosomal recessive metabolic disorder characterized by severe unconjugated hyperbilirubinemia due to impaired or complete lack of uridine diphosphoglucuronosyl transferase 1A1 (UGT1A1).11,12 This enzyme deficiency, caused by mutations in the UGT1A1 gene, restricts glucuronidation and subsequent elimination of unconjugated bilirubin (UCB). To avoid accumulation of this neurotoxic compound that can cause life-threatening bilirubin encephalopathy,13 severely affected individuals depend on phototherapy up to 12 h/day, often followed by liver transplantation later in life.14, 15, 16
AAV-mediated gene therapy directed to the liver is an attractive alternative treatment for this particular enzyme deficiency, especially because restoration of UGT1A1 activity in the liver to only 5% of the normal level is sufficient to strongly reduce the disease severity.17 Pre-clinical studies in two murine models of CN showed complete and sustained correction of plasma bilirubin levels after a single intravenous administration of an AAV serotype 8 (AAV8) vector containing the human UGT1A1 gene (AAV8-hUGT1A1).18, 19, 20 Efforts to optimize and develop the vector for clinical application have resulted in a lead candidate vector that is currently under clinical evaluation (ClinicalTrials.gov: NCT03466463).21,22 In this study, we aimed to develop and validate a quantitative in vitro potency assay for this vector. Although the described potency assay is specific for the biological properties of this vector, the assay development and validation could be exemplary for many of the gene therapy products that are currently under development.
During AAV8-hUGT1A1 vector development and optimization, the potency profile was assessed in a cell-based system by protein quantification (western blot) after vector transduction in combination with in vivo assessment of transduction efficacy and surrogate markers for transgene activity. One of the drawbacks of in vivo studies used for potency testing is the fact that they are difficult to validate and standardize due to strong variations that are related to the animal models and study procedures. In addition, in vivo potency assessment is a time-consuming and labor-intensive procedure, resulting in high costs and an increased risk to introduce variation.
Using an in vitro method to assess vector potency will decrease assay time, reduce the amount of vector needed for testing, and reduce overall costs, although it is expected to increase reproducibility because of the homogeneity of cell culture. Furthermore, efforts to replace, reduce, and refine (3 Rs) current in vivo potency assessment is in accordance with the European Union (EU) directive on the protection of animals used for scientific purposes. This study describes a quantitative potency assay that detects both transgenic UGT1A1 expression and activity in a cell-based system. To determine whether this novel in vitro potency assay reliably translates to in vivo vector efficacy, we compared the outcome with conventional in vivo potency measurement of various AAV8-hUGT1A1 vector batches in murine models of CN.
Results
Here we present the validation of a quantitative AAV vector potency assay that detects both transgenic UGT1A1 expression and activity in a cell-based system. Subsequently, this novel in vitro potency assay was compared with the conventional in vivo potency measurement of various AAV8-hUGT1A1 vector batches in two murine models of CN.
Detection of Intra-cellular UGT1A1 by Flow Cytometry
To determine the transduction efficiency of AAV8-hUGT1A1 vector batches, we developed a flow cytometry-based assay to quantify the percentage of UGT1A1-expressing cells. For the antibody-based assays, the monoclonal UGT1 antibody clone WP1 was used.23 As a positive control for these assays, UGT1A1-overexpressing HEK293 cells were used. Specificity of the antibody and overexpression were confirmed by immunoblotting commercially available UGT1A1 protein and cell lysates (Figure S1). The liver-specific promoter driving hUGT1A1 in the vector suitable for clinical use renders the use of a hepatoma cell line for potency studies necessary. We chose to use the human hepatoma 7 (Huh7) cell line and show that these cells transduced with AAV8-hUGT1A1 express UGT1A1 protein, whereas in the parental cells, no endogenous expression of UGT1A1 is detectable (Figure 1A; Figure S1). When using anti-UGT1 monoclonal to detect intracellular UGT1A1 in flow cytometry, a high signal in HEK293 cells overexpressing UGT1A1 was observed, whereas in the parental cells, only a background signal was seen, indicating that this method is suitable for the detection of UGT1A1 expression in cultured cells (Figure 1B). Using two viral doses, we evaluated whether UGT1A1-positive cell detection by flow cytometry at 24 h post-transduction was sufficient or if 48 h would be needed. Longer periods were not tested because it would complicate the assay because of the effect of reaching confluence on cell growth and the potential loss of expression upon cell division. As shown in Figure 1C, the percentage of positive cells was <1% at 24 h after transduction, whereas at 48 h, this percentage was at least 5-fold higher, indicating a more sensitive detection at the later time point. All subsequent cytometry experiments were performed at 48 h post-transduction. As expected based on the western blot, the background signal in Huh7 cells is very low. Because the liver-specific promoter used is weak compared with the phosphoglycerate kinase (PGK) promoter, no clear distinction is seen between the UGT1A1-expressing cells and the negative cells, as was seen with the lentiviral vector. To ensure specificity, only cells expressing UGT1A1 should be considered as positive. Therefore, the gating was set at the edge of the stained parental control (Figure 1D). Using the settings mentioned before, transducing the cells with doses increasing from 9.5 × 10³ to 5.7 × 10⁴ vector genomes (vg)/seeded cell of AAV8-hUGT1A1 results in an adequate detection with linear correlation (R2 = 0.98) (Figures 1D and 1E).
Figure 1.

Intra-cellular UGT1A1 Protein Detection by Flow Cytometry in AAV8-hUGT1A1-Transduced Cells
(A) UGT1A1 protein detection by western blot in lysates of HEK293 cells overexpressing UGT1A1 (Ctrl) and AAV8-hUGT1A1-transduced Huh7 cells (Huh7+). (B) Intracellular UGT1A1 detection by flow cytometry of UGT1A1-overexpressing HEK293 cells (gray) compared with parental HEK293 cells with (solid line) and without (dotted line) primary antibody and unstained HEK293 cells (dashed line). (C) Comparison of UGT1A1-positive Huh7 cell fraction after adding two doses of vector genomes, measured 24 or 48 h after transduction. (D) Representative flow cytometry histogram with AF488 ± gate of unstained (dashed line), secondary only (dotted line), and fully stained (solid line) parental Huh7 cells and Huh7 cells transduced with doses of AAV8-hUGT1A1 increasing from 9.5 × 10³ to 5.7 × 10⁴ vg/seeded cell (grayscale). (E) Correlation of UGT1A1-positive cells/viral dose of (D).
To show the reproducibility of the assay, we tested the intra-assay and inter-day precision. The intra-assay precision was assessed by performing two experiments on 1 day, using three different doses of AAV8-hUGT1A1, and calculating the coefficient of variation (CV%) of UGT1A1-positive cells. This procedure was repeated three times. The intra-assay CV% for the highest vector dose (3.8 × 10⁴ vg/seeded cell) varied from 1.3% to 18.4%, with an average of 11.0% (Table 1). Subsequently, the inter-day precision was assessed by calculating the CV% for each vector dose in three independent experiments performed on different days. The inter-day CV% for the highest vector dose used (3.8 × 10⁴ vg/seeded cell) was 22.6% (Table 2). These data show that flow cytometry can be used to determine the transduction efficiency of AAV8-hUGT1A1 batches in vitro with high specificity and sufficient precision.
Table 1.
Intra-assay Precision of Transduction Efficiency Measurement after Transducing Huh7 Cells with AAV8-hUGT1A1
| AAV8-hUGT1A1 vg/Seeded Cell |
|||
|---|---|---|---|
| 9,500 | 19,000 | 38,000 | |
| Day 1 | 2.7 | 8.2 | 10.7 |
| 1.4 | 8.1 | 10.5 | |
| Intra-assay %CV | 43.3% | 1.4% | 1.3% |
| Day 2 | 4.1 | 10.3 | 14.0 |
| 3.1 | 6.5 | 18.2 | |
| Intra-assay %CV | 19.4% | 31.8% | 18.4% |
| Day 3 | 3.3 | 6.5 | 12.8 |
| 2.7 | 6.0 | 10.6 | |
| Intra-assay %CV | 14.0% | 5.6% | 13.3% |
| Mean intra-assay %CV | 25.6% | 12.9% | 11.0% |
All virus concentrations were measured in duplicate. Mean transduction percentage and coefficient of variation (%CV) were calculated.
Table 2.
Inter-day Precision of Transduction Efficiency Measurement after Transducing Huh7 Cells with AAV8-hUGT1A1
| AAV8-hUGT1A1 vg/Seeded Cell |
|||
|---|---|---|---|
| 9,500 | 1,9000 | 38,000 | |
| Day 1 (n = 2) | 2.1 | 8.1 | 10.6 |
| Day 2 (n = 2) | 3.6 | 8.4 | 16.1 |
| Day 3 (n = 2) | 3.0 | 6.2 | 11.7 |
| Inter-day, mean | 2.9 | 7.6 | 12.8 |
| Inter-day, SD | 0.8 | 1.2 | 2.9 |
| Inter-day, %CV | 27.6% | 15.8% | 22.6% |
Samples were measured in duplicate on three different days. Mean in transduction percentage, standard deviation (SD), and %CV were calculated.
Determining Intra-cellular UGT1A1 Activity
The percentage of transduced cells does not indicate functional activity of the transgene product. To assess the acquired UGT1A1 activity of cells after transduction with AAV8-hUGT1A1, we developed an in vitro bilirubin conjugation activity assay based on a previously described method.24 Seventy-two hours after transducing Huh7 cells with AAV8-hUGT1A1, cells were incubated with 10 μM UCB for 1, 4, or 24 h, and bilirubin conjugates in the medium were determined (Figure 2A). The concentration of formed conjugated bilirubin (CB) showed an excellent linear correlation to viral doses up to 3.8 × 10⁴ vg/cell (R2 = 0.99) after 4- and 24-h incubation. With a higher dose of 7.6 × 10⁴ vg/cell, the linearity decreases drastically with 24-h incubation (R2 = 0.94), whereas a moderate decrease is seen with 4 h of incubation (R2 = 0.96). This difference most likely is due to the instability of bilirubin-glucuronides. A shorter incubation time, 1 h, would reduce the potential loss of bilirubin-glucuronides, but the concentration of bilirubin conjugates formed and secreted into the medium was too low for reliable detection. This and the apparent saturation of the formation of CB seen after 24 h when using a vector dose >3.8 × 10⁴ vg/cell indicated that a 4-h incubation step with UCB is sufficient and provides the most reliable readout of UGT1A1 activity when using up to 3.8 × 10⁴ vg/seeded cell. Next, we assessed whether performing the assay 48 h after AAV transduction would be sufficient to detect UGT1A1 activity. Huh7 cells were transduced with AAV8-hUGT1A1 at a dose of 3.8 × 10⁴ vg/seeded cells. At 48 or 72 h after transduction, cells were incubated for 4 h with 10 μM UCB containing medium prior to determination of bilirubin conjugates. The concentration of bilirubin conjugates was lower 48 h after transduction compared with 72 h after transduction, but the amount of bilirubin conjugates produced was within the limits of detection of the assay, indicating that a period of 48 h after transduction was sufficient to reach a detectable level of UGT1A1 activity (Figure 2B).
Figure 2.

Assessment of UGT1A1 Activity, Measured as Bilirubin Conjugation by AAV8-hUGT1A1-Transduced Huh7 Cells
(A) Conjugated bilirubin (CB) concentration measured in medium after incubating Huh7 cells for 1, 4, or 24 h with 10 μM unconjugated bilirubin (UCB) at time point 72 h post-transduction. Linear regression analysis shows excellent R2 of 0.99 up to 3.8 × 10⁴ vg/seeded cell in both 4 and 24 h of incubation (solid lines). Linearity decreases with higher doses to poor R2 of 0.94 in 24-h incubation and a moderate R2 of 0.96 in 4-h incubation (dotted lines). (B) Comparison of conjugated bilirubin (CB) concentration in medium after 4-h incubation with 10 μM UCB at time point 48 or 72 h after transduction of Huh7 with 3.8 × 10⁴ vg/seeded cell.
To show the reproducibility of this assay, we tested the intra-day and inter-day precision. The precision was assessed by performing the bilirubin conjugation activity assay as three independent experiments on 1 day and calculating the CV% of the measurement of CB. The intra-day CV% for the highest vector dose (3.8 × 10⁴ vg/seeded cell) was 16.9% and comparable with the two lower doses used (Table 3). Subsequently, the inter-day precision was assessed by calculating the CV% for each vector dose in three independent experiments performed on different days. The inter-day CV% for the highest vector dose used (3.8 × 10⁴ vg/seeded cell) was 42.3%, which was much higher than for the two lower doses, 19.7% for 9.5 × 10³ vg/seeded cell and 25.6% for 1.9 × 10⁴ vg/seeded cell (Table 4). These data show that the bilirubin conjugation activity assay can be used to determine the transgene activity of AAV8-hUGT1A1 batches in vitro with high specificity, but that the precision of the assay is sufficient only in the low dose range.
Table 3.
Intra-day Precision of Intracellular UGT1A1 Activity Measurement after Transducing Huh7 Cells with AAV8-hUGT1A1
| AAV8-hUGT1A1 vg/Seeded Cell |
|||
|---|---|---|---|
| 9,500 |
19,000 |
38,000 |
|
| Experiment | |||
| 1 | 1.8 | 2.7 | 4.9 |
| 2 | 2.0 | 3.2 | 5.1 |
| 3 | 1.5 | 2.4 | 3.7 |
| Intra-day, mean | 1.8 | 2.8 | 4.5 |
| Intra-day, SD | 0.3 | 0.4 | 0.8 |
| Intra-day, %CV | 15.7% | 15.7% | 16.9% |
All virus concentrations were measured in triplicate. Mean transduction percentage, SD, and %CV were calculated.
Table 4.
Inter-day Precision of Intracellular UGT1A1 Activity Measurement after Transducing Huh7 Cells with AAV8-hUGT1A1
| AAV8-hUGT1A1 vg/Seeded Cell |
|||
|---|---|---|---|
| 9,500 | 19,000 | 38,000 | |
| Day 1 (n = 2) | 1.7 | 2.7 | 4.1 |
| Day 2 (n = 2) | 1.3 | 2.2 | 3.0 |
| Day 3 (n = 2) | 1.2 | 1.6 | 1.6 |
| Inter-day, mean | 1.4 | 2.2 | 2.9 |
| Inter-day, SD | 0.3 | 0.6 | 1.2 |
| Inter-day, %CV | 19.7% | 25.6% | 42.3% |
Samples were measured in duplicate on three different days. Mean in transduction percentage, SD, and %CV were calculated.
In Vitro Potency Assay Translates to In Vivo Efficacy
To validate whether the in vitro potency assay reliably translates to in vivo vector efficacy, we compared the in vitro data with the correction of serum bilirubin levels acquired in relevant animal models.
Adult Gunn rats received a single intravenous administration of previously described wild-type (WT; n = 6) or codon-optimized AAV8-hUGT1A1 vector variants (CO1, CO2; n = 5 each) at a dose of 5 × 10¹² (high dose) or 1.5 × 10¹² vg/kg (low dose) (Figures 3A and 3B).21 Both the WT and CO2 vectors resulted in a marked decrease in plasma total bilirubin levels up to 12 weeks after vector administration in the high dose group, whereas the CO1 vector did not result in a reduction of plasma total bilirubin (Figure 3A). No difference in vector genome copy number (VGCN) or mRNA expression was observed in liver tissue of animals treated with the high dose of the three vectors (Figures 3C and 3D), suggesting the lack of efficacy of CO1 is not caused by a poor transduction. The in vitro analysis of intra-cellular UGT1A1 expression (Figure 3E) and activity (Figure 3F) after transduction of Huh7 cells resembles the poor in vivo efficacy of CO1, while confirming a good potency of the two other vector batches. While the UGT1A1 expression after transduction with the CO1 construct is below the limit of detection, the results for WT and CO2 show a linear dose-response relation (R2 = 0.996 and 0.976, respectively). A similar dose-response relation for WT and CO2 was found after determination of UGT1A1 activity (R2 = 0.994 and 0.847, respectively). Although in vitro the potency of the WT is somewhat higher, the difference between both is too small to demonstrate a significant difference in efficacy in vivo. In all animals treated with the high dose, the correction of serum bilirubin is almost complete. To detect a difference in vivo, a sub-optimal dose was used and indeed resulted in a partial correction (Figure 3B). Due to the significant daily fluctuation in serum bilirubin in these animals and between animals, a large number of animals would be needed to confirm the difference in potency observed in vitro. Although at 2 and 12 weeks the correction in the animals treated with the WT construct seems a bit better, at no time point does the difference reach significance. These data show that the in vitro potency assay is suitable to differentiate between batches with a good potency and batches with a poor efficacy, but more batches need to be tested to define the in vitro potency release criteria.
Figure 3.

In Vivo Efficacy of AAV8-hUGT1A1 Vector Constructs Corresponds to Their In Vitro Potency
(A and B) Plasma total bilirubin levels in Gunn rats over time after a single intravenous (i.v.) administration of 5 × 10¹² (A) or 1.5 × 10¹² vg/kg (B) AAV8-hUGT1A1 vector with wild-type (WT) or codon-optimized sequence (CO1 or CO2). (C and D) Vector genome copy number (VGCN) per cell (C) and expression of mRNA (D) in livers of animals 12 weeks postinjection of 5 × 10¹² vg/kg AAV8-hUGT1A1. (E) Transduction potency was determined in vitro for all three batches (n = 3). (F) UGT1A1 activity potency was determined in vitro for all three batches (n = 3). Data in A, B, E, and F, represent mean +/- standard deviation (SD).
Eleven-day-old Ugt1a1−/− mice received a single intraperitoneal administration of a AAV8-hUGT1A1 vector that was either produced in HEK293 cells in adhesion (B1; n = 3) or in suspension (B2; n = 3) at a dose of 4.4 × 10¹¹ vg/kg and were compared with untreated animals (UNTRs; n = 4), as previously described.22 Both preparations of this vector resulted in a marked decrease in plasma total bilirubin levels 1 month after vector administration compared with the UNTRs (Figure 4A). No difference in efficacy between B1 and B2 was observed (89% versus 72%, respectively; p = 0.125, not significant [n.s.]). Again, the in vitro analysis of intra-cellular UGT1A1 expression (Figure 4B) and activity (Figure 4C) after transduction of Huh7 cells resembles the in vivo efficacy of B1 and B2. Both vector preparations show a linear dose-response relation with regard to UGT1A1 expression (R2 = 0.964 and 0.988, respectively) and UGT1A1 activity (R2 = 0.974 and 0.979, respectively).
Figure 4.

In Vivo Efficacy of Two Different Batches of a Single AAV8-hUGT1A1 Vector Construct Corresponds to In Vitro Potency Assay
(A) Decrease in plasma total bilirubin in Ugt1a1−/− mice 1 month after administration of the AAV8-hUGT1A1 vector produced by triple transfection of HEK293 cells grown in suspension (HEK-SUSP; gray, n = 3) or using a baculovirus-mediated production strategy (Bac; black, n = 3), compared with untreated animals (UNTRs; n = 4). Data represent the mean +/- standard deviation (SD). (B and C) Both the in vitro analysis of (B) UGT1A1 expression and (C) UGT1A1 activity reflect the potency of the three vector constructs in vivo.
Discussion
An increasing number of AAV-based gene therapy products is currently being translated to clinical applications, harboring the potential to cure rare genetic diseases. Assessment of vector potency remains a challenging aspect during gene therapy development, involving evaluation of transduction efficiency, transgene expression, and biological activity. A validated assay to determine vector potency is a crucial determinant of clinical-grade vector lot quality and vector release, and is required for marketing authorization. This study describes the development and validation of a quantitative in vitro potency assay for a recombinant AAV (rAAV) vector containing the UGT1A1 transgene, which is currently under clinical evaluation for the treatment of CN (ClinicalTrials.gov: NCT03466463).22
This AAV vector potency assay enables evaluation of transduction efficiency by quantifying transgene-positive cells using flow cytometry (Figure 1). Furthermore, biological activity of the target protein (UGT1A1) is quantified by a bilirubin conjugation assay using reverse-phase high-performance liquid chromatography (HPLC) (Figure 2). Both measurements show a linear dose-response relation, with excellent correlation coefficients. To further validate both quantitative assays, we assessed the intra-day and inter-day precision by calculating the CV% between experiments (Tables 1, 2, 3, and 4). We showed that both the intra- and inter-day CV% for the transduction efficiency assay were below the recommended flow cytometry acceptance criteria of 25%.25 These acceptance criteria have not formally been established for HPLC measurements, but we show that the precision of the intracellular UGT1A1 activity assay is adequate only in the low dose range. The results of this novel cell-based potency assay reliably translate to in vivo vector efficacy when we compared with the outcome with conventional in vivo potency measurement of various AAV8-hUGT1A1 vector batches in the relevant models of CN. We compared the efficacy of different expression cassette variants in Gunn rats (Figure 3), as well as different batches of a single expression cassette variant of the AAV8-hUGT1A1 vector in Ugt1A1−/− mice (Figure 4). Both the in vivo and in vitro potency assessments consistently and in concordance discriminate between high and low potency of different vectors and different batches of the same vector. These results support the use of this in vitro potency assay as an alternative for in vivo experiments, reducing the use of animals in accordance with EU directives (3 Rs principles for protection of animals used for scientific purposes), while markedly reducing assay time and costs compared with an in vivo assay. The quantitative assessment of transduction efficacy and biological activity of different production lots will help define the acceptance criteria for batch release, and it could also be used to demonstrate batch consistency and stability after periods of storage.
The described potency assay does have a few limitations that will need to be addressed. When determining the percentage of UGT1-positive cells by flow cytometry, the histograms of parental and transduced Huh7 cells largely overlap (Figure 1C). Due to this, the analysis relies on an arbitrary cutoff at the point where almost no (<0.5%) untransduced cells lie within the UGT1-positive population. When using this strategy, the percentage of UGT1-positive cells may be underestimated. Although we could not detect endogenous UGT1 expression in Huh7 by western blot, we cannot exclude that trace amounts of endogenous UGT1 cause the background in the untransduced parental cell line. Another explanation could be an incomplete washout of the antibodies used. In an attempt to reduce the overlap of the histograms, we lowered antibody concentrations and tested direct staining with Alexa Fluor 488 (AF488)-labeled UGT1 antibody, but an overlap between histograms remained present (data not shown).
In pursuit to comply with all Good Manufacturing Practice (GMP) requirements, it will be necessary to validate all materials and equipment used in novel assays.26 Because there is no alternative for the in-house-made UGT1 antibody (clone WP1) used in the current assay, it needs to be validated according to GMP guidelines in the near future.27 Further validation of the antibody must include stability studies with periodic retesting. In addition, an appropriately qualified reference standard is a prerequisite for measuring vector potency.26 However, unlike traditional drugs, gene therapy products are not available in large quantities during preclinical development; therefore, “qualified” reference standards for vector batch potency testing are difficult to establish. Thus, it is important to factor these requirements into the development of a validation plan for potency assays used for vector lot release and stability.
In summary, the development of an in vitro potency assay for AAV8-hUGT1A1 enables quantification of transgenic UGT1A1 expression and biological activity, which is consistent with in vivo efficacy. This novel approach to verify AAV vector potency can be used to select the optimal vector during development and compare clinical-grade vector lot quality. Although the described potency assay is specific for the biological properties of the AAV8-hUGT1A1 vector, the assay development and validation provide a model of methodology that can be exemplary for many of the gene therapy products that are currently under development.
Materials and Methods
Production and Characterization of AAV Vectors
For the validation of the potency assay, we used a previously characterized AAV8-hUGT1A1 vector containing a transgene expression cassette with a translationally optimized cDNA sequence encoding for human UGT1A1 (v1).21 Unless specified otherwise, this vector was produced using the adenovirus-free transient transfection method in adherent human embryonic kidney cells (HEK293T) as previously described.21 To assess whether the potency assay reliably translates to in vivo vector efficacy, we performed experiments in Gunn rats using three different vector constructs, including the WT sequence and two codon-optimized UGT1A1 cDNA sequences (CO1 and CO2). Additionally, experiments in Ugt1a1−/− mice were performed using two different production batches of the optimized AAV8-hUGT1A1 v1 construct. One batch was produced by triple transfection of HEK293 cells grown in suspension (HEK-SUSP),22 and the other batch by using a baculovirus-mediated production strategy (Bac).28
Generation of a UGT1A1-Overexpressing Cell Line
LV-PGK-UGT1A1, a third-generation lentiviral vector in which the PGK promoter is driving expression of the UGT1A1 cDNA, was produced as described previously.29 HEK293 cells were transduced to express UGT1A1 as described previously.30
AAV Transduction In Vitro
Huh7 cells were grown in Dulbecco’s modified Eagle’s media (DMEM) supplemented with 10% fetal calf serum (FCS), 2 mM L-glutamine, and 100 U/mL penicillin/streptomycin (all from Lonza, Allendale, NJ, USA), at 37°C in 5% CO2 atmosphere. Huh7 cells were seeded into six-well plates at a density of 1.3 × 10⁵ cells/well in 2 mL culture medium and allowed to adhere for 24 h. After 24 h, cells were transduced with increasing doses (9,500–57,000 vg/seeded cell) of AAV8-hUGT1A1 vector, in a total volume of 1 mL FCS-free DMEM with 2 mM L-glutamine and 100 U/mL penicillin/streptomycin. After 4 h, 1 mL DMEM with 10% FCS was added, and 48 h thereafter expression of the transgene was determined.
UGT1A1 Detection
AAV8-hUGT1A1-transduced cells were washed once with ice-cold PBS and incubated at 4°C with permeabilization buffer (PBS with 50 μg/mL digitonin [Sigma-Aldrich, St. Louis, MO, USA] and protease inhibitor cocktail [Roche, Mannheim, Germany]) while shaking gently. After 20 min, permeabilized cells were washed with 1 mL PBS (4°C) + protease inhibitors, and membranes were lysed by adding 150 μL radioimmunoprecipitation assay (RIPA) buffer (150 mM sodium chloride, 1% [w/v] Triton X-100, 0.5% [w/v] sodium deoxycholate, 0.1% [w/v] sodium dodecyl sulfate (SDS), 20 mM Tris-hydrochloride [pH 8.0] with protease inhibitor cocktail) per well. 50 μg of total membrane proteins, as determined by bicinchoninic acid (BCA) assay, was incubated at 95°C for 5 min, run on a 10% bis-tris polyacrylamide gel, transferred to a polyvinylidene fluoride (PVDF) membrane by semi-dry western blotting, and incubated overnight (O.N.) with blocking buffer (5% milk powder [Protifar; Nutricia], in TBST (0.05% Tween 20 in Tris-buffered saline)). Detection of UGT1A1 was performed using a monoclonal anti-human UGT1 antibody clone WP123 (1:700 in TBST). A horseradish peroxidase (HRP)-conjugated secondary antibody (Bio-Rad, Hercules, CA, USA) and LumiLight Plus chemiluminescence reagent (Roche, Mannheim, Germany) were used for visualization. Purified human recombinant UGT1A1 (Bio Connect) was used to confirm specificity.
Transduction Efficiency
Transduction efficiency was determined by intracellular flow cytometric detection of UGT1A1 expression.29,31 Huh7 cells were grown and transduced as described and harvested after 48 h using trypsin. Upon adding DMEM with 10% FCS, the cells were spun down at 800 × g and re-suspended in ice-cold PBS containing 10% FCS, spun down again and re-suspended in 300 μL ice-cold PBS containing 0.25% paraformaldehyde (PFA), and incubated for 30 min at 0°C for fixation. To permeabilize the cells, we added 100 μL of 0.8% Tween 20 in PBS, and the cells were incubated at 37°C for 15 min and washed once in 1 mL ice-cold wash buffer [3% BSA/0.2%Tween/PBS]. After washing, the cells were re-suspended in ice-cold buffer with monoclonal anti-UGT1 antibody (clone WP1) (1:1,000) and incubated for 30 min at 4°C. After two washing steps using 1 mL ice-cold wash buffer, the cells were re-suspended in 0.5 mL of wash buffer with AF488 goat anti-mouse IgG (1:2,000; Thermo Fisher Scientific, Waltham, MA, USA) and incubated for 30 min at 4°C. After two washing steps, the cells were resuspended in 250 μL fluorescence-activated cell sorting (FACS) buffer (0.5% BSA, 0.01% NaN3, 0.3 mM EDTA in PBS), measured on an LSR Fortessa instrument (Becton Dickinson, Erembodegem, Belgium), and analyzed using FlowJo software (Tree Star, Ashland, OR, USA). A single-cell Huh7 population was selected based on SSC/FSC plots, and the UGT1A1 gate was set with a background of ∼0.5% of AF488+ cells in stained un-transduced control cells.
Intracellular UGT1A1 Activity
Intracellular UGT1A1 activity was determined by quantifying bilirubin conjugates produced by Huh7 cells at 48 or 72 h after transduction with different batches of AAV8-hUGT1A1, based on a previously described detection method.24 UCB (#B4126; Sigma-Aldrich, St. Louis, MO, USA) was dissolved in 1 vol 50 mM NaOH (freshly prepared) and buffered with 3 vol 100 mM Tris/HCl (pH 7.8), resulting in a neutralized 1 mM UCB stock solution. This stock was instantaneously diluted in phenol red-free DMEM supplemented with 1% 200 mM L-glutamine, 1% penicillin/streptomycin, and 5% FCS to a final concentration of 10 μM. Medium was replaced by 0.6 mL of the freshly prepared UCB-containing medium and incubated at 37°C, 5% CO2. At different times (2, 4, or 24 h), medium was collected, snap-frozen in liquid nitrogen, and protected from light for later analysis. Bilirubin metabolites (bilirubin mono-glucuronide [BMG] and [bilirubin di-glucuronide (BDG]) were quantified using a reverse-phase HPLC-based method described by Spivak and Carey.32 In brief, samples were de-proteinized by addition of 2 vol of methanol followed by centrifugation at full speed for 2 min at 4°C, and 100 μL of supernatant was analyzed within 2 h after thawing on an HPLC column (reverse-phase Pursuit C18 column, 100 × 3.0 mm, 5-μm particle size; Agilent Technologies). The mobile phase consists of 1% acetic acid in MilliQ with ammonia solution 25% (Merck, Darmstadt, Germany) (pH 4.5) (A) and 100% methanol (Merck, Darmstadt, Germany) (B). The slope gradient was defined as follows: 50% B to 100% B in 20 min. The eluate was detected at a wavelength of 450 nm. Quantification of bilirubin glucuronides was performed by calculating the areas under the curves and interpolating these data into a UCB standard curve. To get a single outcome measure for UGT1A1 activity, we calculated glucuronides conjugated to bilirubin (CB) by the formula CB (μM) = 1 × BMG (μM) + 2 × BDG (μM). Percentage of CB over total bilirubin (CB/[CB+UCB]) was calculated to correct for input.
Animal Study Procedures
UGT1A1-deficient rats (Gunn rats, strain RHA j/j) from the Amsterdam UMC breeding colony had ad libitum access to food and water and were randomly assigned to receive a single intravenous administration of WT (n = 6) or codon-optimized AAV8-hUGT1A1 vector variants (CO1, CO2, n = 5 each) at a dose of 5 × 10¹² vg/kg, as previously described.21
Eleven-day-old Ugt1a1−/− mice from the breeding colony at the ICGEB institute in Trieste had ad libitum access to food and water, were randomly assigned to receive a single intraperitoneal administration of a AAV8-hUGT1A1 vector that was either produced in HEK293 cells in adhesion (B1; n = 3) or in suspension (B2; n = 3) at a dose of 4.4 × 10¹¹ vg/kg, and were compared with UNTRs (n = 4), as previously described.21,22
Periodic blood sampling was performed by puncture of the tail vein (rats) and collected in lithium heparin tubes, after which plasma was separated by centrifugation. At the time of sacrifice, blood was collected by heart puncture of both mice and rats, and collected in lithium heparin tubes. Plasma total bilirubin was determined by routine clinical biochemistry testing on a Roche Cobas c502/702 analyzer (Roche Diagnostics, USA). All animal procedures were performed according to the European Directive 2010/63/EU and with approval of the Institutional Animal Care and Use Committee of the Amsterdam or the International Centre for Genetic Engineering and Biotechnology board.
Vector Genome and mRNA Detection in Liver Homogenates
Genomic DNA was isolated as previously described19 from at least three random pieces of rat liver. Tissues were lysed O.N. at 55°C in 0.2% SDS, 5 mM EDTA, 200 mM NaCl, 100 mM Tris (pH 8.5) lysis buffer, with freshly added 100 μg/mL Proteinase K (Roche, Mannheim, Germany). DNA was precipitated with 2-propanol, washed once in 70% ethanol, and dissolved in Tris-EDTA (TE) buffer.
Total cellular RNA was isolated from at least three random pieces of rat liver, using TRI Reagent (Sigma-Aldrich, St. Louis, MO, USA) according to the manufacturer’s instructions. 1 μg of total RNA was treated with DNase I (Promega, Madison, WI, USA) according to the manufacturer’s instructions, and cDNA was synthesized using oligo dT primers, random hexamer primers, Ribolock RNase inhibitors, and RevertAid transcriptase (RT) (Thermo Fisher Scientific, Waltham, MA, USA). The same mixture, but without RT enzyme (−RT), was used on four samples to test as a negative control.
100 ng gDNA or 2 μL of 5× diluted cDNA was used as a template for qPCR, using the SensiFAST SYBR No-ROX kit (GC-Biotech) in a Roche LightCycler 480 II real-time PCR machine. The primers used for amplification are listed in Table S1. Vector genome copy number (VGCN) per cell was calculated using the ratio of the hAAT promoter present in all vector constructs over β-actin copies detected. Exact transgene expression (mRNA) was determined using a plasmid DNA standard curve for each UGT1A1 variant and was normalized to β-actin expression.
Statistical Analysis
Data are presented as mean values ± standard deviation (SD) and were analyzed for significance using an independent two-sided t test for the comparison of parametric variables between two groups, unless stated otherwise. For the comparison of three or more groups, a one-way analysis of variance (ANOVA) was performed. For nonparametric variables, we performed a Mann-Whitney test. To express the precision or repeatability, we calculated an assay CV as the ratio of the SD to the mean and expressed in % (SD/mean × 100). For statistical analysis, we used GraphPad Prism 7 software (GraphPad Software, CA, USA). ∗p < 0.05, ∗∗p < 0.01, and ∗∗∗p < 0.001 were considered significant.
Author Contributions
Study Design, S.J.A., R.S.B., and P.J.B.; Data Collection, Analysis, and Interpretation, S.J.A., R.S.B., S.M., R.v.D., G.B., F.C., X.S., S.D., L.t.B., and G.R.; Manuscript Preparation, S.J.A., R.S.B., S.M., and P.J.B.; Critical Appraisal and Manuscript Review and Editing, P.J.B., F.M., U.B., and A.F.M.; Funding Acquisition, P.J.B. and F.M.
Conflicts of Interest
F.C., G.B., G.R., A.F.M., and F.M. are inventors in patents describing liver gene transfer approaches for metabolic diseases and/or treatment of hyperbilirubinemia. F.M. is an employee of Spark Therapeutics, a Roche company. None of the other authors have any conflicts of financial interest to disclose with regard to this work, other than mentioned in the financial support statement.
Acknowledgments
CureCN has received funding from the European Union’s Horizon 2020 research and innovation program under grant agreement no. 755225. This work has been supported by a grant from ZonMw The Netherlands (Translational Gene therapy Research TGO 43300003 to P.J.B.).
Footnotes
Supplemental Information can be found online at https://doi.org/10.1016/j.omtm.2020.06.002.
Supplemental Information
References
- 1.Maguire A.M., Simonelli F., Pierce E.A., Pugh E.N., Jr., Mingozzi F., Bennicelli J., Banfi S., Marshall K.A., Testa F., Surace E.M. Safety and efficacy of gene transfer for Leber’s congenital amaurosis. N. Engl. J. Med. 2008;358:2240–2248. doi: 10.1056/NEJMoa0802315. [DOI] [PMC free article] [PubMed] [Google Scholar]
- 2.Bainbridge J.W., Smith A.J., Barker S.S., Robbie S., Henderson R., Balaggan K., Viswanathan A., Holder G.E., Stockman A., Tyler N. Effect of gene therapy on visual function in Leber’s congenital amaurosis. N. Engl. J. Med. 2008;358:2231–2239. doi: 10.1056/NEJMoa0802268. [DOI] [PubMed] [Google Scholar]
- 3.Nathwani A.C., Rosales C., McIntosh J., Rastegarlari G., Nathwani D., Raj D., Nawathe S., Waddington S.N., Bronson R., Jackson S. Long-term safety and efficacy following systemic administration of a self-complementary AAV vector encoding human FIX pseudotyped with serotype 5 and 8 capsid proteins. Mol. Ther. 2011;19:876–885. doi: 10.1038/mt.2010.274. [DOI] [PMC free article] [PubMed] [Google Scholar]
- 4.Nathwani A.C., Reiss U.M., Tuddenham E.G., Rosales C., Chowdary P., McIntosh J., Della Peruta M., Lheriteau E., Patel N., Raj D. Long-term safety and efficacy of factor IX gene therapy in hemophilia B. N. Engl. J. Med. 2014;371:1994–2004. doi: 10.1056/NEJMoa1407309. [DOI] [PMC free article] [PubMed] [Google Scholar]
- 5.George L.A., Sullivan S.K., Giermasz A., Rasko J.E.J., Samelson-Jones B.J., Ducore J., Cuker A., Sullivan L.M., Majumdar S., Teitel J. Hemophilia B Gene Therapy with a High-Specific-Activity Factor IX Variant. N. Engl. J. Med. 2017;377:2215–2227. doi: 10.1056/NEJMoa1708538. [DOI] [PMC free article] [PubMed] [Google Scholar]
- 6.Rangarajan S., Walsh L., Lester W., Perry D., Madan B., Laffan M., Yu H., Vettermann C., Pierce G.F., Wong W.Y., Pasi K.J. AAV5-Factor VIII Gene Transfer in Severe Hemophilia A. N. Engl. J. Med. 2017;377:2519–2530. doi: 10.1056/NEJMoa1708483. [DOI] [PubMed] [Google Scholar]
- 7.Mendell J.R., Al-Zaidy S., Shell R., Arnold W.D., Rodino-Klapac L.R., Prior T.W., Lowes L., Alfano L., Berry K., Church K. Single-Dose Gene-Replacement Therapy for Spinal Muscular Atrophy. N. Engl. J. Med. 2017;377:1713–1722. doi: 10.1056/NEJMoa1706198. [DOI] [PubMed] [Google Scholar]
- 8.Miesbach W., Meijer K., Coppens M., Kampmann P., Klamroth R., Schutgens R., Tangelder M., Castaman G., Schwäble J., Bonig H. Gene therapy with adeno-associated virus vector 5-human factor IX in adults with hemophilia B. Blood. 2018;131:1022–1031. doi: 10.1182/blood-2017-09-804419. [DOI] [PMC free article] [PubMed] [Google Scholar]
- 9.Detela G., Lodge A. Manufacturing process development of ATMPs within a regulatory framework for EU clinical trial & marketing authorisation applications. Cell Gene Ther. Insights. 2016;2:425–452. [Google Scholar]
- 10.European Medicines Agency . 2019. Guideline on quality, non-clinical and clinical requirements for investigational advanced therapy medicinal products in clinical trials. January 31, 2019, EMA/CAT/852602/2018.https://www.royanatmp.com/pdf/guideline-quality-non-clinical-requirements-investigational-advanced-therapy_en.pdf [Google Scholar]
- 11.Crigler J.F., Jr., Najjar V.A. Congenital familial nonhemolytic jaundice with kernicterus. Pediatrics. 1952;10:169–180. [PubMed] [Google Scholar]
- 12.Bosma P.J., Seppen J., Goldhoorn B., Bakker C., Oude Elferink R.P., Chowdhury J.R., Chowdhury N.R., Jansen P.L. Bilirubin UDP-glucuronosyltransferase 1 is the only relevant bilirubin glucuronidating isoform in man. J. Biol. Chem. 1994;269:17960–17964. [PubMed] [Google Scholar]
- 13.Watchko J.F., Tiribelli C. Bilirubin-induced neurologic damage—mechanisms and management approaches. N. Engl. J. Med. 2013;369:2021–2030. doi: 10.1056/NEJMra1308124. [DOI] [PubMed] [Google Scholar]
- 14.Strauss K.A., Robinson D.L., Vreman H.J., Puffenberger E.G., Hart G., Morton D.H. Management of hyperbilirubinemia and prevention of kernicterus in 20 patients with Crigler-Najjar disease. Eur. J. Pediatr. 2006;165:306–319. doi: 10.1007/s00431-005-0055-2. [DOI] [PubMed] [Google Scholar]
- 15.Maisels M.J., McDonagh A.F. Phototherapy for neonatal jaundice. N. Engl. J. Med. 2008;358:920–928. doi: 10.1056/NEJMct0708376. [DOI] [PubMed] [Google Scholar]
- 16.van der Veere C.N., Sinaasappel M., McDonagh A.F., Rosenthal P., Labrune P., Odièvre M., Fevery J., Otte J.B., McClean P., Bürk G. Current therapy for Crigler-Najjar syndrome type 1: report of a world registry. Hepatology. 1996;24:311–315. doi: 10.1002/hep.510240205. [DOI] [PubMed] [Google Scholar]
- 17.Fox I.J., Chowdhury J.R., Kaufman S.S., Goertzen T.C., Chowdhury N.R., Warkentin P.I., Dorko K., Sauter B.V., Strom S.C. Treatment of the Crigler-Najjar syndrome type I with hepatocyte transplantation. N. Engl. J. Med. 1998;338:1422–1426. doi: 10.1056/NEJM199805143382004. [DOI] [PubMed] [Google Scholar]
- 18.Seppen J., Bakker C., de Jong B., Kunne C., van den Oever K., Vandenberghe K., de Waart R., Twisk J., Bosma P. Adeno-associated virus vector serotypes mediate sustained correction of bilirubin UDP glucuronosyltransferase deficiency in rats. Mol. Ther. 2006;13:1085–1092. doi: 10.1016/j.ymthe.2006.01.014. [DOI] [PubMed] [Google Scholar]
- 19.Montenegro-Miranda P.S., Pichard V., Aubert D., Ten Bloemendaal L., Duijst S., de Waart D.R., Ferry N., Bosma P.J. In the rat liver, Adenoviral gene transfer efficiency is comparable to AAV. Gene Ther. 2014;21:168–174. doi: 10.1038/gt.2013.69. [DOI] [PubMed] [Google Scholar]
- 20.Bortolussi G., Zentillin L., Vaníkova J., Bockor L., Bellarosa C., Mancarella A., Vianello E., Tiribelli C., Giacca M., Vitek L., Muro A.F. Life-long correction of hyperbilirubinemia with a neonatal liver-specific AAV-mediated gene transfer in a lethal mouse model of Crigler-Najjar Syndrome. Hum. Gene Ther. 2014;25:844–855. doi: 10.1089/hum.2013.233. [DOI] [PMC free article] [PubMed] [Google Scholar]
- 21.Ronzitti G., Bortolussi G., van Dijk R., Collaud F., Charles S., Leborgne C., Vidal P., Martin S., Gjata B., Sola M.S. A translationally optimized AAV-UGT1A1 vector drives safe and long-lasting correction of Crigler-Najjar syndrome. Mol. Ther. Methods Clin. Dev. 2016;3:16049. doi: 10.1038/mtm.2016.49. [DOI] [PMC free article] [PubMed] [Google Scholar]
- 22.Collaud F., Bortolussi G., Guianvarc’h L., Aronson S.J., Bordet T., Veron P., Charles S., Vidal P., Sola M.S., Rundwasser S. Preclinical Development of an AAV8-hUGT1A1 Vector for the Treatment of Crigler-Najjar Syndrome. Mol. Ther. Methods Clin. Dev. 2018;12:157–174. doi: 10.1016/j.omtm.2018.12.011. [DOI] [PMC free article] [PubMed] [Google Scholar]
- 23.Peters W.H., Allebes W.A., Jansen P.L., Poels L.G., Capel P.J. Characterization and tissue specificity of a monoclonal antibody against human uridine 5′-diphosphate-glucuronosyltransferase. Gastroenterology. 1987;93:162–169. doi: 10.1016/0016-5085(87)90329-5. [DOI] [PubMed] [Google Scholar]
- 24.Seppen J., Tada K., Hellwig S., Bakker C.T., Prasad V.R., Roy Chowdhury N., Roy Chowdhury J., Bosma P.J., Oude Elferink R.P. Bilirubin glucuronidation by intact Gunn rat fibroblasts expressing bilirubin UDP-glucuronosyltransferase. Biochem. J. 1996;314:477–483. doi: 10.1042/bj3140477. [DOI] [PMC free article] [PubMed] [Google Scholar]
- 25.O’Hara D.M., Xu Y., Liang Z., Reddy M.P., Wu D.Y., Litwin V. Recommendations for the validation of flow cytometric testing during drug development: II assays. J. Immunol. Methods. 2011;363:120–134. doi: 10.1016/j.jim.2010.09.036. [DOI] [PubMed] [Google Scholar]
- 26.European Medicines Agency . 2018. Guideline on the quality, non-clinical and clinical aspects of gene therapy medicinal products. March 22, 2018, EMA/CAT/80183/2014.https://www.ema.europa.eu/en/quality-preclinical-clinical-aspects-gene-therapy-medicinal-products#current-effective-version-section j [Google Scholar]
- 27.Bordeaux J., Welsh A., Agarwal S., Killiam E., Baquero M., Hanna J., Anagnostou V., Rimm D. Antibody validation. Biotechniques. 2010;48:197–209. doi: 10.2144/000113382. [DOI] [PMC free article] [PubMed] [Google Scholar]
- 28.Ayuso E., Mingozzi F., Bosch F. Production, purification and characterization of adeno-associated vectors. Curr. Gene Ther. 2010;10:423–436. doi: 10.2174/156652310793797685. [DOI] [PubMed] [Google Scholar]
- 29.Seppen J., van der Rijt R., Looije N., van Til N.P., Lamers W.H., Oude Elferink R.P. Long-term correction of bilirubin UDPglucuronyltransferase deficiency in rats by in utero lentiviral gene transfer. Mol. Ther. 2003;8:593–599. doi: 10.1016/s1525-0016(03)00234-x. [DOI] [PubMed] [Google Scholar]
- 30.van Dijk R., Aronson S.J., de Waart D.R., van de Graaf S.F., Duijst S., Seppen J., Elferink R.O., Beuers U., Bosma P.J. Biliverdin Reductase inhibitors did not improve severe unconjugated hyperbilirubinemia in vivo. Sci. Rep. 2017;7:1646. doi: 10.1038/s41598-017-01602-w. [DOI] [PMC free article] [PubMed] [Google Scholar]
- 31.Schmid I., Uittenbogaart C.H., Giorgi J.V. A gentle fixation and permeabilization method for combined cell surface and intracellular staining with improved precision in DNA quantification. Cytometry. 1991;12:279–285. doi: 10.1002/cyto.990120312. [DOI] [PubMed] [Google Scholar]
- 32.Spivak W., Carey M.C. Reverse-phase h.p.l.c. separation, quantification and preparation of bilirubin and its conjugates from native bile. Quantitative analysis of the intact tetrapyrroles based on h.p.l.c. of their ethyl anthranilate azo derivatives. Biochem. J. 1985;225:787–805. doi: 10.1042/bj2250787. [DOI] [PMC free article] [PubMed] [Google Scholar]
Associated Data
This section collects any data citations, data availability statements, or supplementary materials included in this article.