Abstract
Background
Tracheal adenoid cystic carcinoma (TACC) is the second most common type of cancer in bronchial tumors with poor prognosis. Studies on the genomic profiles and tumor immune microenvironment (TIME) of TACC are still relatively rare.
Methods
Here, we performed whole-exome sequencing (WES), T cell repertoire (TCR) sequencing, and immunohistochemistry (IHC) on the resected tumors and matched peripheral blood leukocytes (PBLs) samples from 25 TACCs collected from April-2010 to Mar-2019.
Results
WES results revealed that LPAR3 and ALPI were recurrently mutated genes, with no classical lung cancer drivers in TACCs (n=8). The median tumor mutation burden (TMB) was 3.67, lower than other solid tumors. Unexpectedly, one patient showed high microsatellite instability (MSI). Recurrent copy number variations (CNVs) affected genes commonly involved in p53, cell cycle, and PI3K-Akt signaling pathways. For TCR estimators of 13 PBLs, the median clonality and Shannon index was 0.15 and 7.02, respectively. Shannon index showed marginally negative association with age (Pearson r =−0.53, P=0.062). Clonotype number and Shannon index of 7 TACC tissues were significantly lower than those of lung adenocarcinoma (LUAD) and lung squamous cell carcinoma (LUSC) (Mann-Whitney test, both P<0.001, both P<0.001). Furthermore, programmed cell death 1 ligand 1 (PD-L1), a vital player in TIME, was negative (tumor proportion score, TPS <1%) in all samples (n=14). Patients with less clonotypes had longer progression-free survival (PFS) than those with more PFS (15.0 vs. 9.5 months, P<0.001, HR 12.5, 95% CI: 0.2–675.7). In particular, the clinical and molecular characteristics of one TACC patient receiving immunotherapy have been explained in detail.
Conclusions
In summary, despite the existence of one patient with MSI-H and chromosome instability, TACC was characterized by a lack of common drivers of lung cancer, negative PD-L1 expression, and low CD3+ and CD8+ T cell infiltration.
Keywords: Tracheal adenoid cystic carcinoma (TACC), whole-exome sequencing (WES), T cell receptor, PD-L1, CD8+ T cell, immune checkpoint inhibitors
Introduction
Tracheal adenoid cystic carcinoma (TACC) originates from the tracheal mucinous epithelium, accounting for about 15% of primary tracheal tumors (1). TACCs can occur at any age with the similar prevalence in males and females (1:1.1) during life. Non-epidemiological relations to smoking have been reported (2). TACCs have an insidious onset and high early misdiagnosis rate (3). There are challenges in the diagnosis and treatment of TACC. The symptoms of TACC include cough, chest tightness, asthma, and dyspnea. These are so non-specific that patients are often misdiagnosed as asthma and chronic bronchitis in the early stage. Thus, the diagnosis of TACCs requires biopsy under tracheoscope and pathological examination of multiple protein biomarkers including SMA, P63, p53, ki-67, and CD117 (4). It takes as long as 20 months or a year for the patient to be diagnosed with TACC since the initial symptoms (5). Moreover, malignant tumours are often developed rapidly, thus, tumor was locally advanced stage when the patients were diagnosed. Therefore, the founding of novel biomarkers may improve the diagnosis for TACC.
Surgical resection and radiotherapy are currently the first-line therapies for TACC. Approximately 90% of patients with early-stage TACC undergo resection survived for 5 years (6). However, owing to the characteristics of occult invasion of surrounding collagen fibers or vascular nerve bundles and enveloping extension for invasive diffusion, the inevitable of incomplete movement of the lesion leads to high-rate recurrence (7). Due to the sensitivity to radiation, radiotherapy is the first-line choice for TACCs patients without radical resection and with postoperative recurrence (8-10). Several studies (11) have shown that TACCs had an inadequate response to chemotherapy compared to other pulmonary tumors. Researchers (12) have found that EGFR, KRAS, BRAF, ALK, PIK3CA, PDGFRA, and DDR2 may not be driver genes in Asian primary TACC using a seven gene panel. Recently, a study of large ACC cohort revealed that significantly mutated genes were involved NOTCH pathway (13). Despite the comprehensive usage of targeted-therapy and immunotherapy in lung cancers, trials of targeted therapy to date have not yet identified an agent with sufficient activity to be deemed standard in the treatment of advanced ACC (14-17). Thus, more comprehensively genomic profiles and tumor immune microenvironment (TIME) of TACC are needed.
Here, we collected tumors and matched peripheral blood leukocytes (PBLs), and performed the comprehensive analysis of genomic profiles, tumor mutation burden (TMB) status, microsatellite instability (MSI) status, PD-L1 expression, CD3 and CD8 infiltration, and TCR repertoire to characterize the potential targets and immune-related biomarkers for TACC.
We present the following article in accordance with the STROBE reporting checklist (available at http://dx.doi.org/10.21037/atm-20-3433).
Methods
We enrolled 25 TACCs identified by IHC in the at the First Affiliated Hospital of Guangzhou Medical University from April-2010 to Mar-2019, All sections were stained with hemagglutinin-eosin according to the World Health Organization criteria for PACC and observed by two experienced pathologists. The patients had received surgery, and the untreated surgical specimens were collected for analysis. The status of disease progression and survival was followed up until Jan-2020. The clinical features, treatment process, and survival data were shown in Tables S1-S3. Whole-exome sequencing (WES) and TCR sequencing on tumors and matched PBLs were performed. TMB was showing the number of SNV and insertions and deletions (InDels) of the coding regions. The 22C3 antibody examined the PD-L1 expression level. Lung adenocarcinoma (LUAD) and lung squamous cell carcinoma (LUSC) somatic mutation data from TCGA and TCR data from the Geneplus database (Geneplus-Beijing, Beijing, China) were used for the comparison with TACC. The details of sequencing and statistical methods were shown in Supplementary file.
The study was conducted in accordance with the Declaration of Helsinki. The scientific, ethical Committee approved this study of the First Affiliated Hospital Guangzhou Medical University (ChiCTR-IPR-15006164). All patients supplied written informed consent.
Results
Clinical features of TACC
Eleven (44%) TACCs were males. The median age was 45 years (from 23 to 76 years). Current or ever, smokers (n=4) were all males. The period from the onset of symptoms to the diagnosis is with an average period of 17.5 (±14.3) months. The majority were in the main bronchus. All patients had no lymph node metastasis, but 2 had lung metastases (Table S1). Four types of resection treatments, including surgical, non-surgical, R0, and R1, were accepted. Median disease-free survival (mDFS) of 12 patients with R0 resection was 61.3±21.4 months, mDFS of 7 patients with R1 resection was 33.3±4.2 months, the difference was not statistically significant. The mPFS was 13.3±2.4 months for the six patients who chose non-surgical treatment in the first line (Table S2).
Genomic landscape of TACC
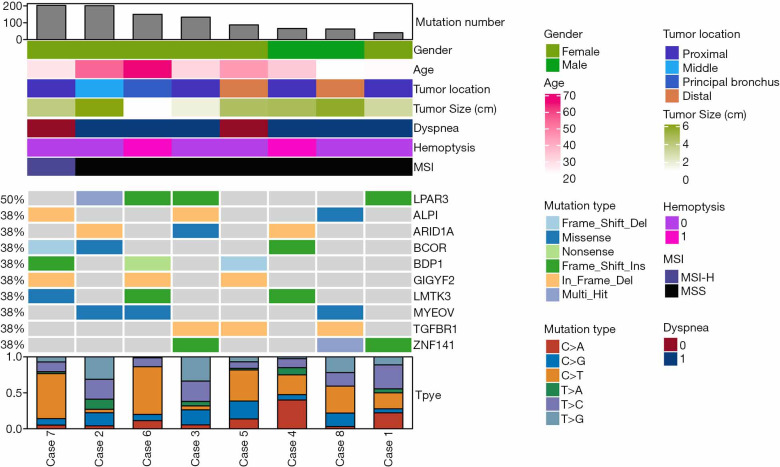
We successfully performed WES on eight tumors (all were stage I) with the median sequencing coverage of 211× (115 to 289). Nine hundred thirty-nine non-synonymous somatic mutations were found included 644 SNVs. and 295 InDels of 825 genes. The mutations were made up of missense (64.8%), frameshift (13.0%), and Indels (17.9%). LPAR3 (50%, 4/8), ALPI (38%, 3/8), ARID1A (38%, 3/8), and BCOR (38%, 3/8) were most often mutated genes (Figure 1). A median of 110 mutations (40 to 203) were detected, lower than LUSC (median 187 mutations, P=0.011), and equivalent to LUAD (median 158 mutations, P=0.240). Two (25%) TACCs were found as TMB-High (containing ≥200 mutations) (18), which both harbored the POLE mutation (19). Particularly, one case showed high microsatellite instability (MSI-H).
Figure 1.
The genomic landscape and clinical characteristics of TACC. TACC, tracheal adenoid cystic carcinoma.
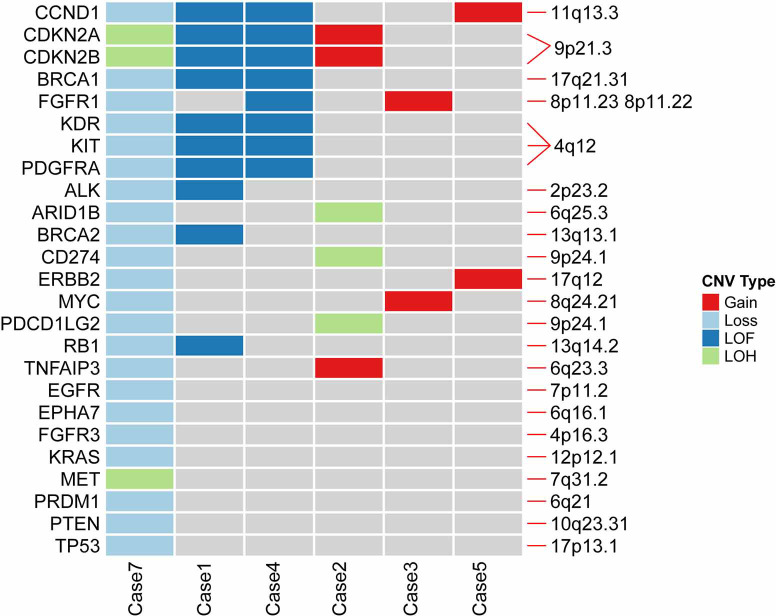
Focal CNVs aberration were detected in 75% (6/8) of TACCs. Recurrent copy gains and loss including 4q12, 9p21.3, 9p24.1 and 11q13.3 (Figure S1), affected CCND1, CDKN2A, CDKN2B, KDR, KIT, PDGFRA, CD274 (PD-L1), and PDCD1LG2 (PD-L2) genes involved in p53, cell cycle, and PI3K-Akt signaling pathways. Case 7 harbored the highest level of CNVs, containing copy number loss and loss of heterozygosity (LOH), followed by case 1 and case 4, all CNVs of these two patients detected were loss of function (LOF). Also, we identified the copy number loss of TP53, BRCA1, and BRCA2 genes, and some of them involved in DNA damage response pathways (DDR), which was a potential marker in immune checkpoint inhibitor.
We compared the most common genes across four cohorts with adenoid cystic carcinoma (ACC). We included TACC with ACC of salivary gland cancer (n=935), ACC of the lung (n=76), and adenoid cystic breast cancer (n=38) (13). When comparing the differentially mutated genes with other cohorts, eleven genes showed a discrepancy in frequency (Figure 2). For example, ARID1A and BCOR were more enriched (both 38%) in TACC than others; the CREBBP gene had the highest frequency in adenoid cystic breast cancer with percentiles of 18.9% (7/37) relative to others ACC types, followed by TACC (12.5%, 1/8). In contrast, the NOTCH1 gene, the most often mutated gene in all three ACC types, was not found in our cohort.
Figure 2.
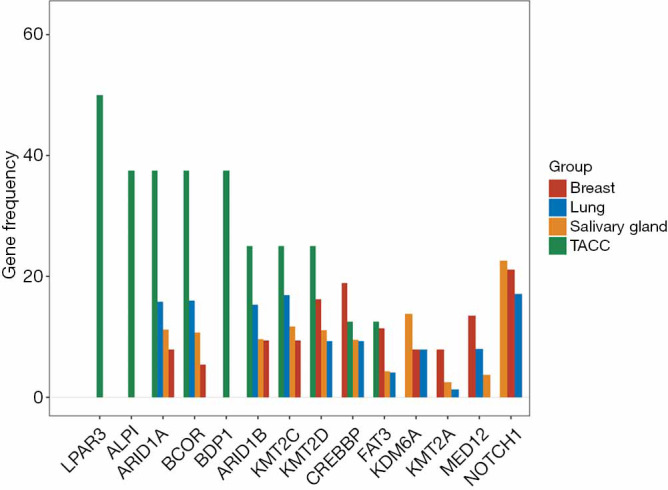
Gene frequency contribution in TACC cohort and ACC cohort. TACC, tracheal adenoid cystic carcinoma. ACC, adenoid cystic carcinoma.
The global profile of TCR repertoire
T cells are abundant component in tumor microenvironment and are key players in tumor immunology (20). To investigate the T cell receptor repertoire in tumor and peripheral blood, we successfully performed TCR sequencing on 7 FFPE and 13 PBL samples from 13 patients, excluding samples with low DNA quality (n=12 PBLs and n=18 FFPE). The diversity of the TCR repertoire was measured by the Shannon index (21) and CDR3 clonotypes (22,23). The clonality metric quantitates the degree of mono-clonal or oligo-clonal expansion by measuring the shape of the clone frequency distribution (24). The overlap level of TCR between PBL and the matched tumor was calculated using the sum of frequencies of unique TCR clones of tumor detected in PBL.
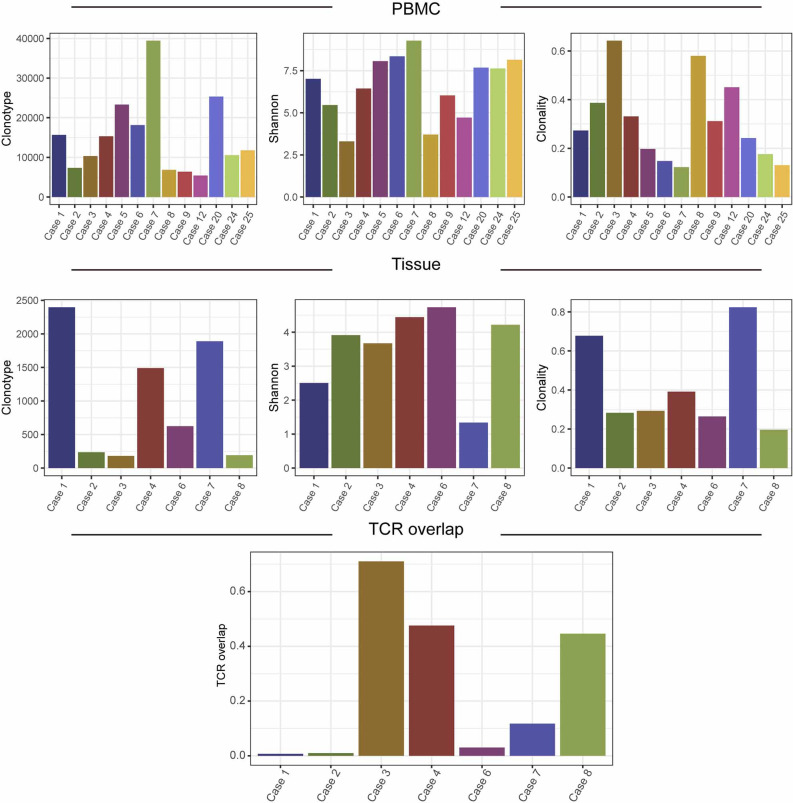
The median number of TCR clonotype was 624 (181 to 2,396) in tumors and 11,783 (5,429 to 39,439) in PBLs. The median Shannon index was 3.91 (1.33 to 4.73), and clonality was 0.29 (0.19 to 0.82) of tumors, while 7.02 (3.30 to 9.28) and 0.27 (0.12 to 0.64) of PBLs, respectively (Figure S2). The median overlap level of TCR between tissue and PBL was 0.12 (0.01 to 0.71) (Figure S2). These results showed the varied characteristics of TCR between PBL and tumors. When comparing TCR immune parameters of 7 TACC tissues with LUAD and LUSC, we found that clonotype number and clonality of TACCs were significantly lower than those of LUAD (P<0.001, P<0.001) and LUSC (P<0.001, P<0.001).
Associations between TCR repertoire and clinical characteristics and outcome
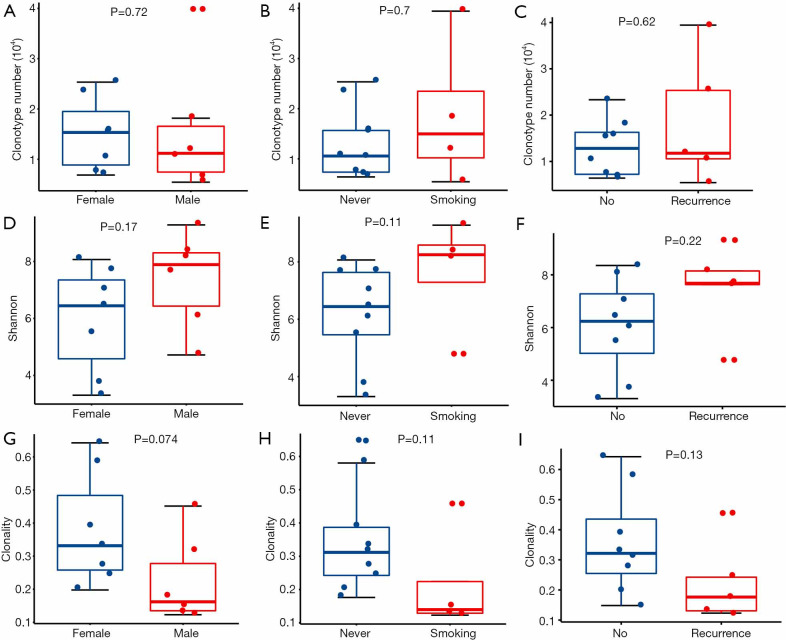
We evaluated the relationship between the clinical characteristics and Shannon’s entropy, clonality, and unique clones in 13 PBL samples. Clonotype number was not associated with age (Figure S3A). Shannon index showed marginally negative association with age (Pearson r=−0.53, P=0.062, Figure S3B), contrary to the adverse trend of clonality (Pearson r=0.53, P=0.062, Figure S3C). There was no significant association between TCR parameters with the other characteristics, including gender, smoking, and recurrence (Figure 3).
Figure 3.
The difference in TCR diversity in different clinical groups. Correlation between clonotype number and gender (A) or smoking history (B) or recurrence (C). Correlation between Shannon index and gender (D) or smoking history (E) or recurrence (F). Correlation between clonality and gender (G) or smoking history (H) or recurrence (I). Statistical analysis was performed using the Wilcoxon rank-sum test. TCR, T cell repertoire.
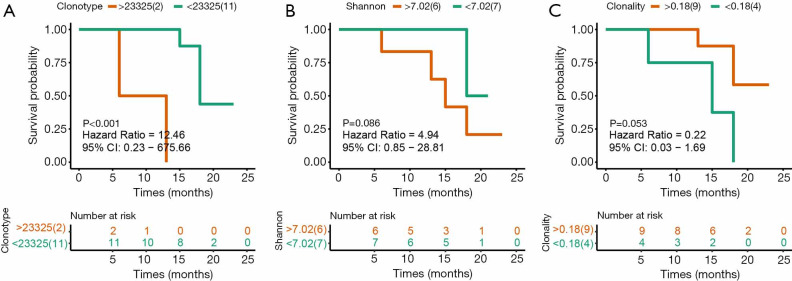
Next investigated the impact of TCR repertoire on the clinical outcome using Kaplan-Meier curves and the log-rank test. The “surv_cutpoint” function of the “survminer” R package was used to determine the optimal cutoff point for each TCR parameter based on the maximally selected log-rank statistics. Patients with lower clonotype numbers had longer PFS than those with higher PFS (Figure 4A, 15.0 vs. 9.5 months, P<0.001, HR 12.46, 95% CI: 0.23–675.66), while Shannon index and clonality was not significantly associated with PFS (Figure 4B,C).
Figure 4.
The association of patient’s progression-free survival (PFS) with TCR diversity in 13 patients. (A) PFS difference between patients with high and low clonotype numbers; (B) PFS difference between patients with high and low Shannon index; (C) PFS difference between patients with high and low clonality. P value was calculated with the use of the log-rank test.
CD3+ and CD8+ T cell infiltration and PD-L1 expression of TACC
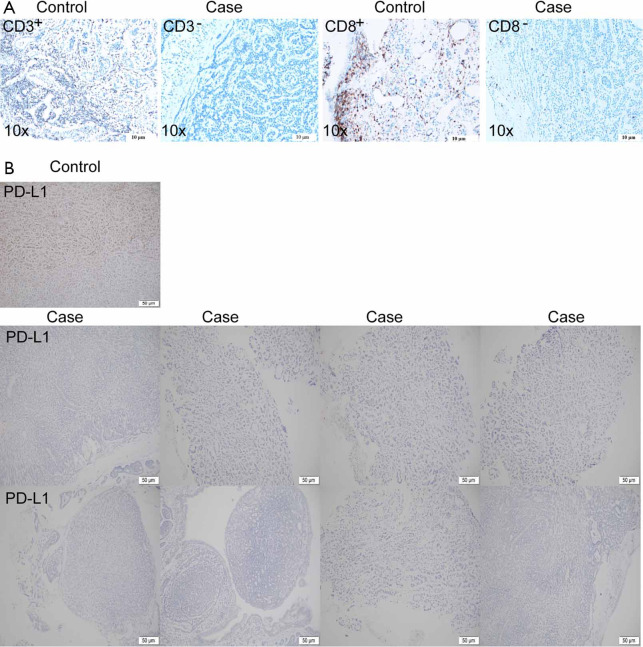
Due to the availability of specimens, we completed IHC on 14 patients of PD-L1 protein expression and seven patients of CD3+ and CD8+ TILs. All of 14 TACCs showed PD-L1 negative (TPS <1%). Two patients (case 4 and case 14) were CD3+ and CD8+ TILs positive (all showed 5%). Typical results were shown in Figure S4.
A case receiving ICIs
Case 7, a 23-year-old male smoker with stage I TACC in the distal trachea, had chosen tracheal endoscopic mass resection, followed by paclitaxel combined with platinum as postoperative chemotherapy. Unfortunately, local tumor recurrence was observed after six months. Subsequently, sindilizumab was given to this patient, and the disease still progressed after two cycles of immunotherapy. Many more details were shown in Table S3. Although PD-L1 expression together with CD3+ and CD8+ T cell infiltration was low (Figure S4A,4B), we identified high TMB (203 mutations) as well as various copy number loss in the tumor of this patient (Figures 1,S1).
Discussion
ACC is a rare malignancy occurring in multiple organs and most common in the salivary gland. In the trachea, it arises from the submucosal layer and has a rapid locoregional spread. ACC spreads most commonly by direct extension, submucosal, perineural invasion, or hematogenous metastasis (3), it is difficult to remove by surgery altogether, and there are many local recurrences. Currently, many studies focus on ACC of the salivary gland, but research on TACC is rare. Our study aims to elucidate genomics and T cell landscape and predict clinical biomarker for TACC.
The genomic profiles of the TACCs were different from other ACC origins. NOTCH1 mutation associated with activation of the Notch pathway in ACC of the trachea and a potential target for therapeutic intervention has been previously proved (25). Our study did not detect NOTCH1 mutations, while we detected Notch pathway-related genes, including CREBBP, NOTCH3, ADAM17, and PSEN1. Our findings provided a clue that the targeted therapies for NSCLC might not be suitable for TACC due to the different genomic profiles of TACC patients with those of NSCLC. In our study, LPAR3 and ALPI were frequently mutated genes in TACC. LPAR3 encodes lysophosphatidic acid receptor 3, a member of G-protein coupled receptor family. The LPAR3 gene was associated with tumor aggregation in several cancers including ovarian cancer (26), oral squamous cell carcinoma (27), and breast cancer (28). ALPI is a gene that expresses intestinal alkaline phosphatase, an intestinal cell differentiation marker. ALPI was a responsive indicator of histone deacetylase inhibitor (HDACi) in colon cancer cells (29). However, the function of these two genes in TACC needs further exploration.
We evaluated the TMB level and performed IHC to detect PD-L1 protein expression, CD3+, and CD8+ T cell infiltration in TACC. Although none was positive PD-L1 expression, two cases had a low level of CD3+ and CD8+ T cell infiltration. Besides, TMB-H and MSI-H TACC were found, which shed light on the ICI treatments for TACC. In our cohort, one patient (case 7) with TMB-H and MSI-H and extensive copy number loss (containing genes coding PD-L1 and PD-L2) in his primary tumor received PD-1 inhibitor. However, the earlier study reported that salivary type primary malignant tracheal tumors do not significantly express PD-L1 (30). Unfortunately, rapid disease progression occurred. We did not obtain a second biopsy of the immunotherapy baseline for this retrospective case. Therefore, we were unable to assess whether ICI resistance variants were generated in post-chemotherapy progressed lesion. Mainly, copy number variations (CNVs) has been linked with the outcome of immunotherapy. Thus, it is also necessary to investigate the role of CNVs in response to immunotherapy.
To our knowledge, no earlier study has systematically analyzed the genomic characteristics and clinical significance of the TCR repertoire in the peripheral blood of patients with TACC. Our study is the first analysis of the T cell repertoire in ACC using NGS methodology. Despite the limited sample size, our result showed that the peripheral blood TCR repertoire correlates with several clinical characteristics and immune status of TACC patients. However, we should further confirm the results using expanded cohorts in future studies. Currently, both TMB and PD-L1 are indicators for immunotherapy in multiple tumors. In the future, the changes in the TIME, such as TCR repertoire during anti-cancer treatment, might be a novel and useful biomarker for immunotherapy. In this study, we supplied the combine multi-omics analysis to predict biomarker-related clinical benefits in TACC.
Conclusions
In summary, genomic alteration and TIME characterization supplied the molecular basis for in-depth research on the treatment of advanced TACC.
Supplementary
The article’s supplementary files as
Acknowledgments
Funding: This work was supported by State Key Laboratory of Respiratory Disease-The Independent project (Grant No. SKLRD-QN-201720), Guangdong High-Level University Clinical Cultivation Project (Grant No. 2017-21020), and Wu Jieping Medical Foundation (Grant No. 320.6750.18125, 320.6750.19088-8).
Supplementary
Methods
WES
The detection methodology and corresponding sample size were displayed in Figure S5. DNA libraries of the tumor and matched peripheral blood both were hybridized to SeqCap EZ Exome 64M (Roche NimbleGen, Madison, WI, USA) according to the manufacturer’s instructions. Sequencing was conducted with the HiSeq 2000 Sequencing System (Illumina, San Diego, CA, USA) with 2×100-bp paired-end reads. The terminal adaptor sequences and low-quality reads were removed from the raw data using an in-house script. BWA (version 0.7.15-r1140) was employed to align the paired-end clean reads to the reference human genome (hg19). Driver binary of Sentieon (version sentieon-genomics-201808) software was used to remove PCR duplicates, realignment, quality recalibration, and call germline variants and somatic variants by running multiple algorithms. A median effective depth of coverage of 211.5X was obtained.
Identification of somatic mutations and CNVs
Adapter sequences and low-quality reads were removed from raw data. BWA-MEM (version 0.7.12-r1039) was employed to align the clean reads to the reference human genome (hg37). Single nucleotide variants (SNVs) and small insertions and deletions (InDels) were called using Sentieon software. The following filtering strategy found a candidate somatic mutation: (I) the mutation with variant allele fraction (VAF) ≥5% and at least five high-quality reads (Phred score ≥30, mapping quality ≥13, and without paired-end reads bias) supporting the variant loci; (II) the mutation with VAF in the tumor was more than fivefold in the normal group; (III) the mutation was not presented in >1% of the population in the dbSNP database, or 1000 Genomes Project.
VEP software predicted the functional effects of candidate mutations and filtered to exclude intronic and silent changes while retaining mutations with the function of missense, nonsense, frameshift, spans, splicing, cds-del, cds-ins, stop-gain, stop-loss.
Somatic copy number alterations (CNA) analysis and tumor purity and ploidy were performed from WES data using FACETS. A threshold of 0.75 and 1.25 was used to delineate the cutoff for CNVs loss and gain, respectively.
T cell repertoire
Peripheral blood leukocytes (PBLs) were separated from fresh peripheral blood (20 ml) through density gradient centrifugation by Lymphoprep (Progen, Heidelberg, Germany). DNA from PBLs cells was isolated using a QIAamp DNA Mini Kit (QIAGEN, Hilden, Germany; catalog: 51306) and used for T cell repertoire sequencing.
For the T cell repertoire analysis, the third complementarity determining regions (CDR3) of the TCR β chain was amplified using a multiplex PCR approach. The approach used two rounds of PCR amplification, and the demand of genomic DNA for each sample only need 600 ng. Ten cycles were used to amplify the CDR3 fragments using 32 forward primers of V genes, and 13 reverse primers of J genes with a multiplex PCR kit (QIAGEN, Germany) in the first round. Primer sequences that were filed as part of a Chinese patent (CN105087789A) were designed to acquire maximum coverage of a heterogeneous set of target sequences of V and J families with a minimal PCR amplification bias. PCR amplification was performed using Illumina universal primers with a Phusion High-Fidelity PCR Kit (New England Biolabs, USA) in the second round. 151 bp paired-end sequencing of samples was conducted using the Illumina HiSeq XTEN platform. Raw reads were processed and analyzed following four steps: (I) remove sequencing reads which do not contain the primers for multi-PCR using cutadapt (https://github.com/marcelm/cutadapt); (II) merge the remaining high-quality pair-end reads to obtain contigs by Pear; (III) extract CDR3 region and clones using MiXCR (https://github.com/milaboratory/mixcr/) with default parameters with three main processing steps; (IV) filter low-frequency clones (clone fraction >0.00001 and clone count >2).
Diversity and clonality were used to characterize features of the immune repertoire. The diversity of the TCR repertoire was calculated based on the Shannon entropy formula, which combines two distinct metrics, the relative number of clonotypes and their frequency distribution. Clonality was defined as 1-(Shannon entropy index)/ln(number of unique productive sequences).
Immunohistochemical (IHC) detection of PD-L1, CD3, and CD8 expression
We stained the tumor tissue of 14 patients and used the PD-L1 antibody kit (22C3) to detect PD-L1 expression.
For the IHC of CD3, CD8, and PD-L1, sections were deparaffinized in turpentine and rehydrated through a series of graded ethanol. CD3 and CD8 antigen retrieval were performed in a sodium citrate buffer (pH 6.0) in a microwave oven four times at 600 W for 8 min. PD-L1 antigen retrieval was performed in a diluted universal HIER antigen retrieval reagent (ab208572, Abcam, UK, 1:10) using a pressure cooker for 3 minutes with full pressure (120 °C). Endogenous peroxidase was inactivated by incubating the slides with 3% hydrogen peroxide. Nonspecific protein binding was blocked with normal goat serum (ZSGB-BIO, Beijing, China) for at least 1 hour. The sections were incubated with monoclonal antibody CD3 (ab-16669, Abcam, UK, 1:200), CD8 (ab-4055, Abcam, UK, 1:400), PD-L1 (ab-205921, Abcam, UK, 1:600), respectively, at 37 °C (3 hours) or 4 °C (overnight). Bound antibodies were detected by using a conventional streptavidin-biotin method according to manufacturer’s instructions (S-A/HRPkit, ZSGB-BIO, Beijing, China). DAB+ Chromogen visualized the reaction, and nuclei were counterstained using hematoxylin. Finally, slides were covered by coverslips using gelatin.
Immune markers, including CD3, CD8, and PD-L1, were detected by immunohistochemistry (IHC) at tumor infiltration area (TI) and invasive margin area (IM) in the tumor microenvironment (TME). PD-L1 expression was assessed by an immunoreactive score (IRS) system.
All IHC staining slides were scanned as panoramas by Automatic Digital Chip-scanner (KF-PRO-005, Kfbio, China). For the evaluation of PD-L1 expression, the percentage of positive cells were recorded with distinct extracellular staining intensity (0, no staining; 1+, weak/equivocal staining; 2+, moderate, definitive staining; 3+, strong, definitive staining). Immunoreactive score (IRS), according to Remmele and Stegner, was used to rate the expression level. For the evaluation of CD3 and CD8, five fields (radius =150 µm) in the invasive margin area (IM) and ten fields (radius =150 µm) in the tumor infiltration area (TI) were selected Absolute numbers of positive cells were counted, averaged and classified as TI or IM. All slides were examined and scored independently by two investigators.
Statistical analysis
All the data were analyzed and visualized using the R package (version 3.5.0), comparison between groups was calculated using the Wilcoxon rank-sum test, the correlation between TCR diversity and clinical characteristics were calculated with Pearson method. The Kaplan-Meier curves analysis and log-rank test were used to compare differences in disease-free survival (DFS) between groups. P value with P<0.05 was considered as statistically significant.
Figure S1.
Copy number variations profile. LOF, loss of function; LOH, loss of heterozygosity.
Figure S2.
TCR diversity distribution of 13 peripheral blood samples and seven tissues from 13 patients and distribution of TCR overlap between peripheral blood and tumor in seven patients. TCR, T cell repertoire.
Figure S3.
Correlation between TCR diversity and age in blood samples. The pearson correlation between age and Clonotype number (A) or Shannon index (B) or Clonality (C). TCR, T cell repertoire.
Figure S4.
Immunohistochemical (IHC) detection of CD3 and CD8 and PD-L1 in TACC. (A) IHC detection of CD3 and CD8; (B) IHC detection of PD-L1 in TACC. IHC, immunohistochemical; TACC, tracheal adenoid cystic carcinoma.
Figure S5.
The detection and number of samples in our cohort.
Table S1. Clinical characteristics of the enrolled 25 TACC patients.
| Variables | Results |
|---|---|
| Sex, n (%) | |
| Female | 14 (56.0) |
| Male | 11 (44.0) |
| Age (years), mean ± SD | 45.0±15.6 |
| History of smoke, n (%) | 4 (16.0) |
| Smoking index (pack-years, median) | 160 |
| Tumor location, n (%) | |
| Proximal | 7 (28.0) |
| Middle | 3 (12.0) |
| Distal | 13 (52.0) |
| Other | 2 (8.0) |
| Tumor size (cm), mean ± SD | (2.8±1.2) *(2.1±0.8) |
| Symptoms, n (%) | |
| Cough | 24 (96.0) |
| Dyspnea | 19 (76.0) |
| Hemoptysis | 7 (28.0) |
| Time (months), mean ± SD | 17.5±14.3 |
| Lymph node invasion | 0 (0.0) |
| Distant metastases | 2 (8.0) |
TACC, tracheal adenoid cystic carcinoma.
Table S2. Comparison of median progression-free survival between groups.
| Comparison | mDFS | Test value | P value |
|---|---|---|---|
| Resection vs. nonsurgical treatment | 41.2±11.0 vs. 13.3±2.4 | 6.226 | 0.013 |
| R0 resection vs. R1 resection | 61.3±21.4 vs. 33.3±4.2 | 0.688 | 0.407 |
| R0 resection vs. nonsurgical treatment | 61.3±21.4 vs. 13.3±2.4 | 4.519 | 0.034 |
| R1 resection vs. nonsurgical treatment | 33.3±4.2 vs. 13.3±2.4 | 3.312 | 0.069 |
mDFS, median disease-free survival.
Table S3. Treatment and survival data of enrolled 25 TACC patients.
| Case | Treatment 1 | Types of resection treatment | PFS1 | Treatment 2 | PFS2 | Treatment 3 | PFS3 | OS |
|---|---|---|---|---|---|---|---|---|
| 1 | Interventional therapeutic bronchoscopy + radiation therapy | – | 16* | – | – | – | – | 16* |
| 2 | Resection + radiation therapy | R1 | 15* | – | – | – | – | 15* |
| 3 | Resection | R0 | 14* | – | – | – | – | 14* |
| 4 | Resection + TP | R1 | 15* | – | – | – | – | 15* |
| 5 | Resection | R1 | 23* | – | – | – | – | 23* |
| 6 | Resection | R1 | 12* | – | – | – | – | 12* |
| 7 | Interventional therapeutic bronchoscopy + TP | 6 | Immunotherapy | 2 | Interventional therapeutic bronchoscopy | 3* | 11* | |
| 8 | Resection + GP | R0 | 8* | – | – | – | – | 8* |
| 9 | Resection | R0 | 21* | – | – | – | – | 21* |
| 10 | Radiation therapy + PP + A | 18* | – | – | – | – | 18* | |
| 11 | Resection | R0 | 108 | Radiation therapy | 1* | Die | – | 109 |
| 12 | Interventional therapeutic bronchoscopy | 18 | Interventional therapeutic bronchoscopy | 13 | Interventional therapeutic bronchoscopy | 15* | 46* | |
| 13 | Resection | R0 | 14 | Supportive treatment | – | – | – | 16* |
| 14 | Resection | R0 | 13* | – | – | – | – | 13* |
| 15 | Resection + PP | R0 | 12* | – | – | – | – | 12* |
| 16 | TP | – | 7 | Supportive treatment | – | – | – | 12* |
| 17 | Resection + TP | R1 | 38 | Interventional therapeutic bronchoscopy | 12* | – | – | 50* |
| 18 | Resection | R0 | 9* | – | – | – | – | 9* |
| 19 | Resection + PP | R0 | 29* | – | – | – | – | 29* |
| 20 | Interventional therapeutic bronchoscopy + radiation therapy + TP | – | 13 | Anlotinib + Interventional therapeutic bronchoscopy | 6 | PP | 3* | 22* |
| 21 | Resection + radiation therapy | R0 | 19* | – | – | – | – | 19* |
| 22 | Resection + PP | R0 | 48 | Osimertinib + Interventional therapeutic bronchoscopy | 7* | – | – | 55* |
| 23 | Resection + PP + radiation therapy | R1 | 36 | Support care | – | – | – | 38* |
| 24 | Resection | R1 | 15 | Radiation therapy | 18* | – | – | 33* |
| 25 | Resection | R0 | 18 | Support care | 18* | – | – | 36* |
*, no disease progression. TACC, tracheal adenoid cystic carcinoma; PFS, progression-free survival; OS, overall survival; TP, paclitaxel + platinum; GP, gemcitabine + platinum; PP, pemetrexed + platinum; A, bevacizumab.
Ethical Statement: The authors are accountable for all aspects of the work in ensuring that questions related to the accuracy or integrity of any part of the work are appropriately investigated and resolved. The study was conducted in accordance with the Declaration of Helsinki (as revised in 2013). The scientific, ethical Committee approved this study of the First Affiliated Hospital Guangzhou Medical University (ChiCTR-IPR-15006164). All patients supplied written informed consent.
Footnotes
Reporting Checklist: The authors have completed the STROBE reporting checklist. Available at http://dx.doi.org/10.21037/atm-20-3433
Data Sharing Statement: Available at http://dx.doi.org/10.21037/atm-20-3433
Conflicts of Interest: All authors have completed the ICMJE uniform disclosure form (available at http://dx.doi.org/10.21037/atm-20-3433). The authors have no conflicts of interest to declare.
References
- 1.Bhattacharyya N. Contemporary staging and prognosis for primary tracheal malignancies: a population-based analysis. Otolaryngol Head Neck Surg 2004;131:639-42. 10.1016/j.otohns.2004.05.018 [DOI] [PubMed] [Google Scholar]
- 2.Lu D, Feng S, Liu X, et al. 3D-printing aided resection of intratracheal adenoid cystic carcinoma and mediastinal mature cystic teratoma in a 26-year-old female: a case report. J Thorac Dis 2018;10:E134-7. 10.21037/jtd.2018.01.62 [DOI] [PMC free article] [PubMed] [Google Scholar]
- 3.Urdaneta AI, Yu JB, Wilson LD. Population based cancer registry analysis of primary tracheal carcinoma. Am J Clin Oncol 2011;34:32-7. 10.1097/COC.0b013e3181cae8ab [DOI] [PubMed] [Google Scholar]
- 4.Huo Z, Meng Y, Wu H, et al. Adenoid cystic carcinoma of the tracheobronchial tree: clinicopathologic and immunohistochemical studies of 21 cases. Int J Clin Exp Pathol 2014;7:7527-35. [PMC free article] [PubMed] [Google Scholar]
- 5.Macchiarini P. Primary tracheal tumours. Lancet Oncol 2006;7:83-91. 10.1016/S1470-2045(05)70541-6 [DOI] [PubMed] [Google Scholar]
- 6.Kwak SH, Lee KS, Chung MJ, J, et al. Adenoid cystic carcinoma of the airways: helical CT and histopathologic correlation. AJR Am J Roentgenol 2004;183:277-81. 10.2214/ajr.183.2.1830277 [DOI] [PubMed] [Google Scholar]
- 7.Maziak DE, Todd TR, Keshavjee SH, et al. Adenoid cystic carcinoma of the airway: thirty-two-year experience. J Thorac Cardiovasc Surg 1996;112:1522-31; discussion 1531-2. 10.1016/S0022-5223(96)70011-9 [DOI] [PubMed] [Google Scholar]
- 8.Kanematsu T, Yohena T, Uehara T, et al. Treatment outcome of resected and nonresected primary adenoid cystic carcinoma of the lung. Ann Thorac Cardiovasc Surg 2002;8:74-7. [PubMed] [Google Scholar]
- 9.Bonner Millar LP, Stripp D, Cooper JD, et al. Definitive radiotherapy for unresected adenoid cystic carcinoma of the trachea. Chest 2012;141:1323-6. 10.1378/chest.11-0925 [DOI] [PubMed] [Google Scholar]
- 10.Terhaard CH, Lubsen H, Rasch CR, et al. The role of radiotherapy in the treatment of malignant salivary gland tumors. Int J Radiat Oncol Biol Phys 2005;61:103-11. 10.1016/j.ijrobp.2004.03.018 [DOI] [PubMed] [Google Scholar]
- 11.Nouraei SM, Middleton SE, Nouraei SA, et al. Management and prognosis of primary tracheal cancer: a national analysis. Laryngoscope 2014;124:145-50. 10.1002/lary.24123 [DOI] [PubMed] [Google Scholar]
- 12.Huo Z, Wu H, Li S, et al. Molecular genetic studies on EGFR, KRAS, BRAF, ALK, PIK3CA, PDGFRA, and DDR2 in primary pulmonary adenoid cystic carcinoma. Diagn Pathol 2015;10:161. 10.1186/s13000-015-0409-7 [DOI] [PMC free article] [PubMed] [Google Scholar]
- 13.Ho AS, Ochoa A, Jayakumaran G, et al. Genetic hallmarks of recurrent/metastatic adenoid cystic carcinoma. J Clin Invest 2019;129:4276-89. 10.1172/JCI128227 [DOI] [PMC free article] [PubMed] [Google Scholar]
- 14.Hao L, Xiao-lin N, Qi C, et al. Nerve growth factor and vascular endothelial growth factor: retrospective analysis of 63 patients with salivary adenoid cystic carcinoma. Int J Oral Sci 2010;2:35-44. 10.4248/IJOS10005 [DOI] [PMC free article] [PubMed] [Google Scholar]
- 15.Dubbelman AC, Upthagrove A, Beijnen JH, et al. Disposition and metabolism of 14C-dovitinib (TKI258), an inhibitor of FGFR and VEGFR, after oral administration in patients with advanced solid tumors. Cancer Chemother Pharmacol 2012;70:653-63. 10.1007/s00280-012-1947-2 [DOI] [PubMed] [Google Scholar]
- 16.Chau NG, Hotte SJ, Chen EX, et al. A phase II study of sunitinib in recurrent and/or metastatic adenoid cystic carcinoma (ACC) of the salivary glands: current progress and challenges in evaluating molecularly targeted agents in ACC. Ann Oncol. 2012;23:1562-70. 10.1093/annonc/mdr522 [DOI] [PubMed] [Google Scholar]
- 17.Dillon PM, Chakraborty S, Moskaluk CA, et al. Adenoid cystic carcinoma: A review of recent advances, molecular targets, and clinical trials. Head Neck. 2016;38:620-7. 10.1002/hed.23925 [DOI] [PMC free article] [PubMed] [Google Scholar]
- 18.Rizvi NA, Hellmann MD, Snyder A, et al. Cancer immunology. Mutational landscape determines sensitivity to PD-1 blockade in non-small cell lung cancer. Science 2015;348:124-8. 10.1126/science.aaa1348 [DOI] [PMC free article] [PubMed] [Google Scholar]
- 19.Cancer Genome Atlas Research Network , Kandoth C, Schultz N, et al. Integrated genomic characterization of endometrial carcinoma. Nature 2013;497:67-73. 10.1038/nature12113 [DOI] [PMC free article] [PubMed] [Google Scholar]
- 20.Robert L, Tsoi J, Wang X, et al. CTLA4 blockade broadens the peripheral T-cell receptor repertoire. Clin Cancer Res 2014;20:2424-32. 10.1158/1078-0432.CCR-13-2648 [DOI] [PMC free article] [PubMed] [Google Scholar]
- 21.Robins HS, Campregher PV, Srivastava SK, et al. Comprehensive assessment of T-cell receptor beta-chain diversity in alphabeta T cells. Blood. 2009;114:4099-107. 10.1182/blood-2009-04-217604 [DOI] [PMC free article] [PubMed] [Google Scholar]
- 22.Nikolich-Zugich J, Slifka MK, Messaoudi I. The many important facets of T-cell repertoire diversity. Nat Rev Immunol 2004;4:123-32. 10.1038/nri1292 [DOI] [PubMed] [Google Scholar]
- 23.Miles JJ, Douek DC, Price DA. Bias in the alphabeta T-cell repertoire: implications for disease pathogenesis and vaccination. Immunol Cell Biol 2011;89:375-87. 10.1038/icb.2010.139 [DOI] [PubMed] [Google Scholar]
- 24.DeWolf S, Grinshpun B, Savage T, et al. Quantifying size and diversity of the human T cell alloresponse. JCI Insight 2018;3:e121256. 10.1172/jci.insight.121256 [DOI] [PMC free article] [PubMed] [Google Scholar]
- 25.Xie M, Wei S, Wu X, et al. Alterations of Notch pathway in patients with adenoid cystic carcinoma of the trachea and its impact on survival. Lung Cancer 2018;121:41-7. 10.1016/j.lungcan.2018.04.020 [DOI] [PubMed] [Google Scholar]
- 26.Meshcheryakova A, Svoboda M, Jaritz M, et al. Interrelations of Sphingolipid and Lysophosphatidate Signaling with Immune System in Ovarian Cancer. Comput Struct Biotechnol J 2019;17:537-60. 10.1016/j.csbj.2019.04.004 [DOI] [PMC free article] [PubMed] [Google Scholar]
- 27.Brusevold IJ, Tveteraas IH, Aasrum M, et al. Role of LPAR3, PKC and EGFR in LPA-induced cell migration in oral squamous carcinoma cells. BMC Cancer 2014;14:432. 10.1186/1471-2407-14-432 [DOI] [PMC free article] [PubMed] [Google Scholar]
- 28.Popnikolov NK, Dalwadi BH, Thomas JD, et al. Association of autotaxin and lysophosphatidic acid receptor 3 with aggressiveness of human breast carcinoma. Tumour Biol 2012;33:2237-43. 10.1007/s13277-012-0485-1 [DOI] [PubMed] [Google Scholar]
- 29.Shin J, Carr A, Corner GA, et al. The intestinal epithelial cell differentiation marker intestinal alkaline phosphatase (ALPi) is selectively induced by histone deacetylase inhibitors (HDACi) in colon cancer cells in a Kruppel-like factor 5 (KLF5)-dependent manner. J Biol Chem 2014;289:25306-16. 10.1074/jbc.M114.557546 [DOI] [PMC free article] [PubMed] [Google Scholar]
- 30.Tapias LF, Shih A, Mino-Kenudson M, et al. Programmed death ligand 1 and CD8+ immune cell infiltrates in resected primary tracheal malignant neoplasms. Eur J Cardiothorac Surg 2019;55:691-8. 10.1093/ejcts/ezy370 [DOI] [PubMed] [Google Scholar]
Associated Data
This section collects any data citations, data availability statements, or supplementary materials included in this article.
Supplementary Materials
The article’s supplementary files as


