

Abstract
Oncogenic KRAS (KRAS*) is a key tumor maintenance gene in pancreatic ductal adenocarcinoma (PDAC), motivating pharmacological targeting of KRAS* and its effectors. Here, we explored mechanisms involving the tumor microenvironment (TME) as a potential basis for resistance to targeting KRAS*. Using the inducible KrasG12D p53 null (iKPC) PDAC mouse model, gain-of-function screens of epigenetic regulators identified HDAC5 as the top hit enabling KRAS* independent tumor growth. HDAC5-driven escaper tumors showed a prominent neutrophil-to-macrophage switch relative to KRAS*-driven tumors. Mechanistically, HDAC5 represses Socs3, a negative regulator of chemokine CCL2, resulting in increased CCL2 which recruits CCR2+ macrophages. Correspondingly, enforced Ccl2 promotes macrophage recruitment into the TME and enables tumor recurrence following KRAS* extinction. These tumor-associated macrophages (TAMs) in turn provide cancer cell with trophic support including TGFβ to enable KRAS* bypass in a Smad4-dependent manner. Our work uncovers a KRAS* resistance mechanism involving immune cell remodeling of the PDAC TME.
Introduction
The majority of PDAC cases harbor oncogenic KRAS mutations (KRAS*) (1, 2). In mouse models, KRAS* serves as a tumor initiating event and, together with loss of tumor suppressor genes, can drive advanced disease that recapitulates well the biology of human PDAC (3, 4). KRAS* also supports PDAC tumor maintenance by regulating several intrinsic and extrinsic cancer hallmarks (5, 6). In cancer cells, KRAS* activates glycolysis and glutamine flux to provide metabolic intermediates for anabolic metabolism and to maintain redox homeostasis, respectively (5, 7). KRAS* also drives cell autonomous expression of type I cytokine receptor complexes to receive growth signals from the tumor microenvironment (TME) to enhance glycolysis (8). Moreover, KRAS* induces cancer cell macropinocytosis as an additional carbon source to fuel tumor growth (9). On the other hand, KRAS* can remodel the extracellular matrix by modulating RhoA/ROCK signaling (10) and promote angiogenesis by increasing production of CXCLs and VEGF via the MAPK pathway (11). KRAS* suppresses immune surveillance by stimulating cancer cell production of GM-CSF that recruits CD11b+Ly6G+ myeloid cells which suppress CD8+ T cell function (12). Similarly, KRAS* induces cancer cell production of IL10 and TGFβ through activation of MAPK/AP-1 pathway which matures immune suppressive regulatory CD4+ T cells (13).
As KRAS* is a key PDAC tumor maintenance gene (14), academic and biopharmaceutical efforts have sought to identify and target KRAS* signaling surrogates (15, 16). While KRAS* remains an important target, the inducible KRAS* iKPC PDAC mouse model (5) has revealed cancer cell intrinsic mechanisms enabling bypass of KRAS* dependency and tumor recurrence (17). Specifically, Yap1 amplification and overexpression enabled escape in approximately one-third KRAS*-negative recurrent PDAC tumors (17), and serves a similar role in lung cancer (18).
The capacity of PDAC to escape KRAS*-dependency prompted a systematic and comprehensive search for additional (epi)genetic mechanisms driving KRAS*-independent tumor recurrence. To that end, we conducted a functional genomic screen that focused on epigenetic regulators based on several lines of evidence including the tumor promoting roles of histone modifiers and SWI/SNF complex in PDAC (2, 19–21), enhancer remodeling enabling bypass of MEK inhibition in triple negative breast cancer cells (22), and Bromodomain and Extra‐Terminal Domain (BET) function in MEK resistance in melanoma (23). Our work reveals a novel KRAS* resistance mechanism involving immune cells of the TME, identifying a druggable circuit that enables KRAS*-independent PDAC growth without de novo RAS reactivation and illuminating a potential strategy to enhance anti-KRAS* therapy of PDAC.
Results
HDAC5 promotes bypass of KRAS* dependency in PDAC.
To identify epigenetic mechanisms driving KRAS*-independent tumor recurrence, in vivo gain-of-function screens were conducted in the KRAS* inducible iKPC PDAC mouse model following KRAS* extinction (Fig. 1A–C). A human cDNA library of 284 epigenetic regulators was assembled, encompassing readers (26%), writers (26%), erasers (15%), chromatin remodeling factors/complex members (29%) and RNA modulators (4%) (Supplementary Table 1). The iKPC cancer cells, engineered to express luciferase (iKPC-luc), were infected with pooled sub-libraries (10 genes/pool) at an infection ratio of one gene per cell and were orthotopically transplanted into the pancreas of nude mice (10 mice per pool) in the absence of doxycycline feed (i.e., KRAS* off) (Fig. 1D). Weekly bioluminescent imaging beginning at week 4 (Fig. 1E) revealed that 15 of 30 sub-libraries generated KRAS*-independent tumors in at least 5 mice per pool (Supplementary Fig. S1A). Real-time PCR (qRT-PCR) was used to quantify gene expression levels in escaper tumors relative to parental input control cells (Supplementary Fig. S1B). The top 10 enriched gene candidates, overexpression of which were validated by western blot (Supplementary Fig. S1C), were distributed in 6 different sub-pools (Supplementary Fig. S1D). The KRAS* bypass capacity of these 10 candidates were validated individually in vivo, displaying tumor latencies between 3-22 weeks (Fig. 1F). HDAC5 exhibited the highest efficiency (~100%) and shortest tumor onset kinetics (<4 weeks) following KRAS* extinction in iKPC-luc cells (Fig. 1F). Furthermore, HDAC5-directed bypass of KRAS* dependency was validated in 5 independently derived iKPC PDAC cell lines from both C57BL/6 pure background and FVB/B6 mixed background (Fig. 1G), and in both subcutaneous (Fig. 1G–I) and orthotopic (Fig. 1J–L, Supplementary Fig. S1E) allograft mouse models. Thus, HDAC5 promotes efficient bypass of KRAS* dependency in vivo (Fig. 1M).
Figure 1. Epigenetic ORF library screening identified HDAC5 in driving the bypass of KRAS* dependency.
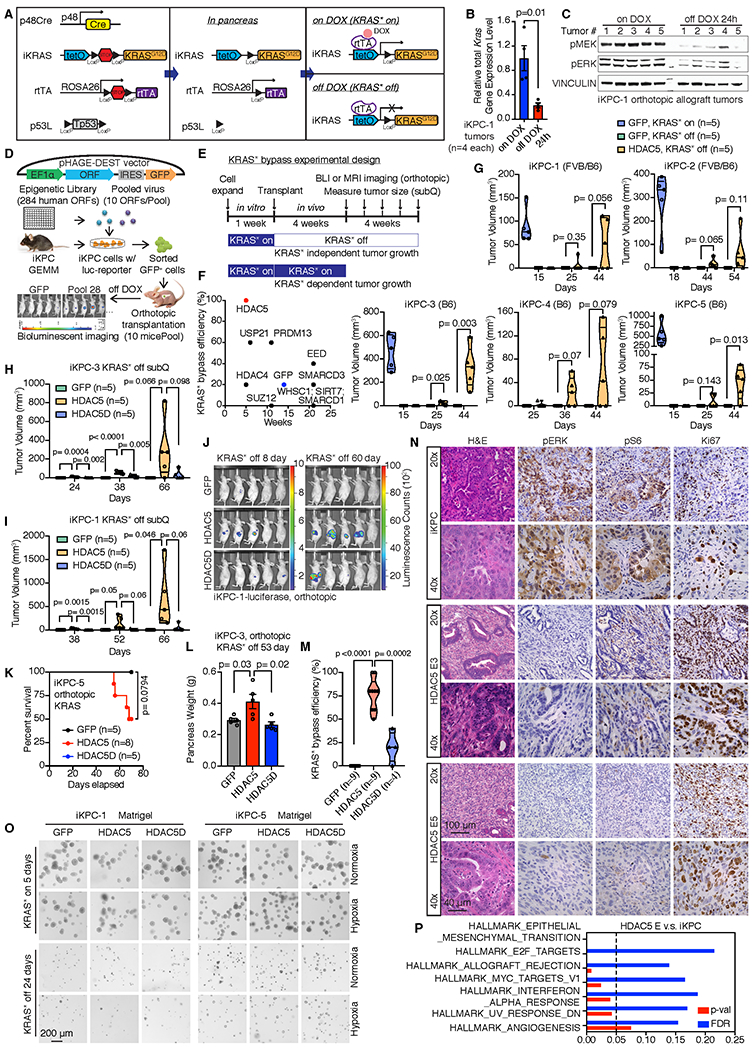
A, Schematic graphs of genetic alleles in the iKPC genetically engineered mouse model, and control of KRAS* expression by Doxycycline (DOX). B, Relative total Kras gene expression level in iKPC-1 orthotopic allograft tumors with or without 24-hour DOX feeding (n=4 tumors for each group). C, Activation of KRAS* major downstream MEK/ERK pathway in iKPC-1 orthotopic allograft tumors with or without 24-hour DOX feeding (n=5 tumors for each group). D, Schematic diagram of screening strategy. E, Schematic experimental design of KRAS* bypass in vivo. F, Single ORF validation of top 10 candidates to bypass KRAS* dependency in vivo. G, HDAC5 promotes KRAS*-independent tumor growth in 5 different iKPC cell lines. Each iKPC cell line overexpressing GFP or HDAC5 was subcutaneously transplanted in nude mice at 500,000 cells per injection. Five mice with GFP-overexpressed (OE) iKPC cells were given Doxycycline water (ad lib) to activate KRAS* expression as a positive control group; five mice with GFP-OE iKPC cells and five mice with HDAC5-OE iKPC cells were given normal water to extinct KRAS* expression as negative control and experimental group, respectively. Tumor sizes were measured on the days indicated after transplantation. H and I, Tumor volume analysis of nude mice subcutaneously transplanted with GFP-, HDAC5- or HDAC5D-OE iKPC-3 cells (H) or iKPC-1 cells (I). Mice were given normal water to extinct KRAS* expression. J, BLI imaging of nude mice orthotopically transplanted with GFP-, HDAC5- or HDAC5D-OE iKPC-1 cells with luciferase reporter. K, The Kaplan–Meier survival analysis of nude mice orthotopically transplanted with GFP-, HDAC5- or HDAC5D-OE iKPC-5 cells. The Gehan-Breslow-Wilcoxon tests were performed to calculate the p values. L, Pancreas weight analysis from nude mice orthotopically transplanted with GFP-, HDAC5- or HDAC5D-OE iKPC-3 cells at day 53 after KRAS* extinction. M, Summary of all the in vivo KRAS* bypass experiments comparing the bypass efficiency driven by GFP, HDAC5 and HDAC5D in iKPC cells. N, H&E staining and IHC staining of pERK, pS6 and Ki67 in HDAC5 escapers and iKPC tumors derived from nude mice. The 40x images are not necessarily closeups of the 20x slides. O, The 3-D colony formation assay of GFP-, HDAC5- or HDAC5D-OE iKPC-1 and iKPC-5 cells after KRAS* extinction in Matrigel culture under normoxia or hypoxia conditions. KRAS*-expressing cells were used as positive control. P, Upregulated pathways in HDAC5 escaper cells (n=5) versus iKPC cells (n=4) by GSEA analysis of RNA-seq data. For B and L, data are represented as mean ± SEM. For B, G-I, L and M, two-tailed unpaired t tests were performed to calculate the p values.
HDAC5, together with HDAC4, HDAC7 and HDAC9, belong to the Class IIa HDAC family (24). These HDACs have extended N-terminal regions with conserved regulatory binding sites to response to external signals and interact with other transcriptional repressors. Their C-terminal HDAC domain has minimal catalytic activity but binds with Class I HDACs to form co-repressor complexes. Unlike other HDACs, class IIa HDACs show restricted expression in normal tissues. Specifically, HDAC5 and HDAC9 are mainly expressed in heart, brain and skeleton, which are functionally redundant in regulating growth and maturation of cardiomyocytes (24).
As a scaffold protein (25), HDAC5 interacts with HDAC3 through its deacetylase domain and forms a co-repressor complex to deacetylate its target proteins (26). Accordingly, an HDAC5 mutant (HDAC5D), defective in forming a catalytically functional HDAC3-HDAC5 co-repressor complex(27) (Supplementary Fig. S1F), was unable to effectively promote iKPC cells to bypass KRAS* dependency (Fig. 1H–M). Furthermore, gain-of-function assays with other HDACs failed to generate tumors following KRAS* extinction (Supplementary Fig. S1G). HDAC5 escapers showed no KRAS* transgene expression, lack of increased endogenous Kras or Yap1 expression by RT-qPCR (Supplementary Fig. S2A), lack of active RAS (Supplementary Fig. S2B), low pERK or pAKT levels compared to KRAS*-expressing iKPC cells by immunohistochemistry (IHC) and western blot analysis (Fig. 1N; Supplementary Fig. S2C), and hyperproliferation by Ki67 staining (Fig. 1N). Thus, HDAC5 enables KRAS*-independent tumor growth through mechanisms other than reactivation of KRAS* signaling or Yap1 amplification/over-expression.
HDAC5-driven bypass of KRAS* dependency requires cell extrinsic factors.
In exploring mechanisms of HDAC5 bypass, we noted that enforced HDAC5 failed to bypass KRAS* dependency in in vitro systems following KRAS* extinction. The Matrigel based 3-D culture system showed that, while KRAS*-expressing iKPC spheroid colonies grew well, neither HDAC5 nor HDAC5D was able to support KRAS*-independent spheroid growth employing 2 independently derived iKPC cells (Fig. 1O). Similar results were obtained in MethoCult and soft agar 3-D culture systems (Supplementary Fig. S2D,E). By cell cycle analysis of Matrigel cultured colonies, we observed that the cell populations blocked at subG0G1 phase and G2 phase were increased after KRAS* extinction in GFP-, HDAC5- and HDAC5D-overexpressed (OE) iKPC cells (Supplementary Fig. S2F), suggesting that cells in all these groups undergo apoptosis and fail to divide. Intriguingly, Gene Set Enrichment Analysis (GSEA) of differential gene expression indicated that inflammation related pathways were activated in HDAC5 escapers compared to the parental iKPC cells (Fig. 1P), prompting speculation that escape mechanisms could involve immune cell derived factors that activate growth receptors on cancer cells. Examination of receptor expression patterns in RNA-sequencing (RNA-seq) data identified 68 receptors for cytokines, lipids, chemicals and prostaglandins that were up-regulated in the HDAC5 escapers (n=5) compared with iKPC parental cells (n=4, Fig. 2A). In compiling our list, we only included growth factor receptors for which there was increased expression of their cognate growth factors in iKPC tumors following KRAS* extinction at 24 hours by RNA-seq analysis (n=4 for each group; Fig. 2A, Supplementary Fig. S3A), and all the non-growth factor receptors. The intersection of these lists generated 18 receptors (Fig. 2A,B, Supplementary Fig. S3A); TGFβR3 (betaglycan) was the most upregulated receptor among them (Fig. 2A), which facilitates high affinity binding of TGFβ to TGFβRII (28).
Figure 2. TGFβ supports pancreatic cancer cells to bypass KRAS* dependency.
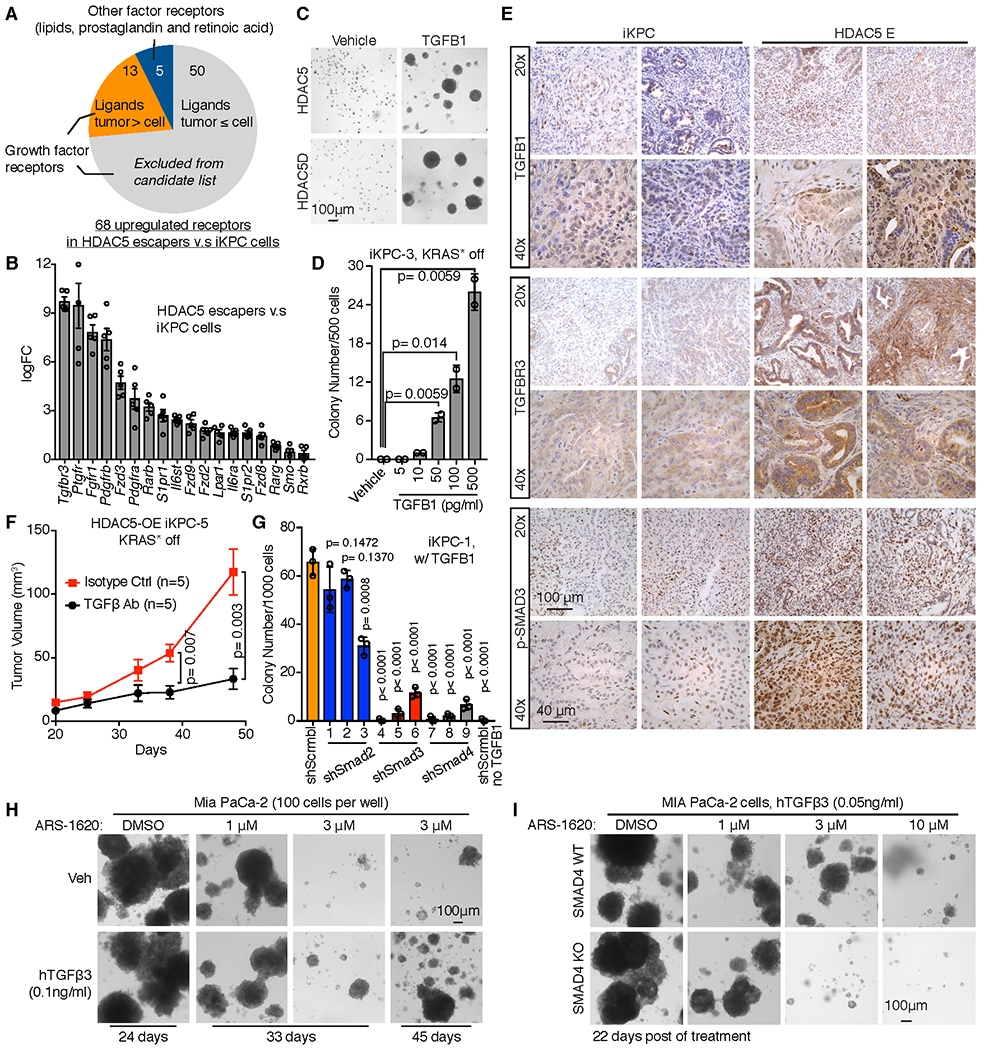
A, Graph illustrating receptor candidates that may mediate bypass of KRAS* dependency. Sixty-eight receptors for cytokines, lipids, chemicals and prostaglandins were up-regulated in the RNA-seq dataset of HDAC5 escapers (n=5) versus iKPC parental cells (n=4), among which were only 13 receptors whose ligands were upregulated after KRAS* extinction in iKPC tumors by RNA-seq analysis (n=4 for each group), and 5 non-growth factor receptors. These 18 receptors were our candidates. B, Eighteen upregulated receptor candidates were ranked by fold change of gene expression in HDAC5-driven escaper cells (n=5) versus iKPC cells (n=4). C, TGFβ1 (0.5 ng/ml) promoted the bypass of KRAS* dependency in 3-D culture regardless of HDAC5 or HDAC5D overexpression in iKPC-3 cells. Images were taken at Day 12 after KRAS* extinction. D, Titration of the minimal concentration of TGFβ1 to bypass KRAS* dependency in iKPC-3 cells (n = 2). Colonies were counted at Day 9 after KRAS* extinction. E, IHC staining of TGFβ1, TGFBR3 and pSMAD3 in iKPC tumors and HDAC5-driven escapers. F, Neutralization of TGFβ impaired KRAS*-independent tumor growth of HDAC5-OE iKPC-5 cells subcutaneously transplanted in nude mice (n = 5). G, Comparison of TGFβ1 (0.5 ng/ml)-driven KRAS*-independent colony formation between scramble control and knockdown of Smad2, Smad3 and Smad4 in iKPC-1 cells (n = 3). Colony numbers were counted at Day 10 after KRAS* extinction. The iKPC-1 cells without TGFβ1 treatment serve as a negative control. H, TGFβ promoted resistance to KRAS* inhibitor ARS-1620 treatment in human MIA PaCa-2 cells in vitro. I, Comparison of TGFβ-induced colony formation under KRAS* inhibition in SMAD4 wildtype and knockout MIA PaCa-2 cells. For B, D, F and G, data are represented as mean ± SEM. For D, F and G, two-tailed unpaired t tests were performed to calculate the p values.
We next tested the biological relevance of these receptors in supporting KRAS*-independent colony growth in vitro. Specifically, 11 different ligand treatments of various cytokines, lipids, prostaglandin and retinoic acid were added to iKPC cancer cell 3-D cultures and assayed for colony growth following KRAS* extinction (Supplementary Fig. S3A). In this assay, only TGFβ1 was sufficient to promote KRAS*-independent colony growth in vitro (Supplementary Fig. S3B, Fig. 2C). Titration of TGFβ1 concentration showed 10 pg/ml as the minimal effective concentration of TGFβ1 (Fig. 2D), which is about 200-times lower than the total TGFβ1 levels in mouse plasma (Supplementary Fig. S3C). TGFβ1 treatment did not depend on endogenous Hdac5 in iKPC cells to bypass KRAS* function after KRAS* extinction (Supplementary Fig. S3D,E), and the TGFβ1 effect was independent of HDAC5 or HDAC5D overexpression (Fig. 2C, Supplementary Fig. S3F). Addtionally, TGFβ1 did not promote KRAS*-dependent colony growth (Supplementary Fig. S3G). TGFβ1 increased SMAD2/3 phosphorylation, and SMAD4 was unchanged (Supplementary Fig. S3H). TGFβ2 and TGFβ3 were also effective in bypassing KRAS* dependency (Supplementary Fig. S3I). Correspondingly, we also treated iKPC cells with the MEK inhibitor Trametinib in 3-D culture to block the major downstream pathway of KRAS*, and observed that the addition of TGFβ1 resulted in MEK inhibition resistance (Supplementary Fig. S3J).
In tumors, IHC analysis of HDAC5 escapers documented increased TGFβ1, TGFβR3 and phosphorylated SMAD3 levels compared with KRAS*-expressing iKPC tumors (Fig. 2E). Importantly, neutralizing antibodies to TGFβ impaired HDAC5-driven bypass of KRAS* dependency in vivo (Fig. 2F, Supplementary Fig. S3K,L). Thus, TGFβ-dependent paracrine signaling plays a critical role in HDAC5-driven KRAS*-independent tumor recurrence.
TGFβ enables bypass of KRAS* dependency via the canonical TGFβ pathway.
To determine whether activation of the canonical TGFβ pathway is required for TGFβ1-driven bypass of KRAS* dependency, shRNA-mediated depletion of Smad2, Smad3 or Smad4 was performed in TGFβ1-treated iKPC cells after KRAS* extinction in 3-D culture (Supplementary Fig. S4A,B). Depletion of Smad3 and Smad4 impaired KRAS*-independent iKPC colony growth, while depletion of Smad2 did not (Fig. 2G, Supplementary Fig. S4C), suggesting that activation of canonical TGFβ pathway components, Smad3 and Smad4 is required for TGFβ1-driven bypass of KRAS* dependency in iKPC cells. To understand more fully the biological and molecular mechanisms underlying the actions of TGFβ on PDAC cancer cells, transcriptional profiling was conducted to assess the effect of TGFβ1 treatment on iKPC cells following KRAS* extinction in 3-D culture (n=3 each group). GSEA analysis showed that top pathways enriched by TGFβ1 treatment included epithelial-mesenchymal transition (EMT), activated cell division and proliferation, and inflammatory related genes (Supplementary Fig. S4D), which were also significantly enriched in HDAC5 escaper cells (Fig. 1P), further reinforcing a pivotal role of TGFβ pathway activation in HDAC5-driven bypass of KRAS* addiction.
Consistently, we observed that TGFβ also desensitized human MIA PaCa-2 PDAC cells (harboring KRASG12C mutation) to ARS-1620, an inhibitor of KRASG12C (Fig. 2H, Supplementary Fig. S4E), and knockout of SMAD4 sensitized MIA PaCa-2 cells to ARS-1620 in the presence of TGFβ (Fig. 2I, Supplementary Fig. S4F), supporting the importance of canonical TGFβ pathway activation for KRAS* bypass in both mouse and human PDAC models. Along these lines, it is worth noting that human PDAC tumors with high E-cadherin expression respond better to dual MEK and EGFR inhibition than those with low E-cadherin (29), suggesting that the mesenchymal-like phenotype may be associated with the poor response to KRAS* signaling in PDAC. As TGFβ promotes EMT (Supplementary Fig. S4D), these data, together with previous studies, raise the possibility of improved therapeutic benefit from combined therapeutic inhibition of TGFβ and KRAS* signaling or the inhibition of KRAS* in SMAD4 null tumors.
Neutrophil-to-Macrophage switch in HDAC5 escapers.
Since TGFβ enabled KRAS* bypass regardless of HDAC5, we reasoned that HDAC5 overexpression in iKPC cells may serve to enable the recruitment of TME cells that produce abundant TGFβ. To explore this possibility, mass cytometry (CyTOF) was used to audit cell populations in KRAS*-expressing primary tumors versus HDAC5 escapers from subcutaneous allograft models in nude mice. A panel of diverse cell markers (Supplementary Table 2) showed that, while the TME of both tumor types contained a preponderance of CD45+CD11b+ myeloid cells (Fig. 3A–C, Supplementary Fig. S5A), there was a prominent switch in myeloid cell types from neutrophil-rich CD45+CD11b+Ly6GhighLy6Clow cells in primary tumors to macrophage-rich CD45+CD11b+F4/80+Ly6C- cells in HDAC5 escapers (Fig. 3A and D, Supplementary Fig. S5B). Flow cytometry analysis (FACS) of orthotopic allograft tumors in nude mice using an independent iKPC cell line (Fig. 3E,F) confirmed a myeloid shift (Fig. 3G, Supplementary Fig. S5C). Moreover, IHC analysis showed abundant myeloid cells by CD11b staining in both primary and escaper tumors (Fig. 3H) and significantly increased macrophages by F4/80 staining in HDAC5 escapers compared to primary tumors (Fig. 3H,I); IHC staining of HDAC5 escapers also revealed more myeloid cells that expressed the calcium binding protein S100A8 (30), relative to primary tumors (Fig. 3H,J). Confirmed by CyTOF and FACS analysis, S100A8-positive myeloid cells were increased in HDAC5 escapers compared to primary tumors (Supplementary Fig. S5D,E), and S100A8 was predominantly expressed by macrophages (Supplementary Fig. S5F,G). Since HDAC5 promoted iKPC tumors to bypass KRAS* dependency in both subcutaneous and orthotopic allograft models (Fig. 1G–M), the infiltrated F4/80 and S100A8 positive cell numbers in tumors from both models were compared by IHC analysis, revealing that the number of F4/80 and S100A8 positive cells from either HDAC5 escapers or primary tumors were comparable in subcutaneous and orthotopic allograft models (Supplementary Fig. S5H). Thus, the HDAC5-driven TME remodeling and KRAS* bypass mechanism can occur in both subcutaneous or orthotopic tumors.
Figure 3. Neutrophil-to-macrophage switch in the tumor microenvironment of HDAC5 escapers.
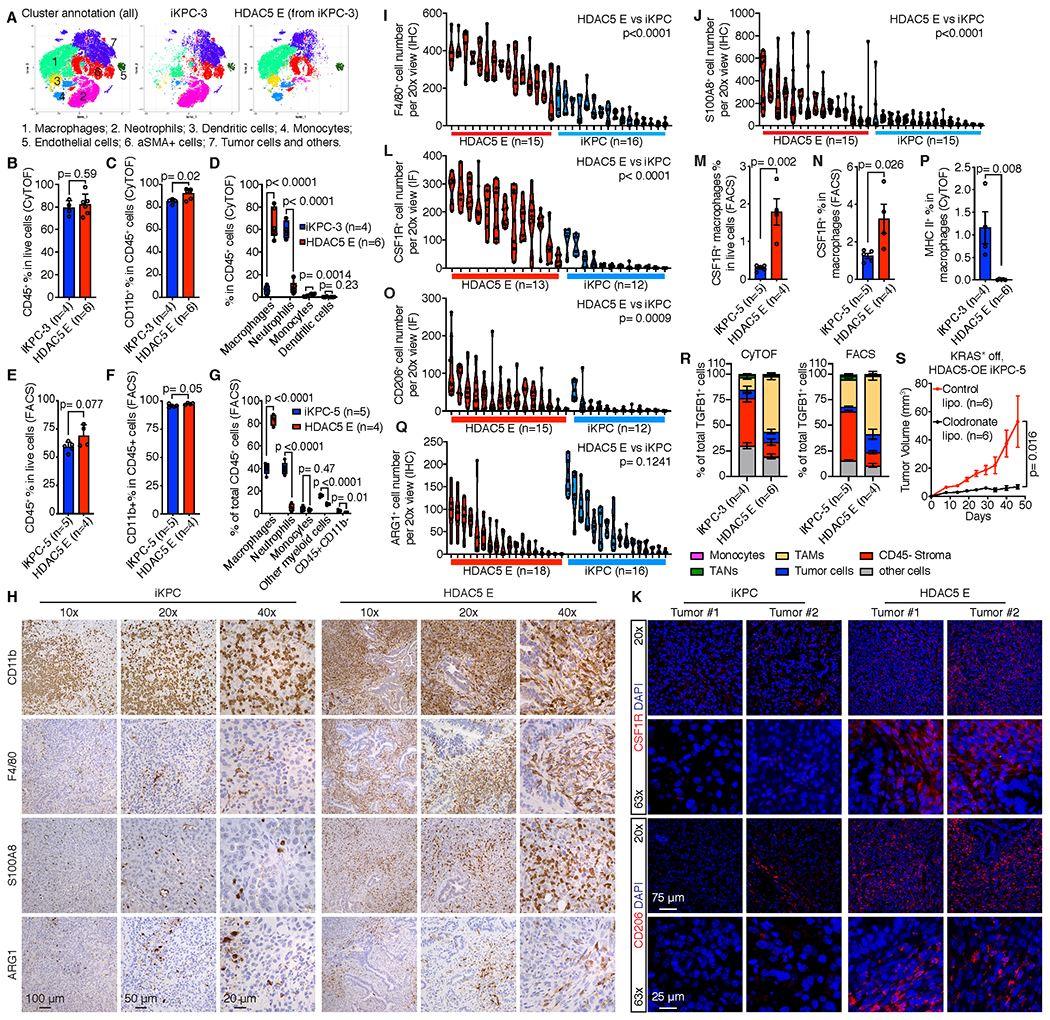
A, Phenographs display cell type annotations based on specific markers and distributions comparing iKPC-3 primary tumors (n=4) and HDAC5 escapers (n=6) derived from subcutaneous allografts in nude mice by CyTOF analysis. B-D, Percentage of infiltrated immune cells (CD45+) in all live cells (B), infiltrated myeloid cells (CD45+CD11b+) in immune cells (CD45+) (C) and myeloid cell populations in total immune cells (D) in iKPC-3 primary tumors and HDAC5 escapers derived from subcutaneous allografts in nude mice by CyTOF analysis. E-G, Percentage of infiltrated immune cells in all live cells (E), myeloid cells in all immune cells (F) and different immune cell populations in total immune cells (G) in iKPC-5 tumors (n=5) and HDAC5 escapers (n=4) derived from orthotopic allografts in nude mice by FACS analysis. H, Representative IHC staining of CD11b, F4/80, S100A8 and ARG1 in an iKPC primary tumor and an HDAC5 escaper. I, J and Q, Quantification of F4/80+ (I), S100A8+ (J) and ARG1+ (Q) cell numbers after IHC staining in iKPC primary tumors and HDAC5 escapers. Different columns indicate different tumors. Each circle dot indicates the cell number with positive staining in one 20x view. At least 5 different 20x views were counted for each tumor by ImageJ. K, Immunofluorescence (IF) staining of CSF1R and CD206 in iKPC tumors and HDAC5 escapers. L and O, Quantification of CSF1R+ (L) and CD206+ (O) cell numbers after IF staining in iKPC primary tumors and HDAC5 escapers. Different columns indicate different tumors. Each circle dot indicates the cell number with positive staining in one 20x view. At least 5 different 20x views were counted for each tumor by ImageJ. M-N, Percentage of CSF1R+ macrophages in all live cells (M) and in macrophages (N) comparing iKPC tumors and HDAC5 escapers by FACS analysis. P, Percentage of MHC II-positive cells in macrophages comparing iKPC tumors and HDAC5 escapers by CyTOF analysis. R, The cell type distributions of total TGFB-expressing cells in iKPC-5 primary tumors and HDAC5 escapers by CyTOF analysis (left) and in iKPC-3 primary tumors and HDAC5 escapers by FACS (right). S, Deletion of macrophages by chlodronate liposome impaired HDAC5-driven bypass of KRAS* dependency in iKPC cell transplanted model in nude mice (n = 6). For B-G and I-K and M-S, data are represented as mean ± SEM; two-tailed unpaired t tests were performed to calculate the p values.
Further analysis of TAMs in the HDAC5 escapers revealed increased CSF1R expression relative to KRAS*-expressing iKPC tumors by both immunofluorescence (IF) staining (Fig. 3K,L) and FACS analyses (Fig. 3M,N), and HDAC5 escaper cells also showed increased Csf1 (G-CSF) and decreased Csf2 (GM-CSF) expression (Supplementary Fig. S5I), patterns consistent with a shift from neutrophils to TAMs upon KRAS* bypass. To determine the macrophage phenotype, we analyzed expression of M1 macrophage marker MHC II and M2 macrophage markers CD206 and ARG1, showing a significant increase of CD206-positive cells and less MHC II-expressing cells in HDAC5 escaper tumors by IF staining (Fig. 3K,O) and CyTOF analysis (Fig. 3P, Supplementary Fig. S5J), respectively. No differences in the total number of ARG1-positive cells were observed by IHC analysis (Fig. 3H,Q), which may relate to ARG1 expression in tumor-associated-neutrophils (TANs) in KRAS*-expressing iKPC tumors. We also examined the origins of the TAMs using CXCR4 and CCR2 markers to distinguish tissue-resident and hematopoietic stem cell-derived (HSC-derived) macrophages, as previously reported (31). By FACS analysis, we found that the percentage of tissue-resident (CXCR4+CCR2+) and HSC-derived (CXCR4-CCR2+) macrophages in KRAS*-expressing iKPC tumors were 53% and 44%, respectively, while HSC-derived macrophages were increased in HDAC5 escaper tumors at 76% (Supplementary Fig. S5K,L), suggesting that TAMs in HDAC5 escaper tumors derive primarily from circulating macrophages via active recruitment.
Importantly, TGFβ1 was prominently expressed in TAMs in HDAC5 escapers by both CyTOF and FACS analysis, whereas CD45- cells were the primary source of TGFβ1 in KRAS*-expressing iKPC tumors (Fig. 3R). Moreover, both CyTOF and FACS analysis suggested that S100A8+ macrophages expressed higher TGFβ1 than S100A8- macrophages in HDAC5 escapers as well as primary tumors (Supplementary Fig. S5M–P). These data point to infiltrated TAMs, especially S100A8+ TAMs, as the prominent source of abundant TGFβ1 that facilitates bypass from KRAS* dependence. The necessity of TAM recruitment in HDAC5-driven bypass of KRAS* dependency was reinforced by clodronate liposome depletion of macrophages in allograft model in nude mice (32), showing profound impairment of KRAS* independent tumor growth of HDAC5-expressing iKPC cells (Fig. 3S). Thus, infiltrating TAMs play a key role in the bypass of KRAS* dependency in vivo.
HDAC5-Ccl2 promotes a shift of myeloid cell subsets in the TME
To elucidate whether HDAC5 actively mediates macrophage recruitment to the TME, we first compared chemokine expression profiles between KRAS*-expressing iKPC cells (n=3) and HDAC5 escaper cells (n=5) by RNA-seq analysis. Among all the chemokines expressed by the tumor cells, macrophage chemoattractant chemokines (Ccl2, Ccl7 and Cxcl10) and neutrophil chemoattractant chemokines (Cxcl1, Cxcl2 and Cxcl3) were upregulated in HDAC5 escaper cells relative to KRAS*-expressing iKPC cells (Fig. 4A). In particular, Ccl2 and Ccl7 were highly induced following KRAS* extinction in HDAC5 OE iKPC cells (Fig. 4B). Consistent with this observation, we demonstrated, in a chemoattraction assay using conditioned media from either HDAC5-OE or HDAC5D-OE iKPC cells, that macrophage attraction was HDAC5-dependent and greater with conditioned media from HDAC5 escaper cells than KRAS*-expressing iKPC cells (Fig. 4C,D, Supplementary Fig. S6A). Inhibition of CCR2 by CCR2 inhibitor (Santa Cruz Biotech, sc-202525), which is the receptor for CCL2 and CCL7 and is expressed on macrophages, blocked macrophage migration by conditioned media from either HDAC5-OE iKPC cells or HDAC5 escaper cells (Fig. 4C,D, Supplementary Fig. S6A). Thus, macrophages are actively attracted by HDAC5-OE cancer cells and HDAC5 escaper cells through their CCR2 receptor.
Figure 4. Macrophage infiltration is mediated by CCL2/CCL7-CCR2 axis.
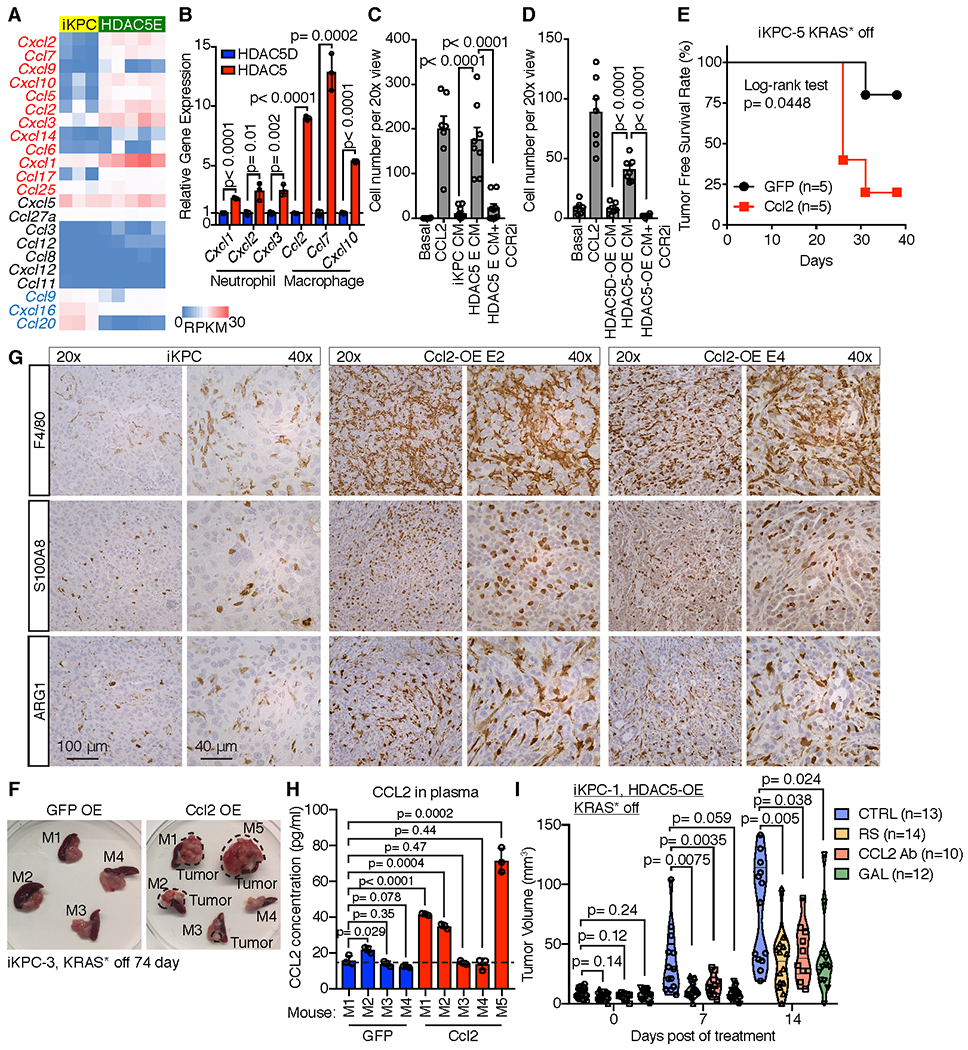
A, Comparison of chemokine expression in iKPC cells and HDAC5 escaper cells. Chemokines with logFC value (HDAC5E versus iKPC) more than 0.3 were labeled as red; Chemokines with logFC value less than 0.3 were labeled as blue. B, qRT-PCR analysis of chemokine gene expression comparing cells overexpressing HDAC5 and HDAC5D in iKPC cells 2 days after KRAS* extinction (n = 3). C, Comparison of macrophage migration efficiency chemoattracted by conditioned media from iKPC cells and HDAC5-driven escaper cells by transwell assay, with or without CCR2 inhibitor (CCR2i, 5 μM, n = 6). D, Comparison of macrophage migration efficiency chemoattracted by conditioned media from iKPC cells overexpressing HDAC5 and HDAC5D 2 days after KRAS* extinction, with or without CCR2 inhibitor (n = 6). For C and D, basal medium served as the negative control and CCL2 (200 ng/ml) treatment served as the positive control; data are represented as mean ± SEM. E, Tumor free survival analysis comparing subcutaneously transplanted iKPC-1 tumors with overexpression of GFP and Ccl2 w/o DOX feeding in nude mice (n = 5). The Log-rank (Mantel-Cox) test was performed to calculate the p value. F, Isolated pancreases transplanted with iKPC-3 cells overexpressing GFP or Ccl2 without Doxy feeding for 74 days from nude mice. Four mice in Ccl2 OE group (M1, M2, M3 and M5) had tumors as marked. M, mouse. G, IHC staining of F4/80, S100A8 and ARG1 in Ccl2 escapers and iKPC tumors. H, Analysis of CCL2 expression levels in mouse plasma by ELISA from corresponding mice in (F). I, Comparison of KRAS*-independent tumor growth of subcutaneously transplanted iKPC-1 cells in nude mice overexpressing HDAC5 among different treatments: vehicle control (VEH), CCR2 inhibitor RS 504393 (RS), CCL2 neutralizing antibody (CCL2 Ab), and TGFBR inhibitor Galunisertib (GAL). For B-D, H and I, two-tailed unpaired t tests were performed to calculate the p values. For B and H, data are represented as mean ± SD.
Most importantly, Ccl2 overexpression promoted KRAS*-independent tumor growth from two independent iKPC cells after KRAS* extinction in vivo in subcutaneous and orthotopic allograft mouse models in nude mice, respectively (Fig. 4E,F and Supplementary Fig. S6B). The Ccl2 escapers neither reactivated KRAS* transgene, nor increased expression of endogenous Kras or Yap1 (Supplementary Fig. S6C), and KRAS* signaling remained downregulated (Supplementary Fig. S6D). Moreover, we confirmed Ccl2 overexpression (Supplementary Fig. S6C) and abundant macrophage infiltration in these escapers (Fig. 4G), as well as the elevated CCL2 levels in mouse plasma with Ccl2 escapers (Fig. 4H). Thus, our data indicate the critical role of Ccl2-mediated macrophage infiltration in bypass of KRAS* dependency.
Finally, to examine the necessity of the CCL2-CCR2-TGFβ axis in the process of HDAC5-driven TAM recruitment and bypass of KRAS* dependency, we used the mouse CCL2 neutralizing antibody (CCL2 Ab), CCR2 inhibitor RS 504393 (RS) or TGFBR1 inhibitor Galunisertib (GAL) to block the axis in vivo. Inhibition of the CCL2-CCR2 axis impaired macrophage infiltration (Supplementary Fig. S6E) and KRAS* independent tumor growth of HDAC5-OE iKPC cells (Fig. 4I), implicating cancer cell-TAM crosstalk in the bypass of KRAS* dependency. In consistent with treatment data by TGFβ neutrualizing antibody, TGFBR1 inhibition blocked SMAD3 phosphorylation and attanuated HDAC5-driven bypass of KRAS* dependency in vivo (Fig. 4I, Supplementary Fig. S6E).
HDAC5 upregulates macrophage-recruiting chemokines via suppression of Socs3
To determine the genes that mediate chemokine induction by Hdac5, we performed HDAC5 specific Chromatin-Immuno-Precipitation Sequencing (ChIP-seq) and RNA-seq comparing HDAC5 knockdown and scrambled control in HDAC5 escaper cells. We intersected three datasets (Fig. 5A): (i) ChIP-seq data of HDAC5-bound gene promoters; (ii) RNA-seq data of differentially expressed immune pathway genes following shRNA-mediated HDAC5 depletion in HDAC5 escaper cells (n=5 each group); and (iii) RNA-seq data of genes down-regulated in HDAC5 escaper cells (n=5) versus KRAS*-expressing iKPC cells (n=4). This triangulation analysis identified 17 overlapping gene candidates as potential HDAC5 targets, which we ranked based on their p-values in the above RNA-seq datasets (Supplementary Fig. S7A). Among the top 5 candidates, we focused on Zfp36 and Socs3, because Zfp36 is known to promote AU-rich mRNA decay including Ccl2 mRNA in macrophages(33), and SOCS3 is known to repress STAT pathway activation (34) and negatively regulates IFNβ induced expression of Ccl2 and Cxcl10 in primary astrocytes (35). We validated that both Socs3 and Zfp36 expression were negatively regulated by HDAC5 (Fig. 5B–E, and Zfp36 data not shown), and that HDAC5 bound to the gene body and promoter regions of Socs3 and Zfp36 (Fig. 5F,G, and Zfp36 data not shown). Moreover, shRNA-mediated depletion of Socs3 upregulated Ccl2, Ccl7 and Cxcl10 (Fig. 5H), but not so for Zfp36 (Supplementary Fig. S7B). Together, these studies establish that HDAC5 regulates Socs3 expression and that Socs3 can repress the expression of key macrophage chemo-attractants.
Figure 5. HDAC5 regulates expression of macrophage-recruiting chemokines through Socs3.
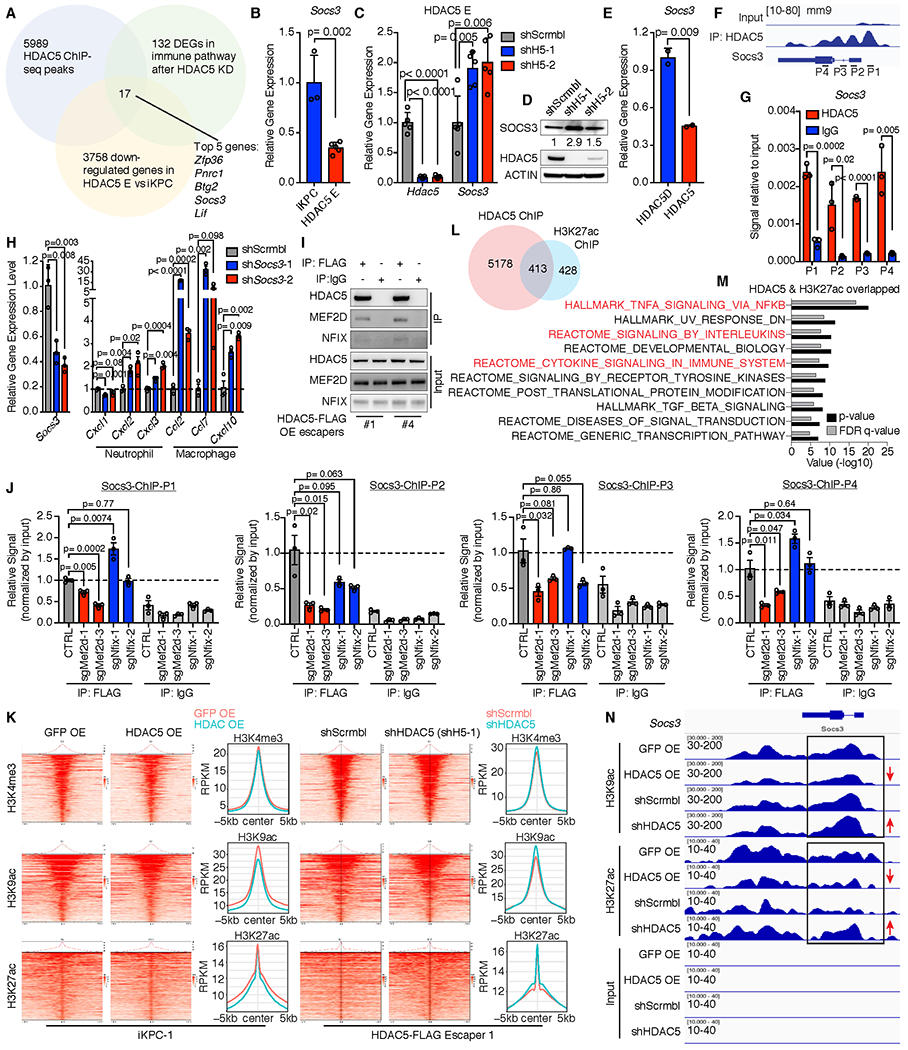
A, Exploration of HDAC5 targets by overlapping 3 profiling datasets: 5589 HDAC5 binding genes from ChIP-seq data, 131 differentially expressed genes (DEGs) in immune pathways after knockdown of HDAC5 comparing to scramble control in HDAC5-driven escaper cells, and 3758 downregulated genes in HDAC5-driven escaper cells comparing to iKPC cells. Seventeen candidate genes were filtered out and ranked by p-values in the 2 RNA-seq datasets from low to high. Top 5 candidates are represented. B, Comparison of Socs3 expression in iKPC cells and HDAC5-driven escaper cells. C and D, Upregulation of Socs3 expression after knockdown of HDAC5 in HDAC5-driven escapers at mRNA level (C) and protein level (D). E, Comparison of Socs3 expression in iKPC cells overexpressing HDAC5D and HDAC5. F, Binding sites of HDAC5 on Socs3 promoter and gene body region from ChIP-seq data. P1-P4 are primers designed for ChIP-q-PCR validation. G, ChIP-q-PCR validation of the binding of HDAC5 on Socs3 promoter and gene body regions. H, Gene expression of neutrophil- and macrophage-attracted chemokines after knockdown of Socs3 in iKPC cells. I, Validation of interactions between HDAC5 and NFIX or MEF2D by co-IP/WB analysis. J, HDAC5-ChIP-q-PCR analysis of HDAC5 escaper cells with scramble control and with knockdown of Nfix or Mef2d. Data are represented as mean ± SEM, and two-tailed unpaired t tests were performed to calculate the p values. K, Heatmaps of overall peak locations relative to the TSS for H3K4me3, H3K9ac and H3K27ac in GFP-OE and HDAC5-OE iKPC-1 samples as well as in HDAC5-FLAG escaper #1 cells with scramble control and HDAC5 knockdown (shH5-1). L, Schematic display of the overlapped genes that are bound by HDAC5 and marked by H3K27ac. M, GSEA analysis of the overlapped genes that are bound by HDAC5 and marked by H3K27ac. N, Histone acetylation marker status at Socs3 loci in the two comparison groups. For B, C, E, G and H, data are represented as mean ± SD, and two-tailed unpaired t tests were performed to calculate the p values.
To investigate how HDAC5 binds to Socs3 gene promoter and body regions, we first performed co-immunoprecipitation (co-IP)/ mass spectrometry (MS) analysis of FLAG-tagged HDAC5 using FLAG antibody and identified a transcriptional factor, MEF2D, and a nuclear factor, NFIX, that may bind to HDAC5 (Supplementary Fig. S7C). The interactions were validated by co-IP/western blot analysis in an independent experiment (Fig. 5I), indicating that MEF2D and NFIX may form a co-repressor complex with HDAC5 (Supplementary Fig. S7D) and mediate the recruitment of HDAC5 to Socs3. To examine the requirement of NFIX and MEF2D for the specific DNA binding of HDAC5 co-repressor complex, we depleted Nfix or Mef2d in HDAC5 escaper cells (Supplementary Fig. S7E,F) and examined the binding of HDAC5 at Socs3 loci by ChIP-q-PCR analysis. Depletion of Mef2d, but not Nfix, interfered with the binding of HDAC5 to Socs3 gene promoter and body regions (Fig. 5J), suggesting that Mef2d mediates the specific Socs3 binding of HDAC5 co-repressor complex.
To understand the epigenetic reprogramming by HDAC5, a histone deacetylase, we performed ChIP-seq of two major histone acetylation marks, histone H3 lysine 9 acetylation (H3K9ac) and H3K27ac, as well as one histone methylation mark, H3K4me3, all of which indicate active gene transcription. We compared H3K4me3, H3K9ac and H3K27ac in GFP- and HDAC5-OE iKPC-1 cells, and in a FLAG-tagged HDAC5-driven escaper (HDAC5-FLAG Escaper 1) with scrambled control and HDAC5 depletion for 7 days. Overexpression of HDAC5 in iKPC cells decreased the overall H3K9ac and H3K27ac modification of the TSS regions, while knockdown of HDAC5 in HDAC5 escapers increased these modifications (Fig. 5K). However, H3K4me3 modification did not change significantly following HDAC5 overexpression or depletion (Fig. 5K). We compared the annotated genes that are bound by HDAC5 and marked by H3K27ac, and found 413 overlapping genes (Fig. 5L). GSEA analysis showed that these overlapped genes were significantly enriched in several inflammatory related pathways (Fig. 5M). Examination of the Socs3 locus confirmed that H3K9ac and H3K27ac marks at Socs3 promoter and gene body regions were decreased upon HDAC5 overexpression in iKPC cells and upregulated by HDAC5 depletion in HDAC5 escaper cells (Fig. 5N). Thus, HDAC5 suppresses the expression of inflammatory related genes including Socs3 via histone deacetylation of H3K27 and K3K9.
Derepression of Hdac5 expression upon inhibition of KRAS* signaling
To further investigate whether HDAC5 activation can serve as a key mechanism for KRAS* bypass in the iKPC PDAC model, we examined and observed consistent upregulation of Hdac5 expression in de novo generated KRAS*-negative escapers compared to primary iKPC tumors (Supplementary Fig. S8A), in iKPC allograft tumors following KRAS* extinction at 24 hours (Fig. 6A, Supplementary Fig. S8B), and in PDAC surviving cells after KRAS* ablation in iKPC model (36) (Supplementary Fig. S8C) by gene expression analysis as well as western blot validation (Fig. 6B,C). Next, inhibitors of MEK, PI3K and mTOR were used to explore which KRAS* pathway components (16) might regulate Hdac5, revealing Hdac5 up-regulation with MEK inhibition (Trametinib) in KRAS*-expressing iKPC cells (Fig. 6B; Supplementary Fig. S2B, S8D) and KRAS*-expressing iKPC tumors (Fig. 6D, Supplementary Fig. S8E). Trametinib treatment also increased S100a8 and Ccr2 expression (Fig. 6D), and accompanied increased infiltration of F4/80+ and S100A8+ cells (Fig. 6E,F) in iKPC tumors. Finally, de novo generated KRAS*-independent escapers showed decreased Csf2 and increased Ccl2, Ccl7, Cxcl10 and Csf1 expression relative to KRAS*-expressing iKPC tumors (Supplementary Fig. S8F), consistent with neutrophil-to-macrophage remodeling in these escaper tumors.
Figure 6. HDAC5 is upregulated after inhibition of KRAS*.
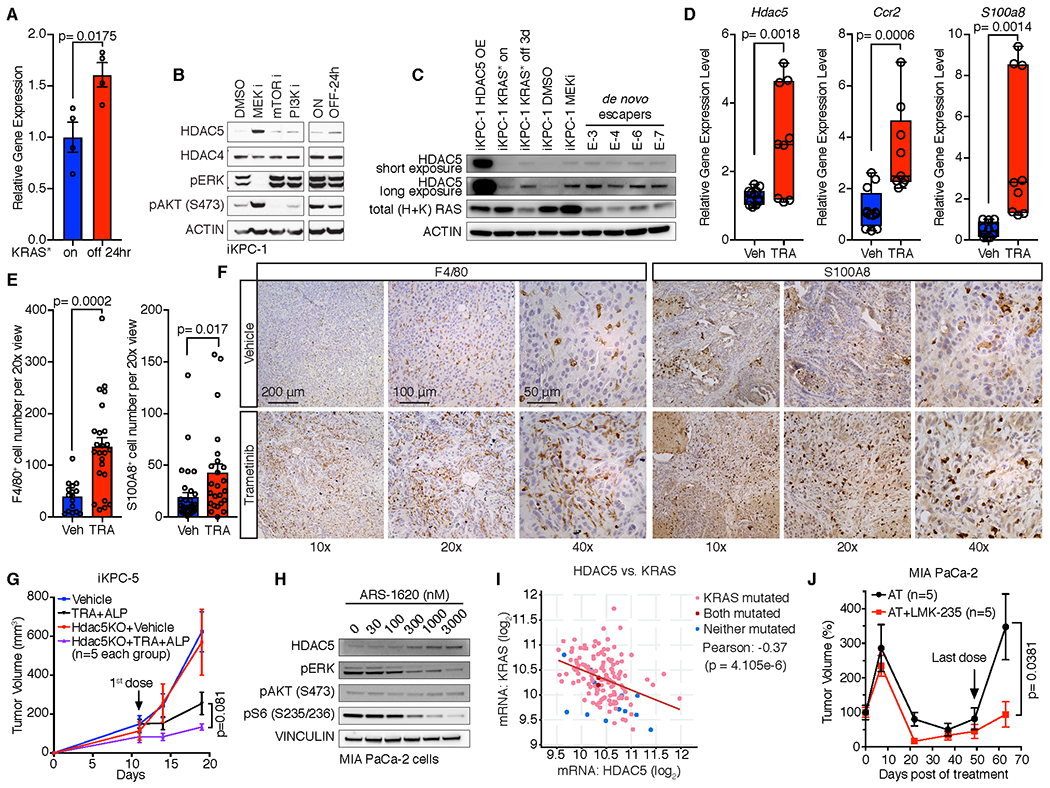
A, Hdac5 expression in KRAS*-expressing iKPC tumors and tumors after KRAS* extinction for 24 hours. B, Western blot analysis of HDAC5 expression in iKPC-1 cells following treatment with DMSO control, MEK inhibitor (Trametinib, 50nM), PI3K inhibitor (Ly294002, 2 μM) and mTOR inhibitor (Rapamicin, 100nM), and in iKPC-1 cells w/ and w/o DOX treatment for 24 hours. C, Western blot analysis of HDAC5 protein levels in HDAC5-OE iKPC-1 cells, KRAS* on and off iKPC-1 cells, MEK inhibited iKPC-1 cells, and four de novo generated escaper cells. D-F, Comparison of mRNA expression of Hdac5, S100a8 and Ccr2 (D), quantification of F4/80+ and S100A8+ cells (E), and IHC analysis of F4/80 and S100A8 (F) in orthotopically transplanted iKPC-5 tumors treated with vehicle control (n = 4) or Trametinib (n = 3, 0.3 mg/kg, oral, daily) in C57BL/6 mice. For E, eight images were taken for each tumor and counted, and data are represented as mean ± SEM. G, Knockout of Hdac5 in combination with MEK inhibitor Trametinib (TRA) and PI3Kα inhibitor Alpelisib (ALP) impaired subcutaneously transplanted iKPC-5 tumor growth in nude mouse (n = 5). H, Western blot analysis of HDAC5 expression after treatment with KRASG12C inhibitor ARS-1620 in human MIA PaCa-2 PDAC cells. I, Correlation analysis between HDAC5 and KRAS mRNA expression in TCGA PAAD dataset by cBioPortal. The p value was calculated by two-sided t-test. J, Comparison of MIA PaCa-2 subcutaneous xenograft tumor growth between treatment with dual inhibitor combination of ARS-1620 (200 mg/kg, oral, q.d.) and Trametinib (1 mg/kg, oral, q.d.) and triple inhibitor combination of ARS-1620 (200 mg/kg, oral, q.d.), Trametinib (1 mg/kg, oral, q.d.) and LMK-235 (5 mg/kg, i.p., q.d.) in nude mice. For A and E, data are represented as mean ± SEM. For A, D, E, G and J, two-tailed unpaired t tests were performed to calculate the p values.
To assess the therapeutic potential of dual inhibition of HDAC5 and KRAS* signaling, we first compared tumor growth of iKPC tumors that are either null or wildtype for Hdac5. To inhibit KRAS* signaling, we inhibited both MEK and PI3K (Supplementary Fig. S8G) given the compensatory signaling when either MEK or PI3K are inhibited (37). Indeed, dual inhibition of MEK and PI3K effectively impaired KRAS*-dependent iKPC tumor growth whereas monotherapy did not (Supplementary Fig. S8G) and, while Hdac5 deletion had no impact on tumor growth at baseline, the loss of Hdac5 enhanced the anti-tumor activity of dual MEK and PI3K inhibition (Fig. 6G).
In KRASG12D mutated human PDAC cell lines, MEK inhibition also upregulated HDAC5 expression (Supplementary Fig. S8H). Similar to cancer cells harboring KRASG12D allele, PDAC and non-small cell lung cancer (NSCLC) cell lines with the KRASG12C mutation showed HDAC5 upregulation upon treatment with the KRASG12C inhibitor ARS-1620 (Fig. 6H, Supplementary Fig. S8I), indicating that the KRAS*-HDAC5 relationship occurs across various KRAS mutant alleles in different cancer types. Moreover, we found a significant negative correlation between KRAS mRNA expression and HDAC5 mRNA expression in human PAAD TCGA datasets (Fig. 6I).
To validate the enhanced anti-tumor effect of dual inhibition of HDAC5 and KRAS* signaling in human PDAC xenograft models, we first determined the pharmacodynamics (PD) of the KRASG12C inhibitor ARS-1620 alone and the combination with MEK inhibitor Trametinib (Supplementary Fig. S8J). We found that ARS-1620 alone effectively blocked KRAS* major downstream signaling pathways, MEK/ERK and PI3K/AKT, at 12 hours, but this effect was attenuated by 24 hours after dosage (Supplementary Fig. S8J). In contrast, the combination of ARS-1620 (200 mg/kg, q.d.) and Trametinib (1 mg/kg, q.d.) maintained effective inhibition of KRAS* signaling for 24 hours (Supplementary Fig. S8J). Comparison of triple combination treatment of ARS-1620, Trametinib and the HDAC4/5 inhibitor LMK-235 versus dual treatment of ARS-1620 and Trametinib in MIA PaCa-2 xenograft model in nude mice revealed that triple combination was superior to dual treatment in impairing tumor growth (Fig. 6J).
HDAC5-CCL2/CCR2-TGFβ/SMAD4 promotes KRAS* bypass in syngeneic PDAC models
In both subcutaneous and orthotopic settings, enforced HDAC5 or Ccl2 expression promoted KRAS* independent tumor recurrence in two independent iKPC syngeneic cell lines in immune competent C57BL/6 hosts (Fig. 7A–C; Supplementary Fig. S9A). IHC analysis showed that all escaper tumors lacked pERK signal and possessed abundant F4/80+ macrophages, yet similar numbers of CD8+ T cells compared to their corresponding parental KRAS*-expressing tumors (Fig. 7D,E). Additionally, qRT-PCR analysis of these escaper tumors confirmed presence of HDAC5 or Ccl2 transgene expression and absence of KRAS*, endogenous Kras or Yap1 expression (Supplementary Fig. S9B). Western blot analysis further confirmed absence of KRAS* signaling in escaper tumors (Supplementary Fig. S9C). In assessing the TME, FACS analysis of orthotopic HDAC5-induced escaper and primary tumors showed that, while total immune and myeloid cell percentages were similar (Fig. 7F,G), a prominent neutrophil-to-macrophage switch was detected in the escapers (Fig. 7H, Supplementary Fig. S9D), a finding consistent with those in immunodeficient hosts. CyTOF analysis mirrored a similar myeloid cell type switch (Supplementary Fig. S9E). In contrast, other immune cell types, CD4+ and CD8+ T cells, B cells and NK cells showed no or modest differences in percentages (Fig. 7H; Supplementary Fig. S9E). FACS analysis of TGFβ1+ cell types in the HDAC5 escaper and KRAS*-expressing tumors revealed that TAMs were the major fraction in HDAC5 escaper tumors in these immune competent hosts, similar to the findings in immunodeficient mice (Fig. 7I). Comparision of TAM populations of HDAC5 escaper and KRAS*-expressing tumors in immune competent hosts showed similar ARG1+ percentages (Fig. 7J), but higher CD206+ and lower MHCII+ and iNOS + TAMs in the HDAC5 escaper tumors (Fig. 7K–M), a finding consistent with an M2-like phenotype.
Figure 7. HDAC5 promotes KRAS* bypass and the therapeutic benefits of co-targeting HDAC5-CCL2/CCR2-TGFβ/SMAD4 axis and KRAS* signaling in syngeneic PDAC model.
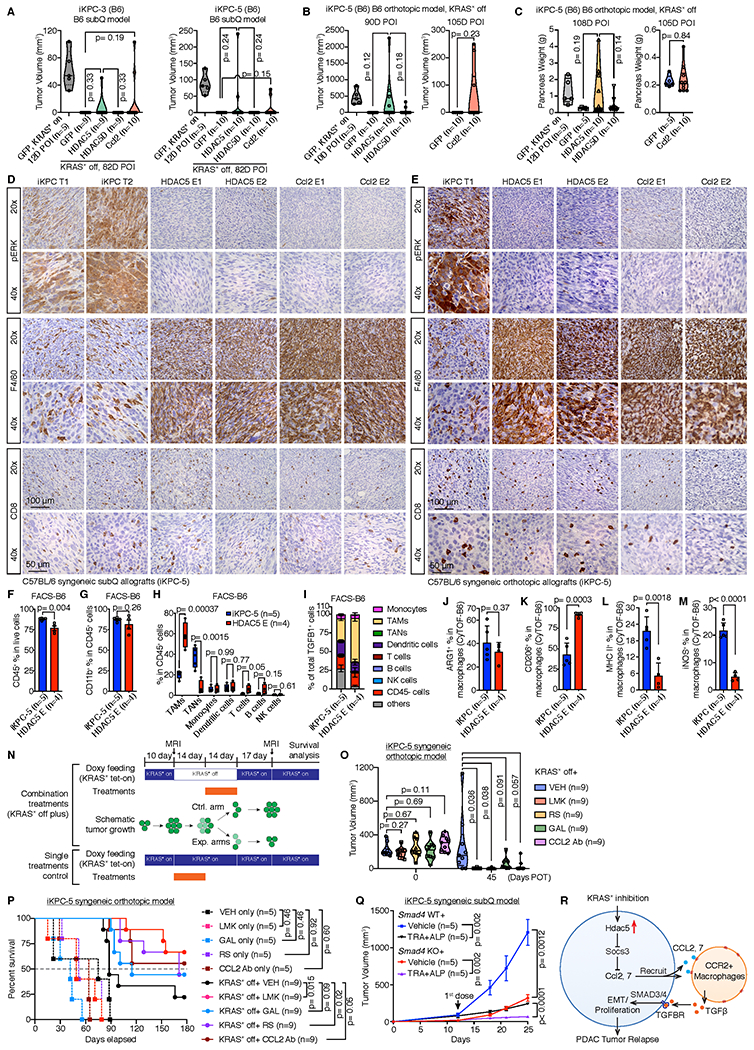
A, HDAC5 and Ccl2 promoted two different iKPC cells to bypass KRAS* dependency in subcutaneous allograft models in C57BL/6 syngeneic mice. B, Tumor volume analysis of C57BL/6 mice orthotopically transplanted with GFP-, HDAC5- or HDAC5D-OE iKPC-5 cells. Mice were given normal water to extinct KRAS* expression. MRI imaging was performed to measure the tumor size at indicated time points. C, Pancreas weight analysis from C57BL/6 mice orthotopically transplanted with GFP-, HDAC5- or HDAC5D-OE iKPC-5 cells at day 108 after KRAS* extinction. D and E, Characterization of HDAC5 escapers and Ccl2 escapers generated in subcutaneous (D) and orthotopic (E) allograft models in C57BL/6 mice by IHC staining of pERK, F4/80 and CD8. The iKPC-5 tumors were used as control. F-H, FACS analysis of iKPC-5 primary tumors (n=5) and HDAC5 escapers (n=4) from orthotopic allograft models in C57BL/6 mice, including quantification of total immune cells (F), total myeloid cells (G), and analysis of immune cell subtypes (H). I, Quantification of cell type distributions in total TGFβ high cells derived from iKPC-5 primary tumors (n=5) and HDAC5 escapers (n=4) from orthotopic allograft models in C57BL/6 mice by FACS analysis. J-M, Percentages of ARG1+ (J), CD206+ (K), MHCII+ (L) and iNOS+ (M) cells in macrophages from iKPC-5 primary tumors and HDAC5 escapers from orthotopic allograft models in C57BL/6 mice by CyTOF analysis. N, The combination treatment strategy with KRAS* inhibition (by removal of DOX feeding) in iKPC-5 orthotopic allograft model in C57BL/6 mice. Cells were orthotopically transplanted in C57BL/6 mice and the mice were given DOX water to activate KRAS* expression. After 10 days, MRI imaging were performed to measure the tumor sizes (Day 0 post-treatment (POT)). Next, DOX was removed to inactivate KRAS* expression for 28 days. Inhibitors targeting the HDAC5-TGFBR-CCL2-CCR2 axis were dosed at day 14 day after KRAS* inactivation. Fourteen days later, all treatments were stopped and mice were given DOX water again to reactivate KRAS* expression. Tumor sizes were measured 45 days POT, and all the mice were kept for survival analysis. O, Comparison of iKPC-5 tumor growth among different treatments with or without KRAS* inhibition: vehicle control (VEH), Class IIa HDAC4/5 inhibitor LMK-235 (LMK), CCR2 inhibitor RS 504393 (RS), TGFBR inhibitor Galunisertib (GAL) and CCL2 neutralizing antibody (CCL2 Ab). P, The Kaplan–Meier survival analysis of different treatment groups in (O). The Gehan-Breslow-Wilcoxon tests were performed to calculate the p values. Q, Knockout of Smad4 in combination with TRA and ALP impaired subcutaneously transplanted iKPC-5 tumor growth in C57BL/6 mice (n=5). R, Schematic graph of the bypass mechanism of KRAS* dependency and therapeutic strategy. For F-M and Q, data are represented as mean ± SEM. For A-C, F-M, O and Q, two-tailed unpaired t tests were performed to calculate the p values.
Synergistic anti-tumor impact with inhibition of the HDAC5-CCL2/CCR2-TGFβ/SMAD4 and KRAS* signaling pathways in syngeneic PDAC models
Next, we explored the anti-tumor impact of pharmacological inhibition of HDAC5-CCL2/CCR2-TGFβ/SMAD4 and/or extinction or pharmacological inhibition of KRAS* signaling pathways in orthotopic iKPC tumors in immune competent hosts. As shown in Fig. 7N, DOX was removed for a total of 4 weeks to extinguish KRAS* in established tumors and, at 2 weeks following DOX withdrawal, mice were dosed for 2 weeks with vehicle control (VEH), HDAC4/5 inhibitor (LMK-235, LMK), TGFBR1 inhibitor (Galunisertib, GAL), CCR2 inhibitor (RS504393, RS), or mouse CCL2 neutralizing antibody (CCL2 Ab). Tumor growth was measured by MRI imaging at Day 10 after orthotopic cell transplantation, and at Day 45 post-treatment (POT). The anti-tumor impacts of these drugs were also tested in tumor-bearing mice maintained on DOX (Fig. 7N). Combined KRAS* extinction and these drug treatments exhibited impairment of tumor growth and increased survival by Kaplan-Meier analysis compared with KRAS* extinction alone, with greatest impact achieved with LMK or RS treatment (Fig. 7O–P). In contrast, these drug treatments had minimal or no impact on tumor growth and survival in KRAS*-expressing iKPC tumors (Fig. 7O–P). Finally, we compared tumor growth of Smad4 null versus and wildtype iKPC-5 tumors in immune competent hosts and showed that MEK and PI3K inhibition exerts a more potent anti-tumor impact in the Smad4 null tumors (Fig. 7Q, Supplementary Fig. S9F). Together, these data support the view that the HDAC5-CCL2/CCR2-TGFβ/SMAD4 pathway plays a crtical role in supporting KRAS*-independent tumor growth in PDAC with intact canonical TGFβ pathway.
Discussion
In this study, we report that HDAC5 overexpression enables KRAS*-independent tumor growth via remodeling of heterotypic cancer-host cell interactions in the TME. Mechanistically, HDAC5 suppresses Socs3 which results in upregulation of Ccl2 and Ccl7 expression and a shift in TME myeloid cell types from neutrophils to CCR2-expressing macrophages. In HDAC5 escapers, these macrophages express abundant TGFβ that activates pSMAD3/SMAD4 signaling in cancer cells and enables KRAS*-independent tumor growth (Fig. 7R). Our work establishes TME crosstalk as a mechanism for escape from KRAS* dependency or pharmacological inhibition of its pathway. From a clinical translation standpoint, the importance of activated TGFβ-SMAD4 signaling in KRAS* bypass and the high frequency of SMAD4 loss in human PDAC (38) supports clinical testing of KRAS* pathway inhibitors in SMAD4-null PDAC cases. In addition, our work justifies the preclinical and clinical testing of combined inhibition of the TGFβ/TGFBR axis or CCL2/CCL7-CCR2 axis along with KRAS* pathway inhibitors in SMAD4-intact PDAC cases.
The emergence of disease recurrence is a common clinical reality of therapies targeting driver oncogenes (39). In addition to HDAC5-driven immune cell remodeling, the mechanisms underlying bypass of KRAS* dependency in PDAC also includes Yap1 amplification (40) and activated Receptor Tyrosine Kinases (RTKs) (41). While RTK pathways promote PDAC cell survival through activation of the PI3K/AKT pathway, YAP1 and HDAC5 escapers activate networks enriched in proliferation signatures, suggesting that sustaining cell survival or proliferation can contribute to tumor relapse after KRAS* extinction. In contrast to YAP1 or RTKs bypass involving cancer cell intrinsic mechanisms, HDAC5-induced bypass is distinct through its paracrine actions to recruit immune cells that enables oncogene-extinction resistance. Specifically, TGFβ is shown to serve as a key factor mediating immune cell support of cancer cell survival upon extinction of KRAS*. Our work highlights potential therapeutic opportunities to enhance the effectiveness of therapies targeting KRAS* and its pathway.
HDAC5 expression is transcriptionally upregulated upon KRAS* signaling inhibition in both mouse and human PDAC cells, suggesting that the HDAC5 expression is regulated by transcription factor(s) or epigenetic regulator(s) that are tightly controlled by KRAS* signaling. We observed dramatic changes in the transcriptome and metabolome of iKPC model upon extinction of KRAS* expression at 24 hours (5), and these molecular events may promote upregulation of HDAC5 expression. The possible regulatory factors include downstream effectors of MAPK and PI3K/AKT signaling pathways (Fig. 6), as well as RTKs (41) and JAK/STAT (42). There are several transcriptional factor binding sites in HDAC5 promoter region including STATs. Further work is needed to determine the precise molecular regulatory mechanism directly controlling HDAC5 expression by KRAS* signaling.
TGFβ is a multifunctional factor that has complex impact on different cell types in the TME. In PDAC, the TGFβ/SMAD4 pathway is considered to be tumor suppressive as its activation impairs cancer cell growth (43). At the same time, TGFβ can promote tumor growth via suppression of cytotoxic function of effector T cells (44), activation of cancer associated fibroblasts (45), and induction of angiogenesis (46). The contrasting effects of TGFβ on tumorigenesis makes it a challenging target as the clinical outcome of blocking this pathway is predicted to be highly context-dependent. Consistent with previous studies, our work establishes that TGFβ can attenuate cell proliferation in KRAS*-expressing PDAC cells (Supplementary Fig. S3G), but can promote KRAS*-independent PDAC cell growth after KRAS* inhibition in both mouse and human PDAC cells. Along these lines, it is notable that TGFβ drove KRAS* independency more effectively when KRAS* was more strongly inhibited, and depletion of SMAD4 synergistically impaired colony formation with high dosage of KRAS* inhibitor. Thus, in PDAC, KRAS* signaling inhibition can alter cancer cell responses to TGFβ from a cell cycle arrest to pro-proliferation response.
As noted, the opposing actions of TGFβ in tumor biology have presented challenges in targeting TGFβ signaling pathway in the clinic (47), the findings of this study suggests that dual inhibition of KRAS* and TGFβ/SMAD4 signaling pathway may provide an effective therapeutic strategy in PDAC, as this strategy would impair KRAS*-dependent cancer cell growth and relieve TGFβ-induced immune suppression, as well as thwart KRAS*-independent cancer cell survival. Additionally, we propose that SMAD4 status, which is a frequent deletion event in PDAC (2), should be assessed as patient inclusion criteria for clinical trials testing KRAS* inhibitors. We speculate that SMAD4 deficient PDAC cases are likely to experience more durable responses to KRAS* inhibition, while SMAD4 intact cases may be predisposed to become resistance due to TGFβ/SMAD4 signaling activation induced by infiltrated macrophages.
The tumor-associated neutrophil to macrophage remodeling observed in HDAC5 escapers may result from the combined impact of KRAS* extinction and HDAC5 overexpression. KRAS* extinction may decrease tumor associated neutrophils via downregulation of key factors such as GM-CSF and G-CSF; while HDAC5 overexpression increases CCL2 and CCL7, which recruit macrophages via binding to the receptor CCR2. These TAMs express CSF1R, CD206 and Arginase-1, representing an immature immune suppressive phenotype. It is also notable that de novo KRAS*-independent escapers downregulate Csf2 and upregulate Ccl2, Ccl7, Cxcl10 and Csf1 (Supplementary Fig. S8F) which would also drive neutrophil-to-macrophage remodeling, indicating that this mechanism is a hallmark of KRAS*-independent escapers. TAMs have been implicated in EGFR inhibitor resistance in lung cancer and gemcitabine resistance in PDAC (48, 49), suggesting that targeting the CCL2/CCL7-CCR2 axis may enhance therapeutic responses across multiple tumor types. Along these lines, it is noteworthy that the CCR2 inhibitor PF-04136309 is well-tolerated and shows promising clinical benefit in combination with FOLFIRINOX in advanced PDAC with an objective response rate at 40% in a phase 1b study (50). These results, together with our study, justifies the combined testing of PF-04136309 and KRAS* inhibitors in PDAC. Additionally, since the KRASG12C inhibitors are being tested in clinical trials now, our studies encourage the evaluation of HDAC5 and TGFβ receptors as well as neutrophil to TAMs remodeling as biomarkers of therapeutic responses. Finally, our work provides several therapeutic targets which may enhance the effectiveness of KRAS* inhibitors including inhibitors of HDAC5, TGFβ, TGFβ receptors, CCL2, CCL7, and CCR2.
Methods
Transgenic Mice
Mouse experiments were approved by MD Anderson Cancer Center’s Institutional Animal Care and Use Committee (IACUC). The iKPC mice, harboring TetO_Lox-Stop-Lox-KrasG12D, ROSA26-LSL-rtTA-IRES-GFP, p48-Cre and Trp53L/+ as described previously (5), were kept in FVB/C57BL/6 hybrid background and pure C57BL/6 at MD Anderson. We gave mice doxycycline water (2 mg/ml, ad lib) starting at 4-weeks of age to activate transgenic KrasG12D expression.
Establishment of Primary iKPC PDAC cell lines and 3-D spheroid culture
Tumor Dissociation Kit (Miltenyi Biotec) was used to dissociate tumors from the iKPC mouse model. Isolated single cells were cultured in RPMI1640 +10% Tet-approved FBS (Clontech) + Pen-Strep with doxycycline (1 μg/ml, Clontech) in 10-cm cell culture dishes (Falcon). For Matrigel-based 3-D cell culture, 400-2000 iKPC cells were mixed with 50 ul growth factor-reduced Matrigel (Corning) and plated in 24-well low attachment cell culture plates (Thermo). For Methylcellulose-based 3-D cell culture, the formation of 100 ml semi-solid medium contained 40 ml MethoCult™ (Stem Cells, Inc.), 48.6 ml RPMI1640, 10 ml Tet-approved FBS, 0.4 ml Glutamine and 1 ml Pen-Strep. 10,000 iKPC cells were mixed with 1 ml MethoCult™ media, and plated in 12-well low attachment cell culture plates (Thermo). For soft agar-based 3-D cell culture as described previously (51), 0.7 ml 0.6% soft agar was as bottom layer, and 100,000 iKPC cells were suspended in 0.7 ml 0.3% soft agar as top layer. Culture medium was added on top of agar layers. Culture media was the same as that used in 2-D culture. For bypass of KRAS* dependency experiments, doxycycline was removed from culture medium. Mycoplasma detection was performed monthly (Lonza) to ensure no contamination.
Plasmid construction, Gene knockdown and knockout
Human epigenetic regulatory genes (n = 284) were cloned into pHAGE lentivirus vector (EF1α promoter-ORF-IRES-eGFP) by Gateway cloning. (listed in Supplementary Table 1). Luciferase-mCherry vector for bioluminescent imaging was described previously(17). To disassociate HDAC5 from HDAC3 co-repressor complex and inactivate the deacetylase function, we mutated the DNA sequence of HDAC5 ORF (NM_005474.4) at C2497 to G and A2498 to C using QuikChange™ Site-Directed Mutagenesis Kit (Agilent) to change HDAC5 protein active site Histidine 833 to Alanine(27). Ccl2 (NM_011333.3) ORF was cloned into pHAGE lentivirus vector by Gateway cloning.
All shRNAs targeting Smad2, Smad3, Smad4, Socs3 and Zfp36 were purchased from Sigma. The sgRNA CRISPR/Cas9 All-in-One Vector sets to knockout Hdac5, Smad4, SMAD4, Nfix and Mef2d were purchased from Applied Biological Materials, Inc. All the sequences are listed in Supplementary Table 3.
TCGA data analysis
TCGA pancreatic (PAAD) clinical outcome and mRNA expression data were obtained from GDAC data portal (2016-01-26 archive). Survival outcome analysis including Kaplan-Meier curve and log-rank test was implemented in R. TGFβ signature genes were previously described (52).
Cell Transplantation
Nude mice and C57BL/6 mice were purchased from Taconic or MD Anderson’s Department of Experimental Radiation Oncology (ERO) core facility for transplant experiments. Cells were washed with PBS and resuspended in Opti-MEM (Gibco) before transplantation. To control the size of tumors, we transplanted iKPC cells subcutaneously at 200,000 cells per injection (100μl) for KRAS*-dependent tumor growth experiments, and gave mice doxycycline water starting immediately after transplantation. We transplanted 500,000 cells (100μl) per injection for KRAS*-independent tumor growth experiments, with no doxycycline water treatment during the whole process. To mimic the tumor microenvironment, we resuspended iKPC cells in Opti-MEM and mixed it with same volume Matrigel (Corning). Cell mixtures (10μl; 500,000 cells) were orthotopically transplanted in one pancreas.
Bioluminescent imaging
The iKPC cells were transfected with luciferase-mCherry reporter as described previously (17). Each mouse was injected with 1.5 mg D-Luciferin (Perkin Elmer) intraperitoneally (100 μl) and imaged using IVIS Spectrum Imaging System (Perkin Elmer) after 10 minutes. Images were acquired and analyzed by the Living Image 4.3 software (Perkin Elmer).
RNA extraction, qRT-PCR, mRNA sequencing and GSEA analysis
RNA Extraction Kit (Qiagen) was used to extract RNA from tumor and cell samples. RNA concentration was determined by Nanodrop 2000 (Thermo). The RNA samples were either sent for RNA sequencing analysis to DNA Analysis Core Facility in MD Anderson, or reverse transcribed for qRT-PCR analysis.
5x All-In-One RT MasterMix (abmGood) was used to prepare cDNA. We used SYBR Green PCR Master Mix (Applied Biosystems) to prepare the PCR reactions. qRT-PCR was performed using 7500 Fast Real-time PCR system, and the data were recorded and analyzed by 7500 software v2.3. We used GraphPad Prism 7.0c for statistical analysis.
For mRNA sequencing, the parameters were NGS-75 nt Paired End, using Illumina Next Generation Sequencing-HiSeq2000 instrument. Data were processed as previously described (53). GSEA analysis were performed using the GSEA software (54, 55). The GEO accession numbers of all the four RNA-seq datasets are GSE149126, GSE149127, GSE149129 and GSE149130.
Antibodies, western blot, IP, co-IP/MS, IHC, IF and ELISA
Antibody information is listed in Supplementary Table 2. Western blot, IP, co-IP, IHC and IF staining were performed following standard protocols as previously described (5, 51). Mass spectrometry analysis of proteins pulled down by FLAG-tagged HDAC5 were performed by Proteomics Core Facility at The University of Texas Southwestern Medical Center. We used K-Ras Activation Assay Kit (Cell Biolabs, Inc.) to detect active RAS. Briefly, active RAS was bound to Ras-binding domain (RBD) of Raf1 and pulled down by agarose beads. (H+K) RAS antibody was used to detected the active and total RAS protein. Quantikine® ELISA TGFβ1 kit and Mouse CCL2/JE/MCP-1 DuoSet ELISA kit were used to determine TGFβ1 and CCL2 concentrations in mouse plasma, respectively.
Mass cytometry (CyTOF) analysis
Tumor Dissociation Kit (Miltenyi Biotec) was used to dissociate sample tumors into single cells. Cells were stained by trypan blue and counted for live cells using hemocytometer (Fisher Scientific). Cells (2.5×10e6) were collected and spun to pellet. Cells were resuspended in 50 μl MaxPar Cell Staining buffer (Fluidigm) with 1/500 Fc block (BD Pharmingen) and incubated for 30 minutes in 15 ml Falcon tube at room temperature. Next, samples were added with surface antibody mix and incubated in room temperature for another 30 minutes. After staining, samples were added with 2 ml MaxPar Cell Staining buffer and centrifuged at 300xg for 5 minutes at 4°C. Supernatants were removed and samples were washed once with 5ml PBS. Centrifuge at 300g for 5 minutes at 4°C. Next, cells were resuspended in 1 ml PBS with 5 μM Cell-ID Cisplatin (MaxPar), incubated at room temperature for 1 minute, and centrifuged at 300xg for 5 minutes at 4°C. Wash cells with 2 ml MaxPar Cell Staining buffer and centrifuge at 300xg for 5 minutes at 4°C. For further staining intracellular proteins, first cells were fixed in 100 μl fresh 1.6% formaldehyde in PBS and incubated at room temperature for 10 minutes. Centrifuge at 800xg for 5 minutes at 4°C and remove the supernatant. Cells were washed with 1 ml MaxPar Cell Staining buffer and centrifuged at 800xg for 5 minutes at 4°C. Second, cells were resuspended in 200 μl fresh FoxP3 Fix/Perm working solution (eBiosciences) and incubated at room temperature for 45 minutes in the dark. After that, cells were centrifuged at 800xg for 5 minutes at 4°C to remove supernatant, and washed twice with 200 μl 1x Perm buffer (Invitrogen). Third, cells were resuspended in 50 μl 1x Perm buffer with intercellular antibody mix and incubated at room temperature for 1 hour in the dark. After incubation, cells were centrifuged at 800xg for 5 minutes at 4°C to remove supernatant, and then washed twice with 200 μl MaxPar Cell Staining buffer. For both surface marker stained and intracellular marker stained samples, cells were resuspended in 500 μl MaxPar Fix and Perm buffer (DVS Sciences) with 1/1000 Cell-ID™ Intercalator-Ir (Fludigm) and incubated overnight at 4°C. The next day, cells were centrifuged at 800xg for 5 minutes at 4°C, washed once with 1 ml MaxPar Cell Staining buffer, and then resuspended in 1 ml ddH2O. Cells were passed through 40 μm strainer to collect single cells, and centrifuged at 800xg for 5 minutes at 4°C to remove 950 ul ddH2O. Count cell numbers using hemocytometer before analyzing by CyTOF Mass Cytometers (Helios-081). To visualize the CyTOF data, we ran the PhenoGragh algorithm using cytofkit software based on R(56). Additionally, we also analyzed the data by FlowJo. Antibody information is listed in Supplementary Table 2.
Flow cytometry and cell cycle analysis
Cell surface immunofluorescence staining was performed following the protocol provided by BioLegend. Briefly, single cells (1×10e6) were pre-incubated with TruStain fcX™ (anti-mouse CD16/32) Antibody for 10 minutes on ice. Next, antibodies for surface antigens as well as live cell dye were added at appropriate concentrations according to the vendor indications, and all the mixtures were incubated on ice for 15 minutes. To perform intracellular staining, washed cells were then fixed and permeabilized using Foxp3 Fixation/Permeabilization working solution (ThermoFisher) at room temperature for 45 minutes. Cells were washed twice with 1X Permeabilization Buffer (ThermoFisher), and incubated with antibodies for intracellular antigens at room temperature for 1 hour. Finally, cells were resuspended in cell staining buffer and analyzed by flow cytometer LSRFortessa X-20 Analyzer. Antibody information is listed in Supplementary Table 2.
For cell cycle analysis, the iKPC-1 cells overexpressing GFP, HDAC5 or HDAC5 were seeded in Matrigel with or without Doxycycline treatment. After 4 days, cells were recovered from Matrigel using BD Cell Recovery Solution, dissociated into single cells by trypsin, and then fixed in ethanol overnight at −20 °C. Fixed cells were stained by FxCycle PI/RNAse Solution (Invitrogen) for 30 minutes at room temperature in the dark, and then sent for cell cycle analysis by Gallios Cell Analyzer. Three independent experiments were performed for statistical analysis.
Isolation and culture of bone marrow derived macrophages (BMDMs)
To isolate bone marrow cells, we collected femurs from adult mice and cut the bone open at both ends. Next, we used a 21G needle and 10 ml syringe with cold RPMI medium (Gibco) to flush out bone marrow into 15ml Falcon tubes. We shook the tubes for one minute to dissociate the cells, and then passed the cells sequentially through 70 μm and 40 μm strainer to keep only single cells. Cells were then centrifuged at 300xg for 7 minutes at 4°C to remove supernatant. Next, cells were resuspended in 1.5 ml RBC lysis buffer (Biolegend) and incubated at room temperature for 5 minutes. After that, 13.5 ml cold PBS were added into cells and cells were centrifuged at 300xg for 5 minutes to remove supernatant. Cells were resuspended in RPMI with 10% HI FBS (Gibco), Pen-Strep (Gibco) and 10 ng/ml recombinant mouse M-CSF (BioLegend), plated in 10-cm cell culture dishes (Falcon), and cultured for 7 days to induce mature macrophages.
Chemoattractant assay
BMDMs were starved in RPMI containing 1% FBS and 10ng/ml M-CSF for 3 hours before migration assay. BMDMs were dissociated from dishes by 0.05% Trypsin (Gibco) and live cell number was counted. BMDMs were washed twice with cold PBS to remove FBS and trypsin and then resuspended in RPMI medium (2×10e6 cell/ml). Then, 100 μl BMDMs were plated in 6.5-mm inserts with 3.0 μm polycarbonate membrane (Costar) and plated in wells filled with 600 μl chemoattractant medium or control medium in 24-well plate (Costar). After 16 hours incubation, we removed the BMDMs inside the inserts by sterile cotton tipped applicators (Puritan) and stained the inserts with crystal violet solution (0.2% crystal violet in 80% methanol) for 40 minutes. BMDMs that passed through the membrane were stained and imaged under microscope.
For conditioned medium collection, 80% confluent cells were washed twice with warm PBS and incubated with 10 ml RPMI medium for 24 hours. Next day, the conditioned medium was collected, passed through 0.45 μm filter to remove cells, aliquoted as 1 ml per 1.5-ml Eppendorf tube, and stored in −80°C. We diluted the conditioned medium with equal amount of fresh RPMI medium before using for chemoattractant assay.
We used 200 ng/ml CCL2 (BioLegend) as positive control for the chemoattractant assay of BMDMs, and 5 μM CCR2 inhibitor (Santa Cruz biotech, sc-202525) to block the chemotaxis.
ChIP-sequencing and ChIP-q-PCR
ChIP was performed as describe previously(57). HDAC5 escaper cells were crosslinked by 1% paraformaldehyde for 10 minutes at room temperature and then quenched by 0.125M glycine for 5 minutes. Cells were lysed on ice for 30 minutes with lysis buffer containing 10 mM Tris-HCl (pH 8.0), 1 mM EDTA (pH 8.0), 140 mM NaCl, 1% Triton X-100, 0.2% SDS, 0.1% deoxycholic acid. Chromatin DNA was fragmented to around 200-500bp by Diagenode BioruptorPico sonicator for 45 cycles of 30 seconds on and 30 second off, and then incubated overnight with anti-HDAC5 antibody (or anti-FLAG antibody) and Dynabead (Life Technologies) at 4°C. Next day, immune complexes were washed once with RIPA buffer with 500 mM NaCl and once with LiCl wash buffer (10 mM Tris-HCl [pH 8.0], 1 mM EDTA [pH 8.0], 250 mM LiCl, 0.5% NP-40, 0.5% deoxycholic acid). DNA was then reverse crosslinked and eluted overnight in elution buffer (10 mM Tris-Cl [pH 8.0], 5 mM EDTA, 300 mM NaCl, 0.5% SDS, 20 mg/ml proteinase K) at 65°C. The third day, eluted DNA was purified by AMPure beads (Beckman-Coulter). NEB Next Ultra DNA Library kit was used to prepare library. Samples were sequenced using Illumina HiSeq 2000 instrument. Sequencing data were analyzed following pyflow-ChIPseq: a snakemake based ChIP-seq pipeline (Version v1.0.0). Zenodo. http://doi.org/10.5281/zenodo.819971. The GEO accession numbers of both the two ChIP-seq datasets are GSE129549 and GSE149125.
For ChIP-q-PCR validation, ChIP was performed with SimpleChIP® Plus Enzymatic Chromatin IP Kit (Magnetic Beads) (Cell Signaling Technology, #9005). Primers were designed according to HDAC5 binding peaks from the ChIP-seq data, Socs3-P1F (intron, ctccacttcctaggtcccca), Socs3-P1R (intron, catcccgtgccaaccaaaag), Socs3-P2F (exon, CTTACGACCGCTGTCTCTCC), Socs3-P2R (exon, AATCAGGCAAAGGACCTGGG), Socs3-P3F (intron, gtagggaggggacgaggtag), Socs3-P3R (intron, gccccagtctgagtatgacg), Socs3-P4F (exon, TCGGGAGTTCCTGGATCAGT), Socs3-P4R (exon, CCGTTGGGGCTGGATTTTTG).
Information on cytokines, lipids, chemicals, prostaglandins, neutralizing antibodies and small molecule inhibitors
For in vitro studies: PGF2α (Cayman), rmFGF1 (Peprotech), rmPDGFBB (Peprotech), rmPDGFAA (Peprotech), rh/mWnt-5a (R&D), LPA (Santa Cruz biotech), rmIL6 (Peprotech), S1P (Cayman), Adapalene (Selleckchem), SAG (Tocris), rmTGFβ1(R&D), rmTGFβ2(R&D), rmTGFβ3 (R&D), CCL2 (BioLegend), CCR2 inhibitor (Santa Cruz Biotechnology), MEKi (PD0324901, 2 μM, Selleckchem), PI3Ki (LY294002, 2 μM, Selleckchem) , mTORi (Rapamycin, 100 nM, Selleckchem), Trametinib (Selleckchem, 50 nM), Alpelisib (Selleckchem, 5 μM) and ARS-1620 (MedChemExpress).
For in vivo studies: TGFβ neutralizing antibody (BioXCell, Clone 1D11, 200 μg, every other day, i.p), Clodronate liposome (Liposoma, 0.1 ml per 10 mg weight, every 5 days, i.p), Trametinib (Selleckchem, 0.3 or 1 or 3 mg/kg as indicated, q.d., oral), Alpelisib (Selleckchem, 50 mg/kg, once per day, oral), ARS-1620 (MedChemExpress, 200 mg/kg, q.d., oral), LMK-235 (MedChemExpress, 5 mg/kg, q.d., i.p.), Galunisertib (Selleckchem, 50 mg/kg, b.i.d., oral), mouse CCL2 neutralizing antibody (BioXCell, 5 mg/kg, every 2 days, i.p.), and RS 504393 (Cayman, 2 mg/kg, q.d., i.p.).
Human cell lines
Human lung cancer cell lines and pancreatic cancer cell lines were obtained from the Institute for Applied Cancer Science (IACS) cell bank at MD Anderson. All cell lines passed cell banking authentication and mycoplasma testing. Pancreatic cancer cell lines CFPAC1, Capan2 and MIA PaCa-2 were cultured in IMDM+10%FBS, McCoy’s 5A +10%FBS, and DMEM+10%FBS, respectively. Lung cancer cell lines HCC44 and NCI-H1792 were cultured in RPMI+10%FBS+2mM glutamine and RPMI+10%FBS, respectively.
Statistical analysis
Statistical analysis was performed using the unpaired student t test to generate two-tailed p values. For tumor free survival analysis, Kaplan-Meier survival curves were generated using GraphPad Prism 7, and statistically analyzed by Log-rank (Mantel-Cox) test.
Supplementary Material
Statement of Significance.
While KRAS* is required for PDAC tumor maintenance, tumors can recur following KRAS* extinction. The capacity of PDAC cancer cells to alter the TME myeloid cell composition to support KRAS*-independent tumor growth, illuminates novel therapeutic targets that may enhance the effectiveness of therapies targeting KRAS* and its pathway components.
Acknowledgements
The authors would like to thank Tim Heffernan, Trang N. Tieu for helping with Avnish Kapoor to establish the epigenetic library, Wantong Yao and Howard Chang for technical assistance, Zhaohui Xu and Ivonne Flores for mouse colony maintenance and Haoqiang Ying, Guocan Wang and Jian Hu for helpful discussions. MD Anderson’s Small Animal Imaging Facility (SAIF) is partially funded and its Sequencing & Microarray Facility is supported by Cancer Center Support Grant NIH P30 CA016672. P.H. is supported by the Seed Grant Program provided by Hirshberg Foundation for Pancreatic Cancer Research. This project is supported by NIH P01 CA117969 (R.A.D.), NIH R01 CA225955 (R.A.D.), NIH R01 CA231349 (Y.A.W) and Emerson Collective (Y.A.W).
Footnotes
Conflict of interest
R.A.D. is the Founder and Director of Tvardi Pharmaceuticals.
Reference
- 1.Klimstra DS, Longnecker DS, K-ras mutations in pancreatic ductal proliferative lesions. Am J Pathol 145, 1547–1550 (1994). [PMC free article] [PubMed] [Google Scholar]
- 2.Bailey P et al. , Genomic analyses identify molecular subtypes of pancreatic cancer. Nature 531, 47–52 (2016). [DOI] [PubMed] [Google Scholar]
- 3.Aguirre AJ et al. , Activated Kras and Ink4a/Arf deficiency cooperate to produce metastatic pancreatic ductal adenocarcinoma. Genes Dev 17, 3112–3126 (2003). [DOI] [PMC free article] [PubMed] [Google Scholar]
- 4.Bardeesy N et al. , Both p16(Ink4a) and the p19(Arf)-p53 pathway constrain progression of pancreatic adenocarcinoma in the mouse. Proc Natl Acad Sci U S A 103, 5947–5952 (2006). [DOI] [PMC free article] [PubMed] [Google Scholar]
- 5.Ying H et al. , Oncogenic Kras maintains pancreatic tumors through regulation of anabolic glucose metabolism. Cell 149, 656–670 (2012). [DOI] [PMC free article] [PubMed] [Google Scholar]
- 6.Collins MA et al. , Oncogenic Kras is required for both the initiation and maintenance of pancreatic cancer in mice. J Clin Invest 122, 639–653 (2012). [DOI] [PMC free article] [PubMed] [Google Scholar]
- 7.Son J et al. , Glutamine supports pancreatic cancer growth through a KRAS-regulated metabolic pathway. Nature 496, 101–105 (2013). [DOI] [PMC free article] [PubMed] [Google Scholar]
- 8.Dey P et al. , Oncogenic KRAS-Driven Metabolic Reprogramming in Pancreatic Cancer Cells Utilizes Cytokines from the Tumor Microenvironment. Cancer Discov 10, 608–625 (2020). [DOI] [PMC free article] [PubMed] [Google Scholar]
- 9.Commisso C et al. , Macropinocytosis of protein is an amino acid supply route in Ras-transformed cells. Nature 497, 633–637 (2013). [DOI] [PMC free article] [PubMed] [Google Scholar]
- 10.Fujimura K et al. , Eukaryotic Translation Initiation Factor 5A (EIF5A) Regulates Pancreatic Cancer Metastasis by Modulating RhoA and Rho-associated Kinase (ROCK) Protein Expression Levels. The Journal of biological chemistry 290, 29907–29919 (2015). [DOI] [PMC free article] [PubMed] [Google Scholar]
- 11.Matsuo Y et al. , K-Ras promotes angiogenesis mediated by immortalized human pancreatic epithelial cells through mitogen-activated protein kinase signaling pathways. Mol Cancer Res 7, 799–808 (2009). [DOI] [PMC free article] [PubMed] [Google Scholar]
- 12.Pylayeva-Gupta Y, Lee KE, Hajdu CH, Miller G, Bar-Sagi D, Oncogenic Kras-induced GM-CSF production promotes the development of pancreatic neoplasia. Cancer Cell 21, 836–847 (2012). [DOI] [PMC free article] [PubMed] [Google Scholar]
- 13.Zdanov S et al. , Mutant KRAS Conversion of Conventional T Cells into Regulatory T Cells. Cancer Immunol Res 4, 354–365 (2016). [DOI] [PMC free article] [PubMed] [Google Scholar]
- 14.Haigis KM, KRAS Alleles: The Devil Is in the Detail. Trends Cancer 3, 686–697 (2017). [DOI] [PMC free article] [PubMed] [Google Scholar]
- 15.Ostrem JM, Shokat KM, Direct small-molecule inhibitors of KRAS: from structural insights to mechanism-based design. Nat Rev Drug Discov 15, 771–785 (2016). [DOI] [PubMed] [Google Scholar]
- 16.Downward J, Targeting RAS signalling pathways in cancer therapy. Nat Rev Cancer 3, 11–22 (2003). [DOI] [PubMed] [Google Scholar]
- 17.Kapoor A et al. , Yap1 activation enables bypass of oncogenic Kras addiction in pancreatic cancer. Cell 158, 185–197 (2014). [DOI] [PMC free article] [PubMed] [Google Scholar]
- 18.Shao DD et al. , KRAS and YAP1 converge to regulate EMT and tumor survival. Cell 158, 171–184 (2014). [DOI] [PMC free article] [PubMed] [Google Scholar]
- 19.Roy N et al. , Brg1 promotes both tumor-suppressive and oncogenic activities at distinct stages of pancreatic cancer formation. Genes Dev 29, 658–671 (2015). [DOI] [PMC free article] [PubMed] [Google Scholar]
- 20.Khursheed M et al. , ARID1B, a member of the human SWI/SNF chromatin remodeling complex, exhibits tumour-suppressor activities in pancreatic cancer cell lines. Br J Cancer 108, 2056–2062 (2013). [DOI] [PMC free article] [PubMed] [Google Scholar]
- 21.Feng W, Zhang B, Cai D, Zou X, Therapeutic potential of histone deacetylase inhibitors in pancreatic cancer. Cancer Lett 347, 183–190 (2014). [DOI] [PubMed] [Google Scholar]
- 22.Zawistowski JS et al. , Enhancer Remodeling during Adaptive Bypass to MEK Inhibition Is Attenuated by Pharmacologic Targeting of the P-TEFb Complex. Cancer Discov 7, 302–321 (2017). [DOI] [PMC free article] [PubMed] [Google Scholar]
- 23.Echevarria-Vargas IM et al. , Co-targeting BET and MEK as salvage therapy for MAPK and checkpoint inhibitor-resistant melanoma. EMBO Mol Med 10, (2018). [DOI] [PMC free article] [PubMed] [Google Scholar]
- 24.Haberland M, Montgomery RL, Olson EN, The many roles of histone deacetylases in development and physiology: implications for disease and therapy. Nat Rev Genet 10, 32–42 (2009). [DOI] [PMC free article] [PubMed] [Google Scholar]
- 25.Lahm A et al. , Unraveling the hidden catalytic activity of vertebrate class IIa histone deacetylases. Proc Natl Acad Sci U S A 104, 17335–17340 (2007). [DOI] [PMC free article] [PubMed] [Google Scholar]
- 26.Verdin E, Dequiedt F, Kasler HG, Class II histone deacetylases: versatile regulators. Trends Genet 19, 286–293 (2003). [DOI] [PubMed] [Google Scholar]
- 27.Fischle W et al. , Enzymatic activity associated with class II HDACs is dependent on a multiprotein complex containing HDAC3 and SMRT/N-CoR. Mol Cell 9, 45–57 (2002). [DOI] [PubMed] [Google Scholar]
- 28.Lopez-Casillas F, Wrana JL, Massague J, Betaglycan presents ligand to the TGF beta signaling receptor. Cell 73, 1435–1444 (1993). [DOI] [PubMed] [Google Scholar]
- 29.Ko AH et al. , A Multicenter, Open-Label Phase II Clinical Trial of Combined MEK plus EGFR Inhibition for Chemotherapy-Refractory Advanced Pancreatic Adenocarcinoma. Clin Cancer Res 22, 61–68 (2016). [DOI] [PMC free article] [PubMed] [Google Scholar]
- 30.Gebhardt C, Nemeth J, Angel P, Hess J, S100A8 and S100A9 in inflammation and cancer. Biochem Pharmacol 72, 1622–1631 (2006). [DOI] [PubMed] [Google Scholar]
- 31.Zhu Y et al. , Tissue-Resident Macrophages in Pancreatic Ductal Adenocarcinoma Originate from Embryonic Hematopoiesis and Promote Tumor Progression. Immunity 47, 597 (2017). [DOI] [PMC free article] [PubMed] [Google Scholar]
- 32.van Rooijen N, Hendrikx E, Liposomes for specific depletion of macrophages from organs and tissues. Methods Mol Biol 605, 189–203 (2010). [DOI] [PubMed] [Google Scholar]
- 33.Brooks SA, Blackshear PJ, Tristetraprolin (TTP): interactions with mRNA and proteins, and current thoughts on mechanisms of action. Biochim Biophys Acta 1829, 666–679 (2013). [DOI] [PMC free article] [PubMed] [Google Scholar]
- 34.Carow B, Rottenberg ME, SOCS3, a Major Regulator of Infection and Inflammation. Front Immunol 5, 58 (2014). [DOI] [PMC free article] [PubMed] [Google Scholar]
- 35.Qin H, Niyongere SA, Lee SJ, Baker BJ, Benveniste EN, Expression and functional significance of SOCS-1 and SOCS-3 in astrocytes. J Immunol 181, 3167–3176 (2008). [DOI] [PMC free article] [PubMed] [Google Scholar]
- 36.Viale A et al. , Oncogene ablation-resistant pancreatic cancer cells depend on mitochondrial function. Nature 514, 628–632 (2014). [DOI] [PMC free article] [PubMed] [Google Scholar]
- 37.Adamska A, Domenichini A, Falasca M, Pancreatic Ductal Adenocarcinoma: Current and Evolving Therapies. Int J Mol Sci 18, (2017). [DOI] [PMC free article] [PubMed] [Google Scholar]
- 38.Ahmed S, Bradshaw AD, Gera S, Dewan MZ, Xu R, The TGF-beta/Smad4 Signaling Pathway in Pancreatic Carcinogenesis and Its Clinical Significance. J Clin Med 6, (2017). [DOI] [PMC free article] [PubMed] [Google Scholar]
- 39.Rotow J, Bivona TG, Understanding and targeting resistance mechanisms in NSCLC. Nat Rev Cancer 17, 637–658 (2017). [DOI] [PubMed] [Google Scholar]
- 40.Kapoor A et al. , Yap1 activation enables bypass of oncogenic Kras addiction in pancreatic cancer. Cell 158, 185–197 (2014). [DOI] [PMC free article] [PubMed] [Google Scholar]
- 41.Pettazzoni P et al. , Genetic events that limit the efficacy of MEK and RTK inhibitor therapies in a mouse model of KRAS-driven pancreatic cancer. Cancer Res 75, 1091–1101 (2015). [DOI] [PMC free article] [PubMed] [Google Scholar]
- 42.Nagathihalli NS et al. , Inverse Correlation of STAT3 and MEK Signaling Mediates Resistance to RAS Pathway Inhibition in Pancreatic Cancer. Cancer Res 78, 6235–6246 (2018). [DOI] [PMC free article] [PubMed] [Google Scholar]
- 43.Bardeesy N et al. , Smad4 is dispensable for normal pancreas development yet critical in progression and tumor biology of pancreas cancer. Genes Dev 20, 3130–3146 (2006). [DOI] [PMC free article] [PubMed] [Google Scholar]
- 44.Thomas DA, Massague J, TGF-beta directly targets cytotoxic T cell functions during tumor evasion of immune surveillance. Cancer Cell 8, 369–380 (2005). [DOI] [PubMed] [Google Scholar]
- 45.Guido C et al. , Metabolic reprogramming of cancer-associated fibroblasts by TGF-beta drives tumor growth: connecting TGF-beta signaling with “Warburg-like” cancer metabolism and L-lactate production. Cell Cycle 11, 3019–3035 (2012). [DOI] [PMC free article] [PubMed] [Google Scholar]
- 46.Ferrari G, Cook BD, Terushkin V, Pintucci G, Mignatti P, Transforming growth factor-beta 1 (TGF-beta1) induces angiogenesis through vascular endothelial growth factor (VEGF)-mediated apoptosis. J Cell Physiol 219, 449–458 (2009). [DOI] [PMC free article] [PubMed] [Google Scholar]
- 47.Neuzillet C et al. , Targeting the TGFbeta pathway for cancer therapy. Pharmacol Ther 147, 22–31 (2015). [DOI] [PubMed] [Google Scholar]
- 48.Halbrook CJ et al. , Macrophage-Released Pyrimidines Inhibit Gemcitabine Therapy in Pancreatic Cancer. Cell Metab 29, 1390–1399 e1396 (2019). [DOI] [PMC free article] [PubMed] [Google Scholar]
- 49.Feng PH et al. , S100A9(+) MDSC and TAM-mediated EGFR-TKI resistance in lung adenocarcinoma: the role of RELB. Oncotarget 9, 7631–7643 (2018). [DOI] [PMC free article] [PubMed] [Google Scholar]
- 50.Nywening TM et al. , Targeting tumour-associated macrophages with CCR2 inhibition in combination with FOLFIRINOX in patients with borderline resectable and locally advanced pancreatic cancer: a single-centre, open-label, dose-finding, non-randomised, phase 1b trial. Lancet Oncol 17, 651–662 (2016). [DOI] [PMC free article] [PubMed] [Google Scholar]
- 51.Hou P et al. , USP21 deubiquitinase promotes pancreas cancer cell stemness via Wnt pathway activation. Genes Dev 33, 1361–1366 (2019). [DOI] [PMC free article] [PubMed] [Google Scholar]
- 52.Coulouarn C, Factor VM, Thorgeirsson SS, Transforming growth factor-beta gene expression signature in mouse hepatocytes predicts clinical outcome in human cancer. Hepatology 47, 2059–2067 (2008). [DOI] [PMC free article] [PubMed] [Google Scholar]
- 53.Conesa A et al. , A survey of best practices for RNA-seq data analysis. Genome Biol 17, 13 (2016). [DOI] [PMC free article] [PubMed] [Google Scholar]
- 54.Subramanian A et al. , Gene set enrichment analysis: a knowledge-based approach for interpreting genome-wide expression profiles. Proc Natl Acad Sci U S A 102, 15545–15550 (2005). [DOI] [PMC free article] [PubMed] [Google Scholar]
- 55.Mootha VK et al. , PGC-1alpha-responsive genes involved in oxidative phosphorylation are coordinately downregulated in human diabetes. Nat Genet 34, 267–273 (2003). [DOI] [PubMed] [Google Scholar]
- 56.Levine JH et al. , Data-Driven Phenotypic Dissection of AML Reveals Progenitor-like Cells that Correlate with Prognosis. Cell 162, 184–197 (2015). [DOI] [PMC free article] [PubMed] [Google Scholar]
- 57.Garber M et al. , A high-throughput chromatin immunoprecipitation approach reveals principles of dynamic gene regulation in mammals. Mol Cell 47, 810–822 (2012). [DOI] [PMC free article] [PubMed] [Google Scholar]
Associated Data
This section collects any data citations, data availability statements, or supplementary materials included in this article.