Abstract
Objectives/Hypothesis:
Glutamine metabolism is a critical energy source for iatrogenic laryngotracheal stenosis (iLTS) scar fibroblasts, and glutaminase (GLS) is an essential enzyme converting glutamine to glutamate. We hypothesize that the GLS-specific inhibitor BPTES will block glutaminolysis and reduce iLTS scar fibroblast proliferation, collagen deposition, and fibroblast metabolism in vitro.
Study Design:
Test-tube Lab Research.
Methods:
Immunohistochemistry of a cricotracheal resection (n = 1) and a normal airway specimen (n = 1) were assessed for GLS expression. GLS expression was assessed in brush biopsies of subglottic/tracheal fibrosis and normal airway from patients with iLTS (n = 6). Fibroblasts were isolated and cultured from biopsies of subglottic/tracheal fibrosis (n = 6). Fibroblast were treated with BPTES and BPTES + dimethyl α-ketoglutarate (DMK), an analogue of the downstream product of GLS. Fibroblast proliferation, gene expression, protein production, and metabolism were assessed in all treatment conditions and compared to control.
Results:
GLS was overexpressed in brush biopsies of iLTS scar specimens (P = .029) compared to normal controls. In vitro, BPTES inhibited iLTS scar fibroblast proliferation (P = .007), collagen I (Col I) (P < .0001), collagen III (P = .004), and α-smooth muscle actin (P = .0025) gene expression and protein production (P = .031). Metabolic analysis demonstrated that BPTES reduced glycolytic reserve (P = .007) but had no effects on mitochondrial oxidative phosphorylation. DMK rescued BPTES inhibition of Col I gene expression (P = .0018) and protein production (P = .021).
Conclusions:
GLS is overexpressed in iLTS scar. Blockage of GLS with BPTES significantly inhibits iLTS scar fibroblasts proliferation and function, demonstrating a critical role for GLS in iLTS. Targeting GLS to inhibit glutaminolysis may be a successful strategy to reverse scar formation in the airway.
Keywords: Laryngotracheal stenosis, fibrosis, larynx, iatrogenic, fibroblasts, collagen, glutaminase, BPTES, glycolysis
INTRODUCTION
Laryngotracheal stenosis (LTS) is a pathologic fibrotic process that narrows the larynx, subglottis, and/or trachea. The etiologies of LTS are varied including iatrogenic injury from endotracheal or tracheostomy tubes (iLTS), autoimmune diseases (usually granulomatosis with polyangiitis), idiopathic, and rarely external trauma or radiation. iLTS, second to persistent intubation, is the most predominant etiology.1–3 Specifically, trauma from the endotracheal tube disrupts the epithelium of the laryngotracheal complex and subsequently results in inflammation with recruitment of macrophages, T cells, and tissue disruptive enzymes during the wound-healing process. In iLTS, the wound-healing process becomes dysregulated, with excess extracellular matrix deposition and fibroblast hyperproliferation resulting in scar obstructing the airway.4–7 The narrowing of laryngotracheal airway can cause significant dyspnea that requires surgical dilation, cricotracheal resection, or sometimes permanent tracheostomy.8 Given the life-threatening severity of dyspnea and associated risks of these surgical procedures, it is critically important to develop an effective and noninvasive medical therapy for iLTS.
The development of effective medical therapies to treat iLTS has been limited by our knowledge gap in disease pathogenesis. Recent discoveries have shown iLTS fibroblasts are hyperproliferative and drive their proliferation with aerobic glycolysis.9 This Warburg-like effect is similar to how cancer cells drive proliferation, even in the presence of oxygen and fully functioning mitochondrial respiration.9,10 This seemingly inefficient metabolic phenotype seen in cancer and fibrosis is thought to be because excess carbons generated from glycolysis are used to form the backbone of mitotic cells.11 To meet the increased metabolic demand, cells use glucose and glutamine for biogenesis.9,12,13 Glutamine has been shown to be a critical amino acid for iLTS scar fibroblasts, and glutamine inhibition has been effective at reducing iLTS scar fibroblast proliferation and collagen deposition, as well as decreasing glycolysis and mitochondrial oxidative phosphorylation.14
Targeted therapies have been developed against glutamine metabolism, including inhibition of glutamine uptake and glutamine-catalyzed enzyme activity in cancer and pulmonary fibrosis.12,14–17 Blockade of the glutamine transporter ASCT2 with V-9302 resulted in attenuated cancer cell growth and proliferation.18 In other studies, glutaminase (GLS) inhibition with DON (6-Diazo-5-oxo-L-norleucine), compound 968, CB-839, and BPTES (bis-2-[5-phenylacetamido-1,2,4-thiadiazol-2-yl] ethyl sulfide) was effective at inhibiting tumor growth and treating idiopathic pulmonary fibrosis by reducing cell proliferation and collagen deposition.3,19–23 GLS is an enzyme that converts glutamine to glutamate, a process known as glutaminolysis, which provides a carbon source to replenish α-ketoglutarate (α-KG) in the tricarboxylic cycle for energy production and provides nitrogen for purine and pyrimidine biosynthesis.12 As a result, these studies demonstrate the concept of cellular selectivity based on metabolic demand, whereby hypermetabolic cells with high glutamine requirements respond to glutamine inhibition while cells with normal glutamine requirements are not affected.
Metabolic inhibition of iLTS by GLS inhibitors may represent a promising therapeutic strategy by taking advantage of cellular selectivity based on demand. In addition to providing an energy source for proliferating cells, glutamine is also a substrate for collagen production in human scar fibroblasts.21 In normal fibroblasts, glutaminolysis enhances collagen translation and stability via the α-KG–dependent mTOR complex 1 activation and collagen proline hydroxylation.19 Therefore, by inhibiting GLS, collagen synthesis and stability will be reduced. A previous study using a nonspecific glutamine inhibitor, DON, showed inhibition on cell proliferation and collagen deposition with reduced energy production through glycolysis in iLTS scar fibroblasts.14 Herein, we aimed to investigate the GLS-specific inhibitor BPTES and its effect on preventing iLTS scar in vitro. We hypothesize that BPTES administration will suppress iLTS scar fibroblast proliferation, collagen deposition, and affect the metabolism profile via blocking glutaminolysis.
MATERIALS AND METHODS
Patient Selection
Brush biopsies of subglottic/tracheal fibrosis and normal airways were obtained in patients with iLTS (n = 6) for GLS expression experiments. In addition, biopsies of subglottic/tracheal fibrosis were performed to isolate fibroblasts in cell culture (n = 6). One cricotracheal resection specimen was obtained from one patient with iLTS (n = 1). Informed consent was obtained from participants in accordance with the Johns Hopkins University Institutional Review Board (NA_00078310). Normal subglottis and trachea were collected from rapid autopsy specimen (n = 1), which was approved by the institutional review board (NA_00036610) at the Johns Hopkins University School of Medicine.
Brush Biopsy Specimen Sampling
Brush biopsies of human subglottic/tracheal fibrosis and normal appearing areas of the airway were obtained using a 1.0-mm-diameter bronchial cytology brush (ConMed, Utica, NY) in the same patient (n = 6). Specimens were procured at the time of routine operating room dilation of subglottic and tracheal stenosis. Brush biopsy samples were placed in 1.5 mL sterile conical tubes and stored at −80°C for the measurement of GLS gene expression.
Laryngotracheal Fibroblast Isolation and Primary Cell Culture
Primary fibroblasts were isolated from the biopsy specimens, cultured, and expanded, as previously described.24 Passage 2 to 4 of the primary fibroblast cell lines were used for the purposes of our experiments.
Histochemistry Staining
The cricotracheal resection specimen and normal laryngotracheal specimen were fixed in 10% formalin, and then each specimen was embedded in paraffin. Slides were made from 5-μm-thick sections cut through in an axial plane, which were then stained with hematoxylin and eosin. For the GLS staining, the tracheal specimens were processed with antigen retrieval buffer for 20 minutes, and then blocked with 10% fetal bovine serum for 30 minutes. Tissue slides were incubated in a solution with rabbit anti-GLS1 antibody, which has cross-species reactivity to human, mouse, and rat (dilution: 1:100; Bioss, Woburn, MA) at 4°C overnight. The following day, the slides were washed three times with phosphate-buffered saline (PBS) and then incubated with goat anti-rabbit Alexa Fluor 633 antibody (dilution 1:200; Invitrogen, Eugene, OR) for 1 hour at room temperature. Slides were washed with PBS three times and then mounted with mounting media with 4′,6-diamidino-2-phenylindole. A confocal microspore was used to visualize and image positive staining.
Experimental Design
The GLS inhibitor BPTES was used to inhibit the conversion of glutamine to glutamate. To confirm the effect of BPTES on GLS, dimethyl α-ketoglutarate (DMK), an analogue of the immediate downstream substrate, α-KG, was then added to restore the glutamine metabolic pathway inhibited by BPTES. Dose- and time-dependent experiments were performed to generate the appropriate concentration and incubation time of BPTES. We conducted dose-dependent (1 uM, 10 uM, and 100 uM) and time-dependent (1 hour, 2 hours, 4 hours, 8 hours, 24 hours) experiments to assess the inhibitory effect of BPTES on collagen I (Col I) gene expression in iLTS scar fibroblasts. The preliminary results showed that incubation with 10 uM BPTES for 2 hours had the greatest inhibitory effect on the Col I gene expression. In this study, iLTS scar cells were incubated in three conditions: 1) in normal growth media, 2) in growth media with 10 uM BPTES for 2 hours, and 3) in growth media with 10 uM BPTES for 2 hours and subsequently added 0.1 mM DMK to the media. After 24 hours, cell lysate was collected for the extraction of RNA and protein using Allprep RNA/Protein kit (Qiagen, Hilden, Germany). RNA samples were used for gene expression analysis. Protein samples were analyzed by Human Pro-Collagen I alpha 1 enzyme-linked immunosorbent assay (ELISA) Kit (Abcam, Cambridge, United Kingdom) for the Col I protein expression.
Proliferation Assay by MTS Assay
Cells were plated in 96-well culture plates with 1 × 10⁴ cells per well and incubated in condition 1 and 2, as described in experimental design. After 24 hours, cell proliferation were quantified by [3-(4,5-dimethylthiazol-2-yl)-5-(3-carboxymethoxyphenyl)-2-(4-sulfophenyl)-2H-tetrazolium] (MTS) colorimetric techniques with MTS Colorimetric Assay (Abcam, Cambridge, United Kingdom) as previously described.14
Gene Expression Analysis by Real-Time Polymerase Chain Reaction
Gene expression of GLS and fibrosis markers Col I, collagen III (Col III), and α-smooth muscle actin (α-SMA) were measured with the Power SYBR Green PCR Mastermix (Life Technologies, Carlsbad, CA) and quantified using quantitative real-time polymerase chain reaction (PCR) on the StepOnePlus Real Time PCR System (Applied Biosystems, Foster City, CA). All samples were run in duplicate. The level of expression of each target gene was calculated as 2(−ddCt) as previously described.14
ELISA
Protein was extracted from cell lysate as mentioned in the experimental design. The protein level of Col I in cell lysate was assessed using Human Pro-Collagen I alpha 1 ELISA Kit (Abcam, Cambridge, MA) according to the manufacturer’s protocol. Samples were added to microplate strips and incubated with antibody cocktail for 1 hour. After three times of wash buffer, 3′,5,5′-Tetramethylbenzidine substrate were added to the wells for 10 minutes. Stop solution was used to stop the reaction and measured the optical density (OD) at 450 nm.
Cellular Oxygen Consumption and Extracellular Acidification Measurement
The effects of the BPTES on the mitochondrial oxygen consumption rate and the extracellular acidification rate were measured with XF Cell Mito Stress Test Assay Kit (Agilent Technologies, Santa Clara, CA) and XF Glycolysis Stress Test Kit (Agilent Technologies), respectively, using a Seahorse Bioscience XF24 Flux Analyzer (Agilent Technologies). Cells were seeded at a density of 2 × 10⁴ cells per well in 24-well Seahorse culture plates and grew in condition 1 or 2. Mito stress test and glycolysis stress test was performed the following day as per the manufacturer’s protocol.14
Statistical Analysis
Results are represented as mean ± standard error. The Shapiro-Wilk test was used to test the normality of data. Oneway repeated measures analysis of variance with treatment as a factor (control, BPTES and BPTES+DMK) was used for the analysis of normalized quantitative PCR and ELISA results. Post hoc paired t tests were used for further analysis. The significance criterion for all analyses was set at P < .05. Data analysis was performed using Prism software (GraphPad Software, La Jolla, CA).
RESULTS
Experimental Cohort
Biopsies were collected from 12 patients (eight female and four male) with a diagnosis of iLTS for GLS expression (n = 6) and cell culture (n = 6). Evaluation of demographics, disease characteristics, comorbidities, and patient history revealed high homogeneity with regard to disease. Patient characteristics are summarized in Table I.
TABLE I.
Patient Characteristics.
| Enrollment | Biopsies for Glutaminase Expression, n = 6 | Biopsies for Cell Culture, n = 6 |
|---|---|---|
| Median age, yr (range) | 50 (27–72) | 43.2 (25–72) |
| Sex, male/female, n (%) | 0 (0)/6 (100) | 4 (67)/2 (33) |
| Tobacco use, n (%) | ||
| Current | 0 (0) | 0 (0) |
| Former | 2 (33) | 2 (33) |
| Never | 4 (67) | 4 (67) |
| Cotton-Meyer grade, n (%) | ||
| 1 | 1 (17) | 2 (33) |
| 2 | 2 (33) | 1 (17) |
| 3 | 3 (50) | 2 (33) |
| 4 | 0 (0) | 1 (17) |
| Tracheotomy, n (%) | ||
| Presented with | 2 (33) | 4 (67) |
| Required during biopsy | 0 (0) | 0 (0) |
| Etiology, n (%) | ||
| Iatrogenic | 6 (100) | 6 (100) |
| Congenita | 0 (0) | 0 (0) |
| Medication utilization, n (%) | ||
| Autoimmune/autosuppressant therapy | 0 (0) | 0 (0) |
| Oxygen therapy | 0 (0) | 0 (0) |
| Inhaled steroid | 1 (17) | 1 (17) |
| PPI | 2 (33) | 1 (17) |
| Comorbidities, n (%) | ||
| Asthma | 0 (0) | 0 (0) |
| Chronic obstructive | 0 (0) | 0 (0) |
| Depression | 3 (50) | 2 (33) |
| Laryngopharyngeal reflux | 0 (0) | 0 (0) |
| Hemiplegia | 0 (0) | 1 (17) |
| Hypertension | 2 (33) | 3 (50) |
| Obstructive sleep apnea | 0 (0) | 1 (17) |
| Solid tumor | 0 (0) | 0 (0) |
| Inflammatory tissue disease | 0 (0) | 0 (0) |
| Aspiration pneumonia secondary to dysphagia | 0 (0) | 0 (0) |
| Months from injury to treatment, mean ± SD | 14.6 ± 8.13 | 13.8 ± 9.23 |
PPI = proton pump inhibitor; SD = standard deviation.
iLTS Scar Fibroblasts Overexpressed GLS
Fibroblasts within the thickened lamina propria of a cricotracheal resection specimen from an iLTS patient showed intense GLS expression when compared to a normal trachea specimen (Fig. 1A–D). We used quantitative PCR to quantify the GLS expression in iLTS scar and normal fibroblasts. The results showed that iLTS scar fibroblasts have significantly higher GLS expression than normal tracheal fibroblasts (Fig. 1E) (n = 6, P = .029, 95% confidence interval (CI): 0.1993 to 2.439).
Fig. 1.
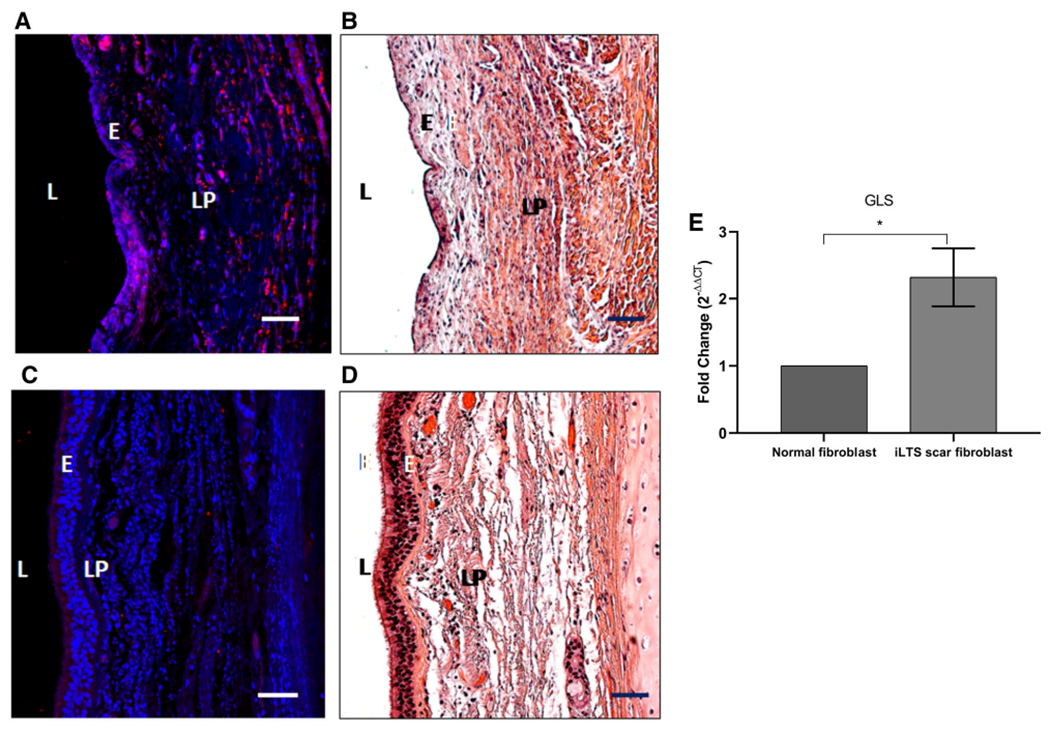
Glutaminase (GLS) is highly expressed in human iatrogenic laryngotracheal stenosis (iLTS). (A) Immunohistochemistry demonstrating intense staining of GLS in all fibroblasts within the thickened lamina propria (LP) of a cricotracheal resection specimen (CTR) from an iLTS patient. (B) Representative hematoxylin and eosin (H&E)-stained section of the same CTR specimen. (C) GLS staining in a normal trachea specimen. (D) Representative H&E-stained section of the same normal specimen. (E) Quantitative polymerase chain reaction demonstrating iLTS scar specimens to have increased gene expression of GLS compared to normal trachea specimens. Scale bars: 50 μM. L = left. [Color figure can be viewed in the online issue, which is available at www.laryngoscope.com.]
BPTES Inhibited iLTS Scar Fibroblasts Proliferation
Treatment of iLTS scar fibroblasts with BPTES significantly reduced the mean proliferation rate by 22% at 24 hours compared with untreated iLTS scar fibroblasts (n = 6, P = .0058, 95% CI: −0.3423 to −0.09701) (Fig. 2A). Patient-specific results are presented in Fig. 2B. Six of six (100%) patients had a decreased proliferation rate following BPTES treatment.
Fig. 2.
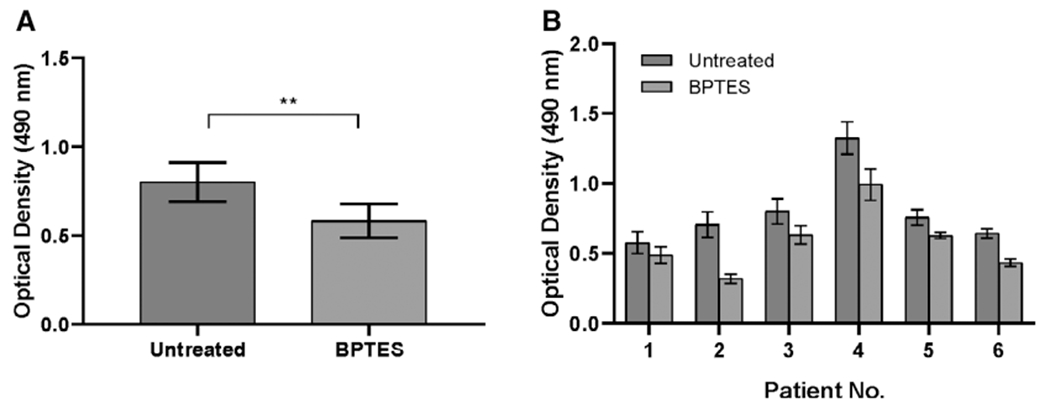
BPTES inhibits iLTS scar fibroblast proliferation. (A) BPTES attenuates iLTS scar fibroblasts proliferation at 24 hours compared to untreated iLTS scar fibroblasts in MTS proliferation assay. (B) Proliferation rate is reported on a per-subject basis. **P < .01. BPTES = bis-2-(5-phenylacetamido-1,3,4-thiadiazol-2-yl) ethyl sulfide.
BPTES Reduced Col I, Col III, and α-SMA Gene Expression in iLTS Scar Fibroblasts and DMK Rescued the Inhibition Effects
Quantitative real-time PCR was used for gene expression analysis. The results revealed that BPTES treatment resulted in a 43% decrease in Col I gene expression (n = 6, P < .0001, 95% CI: 0.34 to 0.50), a 31% decrease in Col II gene expression (n = 6, P = .004, 95% CI: 0.12 to 0.48), and a 43% decrease in α-SMA gene expression (n = 6, P = .0025, 95% CI: 0.18 to 0.66) in BPTES treated iLTS scar fibroblasts compared with untreated iLTS scar fibroblasts (Fig. 3). Furthermore, DMK, an analogue of the immediate downstream substrate, was subsequently added to the culture media of BPTES-treated iLTS scar fibroblasts that successfully rescued the inhibition effects of BPTES on the gene expression of Col I (20.4% rescue) and Col III (16.3% rescue) (n = 6, P = .0018, 95% CI: −0.30 to −0.31 and n = 6, P = .0011, 95% CI: −0.23 to 0.019, respectively) (Fig. 3).
Fig. 3.

BPTES reduces Col I, Col III, and α-SMA gene expression. BPTES treatment significantly decreases the gene expression of (A) Col I, (B) Col III, and (C) α-SMA in iLTS scar fibroblasts compared to untreated fibroblasts at 24 hours. DMK successfully rescues the Col I and Col III gene expression in BPTES-treated fibroblasts. *P < .05; **P < .01; ***P < .001. α-SMA = α-smooth muscle actin; BPTES = bis-2-(5-phenylacetamido-1,3,4-thiadiazol-2-yl) ethyl sulfide; Col I = collagen 1; Col III = collagen 3; DMK = dimethyl 2-oxoglutarate;
BPTES Reduced Elevated Production of Col I in iLTS Scar Fibroblasts
Col I protein expression was measured in the cell pellets, which was significantly reduced by 40% following treatment of BPTES in iLTS scar fibroblasts at 24 hours compared to untreated iLTS scar fibroblasts (247.6 vs. 414.1 pg/μg protein, mean difference: 166.6 pg/μg protein, n = 6, P = .031, 95% CI: 19.74 to 313.4 pg/μg protein) (Fig. 4). Col I protein expression was significantly increased by the addition of DMK in BPTES-treated iLTS scar fibroblasts compared to the BPTES-treated iLTS scar fibroblasts without the supplement of DMK (311.7 vs. 247.6 pg/μg protein, n = 6, P = .021, 95% CI: −214.5 to 86.15 pg/μg protein) (Fig. 4).
Fig. 4.
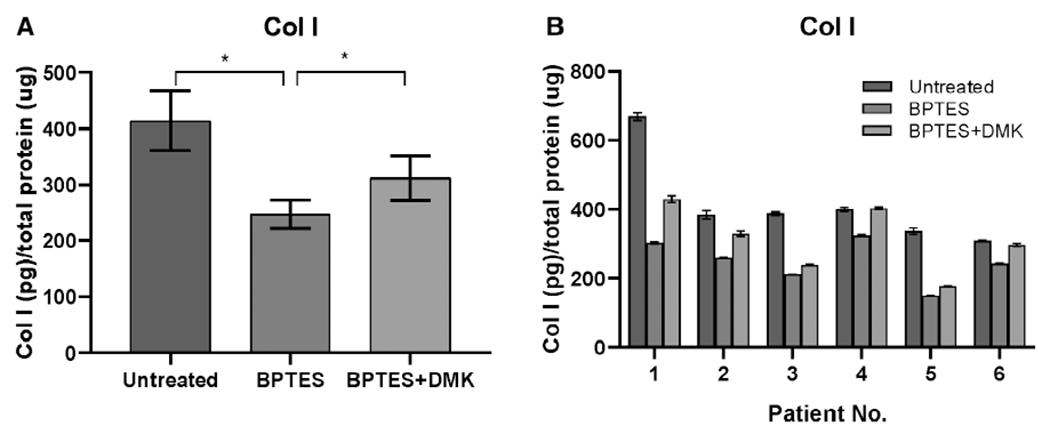
BPTES reduces Col I protein. (A) BPTES treatment significantly decreases the Col I protein production in iLTS scar fibroblasts compared to untreated fibroblasts at 24 hours. DMK successfully rescues the Col I protein production in BPTES-treated fibroblasts. *P < .05. (B) Col I protein expression is reported on a per-subject basis. BPTES = bis-2-(5-phenylacetamido-1,3,4-thiadiazol-2-yl) ethyl sulfide; Col I = collagen 1; DMK = dimethyl 2-oxoglutarate.
BPTES Alters the Metabolic Behavior of iLTS Scar Fibroblasts
Comparison of the metabolic profile of iLTS scar fibroblasts with and without BPTES treatment found a reduction in glycolytic reserve following BPTES treatment (mean glycolytic reserve of untreated iLTS scar fibroblasts: 3.5 mpH/min/10 μg protein versus a mean glycolytic reserve of treated iLTS scar fibroblasts: 1.38 mpH/min/10 μg protein, 95% CI: −3.5 to −0.91 mpH/min/10 μg protein, n = 6, P = .007) (Fig. 5). Glycolysis and glycolytic capacity did not change between BPTES-treated and untreated iLTS scar fibroblasts. Cellular mitochondrial oxidative phosphorylation parameters, including basal respiration, maximal respiration, and adenosine triphosphate production did not change in BPTES-treated iLTS scar fibroblasts compared with untreated iLTS scar fibroblasts. Results are summarized in Figures 5 and 6.
Fig. 5.
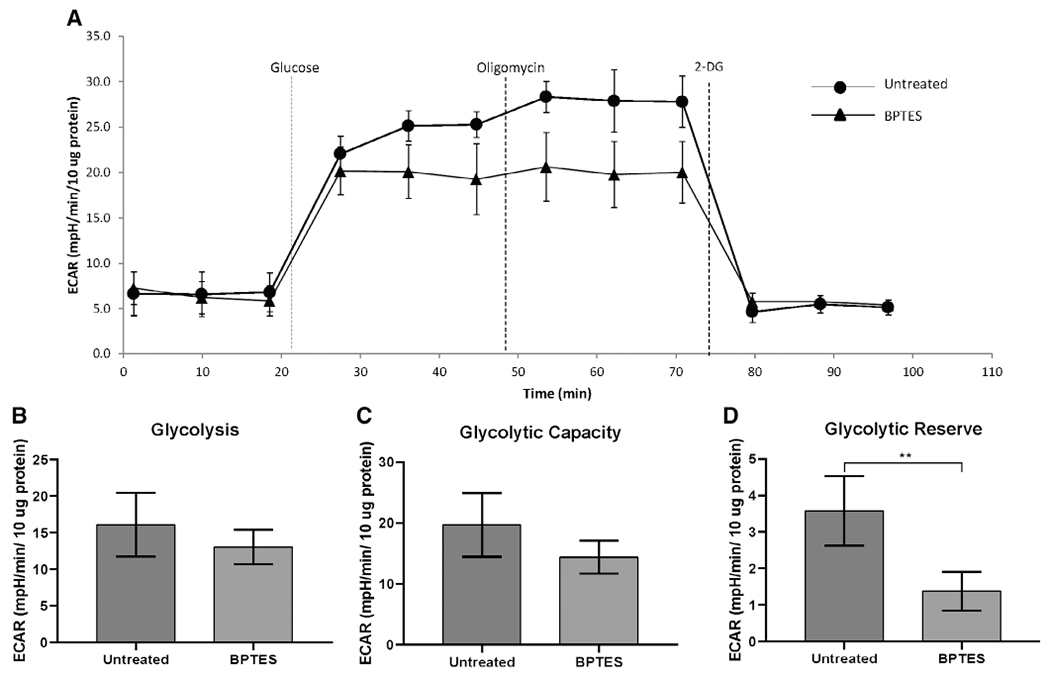
BPTES reduces the glycolytic reserve in iLTS scar fibroblasts at 24 hours. (A) Glycolytic test conducted on an XF24 analyzer of a patient set. There is no significant difference in glycolysis capacity (B) and maximal respiration (C) between BPTES treated and untreated iLTS scar fibroblasts. (D) BPTES treated iLTS scar fibroblasts show significant lower glycolytic reserve that untreated iLTS scar fibroblasts. *P < .01. 2-DG = 2-deoxy-glucose; BPTES = bis-2-(5-phenylacetamido-1,3,4-thiadiazol-2-yl) ethyl sulfide; ECAR = extracellular acidification rate; iLTS = iatrogenic laryngotracheal stenosis.
Fig. 6.
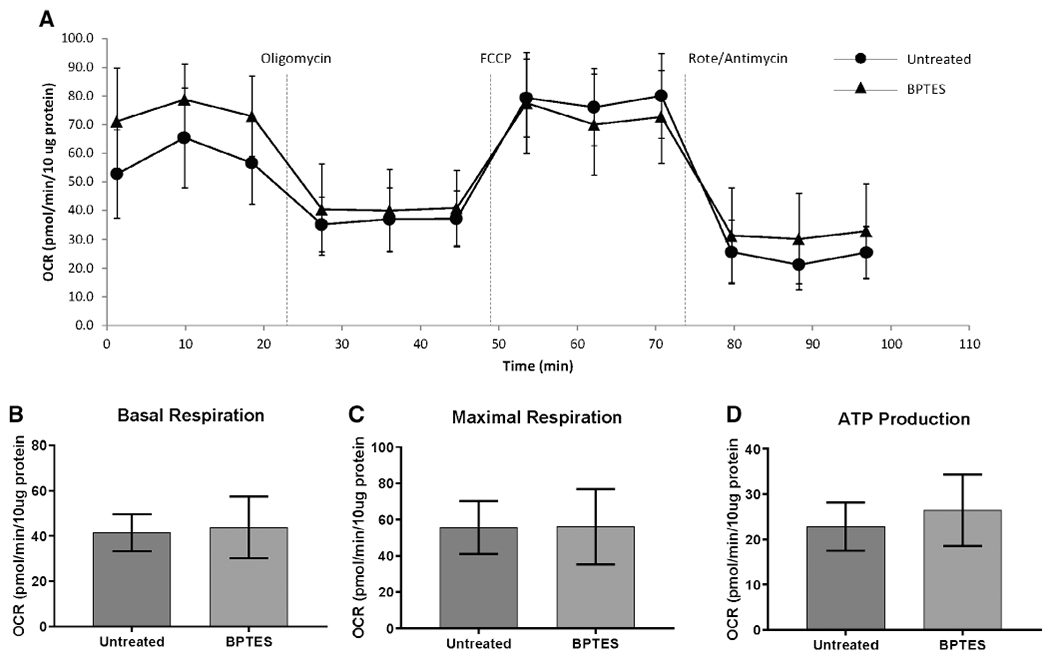
BPTES does not affect mitochondrial oxygen consumption in iLTS scar fibroblasts at 24 hours. (A) Mitochondrial stress test of a patient set conducted in a XF24 analyzer. There is no significant difference in basal respiration (B), maximal respiration (C), and ATP production (D) between BPTES-treated and untreated iLTS scar fibroblasts. ATP = adenosine triphosphate; BPTES = bis-2-(5-phenylacetamido-1,3,4-thiadiazol-2-yl) ethyl sulfide; FCCP = carbonyl-4-(trifluoromethoxy)phenylhydrazone; iLTS = iatrogenic laryngotracheal stenosis; OCR = oxygen consumption rate; Rote = rotenone.
DISCUSSION
In this study, we demonstrated that iLTS scar fibroblasts have high GLS expression, and that inhibition of GLS activity attenuated iLTS scar fibroblast proliferation and function. The data showed that targeted inhibition of GLS with BPTES decreased cell proliferation, collagen expression and production, and reduced glycolysis, which is the preferred bioenergetic mechanism in scar fibroblasts. Furthermore, the importance of GLS is confirmed by the successful DMK rescue that restored collagen production.
This study elucidates one mechanism by which the global glutamine antagonist DON reverses fibrosis in iLTS scar fibroblasts. Treatment with DON has recently been shown to reduce iLTS scar fibroblast proliferation and collagen production in vitro. DON broadly inhibits multiple enzymes within the glutamine pathway, including GLS, asparagine synthase, nicotinamide adenine dinucleotide (NAD) synthase, and other enzymes involved in purine and pyrimidine synthesis to reverse fibrosis (Fig. 7).25 To identify the critical enzyme of DON’s complex metabolic inhibition, we chose to focus on GLS using the specific GLS inhibitor BPTES and DMK, the subsequent metabolite of α-KG in the glutamine pathway, as a rescue agent. Proliferating iLTS scar fibroblasts highly express GLS, which is upregulated in a wide variety of cancers (e.g., breast, lung, cervix, and brain) and lung fibrosis.12,26–28 Similar to the results of this study, GLS inhibition suppressed glutamine-dependent cancers and reversed lung fibrosis.20,29–31 BPTES inhibition of GLS was effective at reducing fibroblast proliferation and collagen production and may be the principal reason why DON is effective to reverse iLTS.14
Fig. 7.
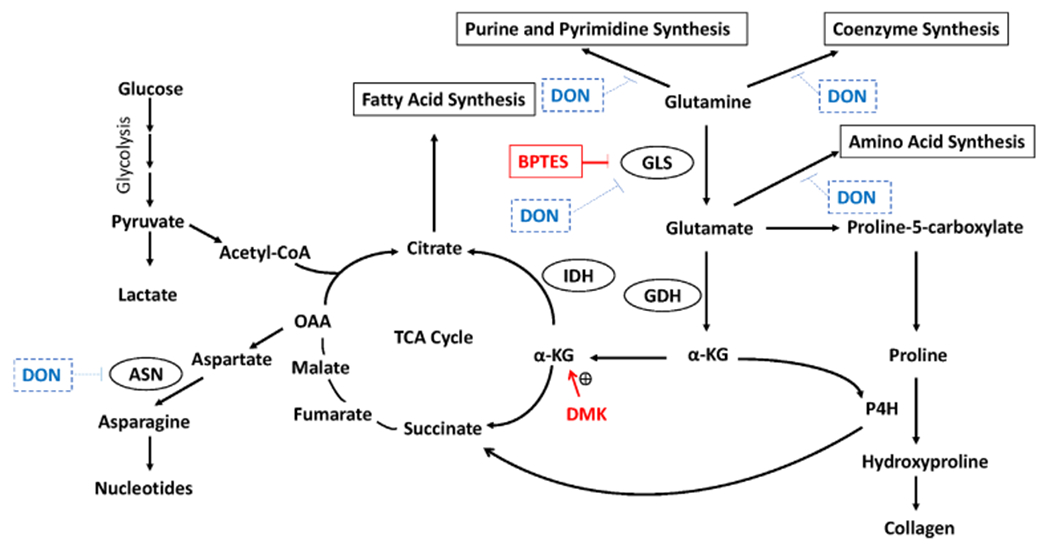
Different uses of glutamine in hyperproliferating cells. In proliferating cells, glutamine is converted to glutamate by glutaminase (GLS). Then the glutamate can either be converted to α-KG by GDH or contribute to amino acid synthesis and collagen formation. α-KG enters to the TCA cycle for energy production or replenishes the citrate content for the fatty acid synthesis that is essential for proliferating cells. In addition, α-KG is also a cofactor for P4H for the collagen formation that plays an important role for the formation of iLTS scar fibroblasts. Drugs that inhibit glutamine metabolism has been used for the treatment of lung fibrosis and cancer. In this study, BPTES inhibits the GLS to reduce the conversion of glutamine to glutamate and affect downstream metabolic pathways. DON inhibits multiple enzyme which includes GLS, ASN and NAD synthetase and also inhibit coenzyme, amino acids, purine and pyrimidine synthesis. In the present study, DMK, a α-KG analogue, is used to restore α-KG to rescue the inhibitory effect of BPTES. α-KG = α-ketoglutarate; ASN = asparagine synthase; BPTES = bis-2-(5-phenylacetamido-1,3,4-thiadiazol-2-yl) ethyl sulfide; DMK = dimethyl 2-oxoglutarate; DON = 6-Diazo-5-oxo-L-norleucine; GDH = glutamate dehydrogenase; IDH = isocitrate dehydrogenase; iLTS = iatrogenic laryngotracheal stenosis; OAA = oxaloacetic acid; P4H = Prolyl-4-hydroxylase; TCA = tricarboxylic. [Color figure can be viewed in the online issue, which is available at www.laryngoscope.com.]
Glycolysis is the preferred biosynthetic pathway for iLTS fibroblasts.9 Metabolic inhibition by DON reduced both glycolysis and oxidative phosphorylation in iLTS scar fibroblasts.14 In the present study, BPTES reduced the glycolytic reserve, a glycolysis outcome measure, in iLTS scar fibroblasts but did not have an effect on mitochondrial oxidative phosphorylation. The results are consistent with a previous study that showed BPTES had no effect on mitochondrial oxidative phosphorylation in normal lung fibroblasts.21 Therefore, BPTES inhibits the collagen production and cell proliferation by blocking glycolysis in iLTS scar fibroblasts, which have a greater demand for glutamine to support their pathologic behavior. Furthermore, GLS inhibition has a direct effect on collagen production by blocking proline hydroxylation to hydroxyproline, which is a critical substrate in collagen synthesis. These effects combine to potentially contribute to reversing fibrosis (Fig. 7).12,15,21,32
Although this study demonstrated the specific importance of GLS inhibition, inhibitors such as BPTES do not translate well in vivo or clinically due to its high molecular weight and low bioavailability.33 Global glutamine antagonists, such as DON and its prodrug, JHU-086, have lower molecular weight and higher bioavailability.34 When given systemically, DON has significant gastrointestinal side effects; however, local treatment modalities such as use of a drug-eluting stent and/or intralesional injection may allow DON or its analogues to be an effective treatment of iLTS.35 Ultimately, in vivo studies are needed to validate the targeted inhibitory effect of GLS for the treatment of iLTS. Another limitation was the variability among iLTS scar fibroblasts derived from six different patients in respond to BPTES treatment. This variability can result from the heterogeneity of the pathogenic mechanism, sampling differences or genetic variation in the wound healing process. However, when averaged, there were significant differences between BPTES treated and untreated iLTS scar fibroblast across all outcomes measured.
CONCLUSION
The data support that GLS may be a critical enzyme inhibited by DON and may be responsible for its antifibrotic effects. Specific blockage of GLS activity with BPTES significantly inhibits iLTS scar fibroblasts proliferation, collagen deposition, and metabolic activity. Supplemented with DMK, Col I and Col III expression was restored, indicating the specific inhibition on GLS activity by BPTES. These results suggest that inhibition of GLS and other enzymes in the glutamine pathway may be a successful strategy to reverse scar formation in laryngotracheal stenosis.
Acknowledgments
This work was supported by National Institute on Deafness and Other Communication Disorders (NIDCD) of the National Institutes of Health under award number 1K23DC014082 and 1R21DC017225 (a.h.). The content is solely the responsibility of the authors and does not necessarily represent the official views of the National Institutes of Health. This study was also financially supported by the Triological Society and American College of Surgeons (a.h.), and a T32 NIDCD training grant (k.m.).
The authors have no other funding, financial relationships, or conflicts of interest to disclose.
Footnotes
Level of Evidence: NA
Contributor Information
Hsiu-Wen Tsai, Department of Otolaryngology-Head and Neck Surgery, Johns Hopkins School of Medicine, Baltimore, Maryland, U.S.A..
Kevin M. Motz, Department of Otolaryngology-Head and Neck Surgery, Johns Hopkins School of Medicine, Baltimore, Maryland, U.S.A..
Dacheng Ding, Department of Otolaryngology-Head and Neck Surgery, Johns Hopkins School of Medicine, Baltimore, Maryland, U.S.A..
Ioan Lina, Department of Otolaryngology-Head and Neck Surgery, Johns Hopkins School of Medicine, Baltimore, Maryland, U.S.A..
Michael K. Murphy, Department of Otolaryngology, State University of New York Upstate Medical University, Syracuse, New York, U.S.A..
Dimitri Benner, Medical University of Vienna, Vienna, Austria.
Michael Feeley, Department of Biomedical Engineering, Widener University, Chester, Pennsylvania, U.S.A..
Jody Hooper, Department of Pathology, Johns Hopkins School of Medicine, Baltimore, Maryland, U.S.A..
Alexander T. Hillel, Department of Otolaryngology-Head and Neck Surgery, Johns Hopkins School of Medicine, Baltimore, Maryland, U.S.A..
BIBLIOGRAPHY
- 1.Dankle SK, Schuller DE, McClead RE. Risk factors for neonatal acquired subglottic stenosis. Ann Otol Rhinol Laryngol 1986;95:626–630. [DOI] [PubMed] [Google Scholar]
- 2.Gelbard A, Francis DO, Sandulache Vc, Simmons JC, Donovan DT, Ongkasuwan J. Causes and consequences of adult laryngotracheal stenosis. Laryngoscope 2015;125:1137–1143. [DOI] [PMC free article] [PubMed] [Google Scholar]
- 3.Esteller-More E, Ibanez J, Matino E, Adema JM, Nolla M, Quer IM. Prognostic factors in laryngotracheal injury following intubation and/or tracheotomy in ICU patients. Eur Arch Otorhinolaryngol 2005;262:880–883. [DOI] [PubMed] [Google Scholar]
- 4.Rockey DC, Bell PD, Hill JA. Fibrosis–A common pathway to organ injury and failure. N Engl J Med 2015;373:96. [DOI] [PubMed] [Google Scholar]
- 5.Hillel AT, Samad I, Ma G, et al. Dysregulated macrophages are present in bleomycin-induced murine laryngotracheal stenosis. Otolaryngol Head Neck Surg 2015;153:244–250. [DOI] [PMC free article] [PubMed] [Google Scholar]
- 6.Minnigerode B, Richter HG. Pathophysiology of subglottic tracheal stenosis in childhood. Prog Pediatr Surg 1987;21:1–7. [DOI] [PubMed] [Google Scholar]
- 7.Motz KM, Yin LX, Samad I, et al. Quantification of inflammatory markers in laryngotracheal stenosis. Otolaryngol Head Neck Surg 2017;157:466–472. [DOI] [PMC free article] [PubMed] [Google Scholar]
- 8.Gadkaree SK, Pandian V, Best S, et al. Laryngotracheal stenosis: risk factors for tracheostomy dependence and dilation interval. Otolaryngol Head Neck Surg 2017;156:321–328. [DOI] [PMC free article] [PubMed] [Google Scholar]
- 9.Ma G, Samad I, Motz K, et al. Metabolic variations in normal and fibrotic human laryngotracheal-derived fibroblasts: a Warburg-like effect. Laryngoscope 2017;127:E107–E113. [DOI] [PMC free article] [PubMed] [Google Scholar]
- 10.Liberti MV, Locasale JW. The Warburg effect: how does it benefit cancer cells? Trends Biochem Sci 2016;41:211–218. [DOI] [PMC free article] [PubMed] [Google Scholar]
- 11.Albayrak G, Konac E, Dikmen AU, Bilen CY. Memantine induces apoptosis and inhibits cell cycle progression in LNCaP prostate cancer cells. Hum Exp Toxicol 2018;37:953–958. [DOI] [PubMed] [Google Scholar]
- 12.Altman BJ, Stine ZE, Dang CV. From Krebs to clinic: glutamine metabolism to cancer therapy. Nat Rev Cancer 2016;16:749. [DOI] [PubMed] [Google Scholar]
- 13.Kim SY. Cancer energy metabolism: shutting power off cancer factory. Biomol Ther (Seoul) 2018;26:39–44. [DOI] [PMC free article] [PubMed] [Google Scholar]
- 14.Murphy MK, Motz KM, Ding D, et al. Targeting metabolic abnormalities to reverse fibrosis in iatrogenic laryngotracheal stenosis. Laryngoscope 2018; 128:E59–E67. [DOI] [PMC free article] [PubMed] [Google Scholar]
- 15.Choi YK, Park KG. Targeting glutamine metabolism for cancer treatment. Biomol Ther (Seoul) 2018;26:19–28. [DOI] [PMC free article] [PubMed] [Google Scholar]
- 16.Xiang Y, Stine ZE, Xia J, et al. Targeted inhibition of tumor-specific glutaminase diminishes cell-autonomous tumorigenesis. J Clin Invest 2015; 125:2293–2306. [DOI] [PMC free article] [PubMed] [Google Scholar]
- 17.Leone RD, Zhao L, Englert JM, et al. Glutamine blockade induces divergent metabolic programs to overcome tumor immune evasion. Science 2019; 366:1013–1021. [DOI] [PMC free article] [PubMed] [Google Scholar]
- 18.Schulte ML, Fu A, Zhao P, et al. Pharmacological blockade of ASCT2-dependent glutamine transport leads to antitumor efficacy in pre-clinical models. Nat Med 2018;24:194–202. [DOI] [PMC free article] [PubMed] [Google Scholar]
- 19.Ge J, Cui H, Xie N, et al. Glutaminolysis promotes collagen translation and stability via α-ketoglutarate-mediated mTOR activation and proline hydroxylation. Am J Respir Cell Mol Biol 2018;58:378–390. [DOI] [PMC free article] [PubMed] [Google Scholar]
- 20.Cui H, Xie N, Jiang D, et al. Inhibition of glutaminase 1 attenuates experimental pulmonary fibrosis. Am J Respir Cell Mol Biol 2019;61:492–500. [DOI] [PMC free article] [PubMed] [Google Scholar]
- 21.Hamanaka RB, O’Leary EM, Witt LJ, et al. Glutamine metabolism is required for collagen protein synthesis in lung fibroblasts. Am J Respir Cell Mol Biol 2019;61:597–606. [DOI] [PMC free article] [PubMed] [Google Scholar]
- 22.Wang D, Meng G, Zheng M, et al. The glutaminase-1 inhibitor 968 enhances dihydroartemisinin-mediated antitumor efficacy in hepatocellular carcinoma cells. PLoS One 2016;11:e0166423. [DOI] [PMC free article] [PubMed] [Google Scholar]
- 23.Yuan L, Sheng X, Clark LH, et al. Glutaminase inhibitor compound 968 inhibits cell proliferation and sensitizes paclitaxel in ovarian cancer. Am J Transl Res 2016;8:4265–4277. [PMC free article] [PubMed] [Google Scholar]
- 24.Motz K, Samad I, Yin LX, et al. Interferon-gamma treatment of human laryngotracheal stenosis-derived fibroblasts. JAMA Otolaryngol Head Neck Surg 2017;143:1134–1140. [DOI] [PMC free article] [PubMed] [Google Scholar]
- 25.Pinkus LM. Glutamine binding sites. Methods Enzymol 1977;46:414–427. [DOI] [PubMed] [Google Scholar]
- 26.Bhattacharjee A, Richards WG, Staunton J, et al. Classification of human lung carcinomas by mRNA expression profiling reveals distinct adenocarcinoma subclasses. Proc Natl Acad Sci U S A 2001;98:13790–13795. [DOI] [PMC free article] [PubMed] [Google Scholar]
- 27.French PJ, Swagemakers SM, Nagel JH, et al. Gene expression profiles associated with treatment response in oligodendrogliomas. Cancer Res 2005;65:11335–11344. [DOI] [PubMed] [Google Scholar]
- 28.Saha SK, Islam SMR, Abdullah-Al-Wadud M, Islam S, Ali F, Park KS. Multiomics analysis reveals that GLS and GLS2 differentially modulate the clinical outcomes of cancer. J Clin Med 2019;8:E355. [DOI] [PMC free article] [PubMed] [Google Scholar]
- 29.Zhang J, Mao S, Guo Y, Wu Y, Yao X, Huang Y. Inhibition of GLS suppresses proliferation and promotes apoptosis in prostate cancer. Biosci Rep 2019;39:BSR20181826. [DOI] [PMC free article] [PubMed] [Google Scholar]
- 30.Reis LMD, Adamoski D, Ornitz Oliveira Souza R, et al. Dual inhibition of glutaminase and carnitine palmitoyltransferase decreases growth and migration of glutaminase inhibition-resistant triple-negative breast cancer cells. J Biol Chem 2019;294:9342–9357. [DOI] [PMC free article] [PubMed] [Google Scholar]
- 31.Lampa M, Arlt H, He T, et al. Glutaminase is essential for the growth of triple-negative breast cancer cells with a deregulated glutamine metabolism pathway and its suppression synergizes with mTOR inhibition. PLoS One 2017;12:e0185092. [DOI] [PMC free article] [PubMed] [Google Scholar]
- 32.DeBerardinis RJ, Mancuso A, Daikhin E, et al. Beyond aerobic glycolysis: transformed cells can engage in glutamine metabolism that exceeds the requirement for protein and nucleotide synthesis. Proc Natl Acad Sci U S A 2007;104:19345–19350. [DOI] [PMC free article] [PubMed] [Google Scholar]
- 33.Chen L, Cui H. Targeting glutamine induces apoptosis: a cancer therapy approach. Int J Mol Sci 20150;16:22830–22855. [DOI] [PMC free article] [PubMed] [Google Scholar]
- 34.Rais R, Jancarik A, Tenora L, et al. Discovery of 6-diazo-5-oxo-l-norleucine (DON) prodrugs with enhanced CSF delivery in monkeys: a potential treatment for glioblastoma. J Med Chem 2016;59:8621–8633. [DOI] [PubMed] [Google Scholar]
- 35.Lemberg KM, Vornov JJ, Rais R, Slusher BS. We’re not “DON” yet: optimal dosing and prodrug delivery of 6-diazo-5-oxo-L-norleucine. Mol Cancer Ther 2018;17:1824–1832. [DOI] [PMC free article] [PubMed] [Google Scholar]


