

Abstract
Acute stress induces large‐scale neural reorganization with relevance to stress‐related psychopathology. Here, we applied a novel supervised machine learning method, combining the strengths of a priori theoretical insights with a data‐driven approach, to identify which connectivity changes are most prominently associated with a state of acute stress and individual differences therein. Resting‐state functional magnetic resonance imaging scans were taken from 334 healthy participants (79 females) before and after a formal stress induction. For each individual scan, mean time‐series were extracted from 46 functional parcels of three major brain networks previously shown to be potentially sensitive to stress effects (default mode network (DMN), salience network (SN), and executive control networks). A data‐driven approach was then used to obtain discriminative spatial linear filters that classified the pre‐ and post‐stress scans. To assess potential relevance for understanding individual differences, probability of classification using the most discriminative filters was linked to individual cortisol stress responses. Our model correctly classified pre‐ versus post‐stress states with highly significant accuracy (above 75%; leave‐one‐out validation relative to chance performance). Discrimination between pre‐ and post‐stress states was mainly based on connectivity changes in regions from the SN and DMN, including the dorsal anterior cingulate cortex, amygdala, posterior cingulate cortex, and precuneus. Interestingly, the probability of classification using these connectivity changes were associated with individual cortisol increases. Our results confirm the involvement of DMN and SN using a data‐driven approach, and specifically single out key regions that might receive additional attention in future studies for their relevance also for individual differences.
Keywords: acute stress, default mode network, functional connectivity, machine learning, resting‐state functional magnetic resonance imaging, salience network, stress effects
1. INTRODUCTION
Acute stress as well as stress‐related psychopathologies have been proposed to involve abnormalities in three major brain networks, namely the salience network (SN), default mode network (DMN), and central executive networks (CEN; Hermans et al., 2011; Menon, 2011; Zhang et al., 2019). However, few studies empirically tested how stress affects brain architecture at the network level (Hermans et al., 2011; Maron‐Katz, Vaisvaser, Lin, Hendler, & Shamir, 2016; Young et al., 2016; Zhang et al., 2019). The vast majority of research on functional connections has focused on a limited number of core regions from those major networks regarding stress effects and related psychopathologies (Koch et al., 2016; van Oort et al., 2017). The commonly used seed‐based analyses in these studies are hypothesis driven and thus enable direct testing with straightforward interpretations (Cole, Smith, & Beckmann, 2010). However, this approach relies heavily on strong a priori knowledge about the critical brain regions responsive to stress, and the seed‐region selection could very well be biased. In contrast, current network‐level approaches consider distributed circuits or regions as a unified piece. This leaves it unacknowledged that human behavior and cognition are associated with not only integrated but also segregated neural circuits that vary dynamically under different contextual demands (Cohen & D'Esposito, 2016; Keerativittayayut, Aoki, Sarabi, Jimura, & Nakahara, 2018; Shine, van den Brink, Hernaus, Nieuwenhuis, & Poldrack, 2018). Consequently, the difficulty in defining networks, as well as lack of specificity of interregional connectivity patterns, has therefore been key critiques of this type of analyses. An intermediate approach that takes a data‐driven perspective with the guidance from a priori knowledge about major brain networks may solve the aforementioned issues and allow for investigations into neural network‐level stress responses with enriched information about regional connectivity patterns. Here, we applied a novel analysis in a relatively large sample to balance the strength and drawbacks of analyses described earlier.
Previously, acute stress has been shown to induce connectivity changes in SN, DMN, and CEN at the network level (Hermans et al., 2011; Zhang et al., 2019), as well as in specific core regions, particularly the amygdala, dorsal anterior cingulate cortex (dACC), medial prefrontal cortex (mPFC), posterior cingulate cortex (PCC), and precuneus (PCu) (Li, Weerda, Milde, Wolf, & Thiel, 2014; Maron‐Katz et al., 2016; Vaisvaser et al., 2013; see comprehensive review by van Oort et al., 2017). It is worth noting that aforementioned core regions had been considered mostly as a unified structure (i.e., using the entire structure as the seed), whereas converging evidence indicates distinctive functions of their subregions (Cavanna & Trimble, 2006; Cha, Jo, Gibson, & Lee, 2017; Leech & Sharp, 2014; Margulies et al., 2009). In order to test the relevance of these regions with a refined resolution in stress reactivity, we set out to investigate whether their functional connections can substantially drive the classification between pre‐stress and post‐stress brain states. In specific, this study tests connectivity changes in resting‐state functional magnetic resonance imaging (rs‐fMRI) scans taken immediately before and after a formal stress induction that took about 8 min. In contrast to previous studies investigating stress‐induced connectivity changes as a whole in SN, DMN, and CEN (Hermans et al., 2011; Zhang et al., 2019), here we aim to elucidate which functional units (i.e., subregions of large core regions) within these networks will exhibit altered functional connections after stress induction. Furthermore, to explore the neural origins of individual differences in acute stress responses, characteristics of the classifiers (i.e., the discriminant features between pre‐ and post‐stress states) will be linked to acute stress‐induced cortisol level. As have been shown in our previous study, this measure increased after acute stress induction that indicated the perturbance of the system upon challenges (Zhang et al., 2019).
To better characterize functional architectures of interest, here we employed a machine‐learning algorithm to linearly index potential classes of interest (i.e., pre‐ vs. post‐stress), using the average fMRI BOLD signals from the functional connectivity‐based brain parcels (or functional regions of interest, fROI) from the aforementioned SN, DMN, and CEN. This technique has been recently applied for the first time to fMRI data to discriminate different mental states (Llera, Chauvin, Mulders, Naaijen, & Mennes, 2019). Taking the information from multiple functional parcels with the restrictions of three major brain networks, our approach bridges macro network‐level analysis that allows for quantifying the neural substrates of stress reactivity as a system, with more micro parcel or cluster‐level analysis that enables the disclosure of local spatial characteristics of these networks. This intermediate meso‐level approach therefore offers an opportunity to identify stress responses at a refined neural level.
2. METHODS AND MATERIALS
2.1. Participants
We used data from 372 participants that were acquired in accordance with the principles of the Declaration of Helsinki and approved by the Independent Review Board Nijmegen (IRBN), the Netherlands. All participants gave their written informed consent before the study, and all data were collected at the Donders Institute for Brain, Cognition, and Behavior in Nijmegen, the Netherlands. Exclusion criteria included any current psychiatric or neurological disorder, a history of, or current endocrine or neurological treatment, current use of psychotropic medication, and current drug or alcohol abuse (full details in Koch et al., 2017). Further exclusion included data with signal artifacts and excessive head movements, resulting in a final sample of 334 participants (including 79 females; mean age = 24.01; full exclusion details in Zhang et al., 2019).
These data were previously used to identify stress‐related connectivity changes at the network level, using a priori hypotheses (Zhang et al., 2019). Here we used the same large data set, with a novel data‐driven approach to pinpoint which specific subdivisions from the networks of interest are most prominently affected by acute stress.
2.2. Experimental design
Acute stress induction took place in the late afternoon (i.e., between 4 and 7 p.m.) when the diurnal rhythm of cortisol allows for a relatively stable level (Miller et al., 2016). Two sessions of rs‐fMRI scanning were carried out, one before stress induction (RS1) and one after (RS2). All participants were acquainted with the scanning procedure before the acquisition of RS1 (full details of experiment protocols are provided in Koch et al., 2017).
Stress responses were induced by sequential administration of a socially evaluated cold pressor task (SECPT) and a mental arithmetic (MA) task, a procedure that has been shown to successfully induce psychophysiological and subjective stress responses (Luo et al., 2018; Schwabe, Haddad, & Schachinger, 2008). As has been implemented in previous studies (Luo et al., 2018; Vogel et al., 2015), participants were instructed to immerse their right foot in icy‐cold (0–3°C) water for 3 min and to count back out loud from 2053 in steps of 17 as quickly and accurately as possible (MA task) immediately after the SECPT.
2.3. Data acquisition
2.3.1. Imaging data acquisition
Each session of rs‐fMRI scan lasted for approximately 6 min, during which participants were instructed to lie still and to look at a small white cross at the screen center. All images were collected using a 3T Siemens Magnetom Prismafit MRI scanner (Erlangen, Germany) with a 32‐channel head coil. A T2*‐weighted multiband echo planar imaging sequence with acceleration factor 8 (MB8) was used to acquire BOLD‐fMRI whole‐brain covered images (TR = 735 ms, TE = 39 ms, flip angle = 52°, voxel size = 2.4 × 2.4 × 2.4 mm3, slice gap = 0 mm, and FOV = 210 mm). This state‐of‐the‐art sequencing protocol was optimized from the recommended imaging protocols for the Human Connectome Project (http://protocols.humanconnectome.org/HCP/3T/imaging-protocols.html), with the fast acquisition speed facilitating the detection and removal of non‐neuronal contributions to BOLD changes (Boubela, Kalcher, Nasel, & Moser, 2014). High‐resolution structural images (1 × 1 × 1 mm3) were also acquired, using a T1‐weighted MP‐RAGE sequence (TR = 2,300 ms, TE = 3.03 ms, flip angle = 8°, and FOV = 256 × 256 × 192 mm3).
2.3.2. Stress measurement collection
Salivary samples, as well as self‐reported ratings of positive and negative affect schedule (Watson, Clark, & Tellegan, 1988), were collected in a total of five times around acute stress induction −10, 0, +10, +20, and + 30 min with respect to the onset time (at 0 min) of stress induction. In addition to salivary cortisol levels, subjective ratings on negative affect were calculated using the sum scores of the 10 negative affect items for each participant.
2.4. Statistical analysis
2.4.1. Analyses on stress measures
Increases in salivary cortisol and negative affect ratings were calculated for each participant as the indication of stress level. Specifically, cortisol increase was defined as cortisol level at time 20 min after stress induction onset (i.e., peak level) subtracted from time 0 (baseline level), whereas negative affect increase was calculated as the difference in ratings between the baseline and at time 10 min after stress induction onset (i.e., peak level for negative affect). Main effects of sampling time and significant increases were observed in cortisol level (i.e., differences between peak level at +20 min and baseline at 0 min) and subjective report on negative affect (i.e., differences between peak level at +10 min and baseline at 0 min), indicating a successful stress induction (see Figure 1 in Zhang et al., 2019).
FIGURE 1.
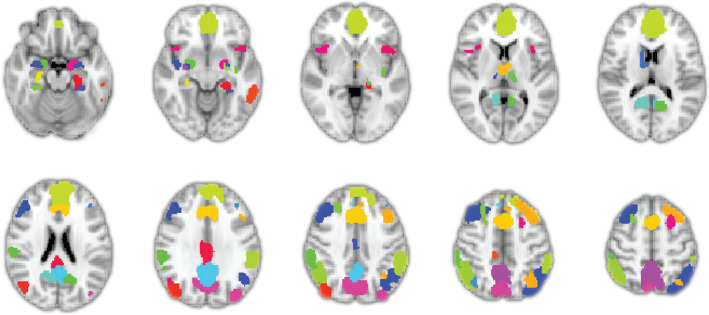
The selected 46 functional parcels from the salience network, the default mode network, and the central executive network. Forty parcels were from the Stanford FIND atlas (i.e., including the medial prefrontal cortex, dorsal anterior cingulate cortex, anterior and posterior insula, posterior cingulate cortex, precuneus), and the remaining six (i.e., bilateral amygdala subnuclei) were from Jülich Cytoarchitectonic probability atlas. The full list of included parcels can be found in Table 1
2.4.2. fMRI preprocessing and analysis
Preprocessing
Analysis of fMRI data was performed with FSL5.0.9 (FMRIB, Oxford, UK). The first five images of each resting‐state scan were discarded to allow for T2* equilibration effects. Further preprocessing included motion correction, spatial smoothing with a 5 mm full‐width‐half‐maximum kernel, denoising using ICA‐AROMA (Pruim et al., 2015), and high‐pass filtering with a cut‐off of 100 seconds. To further minimize motion and psychophysiological confounds after the denoising procedure, the six realignment parameters, their temporal derivatives, and the quadratic terms of both the original parameters and derivatives were used as motion parameters in a multiple linear regression model (Caballero‐Gaudes & Reynolds, 2017; Friston, Williams, Howard, Frackowiak, & Turner, 1996; Zu Eulenburg, Caspers, Roski, & Eickhoff, 2012). Additionally, each individual T1 image was segmented, using the FAST function from FSL (Zhang, Brady, & Smith, 2001) for subject‐specific white matter and Cerebrospinal fluid (CSF) masks that were subsequently thresholded with a 95% probability and registered with the individual functional image. The mean signal intensities of white matter and CSF were extracted and included in the regression model (Caballero‐Gaudes & Reynolds, 2017; Satterthwaite et al., 2013). The resulting residuals of the imaging data were used for further analyses, with each participant having one pre‐ and one post‐stress rs‐fMRI recording.
2.4.3. Identifying spatial characteristics of pre‐ and post‐stress states from rs‐fMRI data
In a previous study by Llera et al. (2019), the algorithm of Spatial Patterns for Discriminative Estimation (SPADE) was introduced and validated to achieve optimal discriminative linear filtering between two fMRI conditions (i.e., task vs. resting state). Briefly, the idea behind the SPADE is to provide a different representation of the time‐series data (X) by learning a new reference basis system (W). The learned basis vectors (i.e., columns of W) can also be understood as a set of linear spatial filters and are optimized to provide strong discrimination in terms of variance of the data that are projected into the new basis (i.e., var(W T X). Learning of these filters is achieved by solving a constrained generalized eigenvalue decomposition between two spatial covariance matrices that are obtained from the fMRI time‐series. In case of the current study, these covariance matrices are obtained from the pre‐ and post‐stress data sets, respectively. The full description of the methodology can be found in Llera, Chauvin, et al. (2019). Importantly, in contrast to common discriminative models that work in high‐dimensional full covariance/correlation space (i.e., 46 × 45/2 = 1,035 dimensions in the current study), the strength of the SPADE is to extract linear spatial filters that allow a low‐dimensional and simpler interpretation of the connectivity changes between (pre‐ and post‐stress) conditions. This advantage of the SPADE has been extensively illustrated in Llera, Chauvin, et al. (2019), where the authors show that the SPADE discriminative accuracy is comparable to that of an SVM but with enhanced interpretability.
In the current study, we used SPADE for the first time to identify resting‐state connectivity patterns that best discriminate between stressed and non‐stressed states. On the one hand, enhanced spatial resolution was considered to investigate the connectivity profile of subregions from large brain structures (i.e., PCC). On the other hand, given the number of data points from the rs‐fMRI data (see Section 2.3.1), a reduction in fMRI spatial dimensionality is required to compute full‐ranked spatial covariance matrices. Accordingly, a total of 40 functional parcels from the Stanford FIND atlas (Shirer, Ryali, Rykhlevskaia, Menon, & Greicius, 2012) that are all considered part of the intrinsic networks of interest (i.e., DMN, SN, and CEN) were selected as fROIs. Since the amygdala is not included in the FIND atlas while mounting evidence suggests its engagement in stress‐related processing (Janak & Tye, 2015; Ressler, 2010; Zhang et al., 2018; also see review by McEwen & Gianaros, 2010), we further augmented the set of functional units with three amygdala subnuclei of each hemisphere from the Jülich cytoarchitectonic probability map. A minimum probability of 25% was set to ensure the full coverage of the amygdala structure (Zilles & Amunts, 2010). The resulting 46 fROIs (Figure 1) were initially in the MNI space and were registered with the individual functional images for each participant (i.e., converted into individual native space). Thereafter, mean time‐series values were extracted from each subject‐specific fROI (see full list of fROI in Table 1). Such an approach allows for increased functional specificity of the fMRI signal because it reduces inaccurate registration across participants and avoids interpolation (Bijsterbosch, Smith, & Beckmann, 2017), or any potential structural bias induced in the fMRI data analysis pipeline due to the use of structural images (Llera, Wolfers, Mulders, & Beckmann, 2019).
TABLE 1.
Forty‐six functional parcels from the SN, DMN, and CEN
| Network | Subsystem region (parcel counts) | Hemisphere | |
|---|---|---|---|
| Left | Right | ||
| Bilateral | |||
| SN | Amygdala (6) | Centromedial nucleus | Centromedial nucleus |
| Laterobasal nucleus | Laterobasal nucleus | ||
| Superfical nucleus | Superfical nucleus | ||
| Anterior SN (3) | Anterior insula | Anterior insula | |
| Dorsal anterior cingulate gyrus | |||
| Posterior SN (10) | Middle frontal gyrus | ||
| Angular gyrus | |||
| Precuneus | |||
| Posterior cingulate cortex | |||
| Precuneus | |||
| Angular gyrus | |||
| Thalamus | Thalamus | ||
| Posterior insula | Posterior insula | ||
| DMN | Ventral DMN (9) | Posterior cingulate cortex | |
| Angular gyrus | |||
| Parahippocampal gyrus | |||
| Inferior parietal lobule | |||
| PCC/precuneus | |||
| PCC/precuneus | |||
| Middle frontal gyrus | |||
| Parahippocampal gyrus | |||
| Inferior parietal lobule | |||
| Dorsal DMN (7) | Medial prefrontal cortex | ||
| PCC/precuneus | |||
| Posterior cingulate gyrus | |||
| Angular gyrus | |||
| Thalamus | |||
| Hippocampal gyrus | Hippocampal gyrus | ||
| Precuneus (4) | Posterior cingulate cortex | ||
| Precuneus | |||
| Angular gyrus | Angular gyrus | ||
| CEN | Left CEN (3) | Middle frontal lobe | |
| Angular gyrus | |||
| Inferior temporal gyrus | |||
| Right CEN (4) | Middle frontal lobe | ||
| Angular gyrus | |||
| Superior frontal gyrus | |||
| Caudate | |||
Abbreviations: CEN, central executive network; DMN, default mode network; PCC, posterior cingulate cortex; SN, salience network.
Next, we constructed cross‐subject covariance matrices between all parcel‐specific time‐courses for pre‐ and post‐stress data sets separately. We then used the SPADE analysis that projected the pre‐ and post‐stress data onto a common space to learn the spatial filters that represent most discriminative features between pre‐ and post‐stress scans. Importantly, the learned spatial filters from each covariance matrix maximized the explained variances either in the pre‐ or post‐stress data sets (Figure 2). A leave‐one‐out cross‐validation approach was used to validate the robustness of the learned filters by using the data from N−1 participants at each fold for generating covariance matrices, learning spatial filters, extracting features, and training a linear discriminant analyses classifier (Bishop, 2007). We log transformed variances of the data projected onto the spatial filters to obtain the features and assessed the quality of the classifier using the averaged ratio of correctly classified samples (i.e., classification accuracy) across folds. Critically, we trained the model at different dimensionalities (i.e., using different number of filters) and selected the smallest number of filters whose predictive accuracy is statistically comparable with the possible maximum performance. Importantly, this accuracy was obtained as the mean of the classification performance across N−1 folds, using leave‐one‐out cross validation. The selected filters therefore reflected generalization ability to the unseen (i.e., left out) data. Wilcoxon signed‐rank tests were then conducted to test the classification accuracy of our model against a random chance of 50% and to test accuracy improvements with increasing dimensionality. In order to locate crucial functional parcels (i.e., fROIs) from the SN, DMN, and CEN that are responsive to acute stress induction, the most discriminative spatial filters were transformed into anatomical spatial maps in the brain (Haufe et al., 2014). A cut‐off of Z > 1.96 was used for these interpretable spatial maps.
FIGURE 2.
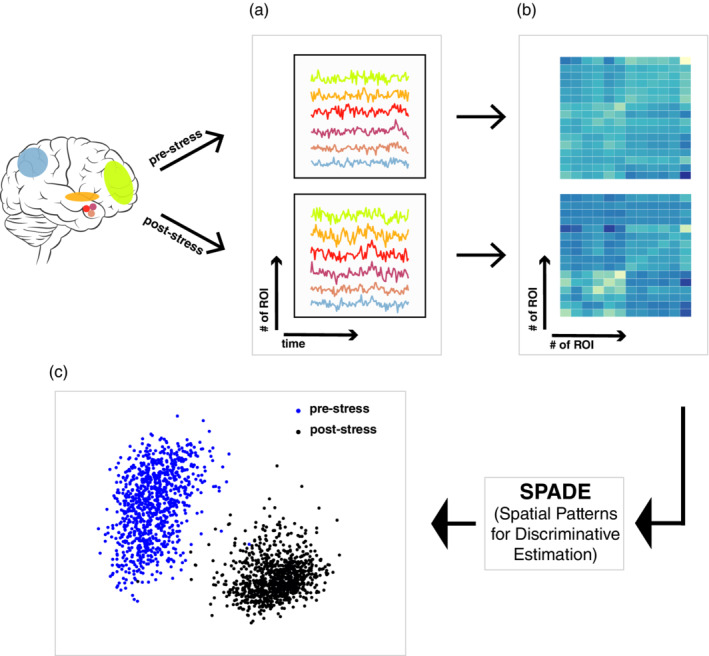
Illustration of analysis steps. Mean time‐courses were extracted from all N participants for pre‐ and post‐stress scans, respectively (a). Thereafter, covariance matrices were constructed for pre‐ and post‐stress data separately across N−1 (i.e., leave‐one‐out) participants (b), which were further fed into SPADE for obtaining discriminative spatial filters. These spatial filters can discriminate the pre‐ from the post‐stress data at individual subject level as summarized by the log‐transformed variances of the fMRI data projected to the spatial filters (i.e., dots in the figure) with the x‐axis indicating the first and the y‐axis the last spatial filters (c). The observed spatial filters that reached the maximal classification accuracy were further located in the brain as interpretable spatial maps (see Figure 4)
2.4.4. Linking SPADE features to individual stress responses
To further explore whether the most discriminative spatial filters we observed were predictive of the intensity of individual stress responses, we correlated the acute stress‐induced cortisol increases (i.e., difference between the peak and baseline levels) with the odds ratio of correctly classifying a given rs‐fMRI scan as being from the post‐stress in contrast to pre‐stress data set. For this correlation analysis, we partialled out the potential influence of cortisol baseline level (assessed just before the pre‐stress scan acquisition) to precisely investigate the association between brain activity and cortisol reactivity (i.e., using semi‐partial Spearman correlation analyses). In our previous study, we observed influences of acute stress induction on salivary cortisol (F[41,182.08] = 145.76, p < .0001) over time (also see Figure 1 in Zhang et al., 2019). In case the spatial filter showed a significant correlation with cortisol increases (i.e., p < .05), a follow‐up test was carried out to visualize the involved functional parcels that together substantiated the discriminant effect of selected spatial filters. To do so, we first calculated the differential covariance matrix (i.e., normalized differences between post‐stress and pre‐stress covariance matrices) for the selected filters. Thereafter, covariance values were converted into Z‐statistics and a 95% percentile was used to select the most relevant parcels for illustration.
3. RESULTS
The maximal discrimination accuracy of our model was 77.99%, highly significant above a chance‐level random performance (Z = 13.53, p < .00001). This maximum was achieved using four pairs of filters. However, this accuracy was statistically comparable to the accuracy achieved by using either two (75.9% accuracy; Z = 0.39, p = .70) or three pairs of filters (77.84% accuracy; Z = 1.31, p = .19). As the accuracy of using two pairs was still significantly higher than using only one (Z = 1.96, one‐sided p = .0248) and random chance‐level performance (Z = 12.79, p < .00001) but comparable to using three pairs (p = .16), further analyses only focused on the first two pairs of filters (i.e., two spatial filters from each of the top and the bottom of the eigenspectrum; Figure 3). Thereafter, we checked whether the discriminative strength of these filters was specific for distinguishing pre‐ versus post‐stress states. To this end, a control analysis was conducted to test if the observed discrimination was due to scanning order effects instead of stress‐induced brain structure reorganization. The results show that our model could not distinguish the sequential rs‐fMRI scans in an independent sample (N = 26) that underwent a nonstressful control procedure in between two rs‐fMRI scans (i.e., with a maximal accuracy of 61.5% not different from a random performance, p > .05), thereby suggesting that the selected features (i.e., spatial filters) in the experimental sample are stress specific.
FIGURE 3.
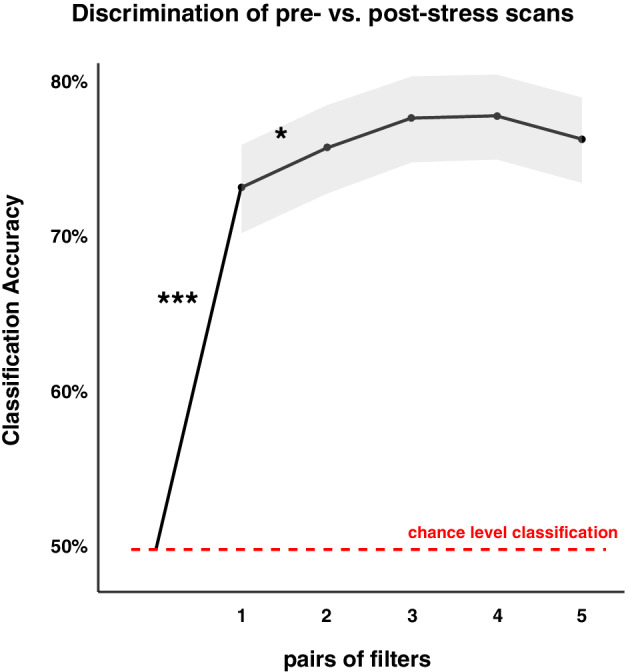
Classification accuracy for pre‐ vs. post‐stress states with 1–5 pairs of spatial filters. Classification accuracy was significantly higher than chance level (i.e., 50% indicated by the red dashed line) when using only one pair of spatial filters, and further significantly increased when using two pairs of spatial filters with asterisk indicating statistical significance (i.e., *** p < .0001; * p < .05). Gray shading indicating the 95% confidence interval
Hereafter, we mapped the fROIs in the brain that have predominantly substantiated the discrimination of the first two pairs of filters. The anatomical mapping revealed that connectivity patterns involving the core regions from the SN (i.e., amygdala, dACC, thalamus [THA]) and DMN (i.e., PCu, PCC, inferior parietal lobule [IPL]) provided the most crucial information for accurate classification of pre‐ versus post‐stress states.
To relate the observed fROIs to stress processing, we linked the individual cortisol stress responses (i.e., absolute cortisol increase corrected for baseline level) to the odds ratio of classification, which represented the most discriminant features. Again, we focused on the first two pairs of spatial filters (as shown in Figure 4) that had achieved the maximal classification accuracy in the current sample. The results showed a significant correlation between the odds ratio calculated for basolateral amygdala‐angular gyrus (BLA‐AG) with cortisol increases (Rs = −0.10, p = .046; Figure S1). No such effect was observed for any other spatial filters (all values of p > .05).
FIGURE 4.
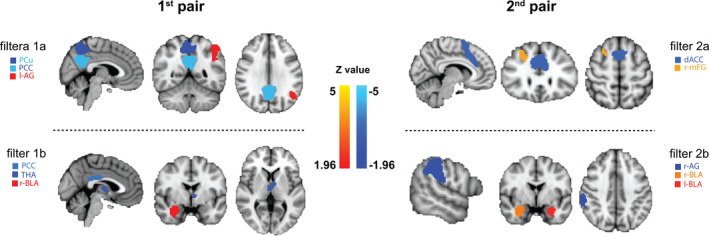
Functional parcels associated with statistically maximal classification accuracy for pre‐ and post‐stress scans in the brain. The filters were selected from the top (i.e., 1a, 2a) and the bottom (i.e., 1b, 2b) of the eigenspectrum. Together in pairs (i.e., first pair and second pairs) they represent the most discriminative features of post‐ and pre‐stress states. Within each individual spatial filter, color coding (reddish or blueish) indicates the relative directionality of correlation, with the same color (i.e., all blueish) indicating positive correlations between parcels and different colors (i.e., blueish vs. reddish) representing anticorrelation of the demonstrated parcels. For example, PCu and PCC exhibited a positive correlation, whereas PCu and l‐AG an anticorrelation in spatial filter 1a. Abbreviations: dACC, dorsal anterior cingulate cortex; PCC, posterior cingulate cortex; PCu, precuneus; THA, thalamus; l‐AG, left angular gyrus; r‐AG, right angular gyrus; l‐BLA, left basolateral amygdala; r‐BLA, right basolateral amygdala; r‐mFG, right middle frontal gyrus
4. DISCUSSION
In the current study, we used a novel approach to investigate the most critical subregions from major resting‐state networks (SN, DMN, and CEN) that are affected by acute stress induction. Based on the correlations among these functional parcels, our model could successfully classify the pre‐ and the post‐stress states with a maximal classification accuracy above 75%. Our analysis further showed that discriminant features of the observed spatial filters could explain variances in cortisol stress reactivity, a biologically meaningful stress marker. These findings demonstrate that the data‐driven approach we used here is able to identify a small number of key structures among a large and unbiased initial set of ROIs within large‐scale networks that have been previously demonstrated to be associated with stress effects (see review by van Oort et al., 2017).
Specifically, we explored the impact of acute stress induction on a functional connectome generated from BOLD fMRI data acquired under rest within 46 parcels, all from the SN, DMN, and CEN. Our approach thus managed to mitigate the potential biases introduced by focusing only on a small number of the ROIs. In line with previous findings that have shown the involvement of the SN and DMN hub regions in stress‐related processing (for review see van Oort et al., 2017), here we observed significant changes in connectivity patterns of bilateral dACC and bilateral BLA from the SN, and bilateral PCC/PCu from the DMN after stress induction (Figure 4). Importantly, we also observed such changes in bilateral THA, right middle frontal gyrus (mFG), left IPL, and right angular gyrus (AG) that notably contributed to the accurate discrimination between the pre‐ and post‐stress states. As these latter structures are not typically considered as the core or hub regions of the DMN, they have been largely overlooked in previous stress studies using a seed‐based approach. Nevertheless, there is evidence suggesting the involvement of these structures in stress and more generally emotion‐related processing, such as emotion regulation (i.e., the mFG; Fonzo, Huemer, & Etkin, 2016; Grecucci, Giorgetta, Bonini, & Sanfey, 2013), perception with emotional valence (i.e., the IPL; Engelen, de Graaf, Sack, & de Gelder, 2015; Sarkheil, Goebe, Schneider, & Mathiak, 2013), and information‐encoding under stress (i.e., the AG; Vogel, Kluen, Fernández, & Schwabe, 2018). These findings indicate potential relevance of these additionally identified brain regions for future investigations into stress‐related processes and related disorders.
In line with existing findings that link key structures of the SN and DMN to stress‐related processes (Admon, Milad, & Hendler, 2013; Koch et al., 2016; van Oort et al., 2017), we observed connectivity patterns that substantiated accurate discrimination in core regions from the SN (i.e., dACC and amygdala) and DMN (i.e., PCC and PCu). However, in contrast to previous studies that considered these key structures as being functionally homogeneous, here we investigated their interregional covariances with enhanced specificity of subdivisions. For example, the amygdala or amygdaloid complex is known as a group of multiple subnuclei with distinguishable cytoarchitectonic and connectional features (Sah, Faber, Lopez De Armentia, & Power, 2003). However, most human studies have investigated acute stress effects on the amygdala as a whole (see review by van Oort et al., 2017). Here, we divided the bilateral amygdala into six subnuclei (i.e., basolateral, centromedial, and superficial nuclei from each hemisphere), and only left and right BLA nuclei showed noteworthy changes in their connectivity profile for discriminating pre‐ versus post‐stress states. Similarly, although PCC and PCu have often been used as seed regions to investigate stress effects on DMN connectivity, very rarely these hub regions were tested with specified subdivisions that are known to function distinctively (Bzdok et al., 2015; Leech & Sharp, 2014; Zhang & Li, 2012). Here again, we show that acute stress only affected limited parts (i.e., a few subdivisions) of the entire structure, thereby suggesting a potential relevance to shift the focus on more local‐level functional characteristics for these hub regions in respect to stress effects.
Furthermore, our follow‐up tests revealed a correlation between individual cortisol reactivity to acute stress induction and the odds ratio of correctly classifying the acutely stressed brain state from the rs‐fMRI scans for BLA‐AG filter (Figure S1). Although the effect size was small (R = −0.10), it provides support for the interpretation that the observed connectivity changes are stress related and relevant for individual differences in the HPA‐axis response to stress.
It is important to consider the limitations of the current study when interpreting the results. Firstly, the current study only focused on the spatial organization represented by the first two pairs of spatial filters since they demonstrated statistically comparable predictive accuracy as the maximal performance, using leave‐one‐out cross validation. In the future, it would be interesting to investigate the robust number of discriminative spatial filters for interpretations, using an independent sample. Secondly, the machine learning algorithm used here does not allow for simple detection of the exact directionality of the connectivity changes (i.e., increases or decreases) following acute stress induction. Instead, it focused on the detection of changes per se that could yield maximal discriminative strength to tell the stressed from the non‐stressed neutral states. Importantly, this approach does allow for inferring relative changing directions (i.e., the color coding in Figure 4 quantifies the correlation within each spatial filter but not indicates the overall correlations). Based on these findings, it would be interesting for future investigations to identify the directionality of stress‐induced connectivity changes in specific brain structures of interest (i.e., positive or negative correlation between parcels as in Figure S2). Therefore, the approach used here can serve as a crucial step to unbiasedly curtail a large number of brain structures, enabling subsequent investigation of the most relevant ones for connectivity directionality. Thirdly, although we observed an association between the cortisol increases and the discriminative feature (i.e., odds ratio), this pattern was only present for one individual filter. This is likely due to the fact that the trained spatial filters here might have reflected the aggregated information from multiple neural and hormonal systems in a time frame arguably capturing a mixture of stress reactivity and stress recovery processes. On the other hand, the cortisol levels we measured here (i.e., increases from baseline to the peak level) predominantly indicated the HPA‐axis reactivity to stressors. For future studies, acquiring additional imaging scans after acute stress subsides (i.e., stress recovery) may help elucidate the implications of the brain spatial patterns observed here. Nevertheless, it is important to note that our model was trained on the functional imaging data and was not designed to predict cortisol stress responses. The fact that it could still explain variances in cortisol data suggests that the observed connectivity patterns discriminative of pre‐ and post‐stress scans are driven, to a certain degree, by the neurobiological processes also giving rise to cortisol responses. Finally, potential concern may arise for the reduced signal‐to‐noise ratio (SNR) due to the relatively short acquisition time (i.e., 6.5 min). However, the fast speed acquisition protocol (multiband 8) allowed us to obtain 500 data points from each participant, and both the individual and group‐level temporal SNR images exhibited similar amplitudes and patterns as have been shown in previous studies (Smith et al., 2013). Most importantly, the reported results here largely replicated findings in previous research (e.g., connectivity change in dACC, PCC upon stress induction), further ensuring the data quality.
In conclusion, the current study used an unbiased data‐driven approach to detect the most relevant brain structures from the SN, DMN, and CEN in response to acute stress. By combining our a priori knowledge—of stress‐sensitive neural networks—with data‐driven modeling, our results show that acute stress substantially affects the intermediate meso‐scale connectivity patterns of the hub regions from the SN and DMN, as well as a number of regions not typically predefined as stress sensitive.
CONFLICT OF INTERESTS
This work was supported by a VICI grant (#453‐12‐001) from the Netherlands Organization for Scientific Research (NWO) and a consolidator grant from the European Research Council (ERC_CoG‐2017_772337) awarded to Karin Roelofs. The authors report no biomedical financial interests or potential conflicts of interest.
Supporting information
Appendix S1. Supporting Information.
ACKNOWLEDGMENTS
We are particularly thankful to the Dutch Police Academy (Politieacademie) for their cooperation and to Annika Smit for her valuable help with recruiting participants and facilitating our study. We also thank our former and current colleagues Vanessa van Ast, Ingrid Kersten, Naomi de Valk, Geoffrey Bertou, Leonore Bovy, Iris Hulzink, Tiele Dopp, Marjolein Hartgerink, Bart Becker, Madine Zoet, Delphin van Benthem, Job de Brouwer, Lisanne Nuijen, Pepijn van Houten, Klaas van Groesen, and Nienke Flipsen for their help in setting up the study, recruiting participants, and acquiring data and to Paul Gaalman for his technical assistance in fMRI data acquisition.
Zhang W, Llera A, Hashemi MM, et al. Discriminating stress from rest based on resting‐state connectivity of the human brain: A supervised machine learning study. Hum Brain Mapp. 2020;41:3089–3099. 10.1002/hbm.25000
WZ and AL share the first authorship whereas FK and KR share the senior authorship.
Funding information European Research Council, Grant/Award Number: ERC_CoG‐2017_772337; Nederlandse Organisatie voor Wetenschappelijk Onderzoek, Grant/Award Number: VICI grant (#453‐12‐001)
DATA AVAILABILITY STATEMENT
The data that support the findings of this study are available on request from the corresponding author. The data are not publicly available due to privacy or ethical restrictions.
REFERENCES
- Admon, R. , Milad, M. R. , & Hendler, T. (2013). A causal model of post‐traumatic stress disorder: Disentangling predisposed from acquired neural abnormalities. Trends in Cognitive Sciences, 17(7), 337–347. 10.1016/j.tics.2013.05.005 [DOI] [PubMed] [Google Scholar]
- Bijsterbosch, J. , Smith, S. M. , & Beckmann, C. F. (2017). Introduction to resting state fMRI functional connectivity In Oxford neuroimaging primers. Oxford, UK: Oxford University Press. [Google Scholar]
- Bishop, C. (2007). Pattern recognition and machine learning. Technometrics, 49(3), 366 10.1198/tech.2007.s518 [DOI] [Google Scholar]
- Boubela, R. N. , Kalcher, K. , Nasel, C. , & Moser, E. (2014). Scanning fast and slow: Current limitations of 3 Tesla functional MRI and future potential. Frontiers in Physics, 2, 1. 10.3389/fphy.2014.00001 [DOI] [PMC free article] [PubMed] [Google Scholar]
- Bzdok, D. , Heeger, A. , Langner, R. , Laird, A. R. , Fox, P. T. , Palomero‐Gallagher, N. , … Eickhoff, S. B. (2015). Subspecialization in the human posterior medial cortex. NeuroImage, 106, 55–71. 10.1016/j.neuroimage.2014.11.009 [DOI] [PMC free article] [PubMed] [Google Scholar]
- Caballero‐Gaudes, C. , & Reynolds, R. C. (2017). Methods for cleaning the BOLD fMRI signal. NeuroImage, 154, 128–149. 10.1016/j.neuroimage.2016.12.018 [DOI] [PMC free article] [PubMed] [Google Scholar]
- Cavanna, A. E. , & Trimble, M. R. (2006). The precuneus: A review of its functional anatomy and behavioural correlates. Brain, 129, 564–583. 10.1093/brain/awl004 [DOI] [PubMed] [Google Scholar]
- Cha, J. , Jo, H. J. , Gibson, W. S. , & Lee, J. M. (2017). Functional organization of the human posterior cingulate cortex, revealed by multiple connectivity‐based parcellation methods. Human Brain Mapping, 38(6), 2808–2818. 10.1002/hbm.23570 [DOI] [PMC free article] [PubMed] [Google Scholar]
- Cohen, J. R. , & D'Esposito, M. (2016). The segregation and integration of distinct brain networks and their relationship to cognition. Journal of Neuroscience, 36(48), 12083–12094. 10.1523/JNEUROSCI.2965-15.2016 [DOI] [PMC free article] [PubMed] [Google Scholar]
- Cole, M. D., Smith, M. S., & Beckmann, F. C. (2010). Advances and pitfalls in the analysis and interpretation of resting‐state FMRI data. Frontiers in Systems Neuroscience, 4, 8. 10.3389/fnsys.2010.00008 [DOI] [PMC free article] [PubMed] [Google Scholar]
- Engelen, T. , de Graaf, T. A. , Sack, A. T. , & de Gelder, B. (2015). A causal role for inferior parietal lobule in emotion body perception. Cortex, 73, 195–202. 10.1016/j.cortex.2015.08.013 [DOI] [PubMed] [Google Scholar]
- Fonzo, G. A. , Huemer, J. , & Etkin, A. (2016). History of childhood maltreatment augments dorsolateral prefrontal processing of emotional valence in PTSD. Journal of Psychiatric Research, 74, 45–54. 10.1016/j.jpsychires.2015.12.015 [DOI] [PMC free article] [PubMed] [Google Scholar]
- Friston, K. J. , Williams, S. , Howard, R. , Frackowiak, R. S. J. , & Turner, R. (1996). Movement‐related effects in fMRI time‐series. Magnetic Resonance in Medicine, 35(3), 346–355. 10.1002/mrm.1910350312 [DOI] [PubMed] [Google Scholar]
- Grecucci, A. , Giorgetta, C. , Bonini, N. , & Sanfey, A. G. (2013). Reappraising social emotions: The role of inferior frontal gyrus, temporo‐parietal junction and insula in interpersonal emotion regulation. Frontiers in Human Neuroscience, 7, 523 10.3389/fnhum.2013.00523 [DOI] [PMC free article] [PubMed] [Google Scholar]
- Haufe, S. , Meinecke, F. , Görgen, K. , Dähne, S. , Haynes, J. D. , Blankertz, B. , & Bießmann, F. (2014). On the interpretation of weight vectors of linear models in multivariate neuroimaging. NeuroImage, 87, 96–110. 10.1016/j.neuroimage.2013.10.067 [DOI] [PubMed] [Google Scholar]
- Hermans, E. J. , van Marle, H. J. F. , Ossewaarde, L. , Henckens, M. J. a. G. , Qin, S. , van Kesteren, M. T. R. , … Fernandez, G. (2011). Stress‐related noradrenergic activity prompts large‐scale neural network reconfiguration. Science, 334(6059), 1151–1153. 10.1126/science.1209603 [DOI] [PubMed] [Google Scholar]
- Janak, P. H. , & Tye, K. M. (2015). From circuits to behaviour in the amygdala. Nature, 517(7534), 284–292. 10.1038/nature14188 [DOI] [PMC free article] [PubMed] [Google Scholar]
- Keerativittayayut, R. , Aoki, R. , Sarabi, M. T. , Jimura, K. , & Nakahara, K. (2018). Large‐scale network integration in the human brain tracks temporal fluctuations in memory encoding performance. eLife, 7, e32696. 10.7554/elife.32696 [DOI] [PMC free article] [PubMed] [Google Scholar]
- Koch, S. B. J. , Klumpers, F. , Zhang, W. , Hashemi, M. M. , Kaldewaij, R. , van Ast, V. A. , … Roelofs, K. (2017). The role of automatic defensive responses in the development of posttraumatic stress symptoms in police recruits: Protocol of a prospective study. European Journal of Psychotraumatology, 8(1), 1412226 10.1080/20008198.2017.1412226 [DOI] [PMC free article] [PubMed] [Google Scholar]
- Koch, S. B. J. , van Zuiden, M. , Nawijn, L. , Frijling, J. L. , Veltman, D. J. , & Olff, M. (2016). Aberrant resting‐state brain activity in posttraumatic stress disorder: A meta‐analysis and systematic review. Depression and Anxiety, 33(7), 592–605. 10.1002/da.22478 [DOI] [PubMed] [Google Scholar]
- Leech, R. , & Sharp, D. J. (2014). The role of the posterior cingulate cortex in cognition and disease. Brain, 137, 12–32. 10.1093/brain/awt162 [DOI] [PMC free article] [PubMed] [Google Scholar]
- Li, S. , Weerda, R. , Milde, C. , Wolf, O. T. , & Thiel, C. M. (2014). Effects of acute psychosocial stress on neural activity to emotional and neutral faces in a face recognition memory paradigm. Brain Imaging and Behavior, 8(4), 598–610. 10.1007/s11682-013-9287-3 [DOI] [PubMed] [Google Scholar]
- Llera, A. , Chauvin, R. , Mulders, P. , Naaijen, J. , Mennes, M. , & Beckmann, C. F. (2019). Spatial patterns for discriminative estimation (SP♠DE). BioRxiv, 746891 10.1101/746891 [DOI] [Google Scholar]
- Llera, A. , Wolfers, T. , Mulders, P. , & Beckmann, C. F. (2019). Inter‐individual differences in human brain structure and morphology link to variation in demographics and behavior. eLife, 8, 1–20. 10.7554/elife.44443 [DOI] [PMC free article] [PubMed] [Google Scholar]
- Luo, Y. , Fernández, G. , Hermans, E. , Vogel, S. , Zhang, Y. , Li, H. , & Klumpers, F. (2018). How acute stress may enhance subsequent memory for threat stimuli outside the focus of attention: DLPFC‐amygdala decoupling. NeuroImage, 171, 311–322. 10.1016/j.neuroimage.2018.01.010 [DOI] [PubMed] [Google Scholar]
- Margulies, D. S. , Vincent, J. L. , Kelly, C. , Lohmann, G. , Uddin, L. Q. , Biswal, B. B. , … Petrides, M. (2009). Precuneus shares intrinsic functional architecture in humans and monkeys. Proceedings of the National Academy of Sciences, 106(47), 20069–20074. 10.1073/pnas.0905314106 [DOI] [PMC free article] [PubMed] [Google Scholar]
- Maron‐Katz, A. , Vaisvaser, S. , Lin, T. , Hendler, T. , & Shamir, R. (2016). A large‐scale perspective on stress‐induced alterations in resting‐state networks. Scientific Reports, 6(February), 21503 10.1038/srep21503 [DOI] [PMC free article] [PubMed] [Google Scholar]
- McEwen, B. S. , & Gianaros, P. J. (2010). Stress‐ and Allostasis‐induced brain plasticity. Annual Review of Medicine, 62(1), 431–445. 10.1146/annurev-med-052209-100430 [DOI] [PMC free article] [PubMed] [Google Scholar]
- Menon, V. (2011). Large‐scale brain networks and psychopathology: A unifying triple network model. Trends in Cognitive Sciences, 15(10), 483–506. 10.1016/j.tics.2011.08.003 [DOI] [PubMed] [Google Scholar]
- Miller, R. , Stalder, T. , Jarczok, M. , Almeida, D. M. , Badrick, E. , Bartels, M. , … Kirschbaum, C. (2016). The CIRCORT database: Reference ranges and seasonal changes in diurnal salivary cortisol derived from a meta‐dataset comprised of 15 field studies. Psychoneuroendocrinology, 73(8), 16–23. 10.1016/j.psyneuen.2016.07.201 [DOI] [PMC free article] [PubMed] [Google Scholar]
- Pruim, R. H. R. , Mennes, M. , van Rooij, D. , Llera, A. , Buitelaar, J. K. , & Beckmann, C. F. (2015). ICA‐AROMA: A robust ICA‐based strategy for removing motion artifacts from fMRI data. NeuroImage, 112, 267–277. 10.1016/j.neuroimage.2015.02.064 [DOI] [PubMed] [Google Scholar]
- Ressler, K. J. (2010). Amygdala activity, fear, and anxiety: Modulation by stress. Biological Psychiatry, 67(12), 1117–1119. 10.1016/j.biopsych.2010.04.027 [DOI] [PMC free article] [PubMed] [Google Scholar]
- Sah, P. , Faber, E. S. L. , Lopez De Armentia, M. , & Power, J. (2003). The amygdaloid complex: Anatomy and physiology. Physiological Reviews, 83(3), 803–834. 10.1152/physrev.00002.2003 [DOI] [PubMed] [Google Scholar]
- Sarkheil, P. , Goebe, R. , Schneider, F. , & Mathiak, K. (2013). Emotion unfolded by motion: A role for parietal lobe in decoding dynamic facial expressions. Social Cognitive and Affective Neuroscience, 8(8), 950–957. 10.1093/scan/nss092 [DOI] [PMC free article] [PubMed] [Google Scholar]
- Satterthwaite, T. D. , Elliott, M. A. , Gerraty, R. T. , Ruparel, K. , Loughead, J. , Calkins, M. E. , … Wolf, D. H. (2013). An improved framework for confound regression and filtering for control of motion artifact in the preprocessing of resting‐state functional connectivity data. NeuroImage, 64(1), 240–256. 10.1016/j.neuroimage.2012.08.052 [DOI] [PMC free article] [PubMed] [Google Scholar]
- Schwabe, L. , Haddad, L. , & Schachinger, H. (2008). HPA axis activation by a socially evaluated cold‐pressor test. Psychoneuroendocrinology, 33(6), 890–895. 10.1016/j.psyneuen.2008.03.001 [DOI] [PubMed] [Google Scholar]
- Shine, J. M. , van den Brink, R. L. , Hernaus, D. , Nieuwenhuis, S. , & Poldrack, R. A. (2018). Catecholaminergic manipulation alters dynamic network topology across cognitive states. Network Neuroscience, 2(3), 381–396. 10.1162/netn_a_00042 [DOI] [PMC free article] [PubMed] [Google Scholar]
- Shirer, W. R. , Ryali, S. , Rykhlevskaia, E. , Menon, V. , & Greicius, M. D. (2012). Decoding subject‐driven cognitive states with whole‐brain connectivity patterns. Cerebral Cortex, 22(1), 158–165. 10.1093/cercor/bhr099 [DOI] [PMC free article] [PubMed] [Google Scholar]
- Smith, S. M. , Beckmann, C. F. , Andersson, J. , Auerbach, E. J. , Bijsterbosch, J. , Douaud, G. , … Glasser, M. F. (2013). Resting‐state fMRI in the human connectome project. NeuroImage, 80, 144–168. 10.1016/j.neuroimage.2013.05.039 [DOI] [PMC free article] [PubMed] [Google Scholar]
- Vaisvaser, S. , Lin, T. , Admon, R. , Podlipsky, I. , Greenman, Y. , Stern, N. , … Hendler, T. (2013). Neural traces of stress: Cortisol related sustained enhancement of amygdala‐hippocampal functional connectivity. Frontiers in Human Neuroscience, 7, 313 10.3389/fnhum.2013.00313 [DOI] [PMC free article] [PubMed] [Google Scholar]
- van Oort, J. , Tendolkar, I. , Hermans, E. J. , Mulders, P. C. , Beckmann, C. F. , Schene, A. H. , … van Eijndhoven, P. F. (2017). How the brain connects in response to acute stress: A review at the human brain systems level. Neuroscience & Biobehavioral Reviews, 83(April), 281–297. 10.1016/j.neubiorev.2017.10.015 [DOI] [PubMed] [Google Scholar]
- Vogel, S. , Kluen, L. M. , Fernández, G. , & Schwabe, L. (2018). Stress affects the neural ensemble for integrating new information and prior knowledge. NeuroImage, 173, 176–187. 10.1016/j.neuroimage.2018.02.038 [DOI] [PubMed] [Google Scholar]
- Vogel, S. , Klumpers, F. , Krugers, H. J. , Fang, Z. , Oplaat, K. T. , Oitzl, M. S. , … Fernández, G. (2015). Blocking the mineralocorticoid receptor in humans prevents the stress‐induced enhancement of Centromedial amygdala connectivity with the dorsal striatum. Neuropsychopharmacology, 40(4), 947–956. 10.1038/npp.2014.271 [DOI] [PMC free article] [PubMed] [Google Scholar]
- Watson, D. , Clark, L. a. , & Tellegan, A. (1988). Worksheet 3.1 the positive and negative affect schedule (PANAS; Watson et al., 1988) PANAS questionnaire. Journal of Personality and Social Psychology, 54, 1063–1070. 10.1521/soco_2012_1006 [DOI] [PubMed] [Google Scholar]
- Young, C. B. , Raz, G. , Everaerd, D. , Beckmann, C. F. , Tendolkar, I. , Hendler, T. , … Hermans, E. J. (2016). Dynamic shifts in large‐scale brain network balance as a function of arousal. Journal of Neuroscience., 37, 281–290. 10.1523/JNEUROSCI.1759-16.2016 [DOI] [PMC free article] [PubMed] [Google Scholar]
- Zhang, S. , Li, C. , & Shan, R. (2012). Functional connectivity mapping of the human precuneus by resting state fMRI. NeuroImage, 59(4), 3548–3562. 10.1016/j.neuroimage.2011.11.023 [DOI] [PMC free article] [PubMed] [Google Scholar]
- Zhang, W. , Hashemi, M. M. , Kaldewaij, R. , Koch, S. B. J. , Beckmann, C. , Klumpers, F. , & Roelofs, K. (2019). Acute stress alters the “default” brain processing. NeuroImage, 189, 870–877. 10.1016/j.neuroimage.2019.01.063 [DOI] [PubMed] [Google Scholar]
- Zhang, X. , Ge, T. T. , Yin, G. , Cui, R. , Zhao, G. , & Yang, W. (2018). Stress‐induced functional alterations in amygdala: Implications for neuropsychiatric diseases. Frontiers in Neuroscience, 12, 367. 10.3389/fnins.2018.00367 [DOI] [PMC free article] [PubMed] [Google Scholar]
- Zhang, Y. , Brady, M. , & Smith, S. (2001). Segmentation of brain MR images through a hidden Markov random field model and the expectation‐maximization algorithm. IEEE Transactions on Medical Imaging, 20(1), 45–57. 10.1109/42.906424 [DOI] [PubMed] [Google Scholar]
- Zilles, K. , & Amunts, K. (2010). Centenary of Brodmann's map conception and fate. Nature Reviews Neuroscience, 11, 139–145. 10.1038/nrn2776 [DOI] [PubMed] [Google Scholar]
- Zu Eulenburg, P. , Caspers, S. , Roski, C. , & Eickhoff, S. B. (2012). Meta‐analytical definition and functional connectivity of the human vestibular cortex. NeuroImage, 60(1), 162–169. 10.1016/j.neuroimage.2011.12.032 [DOI] [PubMed] [Google Scholar]
Associated Data
This section collects any data citations, data availability statements, or supplementary materials included in this article.
Supplementary Materials
Appendix S1. Supporting Information.
Data Availability Statement
The data that support the findings of this study are available on request from the corresponding author. The data are not publicly available due to privacy or ethical restrictions.