Abstract
Background
The prevalence of obesity has rapidly increased in countries across the world in recent decades. The 2019 Obesity Fact Sheet released by the Korean Society for the Study of Obesity addressed the prevalence of obesity and abdominal obesity during the period of 2009 to 2018 and obesity-related social factors.
Methods
Data from the Korean National Health Insurance Service health checkup database between 2009 and 2018 and the Korea National Health and Nutrition Examination Survey between 2010 and 2017 were analyzed. The prevalence of obesity and abdominal obesity was calculated after standardizing for age and sex based on the 2010 population and housing census.
Results
From 2009 to 2018, the prevalence of obesity and abdominal obesity increased to 35.7% and 23.8%, respectively, in 2018. Upward trends in the prevalence of obesity and abdominal obesity was observed among both sexes and nearly all age groups. The prevalence of obesity and abdominal obesity was higher among individuals with lower education and household income levels. Among occupations, managers exhibited the highest prevalence of obesity and abdominal obesity. Further, the prevalence of obesity and abdominal obesity became higher among individuals working longer hours and split and night shift workers.
Conclusion
The 2019 Obesity Fact Sheet provides information on changes in obesity dynamics during the past decade and obesity-related social factors in the Korean adult population. This report might constitute a cornerstone by which to establish targets for future interventions for reversing the rise in the prevalence of obesity and reducing the burden of obesity in Korea.
Keywords: Obesity, Abdominal obesity, Prevalence, Social factors, Fact sheet, National Health Insurance Service
INTRODUCTION
Over the last several decades, the prevalence of obesity has rapidly increased in populations across the world. The World Health Organization (WHO) declared the rising levels of obesity as a global epidemic almost 20 years ago. In 2016, approximately more than 39% (1.9 billion) and 13% (650 million) adults worldwide were reported to be overweight and obese, respectively, with the obesity prevalence exceeding 50% in many countries.1-3 Obesity is known to substantially increase the risk of various chronic diseases including metabolic, cardiovascular, musculoskeletal, neurodegenerative, and psychiatric diseases and several types of cancer.4 In addition, abdominal obesity is an independent risk factor for metabolic and cardiovascular morbidity and mortality.5,6 Moreover, obesity is a leading cause of reduced quality of life, disability, and social disadvantages while being closely correlated with various social factors.4 In this regard, obesity is currently recognized as a chronic progressive disease beyond only being a risk factor for other diseases.
The Korean Society for the Study of Obesity (KSSO) has devoted time and resources to investigating recent trends in obesity, its related comorbidities, and social factors contributing to it, aiming ultimately to improve obesity-related health outcomes in Korea. The KSSO has published Obesity Fact Sheets every year since 2015 to report on the national obesity status and its impacts and to provide obesity-related statistics for the establishment of national health policies for improving obesity under a memorandum of understanding with the Korean National Health Insurance Corporation (NHIC) in 2015. The 2019 Obesity Fact Sheet focused on recent trends in the prevalence of obesity and abdominal obesity and obesity-related health risks in young adults. The prevalence of obesity and abdominal obesity by social factors was also analyzed.7 Herein, we reported and discussed the prevalence of obesity and abdominal obesity among Korean adults from 2009 to 2018 and obesity-related social factors based on the 2019 Obesity Fact Sheet.
METHODS
Data sources and study participants
This study analyzed data from the national health checkup database provided by the Korean National Health Insurance Service (NHIS) managed by the Korean NHIC. The NHIS is a nonprofit, single-payer system that offers universal medical coverage for all Korean residents and reimburses health care providers based on a feefor- service system. In addition, the Korean NHIC provides health checkups for all ensured people at least every 2 years. Hence, the NHIS possesses health information of nearly the entire Korean population, including data on demographics, disease diagnosis and medical treatments according to the International Classification of Diseases 10th revision codes, and health examinations. Comprehensive information from the NHIS database has been presented elsewhere.8,9 Using this database, data on individuals aged 20 years or older who had undergone at least one health checkup provided by the Korean NHIC between January 1, 2009 and December 31, 2018 were assessed. For determining the prevalence of obesity and abdominal obesity according to social factors, we used data from participants aged 20 years or older gathered by the Korea National Health and Nutrition Examination Survey (KNHANES) from the first year (2010) of the fifth stage to the second year (2017) of the seventh stage. The study protocol was approved by the Institutional Review Board of Korea University Anam Hospital (IRB No. 2019AN0199).
Definitions of obesity and abdominal obesity
Participants’ height, body weight, and waist circumference (WC) were measured by trained staff members. Body mass index (BMI) was calculated by dividing the body weight in kilograms by the square of the height in meters. Obesity was defined as a BMI ≥25 kg/m2, according to the Asia-Pacific criteria of the WHO guidelines.10 Abdominal obesity was defined as a WC ≥90 cm in males and ≥85 cm in females in accordance with the definition of the KSSO.10
Definition of social factors
Participants’ household income levels were categorized as quartile groups and education levels were categorized as elementary school graduate or less, middle school graduate, high school graduate, and university graduate or more. The classification of occupation was based on the standard classification of occupation for employed people, excluding the armed forces. We categorized the weekly working hours as less than 40, 40 to 60, 60 to 80, and 80 or more hours, respectively, and flexible working types as day-, evening-, night-, day and night regular-, 24-hour-, and split-shift, respectively.
Statistical analysis
The prevalence was presented using the data of NHIS and the KNHANES, with values standardized for age and sex based on the 2010 population and housing census of Statistics Korea. We conducted statistical analyses using SAS version 9.4 (SAS Institute Inc., Cary, NC, USA).
RESULTS
Prevalence of obesity from 2009 to 2018
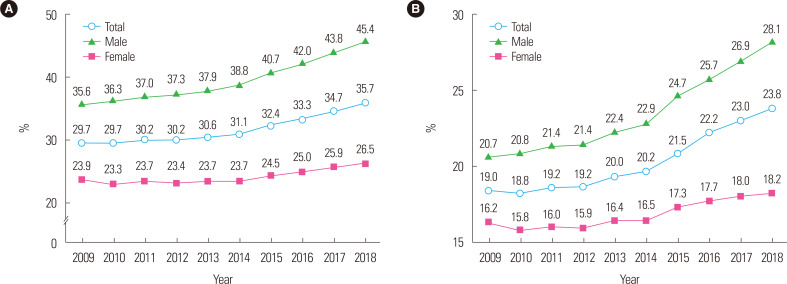
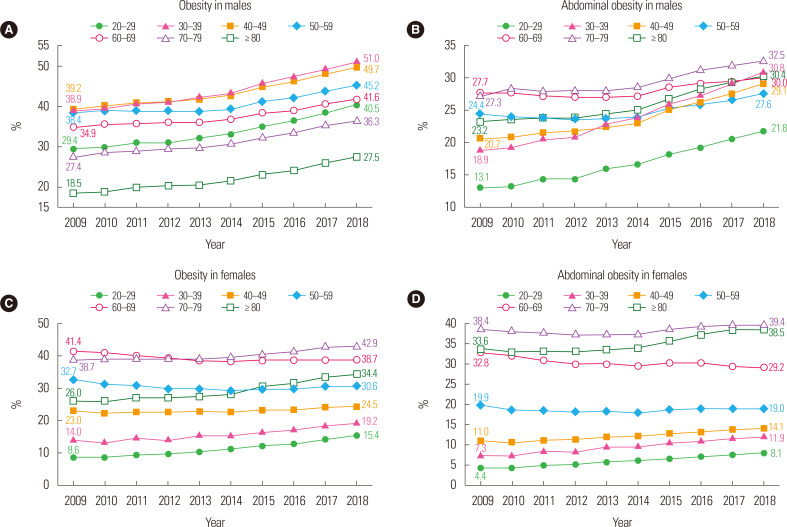
The prevalence of obesity has continuously increased over 10 years between 2009 and 2018 in the total population; for example, it was 29.7% in 2009, 31.1% in 2014, and 35.7% in 2018, respectively. The prevalence of obesity has increased prominently in males from 35.6% in 2009 to 45.4% in 2018; meanwhile, it increased also in females from 23.9% in 2009 to 26.5% in 2018 (Fig. 1A). From 2009 to 2018, the prevalence of obesity increased across all age groups, especially in the 20s,nd 80s or older. In 2018, the prevalence among all study participants was 28.5% in those in their 20s, 40.5% in those in their 30s, 38.3% in those in their 40s, 38.0% in those in their 50s, 40.1% in those in their 60s, 39.8% in those in theirnd 31.6% in those in their 80s or older, respectively. Obesity prevalence among males were increased in all age groups, especially in those who were in their 20s and 30s. In 2018, the prevalence of obesity in males was 51% in those in theirhich was the highest (Fig. 2A). Meanwhile, the obesity prevalence in females was increased in those in their 20s,nd 80s or older. Furthermore, the prevalence was increased particularly among women in their 20s andhereas it was decreased in those in their 50s and 60s (Fig. 2C).
Figure. 1.
Prevalence of obesity (A) and abdominal obesity (B) from 2009 to 2018.7
Figure. 2.
Age-specific prevalence of obesity and abdominal obesity in males (A, B) and females (C, D) from 2009 to 2018.7
Prevalence of abdominal obesity from 2009 to 2018
The prevalence of abdominal obesity has increased over the past 10 years, ranging from 19.0% in 2009 and 20.2% in 2014 to 23.8% in 2018. The increase in the prevalence of abdominal obesity was most prominent in males, with rates of 20.7% in 2009 and 28.1% in 2018, respectively, reported. In females, the prevalence of abdominal obesity increased from 16.2% in 2009 to 18.2% in 2018 (Fig. 1B). From 2009 to 2018, the prevalence of abdominal obesity was increased in all age groups, except among individuals in their 60s. The highest increase in the prevalence of abdominal obesity during the 10 years was observed among those in theirncreasing from 15.8% in 2009 to 24.5% in 2018. In 2018, the prevalence of abdominal obesity were 15.2% in those in their 20s, 24.5% in those in their 30s, 22.3% in those in their 40s, 23.4% in those in their 50s, 29.6% in those in their 60s, 36.1% in those in theirnd 35.1% in those in their 80s or older. In males, the prevalence of abdominal obesity was increased across all age groups, including prominently among those in their 20s and 30s. The prevalence in males in their 20s was 13.1% in 2009 but 21.8% in 2018, while that among males in their 30s was 18.9% in 2009 but 30.8% in 2018, respectively (Fig. 2B). In females, the prevalence of abdominal obesity was increased in their 20s,nd 80s or older, including particularly among those in their 30s and 80s or older, respectively. Separately, the prevalence among females in their 30s was 7.3% in 2009 but 11.9% in 2018 and that in females in their 80s or older was 33.6% in 2009 but 38.5% in 2018. Conversely, the prevalence of abdominal obesity has decreased in females in their 50s and 60s (Fig. 2D).
Prevalence of obesity and abdominal obesity by social factors
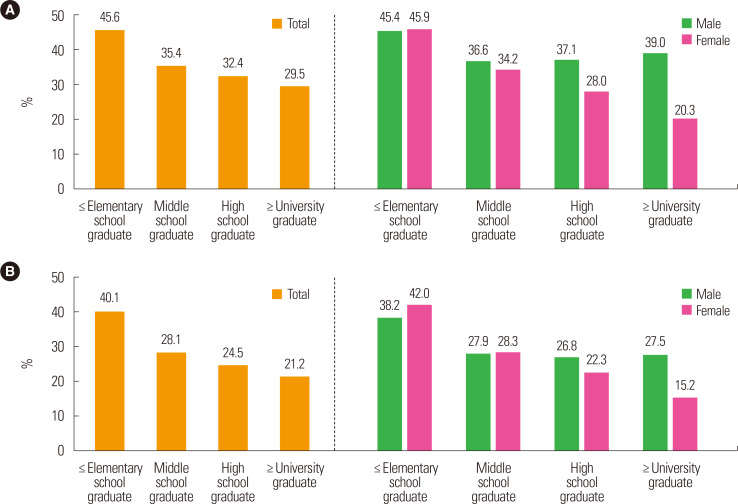
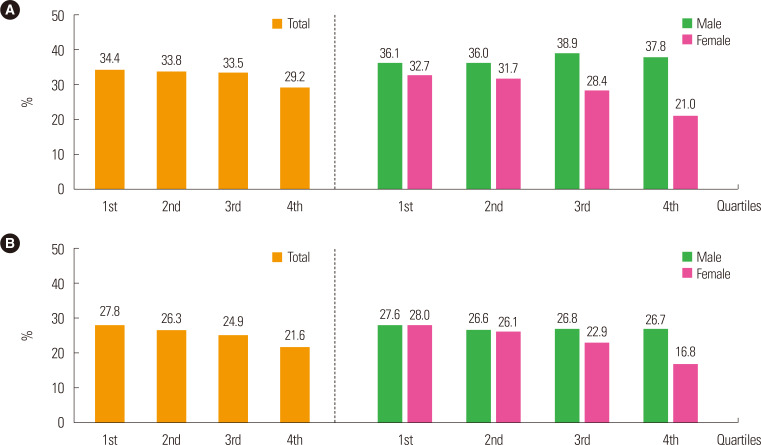
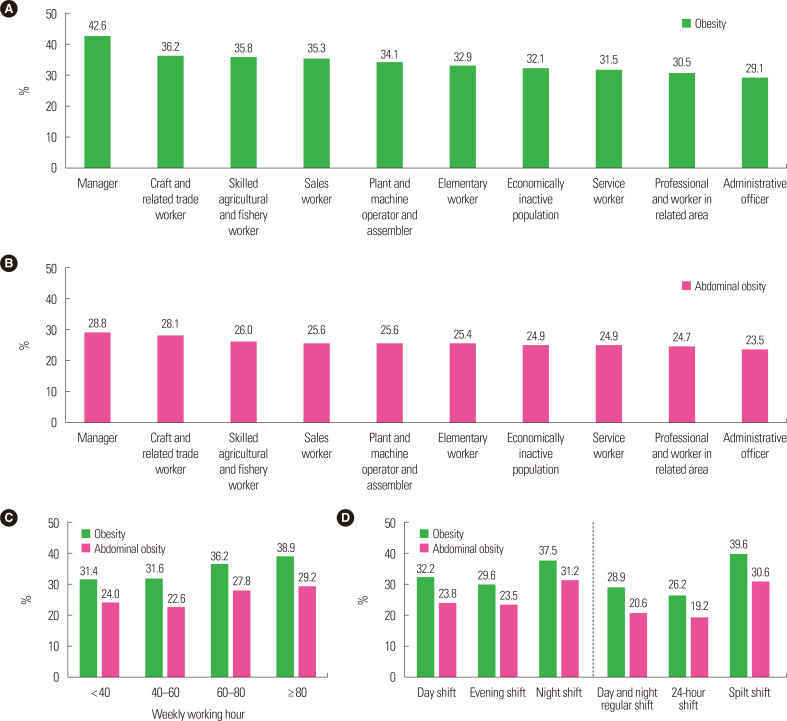
The prevalence of obesity was higher among individuals with lower education levels. This association was shown to be more prominent in females (Fig. 3A). The prevalence of obesity was higher in lower-household-income groups within the total population, especially among females (Fig. 4A). The prevalence of abdominal obesity increased as the education level decreased within the total population. This trend was observed more prominently in females (Fig. 3B). In lower-household-income groups, the prevalence of abdominal obesity was higher within the total population, particularly among females (Fig. 4B). As for occupational classification, the prevalence of obesity was the highest at 42.6% among managers and was the second highest among workers participating in crafts and related trades at 36.2% (Fig. 5A). The prevalence of abdominal obesity was the highest among managers at 28.8% and was the second highest among skilled agricultural, forestry, and fishery workers at 28.1%, respectively (Fig. 5B). The prevalence of obesity was higher as the number of working hours per week increased. Specifically, the prevalence of obesity was 31.4% among individuals working less than 40 hours per week and 38.9% among those working 80 hours or more per week. The prevalence of abdominal obesity was also increased in individuals with more working hours per week at 24% among individuals working less than 40 hours per week but 29.2% among those working 80 hours or more per week (Fig. 5C). In comparison with day-shift workers, splitshift workers and night-shift workers had higher prevalence of both obesity and abdominal obesity (Fig. 5D).
Figure. 3.
Prevalence of obesity (A) and abdominal obesity (B) by education level.7
Figure. 4.
Prevalence of obesity (A) and abdominal obesity (B) by household income level.7
Figure. 5.
Prevalence of obesity and abdominal obesity by occupational condition. Prevalence of obesity (A) and abdominal obesity (B) by occupational classification. Prevalence of obesity and abdominal obesity by the number of working hours per week (C) and by working type (D).7
DISCUSSION
In this study, we found that the prevalence of obesity and abdominal obesity in the South Korean adult population has increased from 2009 to 2018. In 2018, the prevalence of obesity and abdominal obesity was 35.7% and 23.8%, respectively. Increasing trends in the prevalence of obesity were observed in both sexes and all age groups. Meanwhile, the prevalence of abdominal obesity tended to increase in both sexes and all age groups except the 60s. The prevalence of obesity and abdominal obesity was higher in correlation with lower levels of education and household income. Managers, when considering occupational classification, showed the highest prevalence of both obesity and abdominal obesity, while those working more hours per week presented similar increases. In addition, split-shift workers and night-shift workers had higher prevalence of obesity and abdominal obesity relative to dayshift workers. Based on these findings, the 2019 obesity fact sheet offers information on obesity dynamics over a recent decade and social factors related to obesity in the Korean adult population and might constitute a cornerstone by which to establish targets for future interventions to reverse the rise in the prevalence of obesity and reduce the burden from obesity in Korea.
The global prevalence of obesity has increased to pandemic proportions. It is expected that two billion individuals will be overweight and one billion individuals will be obese by 2030.11 Although the obesity rate in Korean adults is lower when with the Organisation for Economic Co-operation and Development standard, 12 based on our findings, it has steadily increased in recent years. Changes in the global food system combined with the conduct of sedentary behaviors are widely accepted as the main causes of the rise in obesity prevalence worldwide.13,14 According to these trends, the main driver of the obesity epidemic in Korea seems to be the Westernization of lifestyles in the country.15,16 Over the past several decades, the obesity prevalence in Korea has increased simultaneously alongside reduced home-cooking, a greater preference for convenient but relatively unhealthy foods and snacks, and less physical activity and more leisure time entertainment. This rapid Westernization of lifestyles might have led to a more rapid increase in the obesity rate because there has not been enough time to adapt. Actually, the rise in obesity prevalence appears to be accelerated worldwide in middle-income countries.4
The fundamental cause of obesity is an imbalance between energy intake and expenditure. Complex causal factors including personal and environmental elements and their interrelationships play a role in the development of obesity.17 Behavioral changes in personal levels focusing on increases in healthy eating and physical activity should be promoted by policies implemented in society.14 Meanwhile, the heterogeneity in obesity rates between countries might imply that social and other factors and their disparities are associated with obesity status.18 The increases in obesity prevalence began initially in high-income countries, followed by in middle-income and then low-income countries. The increasing rate of obesity has been accompanied by an improved economy, particularly in several developing countries; the obesity prevalence increases firstly among individuals with a higher socioeconomic status and then shifts to a lower socioeconomic status in accordance with the improving economy.15,19 Socioeconomic factors have been reported to impact the incidence of cardiovascular disease and the degrees of their effect on health status vary between males and females.20,21 Numerous studies have examined the association between socioeconomic status and the cardiovascular disease-related health status and they showed income and education levels are associated with obesity and abdominal obesity.21,22 Our findings support that individuals with lower income and education levels have higher rates of obesity and abdominal obesity, including especially in females. Similar to our findings, a study using data from the NHIS database identified a sex difference in the prevalence and odds ratio of obesity and abdominal obesity in workers: those with a lower income or rural residence were correlated with obesity and abdominal obesity among female workers.22 This study explained that this difference can be attributed to variations in health behaviors between males and females. In addition, the disparity in obesity prevalence according to socioeconomic status observed in our study appeared to be more prominent when compared with findings from a previous study.23
Studies on obesity among worker groups have been insufficient. Obese workers may tend to be less productive and to be more likely to suffer from injuries.24,25 In our analysis based on the occupation classification, managers presented the highest prevalence of obesity and abdominal obesity. A study using the KNHANES data from 1998 to 2015 reported that the prevalence of obesity increased steadily among male manual workers but decreased among female sales/services workers.26 Although the study design and occupation classification were different than in our study, this research also reported a higher proportion of obesity was found in nonmanual workers, especially males. Although the caloric intake was not carefully considered in our analysis, less physical work and energy expenditure might have led to the higher rates of obesity and abdominal obesity in this group. In addition, we found that longer working hours, split-shift work, and shift work at night were associated with higher prevalence of obesity and abdominal obesity. Working long hours may be associated with reduced efforts made to ensure a good diet and adequate exercise for weight control and may exacerbate chronic stress and poor sleeping habits.27,28 Considerable reports have found that people engaged in shift work appear to gain more weight than those who follow a more typical work schedule. Shift work is associated with increased risks of obesity, diabetes mellitus, and cardiovascular disease as a result of metabolic disturbances from physiological maladaptation to sleeping and eating at chronically abnormal circadian times.29
Our study has several limitations. We only assessed the prevalence of obesity and abdominal obesity; thus, our data cannot provide concrete information on any factor in the obesity epidemic in Korea. However, this study included the overall adult population of Korea and provides valuable data on national health statistics on obesity and abdominal obesity after standardizing for age and sex. Moreover, we considered various social factors with regard to obesity prevalence.
In conclusion, from the findings of the 2019 Obesity Fact Sheet, the prevalence of obesity and abdominal obesity increased from 2009 to 2018. Individuals with a lower socioeconomic status, occupations similar to being a manager, longer working hours, and splitshift work had higher prevalence of obesity and abdominal obesity. A better understanding of the obesity epidemic and the remarkable differences in social factors in relation to obesity in Korea based on our findings will be helpful for identifying obesity trends and social causes of obesity and to provide potential intervention strategies.
ACKNOWLEDGMENTS
This work was partially supported by the Korean Society for the Study of Obesity. This study was supported by a grant from the Korean Health Technology and R&D project, Ministry of Health & Welfare, Republic of Korea (HC16C2285). We cordially thank the National Health Insurance Service and the Korean Society for the Study of Obesity for their sincere support.
Footnotes
CONFLICTS OF INTEREST
The authors declare no conflict of interest.
AUTHOR CONTRIBUTIONS
Study concept and design: GEN, YHK, KH, JHJ, and WYL; acquisition of data: GEN, YHK, KH, JHJ, and WYL; analysis and interpretation of data: all authors; drafting of the manuscript: GEN, YHK, and WYL; critical revision of the manuscript: all authors; statistical analysis: KH and JHJ; and study supervision: YHK and WYL.
Contributor Information
Collaborators: the Taskforce Team of the Obesity Fact Sheet of the Korean Society for the Study of Obesity
REFERENCES
- 1.NCD Risk Factor Collaboration (NCD-RisC) Worldwide trends in body-mass index, underweight, overweight, and obesity from 1975 to 2016: a pooled analysis of 2416 populationbased measurement studies in 128·9 million children, adolescents, and adults. Lancet. 2017;390:2627–42. doi: 10.1016/S0140-6736(17)32129-3. [DOI] [PMC free article] [PubMed] [Google Scholar]
- 2.Ng M, Fleming T, Robinson M, Thomson B, Graetz N, Margono C, et al. Global, regional, and national prevalence of overweight and obesity in children and adults during 19802013: a systematic analysis for the Global Burden of Disease Study 2013. Lancet. 2014;384:766–81. doi: 10.1016/S0140-6736(14)60460-8. [DOI] [PMC free article] [PubMed] [Google Scholar]
- 3.World Health Organization. Obesity and overweight [Internet] World Health Organization; Geneva: 2020. [cited 2020 Jun 24]. Available from: http://www.who.int/news-room/fact-sheets/detail/obesity-and-overweight. [Google Scholar]
- 4.Blüher M. Obesity: global epidemiology and pathogenesis. Nat Rev Endocrinol. 2019;15:288–98. doi: 10.1038/s41574-019-0176-8. [DOI] [PubMed] [Google Scholar]
- 5.Sahakyan KR, Somers VK, Rodriguez-Escudero JP, Hodge DO, Carter RE, Sochor O, et al. Normal-weight central obesity:implications for total and cardiovascular mortality. Ann Intern Med. 2015;163:827–35. doi: 10.7326/M14-2525. [DOI] [PMC free article] [PubMed] [Google Scholar]
- 6.Nam GE, Kim YH, Han K, Jung JH, Park YG, Lee KW, et al. Obesity fact sheet in Korea, 2018: data focusing on waist circumference and obesity-related comorbidities. J Obes Metab Syndr. 2019;28:236–45. doi: 10.7570/jomes.2019.28.4.236. [DOI] [PMC free article] [PubMed] [Google Scholar]
- 7.Korean Society for the Study of Obesity. Obesity fact sheet [Internet] Korean Society for the Study of Obesity; Seoul: [cited 2020 Jun 24]. Available from: http://www.kosso.or.kr/popup/obesity_fact_sheet.html. [Google Scholar]
- 8.Song SO, Jung CH, Song YD, Park CY, Kwon HS, Cha BS, et al. Background and data configuration process of a nationwide population-based study using the Korean National Health Insurance System. Diabetes Metab J. 2014;38:395–403. doi: 10.4093/dmj.2014.38.5.395. [DOI] [PMC free article] [PubMed] [Google Scholar]
- 9.Kim YH, Han K, Son JW, Lee SS, Oh SW, Kwon HS, et al. Data analytic process of a nationwide population-based study on obesity using the national health information database presented by the National Health Insurance Service 2006-2015. J Obes Metab Syndr. 2017;26:23–7. doi: 10.7570/jomes.2017.26.1.23. [DOI] [PMC free article] [PubMed] [Google Scholar]
- 10.Seo MH, Lee WY, Kim SS, Kang JH, Kang JH, Kim KK, et al. 2018 Korean Society for the Study of Obesity guideline for the management of obesity in Korea. J Obes Metab Syndr. 2019;28:40–5. doi: 10.7570/jomes.2019.28.1.40. [DOI] [PMC free article] [PubMed] [Google Scholar]
- 11.Lee M. Research trends in obesity & obesogenic environments in Korea. Nutr Res Pract. 2019;13:461–72. doi: 10.4162/nrp.2019.13.6.461. [DOI] [PMC free article] [PubMed] [Google Scholar]
- 12.Organisation for Economic Co-operation and Development. OECD obesity update 2017 [Internet] OECD; Paris: 2017. [cited 2020 Jun 24]. Available from: http://www.oecd.org/health/obesity-update.htm. [Google Scholar]
- 13.Wardle J, Boniface D. Changes in the distributions of body mass index and waist circumference in English adults, 1993/1994 to 2002/2003. Int J Obes (Lond) 2008;32:527–32. doi: 10.1038/sj.ijo.0803740. [DOI] [PubMed] [Google Scholar]
- 14.Silventoinen K, Jelenkovic A, Sund R, Hur YM, Yokoyama Y, Honda C, et al. Genetic and environmental effects on body mass index from infancy to the onset of adulthood: an individualbased pooled analysis of 45 twin cohorts participating in the COllaborative project of Development of Anthropometrical measures in Twins (CODATwins) study. Am J Clin Nutr. 2016;104:371–9. doi: 10.3945/ajcn.116.130252. [DOI] [PMC free article] [PubMed] [Google Scholar]
- 15.Afshin A, Forouzanfar MH, Reitsma MB, Sur P, Estep K, et al. , GBD 2015 Obesity Collaborators. Health effects of overweight and obesity in 195 countries over 25 years. N Engl J Med. 2017;377:13–27. doi: 10.1056/NEJMoa1614362. [DOI] [PMC free article] [PubMed] [Google Scholar]
- 16.Swift DL, McGee JE, Earnest CP, Carlisle E, Nygard M, Johannsen NM. The effects of exercise and physical activity on weight loss and maintenance. Prog Cardiovasc Dis. 2018;61:206–13. doi: 10.1016/j.pcad.2018.07.014. [DOI] [PubMed] [Google Scholar]
- 17.Teixeira PJ, Carraça EV, Marques MM, Rutter H, Oppert JM, De Bourdeaudhuij I, et al. Successful behavior change in obesity interventions in adults: a systematic review of self-regulation mediators. BMC Med. 2015;13:84. doi: 10.1186/s12916-015-0323-6. [DOI] [PMC free article] [PubMed] [Google Scholar]
- 18.Thornton LE, Cameron AJ, McNaughton SA, Worsley A, Crawford DA. The availability of snack food displays that may trigger impulse purchases in Melbourne supermarkets. BMC Public Health. 2012;12:194. doi: 10.1186/1471-2458-12-194. [DOI] [PMC free article] [PubMed] [Google Scholar]
- 19.Block JP, Scribner RA, DeSalvo KB. Fast food, race/ethnicity, and income: a geographic analysis. Am J Prev Med. 2004;27:211–7. doi: 10.1016/j.amepre.2004.06.007. [DOI] [PubMed] [Google Scholar]
- 20.Ali MK, Bhaskarapillai B, Shivashankar R, Mohan D, Fatmi ZA, Pradeepa R, et al. Socioeconomic status and cardiovascular risk in urban South Asia: The CARRS Study. Eur J Prev Cardiol. 2016;23:408–19. doi: 10.1177/2047487315580891. [DOI] [PMC free article] [PubMed] [Google Scholar]
- 21.Gamlath L, Nandasena S, Linhart C, Ngo A, Morrell S, et al. , Hennadige Padmal de Silva S. Differentials in cardiovascular risk factors and diabetes by socioeconomic status and sex in Kalutara, Sri Lanka. Asia Pac J Public Health. 2017;29:401–10. doi: 10.1177/1010539517709028. [DOI] [PubMed] [Google Scholar]
- 22.Ryu H, Moon J, Jung J. Sex differences in cardiovascular disease risk by socioeconomic status (SES) of workers using national health information database. Int J Environ Res Public Health. 2020;17:2047. doi: 10.3390/ijerph17062047. [DOI] [PMC free article] [PubMed] [Google Scholar]
- 23.Koo BK, Kim SW, Yi KH, Moon MK. Low economic status is identified as an emerging risk factor for diabetes mellitus in Korean men aged 30 to 59 years in Korean National Health and Nutrition Examination Survey 2008 to 2010. Diabetes Metab J. 2015;39:137–46. doi: 10.4093/dmj.2015.39.2.137. [DOI] [PMC free article] [PubMed] [Google Scholar]
- 24.Tremmel M, Gerdtham UG, Nilsson PM, Saha S. Economic burden of obesity: a systematic literature review. Int J Environ Res Public Health. 2017;14:435. doi: 10.3390/ijerph14040435. [DOI] [PMC free article] [PubMed] [Google Scholar]
- 25.Trogdon JG, Finkelstein EA, Hylands T, Dellea PS, Kamal-Bahl SJ. Indirect costs of obesity: a review of the current literature. Obes Rev. 2008;9:489–500. doi: 10.1111/j.1467-789X.2008.00472.x. [DOI] [PubMed] [Google Scholar]
- 26.Lee JY, Lee YR, Kim HR, Myong JP, Kang MY. Trends in obesity prevalence by occupation based on Korean National Health and Nutrition Examination Survey from 1998 to 2015. Saf Health Work. 2020;11:97–102. doi: 10.1016/j.shaw.2019.08.003. [DOI] [PMC free article] [PubMed] [Google Scholar]
- 27.Maruyama S, Morimoto K. Effects of long workhours on lifestyle, stress and quality of life among intermediate Japanese managers. Scand J Work Environ Health. 1996;22:353–9. doi: 10.5271/sjweh.153. [DOI] [PubMed] [Google Scholar]
- 28.Kim BM, Lee BE, Park HS, Kim YJ, Suh YJ, Kim JY, et al. Long working hours and overweight and obesity in working adults. Ann Occup Environ Med. 2016;28:36. doi: 10.1186/s40557-016-0110-7. [DOI] [PMC free article] [PubMed] [Google Scholar]
- 29.Antunes LC, Levandovski R, Dantas G, Caumo W, Hidalgo MP. Obesity and shift work: chronobiological aspects. Nutr Res Rev. 2010;23:155–68. doi: 10.1017/S0954422410000016. [DOI] [PubMed] [Google Scholar]


