

SUMMARY
Cell fate transitions are accompanied by global transcriptional, epigenetic and topological changes driven by transcription factors (TFs), as is exemplified by reprogramming somatic cells to pluripotent stem cells (PSCs) via expression of OCT4, KLF4, SOX2 and cMYC. How TFs orchestrate the complex molecular changes around their target gene loci remains incompletely understood. Here, using KLF4 as a paradigm, we provide a TF-centric view of chromatin reorganization and its association to 3D enhancer rewiring and transcriptional changes during reprogramming of mouse embryonic fibroblasts to PSCs. Inducible depletion of KLF factors in PSCs caused a genome-wide decrease in enhancer connectivity, while disruption of individual KLF4 binding sites within PSC-specific enhancers was sufficient to impair enhancer-promoter contacts and reduce expression of associated genes. Our study provides an integrative view of the complex activities of a lineage-specifying TF and offers novel insights into the nature of molecular events that follow TF binding.
INTRODUCTION
Cell identity is defined by a unique gene expression program as well as characteristic epigenetic landscape and three-dimensional (3D) chromatin topology, features that are constantly supervised by a set of transcription factors (TFs) known as master regulators1, 2. Although the ability of master regulators to maintain and change cell identity is well established, the underlying molecular mechanisms remain poorly understood.
Somatic cell reprogramming into induced pluripotent stem cells (iPSCs) by the OCT4, KLF4, SOX2 and cMYC (OKSM) offers a tractable system to study TF-driven mechanisms of cell fate determination3, 4. The transcriptional and epigenetic changes induced by OKSM expression that result in the erasure of somatic identity and the establishment of pluripotency have been extensively described 5–14. Recent studies utilizing targeted or global chromatin conformation capture techniques revealed local or large-scale reorganization of 3D genomic architecture between somatic and pluripotent stem cells (PSCs) 15–21 and strong association with OKS binding15–17, 21, suggesting a potential architectural role of reprogramming TFs. The architectural function of KLF4 is further supported by the observations that KLF4 depletion abrogates long-range chromatin contacts at specific genomic loci, such as the Pou5f1 (Oct4) locus in mouse PSCs18, and the HOPX gene in human epidermal keratinocytes22. In addition, depletion of the related factor KLF1 disrupts selected long-range interactions in the context of erythropoiesis23, 24. To test whether OKS, and in particular KLF4 may orchestrate chromatin architectural changes in a genome-wide manner, we captured the dynamic KLF4-centric topological reorganization and associated molecular alterations during the course of reprogramming mouse embryonic fibroblasts (MEFs) into iPSCs (Fig.1a, top panel). Integrative analysis of our results generated a reference map of stage-specific chromatin changes around KLF4 bound loci and established strong links with enhancer rewiring and concordant transcriptional changes. Inducible depletion of KLF factors in PSCs and genetic disruption of KLF4 binding sites within specific PSC enhancers further supported the function of KLF4 as both transcriptional regulator and chromatin organizer.
Figure 1. Dynamic KLF4 binding during reprogramming and association with chromatin accessibility and enhancer activity.
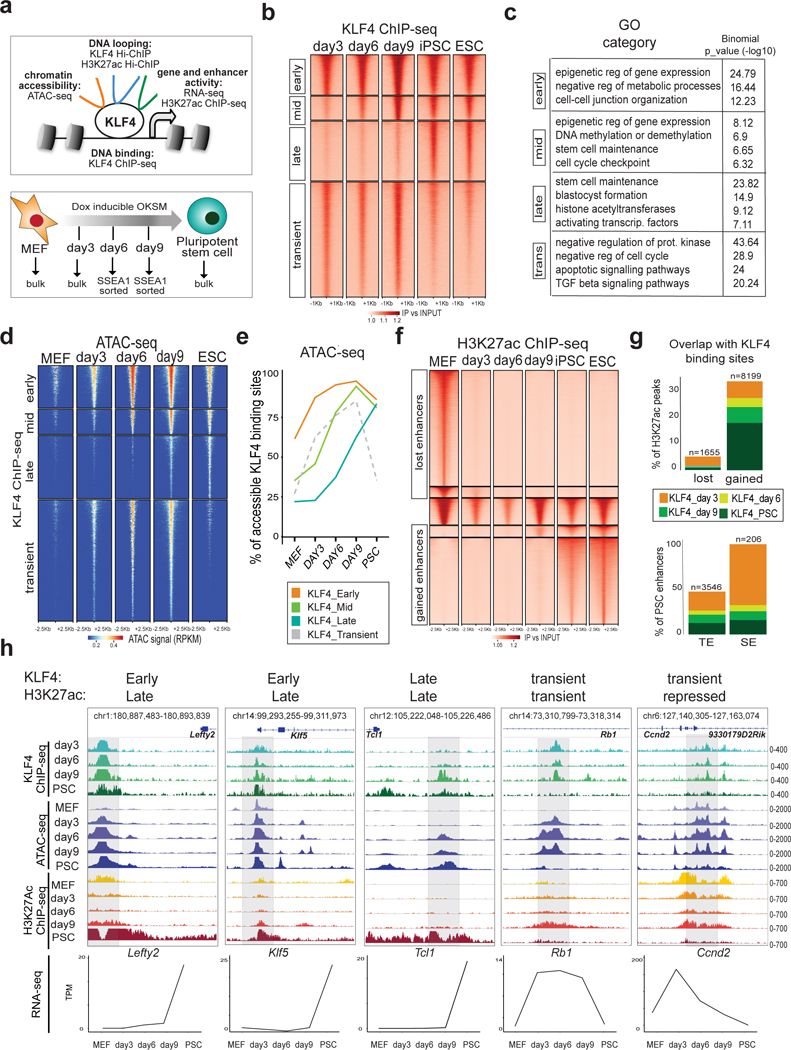
a Schematic illustration of the experimental system and strategy. b Tornado plots of KLF4 ChIP-seq signals at different reprogramming stages clustered in four different categories: Early, Mid, Late and Transient KLF4 binding. ChIP-seq signals (fold enrichment over input) are showing 1kb upstream/downstream of peak centers. c, Gene ontology analysis of Early (n=6275), Mid (n=3712), Late (n=9287) and Transient (n=17891) KLF4 target sites. Significance was calculated by two-sided binomial test as provided by the GREAT software d, Tornado plot of ATAC-seq signal at different reprogramming stages around KLF4 binding sites (Early, Mid, Late, Transient). ATAC-seq signals are showing 2.5kb upstream/downstream of peak centers. RPKM (Read Per Kilobase Million). e, Line plots showing the percentages of KLF4 Early, Mid, Late and Transient targets that overlapped with ATAC-seq peaks (accessible regions) at each reprogramming stage. f, Tornado plot of H3K27ac ChIP-seq signal showing MEF peaks, PSC peaks and constant peaks at each reprogramming stage. ChIP-seq signals (fold enrichment over input) are showing 2.5kb upstream/downstream of peak centers g, Bar plots showing percentage of either lost (MEF) or gained (PSC) H3K27ac peaks (top) and of PSC enhancers (TE) or superenhancers (SE)34 (bottom) that overlap with KLF4 binding sites at any reprogramming stage. The exact N numbers of overlapping H3K27ac peaks or PSC enhancers are shown on top of each bar. h, Examples of genomic regions (see genomic coordinates) that show different kinetics of KLF4 binding and H3K27ac occupancy during reprogramming. IGV tracks for KLF4 chIP-seq, ATAC-seq, H3K27ac ChIP-seq at each reprogramming stage are shown and the signal values are indicated on the right. The transcriptional changes of the depicted genes during reprogramming are shown at the bottom, expressed as transcripts per million (TPM). The mean value of 2 biological replicates is shown. ChIP-seq and ATAC-seq experiments were performed in n=2 biological replicates.
RESULTS
KLF4 binding during reprogramming induces chromatin opening and precedes enhancer and gene activation
We mapped the genome-wide KLF4 binding at different stages of reprogramming using “reprogrammable” MEFs induced with doxycycline (dox)25 in the presence of ascorbic acid (Fig.1a, bottom). Under these conditions the resulting iPSCs are molecularly and functionally indistinguishable from embryonic stem cells (ESCs) 26, 27 and we used either cell type (refered to as PSCs) as reference points for established pluripotency. Bulk populations were used for the early stages, while for mid and late stages we sorted SSEA1+ cells14, 25, 28, 29 (Supplementary Fig.1a). chIP-seq analysis showed two major categories of KLF4 binding sites: (i) enriched during intermediate reprogramming stages, but weak in PSCs (Transient KLF4 targets) and (ii) strongly detected in PSC (Fig.1b and Supplementary Table 1). Among the PSC KLF4 binding sites, 30% were already bound on day 3 (Early KLF4 targets), while the rest were either gradually established during reprogramming (Mid KLF4 targets) or enriched only in established PSCs (Late KLF4 targets). Genomic annotation based on their chromatin state classification8 and Gene Ontology (GO) analysis30 (Fig.1c and Supplementary Fig. 1b) showed that Early KLF4 targets are enriched for promoters of genes involved in metabolic processes and cell junction organization (Fig.1c and Supplementary Fig.1b), in agreement with previous reports on KLF414. Mid and Late KLF4 targets included pluripotency-associated enhancers and enriched for stem cell maintenance genes, such as Sox2, Nanog, Esrrb and Klf4. Transient KLF4 targets enriched for enhancers active in partially reprogrammed cells8 (Supplementary Fig.1b) and genes involved in apoptosis, negative regulation of cell cycle and signaling pathways associated with differentiation (Fig.1c). Therefore, transient KLF4 binding might be associated with unsuccessful reprogramming and alternative fates induced by OKSM expression31–33.
Integration of ATAC-seq data revealed that ~60% of the Early KLF4 binding sites were already open in MEFs, suggesting that preexisting chromatin accessibility partly explains early binding of KLF4 on these targets (Fig.1d, Fig.1e and Supplementary Fig.1c) In contrast, the majority (>70%) of Mid and Late KLF4 targets were characterized by closed chromatin configuration in MEFs (Fig.1d and Fig.1e) and elevated DNA methylation levels12 (Supplementary Fig.1d). These domains gained accessibility concomitantly with KLF4 binding at later timepoints, suggesting the requirement of additional factors for epigenetic remodeling. We also observed a large number of inaccessible regions in MEFs that became occupied by KLF4 on day 3 (~40% of early and ~75% of transient targets, Fig.1e), indicating that the ability of this TF to access “closed” sites is context-dependent (Fig.1d–e). Motif enrichment analysis revealed distinct classes of candidate TFs that may synergize with KLF4 to promote its stage-specific binding (Supplementary Fig.1e).
KLF4 has been proposed to function both as an activator and repressor of gene expression 11, 14. ChIP-seq for H3K27 acetylation (H3K27ac) revealed pronounced changes in enhancer activity during iPSC generation associated with KLF4 binding (Fig.1f and Supplementary Fig.1f). While less than 5% of decommisioned MEF enhancers (regions that lost H3K27 acetylation between MEFs and day 3) were targeted by KLF4, about 35% of the total acquired PSC enhancers and almost the entirety of so-called super enhancers (SE)34 were bound by KLF4 concomitantly or prior to H3K27 acetylation (Fig.1g and Supplementary Table 2). Genes linked to Early, Mid, Late or Transient KLF4 ChIP-seq peaks showed a strong trend for transcripional upregulation, rather than downregulation, at the respective reprogramming stages (Figure 1h, Supplementary Fig.1g, h and Supplementary Table 3), suggesting that KLF4 binding predominantly results in enhancer and gene activation during iPSC generation.
Long-range enhancer contacts are extensively rewired between MEFs and PSCs in concordance with epigenetic and transcriptional changes
Targeted (4C-seq) or global (HiC) chromatin conformation assays have previously demostrated that chromatin topology around specific genomic loci and at the scale of compartments and Topologically Associating Domains (TADs)35, are drastically reorganized during reprogramming15, 17–21. As cell type-specific regulatory loops, such as enhancer-promoter interactions, were underrepresented in these studies, we performed H3K27ac HiChIP36 to generate highresolution contact maps around active enhancers in MEFs and PSCs. We called statistically significant interactions using Mango37 at 10kb resolution and within a maximum range of 2MB and with at least one anchor overlapping with H3K27ac ChIP-seq peaks (Fig. 2a, Supplementary Fig.2a) (see Methods for details). Differential looping analyses between normalized read-counts (counts-per- million; CPM) of the union of all called significant loops revealed about 40,000 contacts that were enriched either in MEFs or in PSCs (Fig.2a and Supplementary Table 4). Differential HiChIP contacts were filtered based on p- values (pvalue<0.1 and Log Fold Change (LogFC) >2 or <−2) not corrected for multiple testing. Retrospective validation using EdgeR followed multiple testing correction demonstrated an FDR<0.1 for the reported differential loops (see Methods). We also identified a group of ~9,000 H3K27ac contacts that show constant interaction strength between MEFs and PSCs (pvalue>0.5, logFC<0.5 & logFC>−0.5). MEF-specific or PSC-specific H3K27ac loops correlated with expression levels of associated genes (Fig.2b). These findings demonstrate that H3K27ac HiChIP enables mapping of cell-type specific enhancer-gene interactions, as exemplified by virtual 4C around Mycn and Ets1 genes (Fig.2c). The position and patterns of the detected chromatin loops at these representative loci are in high concordance with acquisition or loss of H3K27ac marks and transcriptional changes during reprogramming (Fig.2d–e). The cell-type specific nature of these HiChIP-detected interactions was also validated by independent 4C-seq analysis (Fig.2f).
Figure 2. Characterization of 3D enhancer connectomes in MEFs and PSCs by H3K27ac HiChIP analysis.

a, Heatmap of differential loops detected by H3K27ac HiChIP in MEF versus PSC as described in the Methods. Heatmap shows Log2 counts-per-million (CPM) per replicate. b, RNA expression changes between MEFs and PSCs of genes whose promoters were exclusively involved in at least one MEF-specific (n=329 genes), PSC-specific (n=875 genes) or constant (n=1429 genes) H3K27ac loops. All protein-coding genes (n=11843) were used as control. Statistics were calculated by unpaired one-tailed t-test. The respective minimum and maximum values and q25%, q50% and q75% are shown in each boxplot. c, Virtual 4C representation of normalized H3K27ac HiChIP signals around selected viewpoints (Mycn enhancer and Ets1 promoter). Representative H3K27ac ChIP-seq IGV tracks are shown for 2 biological replicates. (d), while the average RNA levels expressed as transcripts per million (TPM) from 2 biological replicates per reprogramming stage are shown in (e). f, 4C-seq analysis around the same viewpoints as in (c) validate the presence and cell-type specificity of HiChIP-detected loops. 4C-seq signals normalized by sequencing depth and average across 2 biological replicates are shown. g, HiChIP (top) and HiC (bottom) heatmaps generated by Juicebox at 10Kb resolution around MEF-specific (Jag1) or PSC-specific (Sox2) contacts. Both PSC and MEF dat of genes found in anchors with lowaare shown, separated by the diagonal. Signal indicates sum of CPM per matrix (2 biological replicates). Dotted squares indicate regions with cell-type specific configuration as detected by both HiC and HiChIP. Circles show examples of cell-type specific contacts that are detected in HiChIP and missed in HiC data.
To determine whether differential HiChIP contacts reflect chromatin conformation changes or technical bias due to acquisition or loss of H3K27ac at loop anchors, we performed HiC analysis in MEFs and PSCs. We observed that only ~50% of the HiChIP contacts were also detected in HiC of similar sequencing depth and using the same loop-calling pipeline (Supplementary Fig.2b). This percentage increased to ~80% when published ultra-resolution HiC data was used38, suggesting that sequencing depth is a limiting factor to detect HiChIP contacts by HiC. Higher local background in HiC might be another contributing factor, as shown by comparing HiChIP and HiC signals around the Tbx3 locus (Supplementary Fig.2c). Contact heatmaps further illustrate this point: although both HiChIP and HiC data depict a cell-type specific configuration around Jag1 and Sox2 several cell-type specific loops are strongly detected by HiChIP but not by HiC (Fig. 2g). MEF-specific or PSC-specific HiChIP loops detected by both approaches showed significantly stronger HiC signals in the respective cell type, confirming topological reorganization around these regions (Supplementary Fig.2d). In agreement with previous reports36, 39, these observations highlight the increased sensitivity of HiChIP compared to HiC to detect cell-type specific loops.
Complex 3D connectomes in PSCs are associated with strong enhancer activity
We noticed that specific enhancers and promoters were involved in more than one contact. The degree of connectivity was significantly higher among PSC- specific loops than MEF-specific or constant loops, with hundreds of genomic anchors connecting with 10 or more (up to 33) distant genes and/or enhancers (Fig.3a and Supplemental Fig. 3a). Analysis of HiC data validated the higher connectivity of PSCs compared to MEFs (Supplemental Figure 3b), possibly reflecting a more plastic chromatin configuration5, 7.
Figure 3. Highly connected enhancers are characterized by specific features.

a, Dot plot showing the number of high-confidence contacts (connectivity) around each H3K27ac HiChIP anchor. Significance was calculated by two-sided Wilcoxon rank sum test. The numbers of considered anchors were n=26063 for MEF-specific, n=19104 for PSC-specific and n= 12316 for constant loops. b, Connectivity of HiChIP anchors containing PSC superenhancers (SE) (n=474 anchors), typical enhancers (TE) (n=5073 anchors), or transcription start sites (TSS) (n=7493 anchors) in PSC. Significance was calculated by two-sided Wilcoxon rank sum test. Each boxplot indicates minimum and maximum values as well as q25%, q50% and q75% (a) c, LOLA enrichment analysis of enhancer anchors with low connectivity (n=1183 anchors) or high connectivity (n=1014 anchors) in PSCs using in-house and public ChIP-seq datasets from ESCs (see methods). Heatmaps represent either -log10 p-value (bottom), as calculated by two-sided Fisher’s exact test, or z-score of odds ratio (top). d, Expression levels of genes found in anchors with low (n=576 genes) versus high (n=573 genes) connectivity (expressed in TPM). Statistics were calculated by two-sided Wilcoxon rank sum test. Each boxplot indicates minimum and maximum values as well as q25%, q50% and q75%
Among the highest connected regions in PSCs were stem cell regulators, including Mycn, Esrrb, and mir290 and PSC superenhancers (SE)34 (Fig.3a–b). Highly-connected anchors (>4 contacts) preferentially associated with binding of Pol II, pluripotency TFs (including KLF4), Mediator complex and transcriptional coactivators (Fig.3c) and with high transciptional levels (Fig.3d). Cohesin subunits and YY1, which can mediate enhancer-promoter loops40, 41, were also preferentially enriched in highly connected anchors, while the classical architectural factor CTCF42 was not (Fig.3c). These results suggest that SEs and highly-expressed genes engage in an increased number of chromatin interactions. Importantly, the number of enhancer contacts showed poor correlation with the strength of H3K27ac signal (Supplemental Fig.3c), suggesting that these observations do not reflect a bias of our HiChIP approach.
3D-organized enhancer hubs are associated with coordinated cell-type specific gene expression
To gain insights into the biological role of complex enhancer-promoter interactions, we decided to focus on enhancers that establish connections with two or more gene promoters, potentially forming what we refer to as 3D regulatory hubs (or simply enhancer hubs). Genes found within enhancer hubs were enriched for “stem cell maintenance” categories, including known pluripotency-associated regulators (e.g. Zic2, Etv2, Lin28a, Dnmt3l) (Supplemental Fig.4a). Hub-connected genes were expressed at significantly higher levels compared to genes with a single-connected enhancer (non-hub genes) and all PSC-expressed genes (Supplemental Fig.4b). Many SE that had been initially assigned to a single gene34, 43 were found to either contact novel distal target genes or to form hubs with two or more genes of PSC relevance (e.g. Utf1, Otx2 and Naccl) and high expression levels (Supplemental Fig.4a–b). These results expand the previous pool of candidate genes that are regulated by PSC SE34, 44 and suggest that 3D enhancer hubs may coordinate expression of pluripotency regulators. To test this hypothesis, we calculated the percentage of coregulation of all protein-coding genes that participate in hubs and are differentially expressed between MEFs and PSCs (Supplementary Table 5). This analysis demonstrated significant overrepresentation of coregulated gene pairs within enhancer hubs compared to control groups of random gene pairs of either similar linear distance (global random) or within the same TADs35 (TAD-matched random) (Fig.4a) and revealed 311 gene pairs that reside within enhancer hubs and become concordantly upregulated during reprogramming.
Figure 4. Coregulation of genes within highly interacting enhancer hubs.

a, Top: schematic representation of enhancer hubs interacting with two or more gene promoters. Bottom: Barplot indicating the percentage of gene pairs within enhancer hubs that become transcriptionally co-regulated (both up or both down with log2 fold change >=1 or <=−1 & p-adj<=0.01) or anti-regulated (one up and one down) between MEFs and PSCs. Global Random or TAD-matched gene pairs were used as controls (see also Methods). Individual n numbers per group are shown in the respective bars. Statistics were calculated by two-sided Fisher’s exact test. Non-differentially expressed genes (n=487) were not considered in this analysis. b, Example of a newly identified enhancer hub in PSCs. Normalized HiChIP signal around the viewpoint is illustrated as a virtual 4C plot. c, 4C-seq analysis around the same viewpoint as in (b). 4C-seq signals normalized by sequencing depth and average across 2 biological replicates are shown. d, H3K27ac ChIP-seq IGV tracks during reprogramming, 2 biological replicates. e, RNA-seq signal (TPM) of genes within the hub are shown to highlight coordinated upregulation during reprogramming, average value of 2 biological replicates. f, Top: experimental strategy for CRISPR-Cas9-mediated deletion of the Tbx3 distal (Dis) or proximal (Prox) enhancers within the hub indicated in panel (b). Bottom: RT-qPCR showing expression changes of Tbx3, Gm16063, Aw54954 and a control gene outside the hub (Med13l) in CRISPR-Cas9 engineered PSC carrying homozygous deletions of the distal (Dis-KO, n=2 independent homozygous KO clones) and proximal (Prox-KO, n=2 independent homozygous KO clones) Tbx3 enhancers calculated as percentage relative to wild-type (WT n=2 independent clones after empty vector targeting). P-values were calculated using unpaired one-tailed t-test (see also Supplementary Figure 8 and Table 11).
To experimentally validate gene coregulation within enhancer hubs, we tested the transcriptional effects of modulating an enhancer hub that contacts two proximal non-coding genes (Aw549542 and Gm16063) and the distal (~90kb) Tbx3 gene in a PSC-specific manner (Fig.4b, c). All enhancers and connected genes within this hub were inactive in MEFs and reprogramming intermediates and became activated in a coordinate fashion in PSCs (Fig.4d–e), which was not the case for the Med13l gene localized outside the hub (~800kb) (Supplemental Fig.4c). We deleted the distal Tbx3 enhancer in PSCs, using as a reference a deletion of a previously characterized proximal enhancer45 within the same hub (Fig.4f and Supplementary Fig.4d). Expression of Tbx3 was severely impaired in homozygous knock-out (KO) clones upon disruption of either enhancer (Dis-KO and Pro-KO), with the distal enhancer showing a stronger effect (Fig.4f). RNA levels of the other hub-connected genes (Gm1603 and Aw549542) were also reduced, while Med13l was unaffected (Fig.4f). Using dCas9-KRAB46 we also targeted a different enhancer that contacts Zic2 and Zic5 genes (Supplemental Fig.4e), which are coactivated during reprogramming (Supplemental Fig.4f and 4g). Silencing of this enhancer (Supplemental Fig.4h–i) resulted in significant downregulation of both genes, while non-hub genes in linear proximity were modestly affected (Supplemental Fig.4j).
KLF4-centered chromatin reorganization during reprogramming associates with enhancer rewiring and transcriptional changes of target genes
Integration of H3K27ac HiChIP and KLF4 ChIP-seq data demonstrated that Early, Mid and Late KLF4 targets (see Fig. 1b) enriched for PSC-specific H3K27ac interactions, while MEF-specific contacts enriched for transient KLF4 binding (Fig.5a). These results raise the possibility that KLF4 is involved in 3D enhancer reorganization during reprogramming.
Figure 5. Chromatin reorganization around KLF4 binding sites during reprogramming associates with enhancer rewiring and requires additional cofactors.

a, Dot plot showing relative enrichment of MEF-specific (n=31087), PSC-specific (n=24203) and constant (n=9389) H3K27ac HiChIP loops that overlapped with KLF4 ChIP-seq peaks that were clustered as Early (n=6275), Mid (n= 3712), Late (n=9287) and Transient (n=17891) (see Fig.1b). Dot size represents p-value (as calculated by two-sided Fisher’s exact test, while the color indicates the ratio of observed (Obs) versus expected (Exp). b, Heatmap of differential KLF4 HiChIP contacts during reprogramming (see Methods) showing log2 CPM per replicate. c, Stacked barplot indicating the relative proportion of genes within gained or lost KLF4 loops that become either upregulated or downregulated during reprogramming or remain unchanged (see Methods). Individual n numbers of genes per group are shown in the respective bars. d, Stacked barplot showing the percentage of gained or lost KLF4 HiChIP loops that were also detected by H3K27ac HiChIP analysis in either MEFs and/or PSCs. Individual n numbers of KLF4 HiChIP loops per group are shown in the respective bars. e, LOLA enrichment analysis of KLF4 binding sites in PSCs that overlap either with H3K27ac-dependent loops (detected by both KLF4 and H3K27ac HiChIP) (n= 11287 overlapping KLF4 binding sites) or -independent (detected only by KLF4 HiChIP) (n=5078 overlapping KLF4 binding sites) (See Supplementary Fig.4c). Selected factors that scored as significantly enriched over background are shown. Heatmaps represent either -log 10 of p-value calculated by two-sided Fisher’s exact test (left) or z-score of OddsRatio (right). f, Venn diagram showing the number of proteins identified by RIME analysis against KLF4 (3 biological replicates) after filtering out proteins detected in the IgG control (2 biological replicates). Proteins detected only in KLF4 with a Signal- to-Noise ratio (S/N) above 20 were considered. g, Immunoprecipitation using KLF4 antibody or IgG in PSC extracts followed by Western blot analysis validated interaction of KLF4 with selected factors (LSD1 as negative control). Representative of 2 independent experiments. Relative position and size (kDa) of protein marker is shown on the right (see Supplementary Fig.8)
To directly capture the topological changes around KLF4-occupied sites during iPSC formation, we performed KLF4 HiChIP in early (day 3) and mid (day 6) reprogramming intermediates. Principle component analysis (PCA) on all statistically-significant interactions distinguished KLF4-bound loops from H3K27ac-marked contacts (Supplementary Fig.5a). Differential looping analysis revealed revealed two clusters of KLF4-centered interactions gained in mid or late reprogramming stages and two clusters of lost loops detected only in early or mid stages (Fig. 5b and Supplementary Table 6). These lost KLF4 HiChIP contacts mostly associated with gene repression, while gained KLF4 loops correlated with gene activation during reprogramming (Fig.5c). Accordingly, >40% of the lost KLF4 contacts represented MEF enhancer loops, while the majority of gained KLF4 loops overlapped with PSC enhancer interactions (Fig.5d). These observations support a role of KLF4 binding in the formation/activation of PSC enhancer loops and abrogation/repression of preexisting somatic loops.
To understand the relative effect of KLF4 binding and/or looping on gene activation, we clustered enhancer-promoter loops detected by both KLF4 and H3K27ac HiChIP in PSCs as: (i) early bound by KLF4 and early formed loops during reprogramming (day 3), (ii) early bound, but late formed loops and (iii) late bound and late formed loops (Supplementary Fig. 5b, left panel). Genes within the first category were upregulated early during reprogramming, while genes in the other two categories were activated only at late reprogramming stages (Supplementary Fig.5b, right panel). These results indicate that looping coincides with gene activation while KLF4 binding per se is not always sufficient to establish promoter-enhancer contacts and activate transcription.
KLF4 binding engages in both activating and repressive loops in PSCs
About 30% of dynamic KLF4-centered loops did not associate with any expression changes and did not overlap with enhancer contacts (Fig.5c,d). Among all KLF4-centered loops in PSCs, 74% overlapped with H3K27ac HiChIP contacts (H3K27ac-dependent), while 26% are H3K27ac-independent (Supplementary Fig.5c). KLF4 binding sites within H3K27ac-dependent loops were enriched for active enhancer features such as binding of pluripotency TFs, RNA Pol II, cohesin and Mediator (Fig.5e). In contrast, H3K27ac-independent KLF4 anchors were enriched for Polycomb repressive Complex 1 and 2 (PRC1/2) components, which may mediate looping among repressed or bivalent genes in PSCs17, 47. Genes within H3K27ac-independent loops were expressed at significantly lower levels (Supplemental Fig.5d) and associated with development and lineage specification (Supplemental Fig.5e). These findings raise the possibility that KLF4 engages in chromatin loops with distinct functions, possibly by interacting with different cofactors.
To test the chromatin co-occurrence of KLF4 with computationally-predicted cofactors, we performed RIME48 (Rapid Immunoprecipitation Mass spectrometry of Endogenous proteins) in PSCs using either a KLF4 antibody or IgG as control (Fig.5f). This identified 228 high-confidence (FC>1.5 over IgG and p-value<0.05) protein partners (Supplementary Table 7). RIME detected several predicted cofactors, including components of the Cohesin complex, PRC1/2 and co-activators, such as BRD4. Immunoprecipitation followed by Western blot analysis validated interaction of KLF4 with selected candidates (Fig.5g). These results support the notion that KLF4 participates in both (i) activating chromatin loops enriched in Cohesin, coactivators and pluripotency TFs and engaging highly-expressed genes involved in cell cycle and stemness (e.g. Nodal, Mycn, Pou5f1) and (ii) repressive loops mediated by PRC1/2 that engage genes related to differentiation and development (e.g. Hoxd10, Bmp4) (Supplemental Fig.5f).
Depletion of KLF factors in PSCs disrupts a subset of enhancer loops and expression of linked genes
To dissect the role of KLF4 in the 3D enhancer connectome of PSCs, we generated an ESC line for dox-inducible targeting of Klf4 by CRISPR-Cas9. KLF4 protein levels were successfully reduced 48 hours after dox addition (Supplementary Fig.6a), but we noticed upregulation of Klf2 and Klf5, which encode TFs with partially redundant function to KLF449(Supplementary Fig.6b). We therefore targeted all three KLF factors using the same conditional system (triple KO, TKO). Shortly after dox induction (24 hours), when the levels of KLF proteins were successfully reduced but before other pluripotency factors such as NANOG were affected (Supplementary Fig.6c), we performed H3K27ac HiChIP, ChIP-seq and RNA-seq (Supplementary Table 8). We found 7024 enhancer contacts that were consistently reduced (lost) in all TKO replicates and 3488 newly established loops (Fig.6a). More than 60% of lost loops were bound by KLF4 (ChIP-seq) on one or both anchors, indicating that their disruption is likely a direct effect of KLF factors downregulation (Fig.6b) and multiconnected hubs and superenhancers were preferentially affected compared to typical enhancers (Supplemental Fig.6d).
Figure 6. Inducible depletion of KLF proteins induces 3D enhancer reorganization and concordant transcriptional changes.

a, Top: Experimental strategy used to knock out (KO) KLF2, KLF4 and KLF5 proteins in ESCs using a doxycycline (dox)- inducible CRISPR/Cas9 construct (See also see also Supplementary Fig.8). Bottom: Venn diagram showing the number of H3K27ac HiChIP loops that were gained or lost (p-value<0.05 and fold change >1.5 or <−1.5) or remained constant (logFC >−0.5 & <0.5 and p-value>0.5) in triple knock out (TKO) ESCs compared to uninduced (WT) ESCs (see Methods). b, Stacked barplots showing the percentage of gained or lost H3K27ac HiChIP contacts in TKO versus WT, whose anchors overlap or not with KLF4 ChIP-seq peaks in PSCs. Individual n numbers of HiChIP contacts per group are shown in the respective boxes. c, RNA expression changes of genes within anchors of H3K27ac HiChIP contacts. All protein-coding genes were used as control. Respective gene numbers (n) are shown in the boxes. Statistics were calculated by unpaired one-tailed t-test. Each boxplot indicates minimum and maximum values as well as q25%, q50% and q75%. d, Examples of H3K27ac lost interactions in TKO vs WT ESC as identified by H3K27ac HiChIP. Normalized H3K27ac HiChIP signals are illustrated in a virtual 4C format around the viewpoints. Statistics were calculated with the R-package edgeR (see Methods) using n=2 biological replicates. e, Representative H3K27ac and KLF4 ChIP-seq tracks around each of the genomic regions indicated in (d) from 2 biological replicates. f, RT-qPCR showing mean expression changes of Klf8, Fgf17 and Eif2s2 in WT (n=3 biological replicates) and TKO (n=3 biological replicates) PSC relative to hprt levels. P-values were calculated using unpaired one-tailed t-test. g, 3C-qPCR analysis validating the reduced contact frequency between Klf8, Fgf17 and Eif2s2 promoters and their respective enhancers (marked with a red line in panel (d)) in TKO compared to WT ESCs (n=3 biological replicates). Unpaired one-tail t-test was used to determine P-values. Error bars indicate standard deviation (Source data in Supplementary Table 11)
Genes within lost or gained loops were significantly down- or up-regulated, respectively, in TKO compared to WT cells (Fig.6c). Examples of lost loops involving the Klf8, Fgf17 and Eif2s2 genes are shown in Figure 6d, e. Reduced mRNA levels and disruption of gene-enhancer contacts in TKO cells were validated by RT-qPCR and 3C-qPCR, respectively (Fig.6f and 6g). These results demonstrate that depletion of KLF factors in PSCs results in genome-wide abrogation of enhancer contacts and concordant dysregulation of connected genes.
Disruption of KLF4 binding sites interferes with enhancer looping and transcriptional activation
To ascertain whether KLF4 binding is critical for the architecture and activity of enhancer-promoter contacts, we targeted KLF4 binding sites within selected enhancer hubs. We initally chose the distal Tbx3 enhancer, deletion of which resulted in downregulation of all three hub-connected genes (Fig.4f). Contacts of this enhancer with surrounding genes were detected in PSCs, but not in MEFs or reprogramming intermediates (Fig.7a), which is in concordance with late binding of KLF4 (Fig.7b) and late transcriptional activation of the entire locus (Fig.4e). We disrupted the strongest KLF4 binding motif within this enhancer hub (Fig.7c and Supplemental Fig.7a–c) and used four homozygous mutant clones with impaired KLF4 binding (Supplemental Fig.7d) for further characterization. Expression levels of all hub-connected genes (Aw549542, Gm1603 and Tbx3) were significantly reduced, whereas a gene outside the hub (Med13l) was not affected (Fig.7d). Consistent with transcriptional downregulation, the long-range contacts between the enhancer hub and its targets were significantly weakened in mutant clones (Fig.7e), while the interaction of Tbx3 with the proximal enhancer or a KLF4-independent contact in a different genomic region remained unaffected (Fig.7e).
Figure 7. Disruption of KLF4 binding site within Tbx3 and Zfp42 enhancers induces looping abrogation and downregulation of linked genes in PSCs.

a, Normalized KLF4 and H3K27ac HiChIP signals are illustrated as virtual 4C line plots around the Tbx3 distal enhancer hub (see also Fig.4b–f). Signal shows average CPM per condition, 2 biological replicates (H3K27ac HiChIP), 3 biological replicates (Klf4 day3 HiChIP), 4 biological replicates (Klf4 day6/PSC HiChIP). Representative ChIP-seq IGV tracks are shown in b from 2 biological replicates. c, CRISPR-Cas9 targeting strategy to disrupt KLF4 binding motifs (mut) within the distal Tbx3 enhancer. d, RT-qPCR showing expression changes of hub-associated genes (Tbx3, Gm16063 and Aw54954). Med13l is used as control gene outside the hub. Bar plots show the mean value calculated as percentage relative to wild type (WT) after normalization relative to hprt mRNA levels from two independent experiments. Paired one-tail t-test was used to determine significance relative to WT (n=4 PSC clones) and P-values are shown over each bar. Error bars indicate standard deviation among n=4 PSC clones carrying homozygous mutations of KLF4 binding motif (mut). e, 3C-qPCR analysis showing the relative interaction frequency of Tbx3 distal enhancer with the promoters of linked genes in WT (n=2 PSC clones) and mutant (MUT, n=4 PSC clones). Bar plots show the mean value and error bars indicate standard deviation. f-j, Representation, analysis and functional validation of Zfp42 enhancer hub similarly to panels (a-e) for Tbx3 hub. The same normalizations and statistical tests (unpaired one-tailed t-test) were applied. For (i) n=3 WT PSC clones and n=5 KLF4 mutant clones. In (j) WT n=2 versus n=5 mutant clones. (See Supplementary Figure 8 and Table 11).
We also mutated a KLF4 binding site within the previously described Zfp42 superenhancer50, which contacts both Zfp42 and the distal (~150kb) Triml2 gene in PSCs (Fig.7f–g). Homozygous mutant ESCs showed downregulation of Zfp42 expression and concordant reduction of enhancer-Zfp42 promoter contact frequency (Fig.h-j). Intriguingly, expression levels of Triml2 remained unaffected in the mutant clones and the connection with the enhancer appeared even stronger (Fig.7i–j), suggesting that KLF-dependent and independent mechanisms may regulate looping and activity of the same enhancer on different genes. Taken together, these results provide evidence for a dual role of KLF4 as a transcriptional regulator and chromatin organizer in PSCs.
DISCUSSION
Here, we describe the genome-wide dynamics of KLF4 binding and its effects on chromatin accessibility, enhancer activity, gene expression and 3D enhancer organization during iPSC reprogramming and in established PSCs. Our data suggest that the relationship between KLF4 binding and gene and enhancer activation at some loci is dependent on preexisting chromatin accessibility or DNA methylation and/or the availability of additional TFs and cofactors, such as ESRRB or NANOG8, 12, 13. Nevertheless, KLF4 also binds to chromatin regions that are inaccessible and highly methylated in somatic cells, which is in agreement with its documented ability to act as a pioneer factor9, 51, 52 and/or its cooperative binding with other reprogramming TFs8.
Studies utilizing 4C or HiC have offered important insights into topological reorganization during somatic cell reprogramming, but did not capture the dynamic assembly and disassembly of cell type-specific enhancer contacts15, 18, 21. HiChIP allowed us to generate reference maps of regulatory loops in MEFs and PSCs and revealed an extensive rewiring of enhancer connectomes during reprogramming. 4C-seq and HiC experiments validated the cell-type specific nature of HiChIP interactions, but also revealed technical biases and limitations for each approach, highlighting the need for a systematic comparison of different conformational assays and analytical tools.
We have uncovered a set of highly-connected enhancers, which communicate with strongly expressed cell-type specific genes, supporting the notion that high interactivity might be an inherent characteristic of regulatory elements critical for cell identity53, 54. In addition, we identified cell-type specific enhancers, including many SEs, which frequently interact with two or more coregulated genes, supporting a role for such hubs in coordinating target gene activation, as previously shown in different contexts55. Accordingly, deletion or inactivation of enhancer hubs resulted in coordinated downregulation of all connected genes without affecting neighboring non-hub genes. Recently developed technologies that capture multiway interactions56–59 will enable dissecting to what extent enhancer hubs represent multiple contacts occuring in the same cell and on the same allele.
Increasing evidence suggests that TFs mediate chromatin contacts in different cellular contexts (reviewed in60), although the underlying mechanisms and the relationship between TF binding and topological and transcriptional changes remain elusive. Encouraged by previous studies reporting potential architectural functions for KLF protein members18, 23, 24, we captured the dynamic chromatin reorganization around KLF4-binding sites during iPSC formation in a direct and genome-wide manner. This revealed that KLF4 binding is associated with de novo establishment of long-range enhancer contacts and promotes transcriptional upregulation of linked genes. KLF4 binding is not always sufficient for loop formation and gene activation, suggesting the requirement of additional architectural factors and coregulators. Our computational and proteomics analyses revealed distinct sets of candidate cofactors that may interact with KLF4 in the context of activating enhancer loops or repressive/poised loops, respectively. How do these proteins work together to form 3D chromatin contacts? Recruitment of architectural cofactors capable of tethering distal DNA elements is a plausible scenario, supported by the interaction between KLF4 and cohesin subunits43. Another possibility is that formation of topological assemblies, such as 3D enhancer hubs or polycomb bodies17, 47, 53, 58, 62, is the result of “self-organization” due to homotypic chromatin state or multiprotein condensation. KLF4 and validated cofactors, such as Mediator and BRD4, are charaterized by extensive intrinsically disordered regions (IDRs), which have been proposed to promote multivalent interactions and formation of subnuclear condensates63, 64.
Our study describes the functional role of KLF4 in the genome-wide organization and regulation of enhancer contacts, extending previous descriptions of the involvement of this factor in the maintenance of selected chromatin loops18, 22. In addition to global topological effects triggered by KLF protein depletion, we show that targeting KLF4 binding sites within specific enhancer hubs can be sufficient to disrupt enhancer-promoter contacts and induce transcriptional downregulation. Systematic functional interrogation of KLF4-bound enhancer hubs should enable a deeper understanding of the molecular mechanisms of topological organization and the establishment of new criteria for identification and functional prioritization of regulatory nodes critical for PSC identity.
Supplementary Material
ACKNOWLEDGEMENTS
We are grateful to Ari Melnick and members of the Apostolou, Tsirigos and Stadtfeld laboratories for critical reading of the manuscript. We also want to thank Zhengming Chen and the Biostatistics and Epidemiology Consulting Service for advice and final evaluation on the statistical tools and analyses and Luke Dow for sharing the CRISPR/Cas9 vectors. DCG was supported by the New York Stem Cell Foundation and the Family-Friendly Postdoctoral Initiative at Weill Cornell Medicine. AA is supported by a Medical Scientist Training Program grant from the National Institute of General Medical Sciences of the National Institutes of Health (NIH) under award number T32GM007739 to the Weill Cornell/Rockefeller/Sloan Kettering Tri-Institutional MD-PhD Program. A.T. is supported by the American Cancer Society (RSG-15–189-01-RMC), the Leukemia and Lymphoma Society and the St. Baldrick’s Foundation. EA is supported by the NIH Director’s New Innovator Award (DP2DA043813) and the Tri-Institutional Stem Cell Initiative by the Starr Foundation.
Footnotes
COMPETING FINANCIAL INTERESTS
The authors declare no competing financial interests.
REFERENCES
- 1.Young RA Control of the embryonic stem cell state. Cell 144, 940–954 (2011). [DOI] [PMC free article] [PubMed] [Google Scholar]
- 2.Natoli G Maintaining cell identity through global control of genomic organization. Immunity 33, 12–24 (2010). [DOI] [PubMed] [Google Scholar]
- 3.Graf T Historical origins of transdifferentiation and reprogramming. Cell Stem Cell 9, 504–516 (2011). [DOI] [PubMed] [Google Scholar]
- 4.Takahashi K & Yamanaka S Induction of pluripotent stem cells from mouse embryonic and adult fibroblast cultures by defined factors. Cell 126, 663–676 (2006). [DOI] [PubMed] [Google Scholar]
- 5.Apostolou E & Hochedlinger K Chromatin dynamics during cellular reprogramming. Nature 502, 462–471 (2013). [DOI] [PMC free article] [PubMed] [Google Scholar]
- 6.Apostolou E & Stadtfeld M Cellular trajectories and molecular mechanisms of iPSC reprogramming. Curr Opin Genet Dev 52, 77–85 (2018). [DOI] [PMC free article] [PubMed] [Google Scholar]
- 7.Di Giammartino DC & Apostolou E The Chromatin Signature of Pluripotency: Establishment and Maintenance. Curr Stem Cell Rep 2, 255–262 (2016). [DOI] [PMC free article] [PubMed] [Google Scholar]
- 8.Chronis C et al. Cooperative Binding of Transcription Factors Orchestrates Reprogramming. Cell 168, 442–459 e420 (2017). [DOI] [PMC free article] [PubMed] [Google Scholar]
- 9.Soufi A, Donahue G & Zaret KS Facilitators and impediments of the pluripotency reprogramming factors’ initial engagement with the genome. Cell 151, 994–1004 (2012). [DOI] [PMC free article] [PubMed] [Google Scholar]
- 10.Chen J et al. Hierarchical Oct4 Binding in Concert with Primed Epigenetic Rearrangements during Somatic Cell Reprogramming. Cell Rep 14, 1540–1554 (2016). [DOI] [PubMed] [Google Scholar]
- 11.Sridharan R et al. Role of the murine reprogramming factors in the induction of pluripotency. Cell 136, 364–377 (2009). [DOI] [PMC free article] [PubMed] [Google Scholar]
- 12.Knaupp AS et al. Transient and Permanent Reconfiguration of Chromatin and Transcription Factor Occupancy Drive Reprogramming. Cell Stem Cell 21, 834–845 e836 (2017). [DOI] [PubMed] [Google Scholar]
- 13.Li D et al. Chromatin Accessibility Dynamics during iPSC Reprogramming. Cell Stem Cell 21, 819–833 e816 (2017). [DOI] [PubMed] [Google Scholar]
- 14.Polo JM et al. A molecular roadmap of reprogramming somatic cells into iPS cells. Cell 151, 1617–1632 (2012). [DOI] [PMC free article] [PubMed] [Google Scholar]
- 15.Apostolou E et al. Genome-wide Chromatin Interactions of the Nanog Locus in Pluripotency, Differentiation, and Reprogramming. Cell stem cell 12, 699–712 (2013). [DOI] [PMC free article] [PubMed] [Google Scholar]
- 16.de Wit E et al. The pluripotent genome in three dimensions is shaped around pluripotency factors. Nature 501, 227–231 (2013). [DOI] [PubMed] [Google Scholar]
- 17.Denholtz M et al. Long-range chromatin contacts in embryonic stem cells reveal a role for pluripotency factors and polycomb proteins in genome organization. Cell Stem Cell 13, 602–616 (2013). [DOI] [PMC free article] [PubMed] [Google Scholar]
- 18.Wei Z et al. Klf4 Organizes Long-Range Chromosomal Interactions with the Oct4 Locus in Reprogramming and Pluripotency. Cell stem cell (2013). [DOI] [PubMed] [Google Scholar]
- 19.Krijger PH et al. Cell-of-Origin-Specific 3D Genome Structure Acquired during Somatic Cell Reprogramming. Cell Stem Cell 18, 597–610 (2016). [DOI] [PMC free article] [PubMed] [Google Scholar]
- 20.Beagan JA et al. Local Genome Topology Can Exhibit an Incompletely Rewired 3D-Folding State during Somatic Cell Reprogramming. Cell Stem Cell 18, 611–624 (2016). [DOI] [PMC free article] [PubMed] [Google Scholar]
- 21.Stadhouders R et al. Transcription factors orchestrate dynamic interplay between genome topology and gene regulation during cell reprogramming. Nat Genet (2018). [DOI] [PMC free article] [PubMed] [Google Scholar]
- 22.Rubin AJ et al. Lineage-specific dynamic and pre-established enhancer- promoter contacts cooperate in terminal differentiation. Nat Genet 49, 1522–1528 (2017). [DOI] [PMC free article] [PubMed] [Google Scholar]
- 23.Drissen R et al. The active spatial organization of the beta-globin locus requires the transcription factor EKLF. Genes Dev 18, 2485–2490 (2004). [DOI] [PMC free article] [PubMed] [Google Scholar]
- 24.Schoenfelder S et al. Preferential associations between co-regulated genes reveal a transcriptional interactome in erythroid cells. Nat Genet 42, 53–61 (2010). [DOI] [PMC free article] [PubMed] [Google Scholar]
- 25.Stadtfeld M, Maherali N, Borkent M & Hochedlinger K A reprogrammable mouse strain from gene-targeted embryonic stem cells. Nat Methods 7, 53–55 (2010). [DOI] [PMC free article] [PubMed] [Google Scholar]
- 26.Stadtfeld M et al. Ascorbic acid prevents loss of Dlk1-Dio3 imprinting and facilitates generation of all-iPS cell mice from terminally differentiated B cells. Nat Genet 44, 398–405, S391–392 (2012). [DOI] [PMC free article] [PubMed] [Google Scholar]
- 27.Stadtfeld M et al. Aberrant silencing of imprinted genes on chromosome 12qF1 in mouse induced pluripotent stem cells. Nature 465, 175–181 (2010). [DOI] [PMC free article] [PubMed] [Google Scholar]
- 28.Zunder ER, Lujan E, Goltsev Y, Wernig M & Nolan GP A continuous molecular roadmap to iPSC reprogramming through progression analysis of single-cell mass cytometry. Cell Stem Cell 16, 323–337 (2015). [DOI] [PMC free article] [PubMed] [Google Scholar]
- 29.Stadtfeld M, Maherali N, Breault DT & Hochedlinger K Defining molecular cornerstones during fibroblast to iPS cell reprogramming in mouse. Cell Stem Cell 2, 230–240 (2008). [DOI] [PMC free article] [PubMed] [Google Scholar]
- 30.McLean CY et al. GREAT improves functional interpretation of cis- regulatory regions. Nat Biotechnol 28, 495–501 (2010). [DOI] [PMC free article] [PubMed] [Google Scholar]
- 31.Guo L et al. Resolving Cell Fate Decisions during Somatic Cell Reprogramming by Single-Cell RNA-Seq. Mol Cell 73, 815–829 e817 (2019). [DOI] [PubMed] [Google Scholar]
- 32.Allison TF et al. Identification and Single-Cell Functional Characterization of an Endodermally Biased Pluripotent Substate in Human Embryonic Stem Cells. Stem Cell Reports 10, 1895–1907 (2018). [DOI] [PMC free article] [PubMed] [Google Scholar]
- 33.Schiebinger G et al. Optimal-Transport Analysis of Single-Cell Gene Expression Identifies Developmental Trajectories in Reprogramming. Cell 176, 928–943 e922 (2019). [DOI] [PMC free article] [PubMed] [Google Scholar]
- 34.Whyte WA et al. Master transcription factors and mediator establish super-enhancers at key cell identity genes. Cell 153, 307–319 (2013). [DOI] [PMC free article] [PubMed] [Google Scholar]
- 35.Dixon JR et al. Topological domains in mammalian genomes identified by analysis of chromatin interactions. Nature 485, 376–380 (2012). [DOI] [PMC free article] [PubMed] [Google Scholar]
- 36.Mumbach MR et al. HiChIP: efficient and sensitive analysis of protein- directed genome architecture. Nat Methods 13, 919–922 (2016). [DOI] [PMC free article] [PubMed] [Google Scholar]
- 37.Phanstiel DH, Boyle AP, Heidari N & Snyder MP Mango: a bias- correcting ChIA-PET analysis pipeline. Bioinformatics 31, 3092–3098 (2015). [DOI] [PMC free article] [PubMed] [Google Scholar]
- 38.Bonev B et al. Multiscale 3D Genome Rewiring during Mouse Neural Development. Cell 171, 557–572 e524 (2017). [DOI] [PMC free article] [PubMed] [Google Scholar]
- 39.Mumbach MR et al. Enhancer connectome in primary human cells identifies target genes of disease-associated DNA elements. Nat Genet 49, 1602–1612 (2017). [DOI] [PMC free article] [PubMed] [Google Scholar]
- 40.Weintraub AS et al. YY1 Is a Structural Regulator of Enhancer-Promoter Loops. Cell 171, 1573–1588 e1528 (2017). [DOI] [PMC free article] [PubMed] [Google Scholar]
- 41.Beagan JA et al. YY1 and CTCF orchestrate a 3D chromatin looping switch during early neural lineage commitment. Genome Res 27, 1139–1152 (2017). [DOI] [PMC free article] [PubMed] [Google Scholar]
- 42.Gomez-Diaz E & Corces VG Architectural proteins: regulators of 3D genome organization in cell fate. Trends Cell Biol 24, 703–711 (2014). [DOI] [PMC free article] [PubMed] [Google Scholar]
- 43.Dowen JM et al. Control of cell identity genes occurs in insulated neighborhoods in mammalian chromosomes. Cell 159, 374–387 (2014). [DOI] [PMC free article] [PubMed] [Google Scholar]
- 44.Novo CL et al. Long-Range Enhancer Interactions Are Prevalent in Mouse Embryonic Stem Cells and Are Reorganized upon Pluripotent State Transition. Cell Rep 22, 2615–2627 (2018). [DOI] [PMC free article] [PubMed] [Google Scholar]
- 45.Kearns NA et al. Functional annotation of native enhancers with a Cas9- histone demethylase fusion. Nat Methods 12, 401–403 (2015). [DOI] [PMC free article] [PubMed] [Google Scholar]
- 46.Larson MH et al. CRISPR interference (CRISPRi) for sequence-specific control of gene expression. Nat Protoc 8, 2180–2196 (2013). [DOI] [PMC free article] [PubMed] [Google Scholar]
- 47.Mas G & Di Croce L The role of Polycomb in stem cell genome architecture. Curr Opin Cell Biol 43, 87–95 (2016). [DOI] [PubMed] [Google Scholar]
- 48.Mohammed H et al. Rapid immunoprecipitation mass spectrometry of endogenous proteins (RIME) for analysis of chromatin complexes. Nat Protoc 11, 316–326 (2016). [DOI] [PubMed] [Google Scholar]
- 49.Jiang J et al. A core Klf circuitry regulates self-renewal of embryonic stem cells. Nat Cell Biol 10, 353–360 (2008). [DOI] [PubMed] [Google Scholar]
- 50.Zhang S et al. Epigenetic regulation of REX1 expression and chromatin binding specificity by HMGNs. Nucleic Acids Res (2019). [DOI] [PMC free article] [PubMed] [Google Scholar]
- 51.Soufi A et al. Pioneer transcription factors target partial DNA motifs on nucleosomes to initiate reprogramming. Cell 161, 555–568 (2015). [DOI] [PMC free article] [PubMed] [Google Scholar]
- 52.Sardina JL et al. Transcription Factors Drive Tet2-Mediated Enhancer Demethylation to Reprogram Cell Fate. Cell Stem Cell 23, 727–741 e729 (2018). [DOI] [PubMed] [Google Scholar]
- 53.Schmitt AD et al. A Compendium of Chromatin Contact Maps Reveals Spatially Active Regions in the Human Genome. Cell Rep 17, 2042–2059 (2016). [DOI] [PMC free article] [PubMed] [Google Scholar]
- 54.Huang J et al. Dissecting super-enhancer hierarchy based on chromatin interactions. Nat Commun 9, 943 (2018). [DOI] [PMC free article] [PubMed] [Google Scholar]
- 55.Fukaya T, Lim B & Levine M Enhancer Control of Transcriptional Bursting. Cell 166, 358–368 (2016). [DOI] [PMC free article] [PubMed] [Google Scholar]
- 56.Oudelaar AM et al. Single-allele chromatin interactions identify regulatory hubs in dynamic compartmentalized domains. Nat Genet 50, 1744–1751 (2018). [DOI] [PMC free article] [PubMed] [Google Scholar]
- 57.Zheng M et al. Multiplex chromatin interactions with single-molecule precision. Nature 566, 558–562 (2019). [DOI] [PMC free article] [PubMed] [Google Scholar]
- 58.Allahyar A et al. Enhancer hubs and loop collisions identified from singleallele topologies. Nat Genet 50, 1151–1160 (2018). [DOI] [PubMed] [Google Scholar]
- 59.Olivares-Chauvet P et al. Capturing pairwise and multi-way chromosomal conformations using chromosomal walks. Nature 540, 296–300 (2016). [DOI] [PubMed] [Google Scholar]
- 60.Stadhouders R, Filion GJ & Graf T Transcription factors and 3D genome conformation in cell-fate decisions. Nature 569, 345–354 (2019). [DOI] [PubMed] [Google Scholar]
- 61.Schoenfelder S et al. Polycomb repressive complex PRC1 spatially constrains the mouse embryonic stem cell genome. Nat Genet 47, 1179–1186 (2015). [DOI] [PMC free article] [PubMed] [Google Scholar]
- 62.Jiang T et al. Identification of multi-loci hubs from 4C-seq demonstrates the functional importance of simultaneous interactions. Nucleic Acids Res 44, 8714–8725 (2016). [DOI] [PMC free article] [PubMed] [Google Scholar]
- 63.Boija A et al. Transcription Factors Activate Genes through the Phase Separation Capacity of Their Activation Domains. Cell 175, 1842–1855 e1816 (2018). [DOI] [PMC free article] [PubMed] [Google Scholar]
- 64.Cho WK et al. Mediator and RNA polymerase II clusters associate in transcription-dependent condensates. Science 361, 412–415 (2018). [DOI] [PMC free article] [PubMed] [Google Scholar]
Associated Data
This section collects any data citations, data availability statements, or supplementary materials included in this article.