

Abstract
Traumatic brain injury (TBI) can occur across wide segments of the population, presenting in a heterogeneous manner that makes diagnosis inconsistent and management challenging. Biomarkers offer the potential to objectively identify injury status, severity, and phenotype by measuring the relative concentrations of endogenous molecules in readily accessible biofluids. Through a data-driven, discovery approach, novel biomarker candidates for TBI were identified in the serum lipidome of adult male Sprague–Dawley rats in the first week following moderate controlled cortical impact (CCI). Serum samples were analyzed in positive and negative modes by ultraperformance liquid chromatography–mass spectrometry (UPLC–MS). A predictive panel for the classification of injured and uninjured sera samples, consisting of 26 dysregulated species belonging to a variety of lipid classes, was developed with a cross-validated accuracy of 85.3% using omniClassifier software to optimize feature selection. Polyunsaturated fatty acids (PUFAs) and PUFA-containing diacylglycerols were found to be upregulated in sera from injured rats, while changes in sphingolipids and other membrane phospholipids were also observed, many of which map to known secondary injury pathways. Overall, the identified biomarker panel offers viable molecular candidates representing lipids that may readily cross the blood–brain barrier (BBB) and aid in the understanding of TBI pathophysiology.
Keywords: biomarkers, traumatic brain injury, lipidomics, mass spectrometry, animal model
INTRODUCTION
Heightened awareness of traumatic brain injury (TBI) in the military, athletics, and the general public has led to increased efforts toward the development of objective diagnostic measures and clinically relevant treatment options. The Centers for Disease Control estimate that TBI is the primary cause of over 50 000 deaths and 300 000 hospitalizations in the United States annually.1 Many more injuries remain misdiagnosed, undetected, or unreported.2,3 Typical clinical assessment tools such as the Glasgow Coma Scale, radiologic imaging, and symptoms reporting are limited and do not capture the heterogeneous physiologic and neurochemical response, making TBI diagnosis and treatment a challenge.4
Biomarkers offer the potential to both sensitively and specifically identify the severity and phenotype of TBI, track pathology and metabolic state, and aid in mechanistically based treatment decisions. The vast majority of proposed TBI biomarkers are astroglial and neuronal proteins, such as GFAP, S100β, UCH-L1 and Tau/P-tau,5,6 that may not readily cross the blood brain barrier (BBB), although the recently discovered glymphatic system may partially explain their brainto-blood transport.7,8 While some of these proteins have been useful in the diagnosis of severe TBI, they have not yet been shown to be sensitive enough to consistently detect TBI across a range of severities.9 Furthermore, while the BBB is disrupted in severe TBI, it is not as permeable in milder injuries, which perhaps partially explains why many biomarkers of severe brain injury do not translate well to mTBI diagnostics.10,11 Small molecule metabolites may permeate the BBB, though acute changes in tissue metabolite content are significantly more detectable than are alterations in plasma.12 Blood lipid levels are expected to reflect brain pathophysiology, given the close proximity of the cerebrospinal fluid (CSF) and brain, the lipophilic nature of the endothelial cells comprising the BBB, the ease of transport of small lipids, and the similarity of lipid content in the CSF and extracellular fluids.13,14 Lipids are therefore more likely to translate to clinically successful TBI biomarkers than are proteins, especially in readily accessible biofluids such as blood or urine. Exploration of lipid metabolites as potential biomarkers of TBI is still in its infancy compared to protein-based markers, yet it holds promise given the high lipid content of the brain and its vulnerability to oxidative lipid damage.15–17 The dysregulation of lipids after TBI is well documented,18–22 and identification of altered lipids in the serum may reveal novel biomarker candidates.15,23 Elevated levels of polyunsaturated fatty acids (PUFAs) and redox transition metals as well as the high rate of oxygen consumption in the brain make it highly vulnerable to free radical attack.24 Free radical mediated damage from reactive oxygen species (ROS) and reactive nitrogen species (RNS) is initiated acutely following the primary insult but can persist in the hours and days following injury, overwhelming antioxidant defenses, and mediating damage to vital cell structures such as membranes and mitochondria.25,26 The study of volatile urinary metabolites also offers promise for the detection of inflammatory processes resulting from neurological disorders such as TBI.27
While biomarkers necessary for the diagnosis of TBI should exhibit rapid changes in biofluids following injury, fluid biomarkers also have the potential to minimally invasively probe the evolution of injury manifestation as well as monitor recovery and treatment interventions. Many molecular effectors associated with apoptosis, microgliosis, demyelination, and neuroregeneration are not detectable within hours of injury.28 In fact, biomarkers that indicate secondary injury cascades may take days or weeks to reach their maxima, highlighting the need for ongoing detection.4 For example, cellular and mitochondrial levels of lipid peroxidation mediated oxidative damage do not peak until 3 days postinjury.29 Thus, a careful study of the metabolic response to brain injury over the first week following injury has the potential to aid in the discovery of biomarkers that can predict disease state and outcome. Given the heterogeneity of TBI, no single biomarker is likely to be predictive of all mechanisms of damage. Similarly, separate biomarkers or biomarker panels may be required to accurately reflect the acute, postacute, and chronic recovery periods, as different cellular mechanisms will be activated across the entire time course of injury.
A variety of mechanisms of cellular dysfunction are associated with brain injury including the onset of lipid peroxidation mediated damage. Free radicals react with esterified PUFAs including arachidonic acid (AA), docosapentaenoic acid (DPA), and docosahexaenoic acid (DHA) to induce lipid peroxidation, which leads to irreversible damage to neuronal lipid membranes.30 Milder injuries involve little to no cell death; therefore, measures of sublethal damage, such as the oxidation of membrane lipids, may be able to gauge injury across all severities, independent of BBB permeability.31
Many existing studies into lipid biomarkers have utilized targeted profiling of a handful of specific lipids, which has the disadvantage of being biased toward known pathways but not necessarily revealing the optimum biomarker candidates that can be found with discovery-type approaches.32 A highcoverage survey of the lipid profile changes associated with TBI can thus help to guide biomarker discovery and identification while providing additional mechanistic understanding of the role of specific lipid-related molecular effectors in TBI pathophysiology. Therefore, the objective of this study was to determine which lipids, or classes of lipids, are dysregulated following moderate TBI in rats using a highcoverage lipidomics approach, ultimately selecting an optimized panel of lipid biomarkers that has the potential to objectively differentiate injured from uninjured Sprague–Dawley rats, which often serve as a suitable preclinical model for human disease.33 Currently there are no FDA approved biomarkers for the diagnosis of TBI, but consideration for the inclusion of lipids in the development of biomarker panels may aid in translation to clinical success.28
METHODS AND MATERIALS
Injury and Blood Sampling
All procedures involving animals were performed according to the guidelines set forth in the Guide for the Care and Use of Laboratory Animals (U.S. Department of Health and Human Services, Pub no. 85–23, 1985) and were approved by the Georgia Institute of Technology Institutional Animal Care and Use Committee (protocol #A15013). The study was not preregistered. Male Sprague–Dawley rats (8 weeks old; Charles River) were kept on a 12-h light–dark cycle, and food and water were available ad libitum. Thirty-four animals weighing 300–400 g were randomly assigned to the following groups using a computer based randomization algorithm: (1) naive (n = 10), (2) sham-operated (n = 8; n = 4, 3 days postsurgery; n = 4, 7 days postsurgery), and (3) controlled cortical TBI (TBI, n = 16; n = 7, 3 days postinjury; n = 9, 7 days postinjury). Shamoperated animals were employed to ensure that the stress of surgery did not play a role in sample classification based on lipid profiles, while naive samples were taken from a subset of animals prior to sham or TBI procedures.
Unilateral contusions of the lateral frontoparietal cortex were created using a controlled cortical impact (CCI) device (Pittsburgh Precision Instruments, Pittsburgh, PA) following published procedures.34,35 Rats were anesthetized (induction, 5% isoflurane; maintenance 2–3% isoflurane), mounted in a stereotaxic frame and a 6 mm craniectomy was made over the left frontoparietal cortex (center: −3.0 mm AP, + 2.0 mm ML from bregma). A pneumatic piston (tip diameter = 5 mm; positioned 15 degrees from vertical in the coronal plane) impacted the cortical tissue to a depth of 2 mm (velocity = 4 m/s, duration = 200 ms), values consistent with a moderate TBI insult.36 Following the injury, the wound cavity was thoroughly cleaned and all bleeding stopped before a layer of 2% SeaKem agarose (Lonza, MD) was applied to the injury site and the scalp sutured.37,38 The bone flap was not replaced as per standard CCI protocols.35 Animals received sustained release buprenorphine (1 mg kg−1) and were placed on a heating pad during recovery, at which time they were returned to their home cage and singly housed. Sham-operated animals were subjected to the same procedures described above, but did not receive an impact, while naive animals were not subjected to surgical procedures.
The serum lipidome of rats was analyzed at 3 and 7 days following moderate CCI injury to identify potential biomarker candidates. During the afternoon, approximately 200 μL of whole blood was collected from a tail vein punctured by 20gauge Precision Glide needles (Beckton Dickinson) and stored on ice. Whole blood samples were allowed to coagulate at room temperature for 45 min, and all sample collection followed literature guidelines for limiting the potential for hemolysis.39,40 Samples were then centrifuged at 4 °C for 15 min at 2500g, and serum was collected in 50 μL aliquots and stored at −80 °C.
Sample Preparation
Prior to analysis, lipids and small nonpolar metabolites were separated from proteins in blood using isopropyl alcohol (IPA) for protein precipitation, shown to be advantageous over the Folch or Bligh and Dyer methods for a variety of experimental considerations.41–44 For protein precipitation purposes, serum samples were thawed on ice for 1 h and serum was mixed 1:3 v/v with IPA. Samples were centrifuged at 16 000g for 7 min, and the supernatant was collected. Samples were stored at −80 °C until analysis. Liquid chromatography–mass spectrometry (LC–MS) analysis following IPA extraction confirmed excellent coverage of various lipid families (Figure S1).
UPLC–MS Analysis
A Waters Acquity ultraperformance liquid chromatography (UPLC) quaternary solvent manager system was employed for chromatographic separations. Both ionization modes utilized identical mobile phases, though different chromatographic gradients were employed (Table S1a). Mobile phase A was water/acetonitrile (40:60) and mobile phase B was 10% acetonitrile in IPA. Both mobile phases included 10 mM ammonium formate (Sigma-Aldrich, > 99.995%) and 0.1% formic acid (Fluka Analytical) additives to improve peak shape and ionization efficiency. All solvents used were of LC–MS grade and provided by Sigma-Aldrich (IPA) or J.T. Baker (acetonitrile). The column used was an ACQUITY UPLC BEH C18 1.7 μm, 2.1 × 50 mm2, operated at 60 °C, while samples were maintained at 5 °C throughout the analysis. Injection volumes of 5 and 10 μL were used in positive and negative ion modes, respectively. Run order was randomized, and samples were acquired in duplicate. A Waters Xevo G2 QTOF mass spectrometer with an electrospray ionization source was used for metabolomics analysis of all samples. MS parameters are provided in the Supporting Information (Table S1b). The mass spectrometer was calibrated with a sodium formate solution, and data were acquired in the 50–1200 Da range with leucine enkephalin used for lock mass correction. Data are available online at https://chorusproject.org/anonymous/download/experiment/-3567265606761364215 and at http://dev.metabolomicsworkbench.org:22222/data/DRCCMetadata.php?Mode=Study&StudyID=ST000920.
Most tandem MS experiments were performed in the Xevo G2 QTOF mass spectrometer (4 different collision energies, ranging from 10 to 40 V). For low abundance markers that required higher sensitivity, tandem MS experiments were performed in a Q-Exactive (QE) HF Orbitrap mass spectrometer (Thermo Fischer Scientific) at a normalized collision energy (NCE) setting of 10, 30, and 50, and combined into a single spectrum by the instrument software. Table S2 details the specific instrument used to acquire the MS/MS data for each respective lipid as well as the annotation of each species. Spectral interpretation of lipid fragmentation patterns was performed either manually or by comparison to entries in the Lipid Maps, Metlin, and HMDB databases.45–47 The Lipid Maps MS/MS prediction tool for glycerophospholipids was also used for the assignment of fragment ion species.
Sample Size Calculation
Minimum sample size to achieve statistical significance was determined by a priori power analysis using G*Power 3.1 statistical software.48 For each metabolomic feature, Cohen’s effect size (d) was estimated at d = 1 using pilot data, which produced the desired statistical power (1-β = 0.80) and error probability (α = 0.05) with a sample size of n = 34.
Data Mining
Chromatographic alignment, deisotoping, deconvolution, normalization, and peak picking were accomplished using Progenesis QI software. Sets of 1669 and 619 spectral features, defined as unique pairs of retention time (RT) and exact mass to charge ratios (m/z), were obtained for positive and negative ion modes, respectively. Filters were applied to remove peaks detected as background contaminants and peaks in which the instrumental variation, or the coefficient of variation measured (CVm), approached biological variability (CVb) through the use of solvent blanks and quality control pooled samples. Any features detected above the noise threshold in solvent blank runs or with high CVm in pooled quality control runs were removed from the data sets. Features detected in fewer than 75% of samples in TBI and control groups were also removed prior to binary classification. The remaining 727 feature abundances (413 positive and 314 negative mode) were exported as a single matrix combining both ionization modes to omniClassifier for multivariate analysis.
Feature Selection and Classification
Postprocessed feature abundances were log2 normalized to create an approximately Gaussian distribution prior to binary classification. OmniClassifier was utilized to develop an initial model to predict TBI based on lipidomics data.49 As a first approximation to model the data, sham-operated and naivë animals were collectively grouped as “controls” in a single class, while 3- and 7-day postinjury time-points were labeled as “TBI”. This was done to increase the total number of samples in each class, prevent overfitting, and increase model statistical significance. Using nested cross-validation, prediction models were optimized using four different classifiers bundled within omniClassifier: Bayesian, K-nearest neighbors (KNN), logistic regression, and support vector machines (SVM). Ten iterations of three-fold nested cross-validation were applied to the training data to estimate prediction performance, which resulted in 4 × 10 × 3 = 120 total tested models. Subsequently, non-nested cross-validation was applied to the training data to optimize a final prediction model. Blinding was utilized in the data analysis cross-validation stage, where a subset of samples was removed from the training set, blinded, and predicted for each tested model.
A single iteration of nested cross-validation produced three prediction performance values, which were averaged into a single performance quantity. This entire process was repeated for ten iterations, resulting in ten averaged cross-validation performance quantities. After nested cross-validation, a final prediction model was chosen. When choosing a final prediction model, the same cross-validation optimization procedure as previously used in the nested cross-validation step was chosen, but applied to the entire training data set. Subsequently, the final model parameters were used to select features and train the classifier.
Each classifier was optimized over several parameters. Bayesian classifiers included nearest centroid, diagonal linear discriminant analysis, spherical discriminant, and uncorrelated discriminate classifiers.50 KNN classifiers were optimized over ten values of K (K = 1–10). The linear SVM was optimized over ten cost values (i.e., 1 to 10). Feature selection was accomplished using the minimum redundancy, maximum relevance (mRMR) method, choosing optimal feature sizes from within the range of 1 to 100.51 The mRMR feature selection method identified an optimal set of features that minimized the correlation among features while maximizing mutual information between features and class labels. Following omniClassifier analysis, more granular models were created using orthogonal partial least-squares-discriminant analysis (oPLS-DA) for each of sham-operated or naive versus TBI samples (MATLAB, R2015a, The MathWorks, Natick, MA with PLS-Toolbox, version 8.0, eigenvector Research, Inc., Manson, WA) with Venetian blinds cross-validation.52,53 Prior to oPLS-DA, features were autoscaled. Abundances of features with significant changes (TBI vs control) were analyzed at 3 and 7 days postinjury using a one-way analysis of variance (ANOVA) with p < 0.05 considered significant.
RESULTS
Overall, 2288 features that were above background were detected and further reduced to 727 based on frequency criteria. Principal component analysis (PCA) investigation of this data set (Figure 1A) showed that pooled samples grouped together and accurately represented the average composition of both TBI and noninjury (naive + sham-operated) analyzed. Initially, each sample was projected into linear space so that the relationship across all variables could be visualized in two dimensions. However, the lack of distinct clustering in the PCA scores plot revealed that accurate discrimination of TBI would require the selection of metabolic features that directly reflected TBI pathophysiology using supervised classification approaches. We initially combined the injured groups to use robust binary classification schemes to find potential lipids that could distinguish injured from noninjured rats. Using untargeted lipidomics approaches, we examined features that were able to distinguish TBI samples from controls. This feature set was then processed using a total of 120 multivariate omniClassifier models of controls (sham-operated + naivë) versus TBI by testing a combination of various classifiers and comparing inner and outer cross-validation values. In all cases, inner cross-validation area under the curve (AUC) values matched outer cross-validation values, indicating lack of overfitting (Figure S2). Recursive selection within the 727feature set simplified these classification models by reducing data dimensionality while preserving only features that resulted in high sensitivity and specificity. Table 1 shows the performance of the best models produced by each of the four classifiers tested. All four models performed similarly well, with the number of features utilized ranging from 9 to 31 and AUC values ranging from 0.80 to 0.84 under cross-validation. As expected, AUC performance on the whole data set approached unity for these four best models, but the cross-validated AUC values were chosen as more representative of a scenario in which unknowns would be predicted. Interestingly, the smallest set of nine features selected by the optimized Bayesian classifier using mRMR feature selection was conserved across all classifiers, lending support for the underlying biological basis of this multivariate classification. The optimized KNN classification model, containing 31 metabolite features, was selected for chemical annotation of the features so as not to ignore any useful TBI biomarker that might reflect unique network level alterations. Of those 31 features, five eluted with the chromatographic solvent front, where measured ion intensities are unreliable due to suppression effects.54 As their removal from the multivariate model did not result in a significant decrease in AUC, these features were excluded from further consideration. Following establishment of a subset of distinguishing features, we identified the molecules and examined abundance at each of the postinjury time points.
Figure 1.
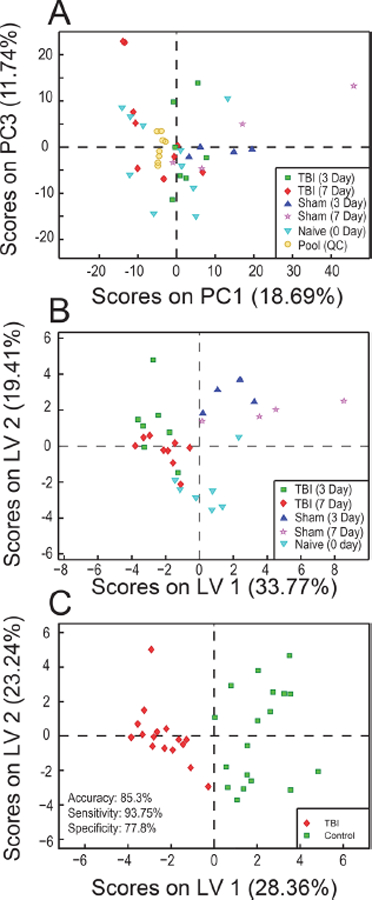
(A) Principal component analysis (PCA) scores plot for the subset of 314 negative mode features obtained following filtering and prior to feature selection across each class. The distribution of samples in this plot reveals no clustering among samples. Pooled quality control samples, represented by yellow circles, clustered toward the center of the plot, indicating they are an accurate representation of the average sample analyzed. (B) Orthogonalized Partial Least Squares Discriminant Analysis scores plot depicting clustering of samples separated into five classes by day of sample collection and injury status using the 26-feature model. Variance between classes is captured across the X-axis. (C) Orthogonalized Partial Least Squares Discriminant Analysis scores plot depicting clustering of samples separated into a binary model.
Table 1.
Classifier Performance and Selected Features Used for Optimized Models Built with omniClassifier
| classifier | feature selection method | number of features | cross-validation estimate, AUC (SD) | performance on whole data set, AUC | features selected (using 1:727 index) |
|---|---|---|---|---|---|
| Bayesian | mRMR, difference | 9 | 0.8019 (0.0618) | 0.9653 | 24, 61, 140, 184, 271, 272, 377, 479, 665 |
| KNN (K = 10) | mRMR, difference | 31 | 0.8268 (0.0646) | 0.9774 | 24, 41, 58, 61, 64, 103, 118, 128, 129, 140, 184, 185, 233, 245, 271, 272, 277, 289, 292, 314, 357, 377, 409, 479, 656, 665, 680, 698, 699, 702, 719 |
| Logistic Regression | mRMR, difference | 17 | 0.8348 (0.0478) | 1.0000 | 24, 41, 58, 61, 64, 140, 184, 245, 271, 272, 314, 377, 479, 656, 665, 699, 719 |
| Linear SVM (Cost = 4) | mRMR, difference | 20 | 0.8404 (0.045) | 1.0000 | 24, 41, 58, 61, 64, 118, 140, 184, 245, 271, 272, 314, 377, 409, 479, 656, 665, 680, 699, 719 |
Figure 1B depicts an oPLS-DA scores plot for the optimized 26-feature lipid panel with all sample classes treated individually. Here, it becomes clear that the samples can be roughly split into two classes, with negative scores on latent variable (LV) 1 generally corresponding to TBI samples and positive scores being more representative of controls, irrespective of day of collection. In a binary representation of the data, differences between sham-operated and naive versus TBI were also modeled using oPLS-DA and leave-oneout cross-validation (Figure 1C). Control samples separated from injured samples with no significant overlap, again with negative scores (TBI) and positive scores (control) on LV1. The sensitivity, specificity, and overall accuracy were 93.7%, 77.8%, and 85.3%, respectively. More detailed binary comparisons (sham-operated vs TBI, naive vs TBI, all vs TBI) were also performed using the same panel of 26 metabolites and oPLS-DA, a standard multivariate classification tool (Figure 2). The classification accuracy in all cases exceeded 90%, with a sensitivity of 93.8% and specificity of 87.5–100%. These results indicated that lipid alterations observed in the 26feature panel can be attributed solely to TBI and were not a consequence of the surgical procedure.
Figure 2.
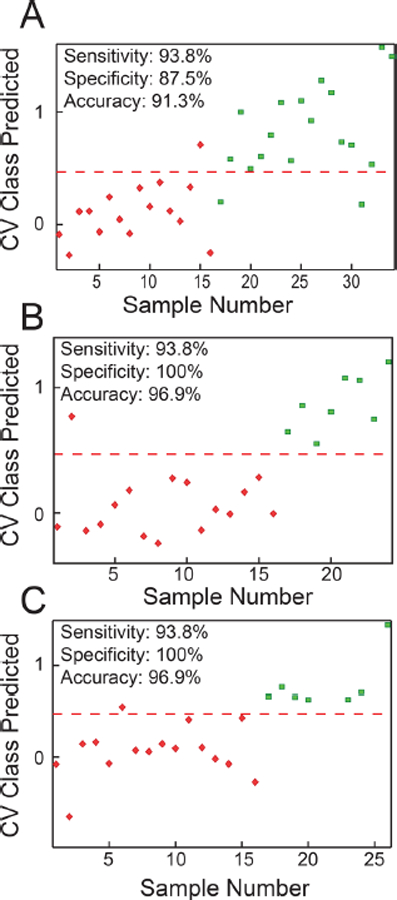
oPLS-DA cross validated (CV) class prediction plots based on the optimized 26 feature panel comparing (A) sham + naive controls versus TBI, (B) sham versus TBI, and (C) naive versus TBI samples. For all plots, TBI samples are represented by red diamonds and correspond to a predicted class value of 0, while the various control samples are represented by green squares and correspond to a predicted value of 1. Accuracy, sensitivity, and specificity values are given for each model. The red dashed line represents a decision boundary between classes. The oPLS-DA model details were as follows: (A) 34 samples, venetian blinds CV, five splits, three latent variables (LVs); (B) 24 samples, venetian blinds CV, four splits, two LVs; (C) 26 samples, venetian blinds CV, five splits, two LVs.
With an average mass error of 1.4 ppm, the elemental formulas and head groups were determined for all but two lipids, and all species were annotated where possible. Table 2 details the identity of the lipids included in the 26-feature panel determined by both high-resolution MS and MS/MS experiments, while Table S2 provides the level of confidence obtained for each identification. Two of the 26 species in the panel likely corresponded to a mixture of at least two lipids, which coeluted in the UPLC dimension and were isobaric in the MS dimension, therefore being unavoidably coisolated for MS/MS experiments. Distinction of these species was beyond the scope of this study and would require an additional dimension or either liquid-phase or gas-phase separation such as ion mobility.55,56 Table 2 also depicts p-values and abundance fold changes for each species. Positive fold change values correspond to species with increased abundance in injured samples, while negative values indicate higher abundance in controls. When considered univariately, 15 of the 26 lipid species showed p-values at or below 0.05 (p-value range = 0.000354–0.0156) for a binary comparison between controls and TBI, though it must be taken into account that the panel as a whole was utilized for classification purposes, so the fold change of an individual lipid species is less significant when alterations are investigated at a systems level. Of these 15 lipid species, 13 remained statistically significant when naive were removed from the control class for p-value calculations, further verifying that the lipidome alterations observed were due to injury and not to surgery. Ionization efficiency varies widely between lipid classes, so only abundances of lipids belonging to the same class can be compared directly.57 Calculation of absolute abundance values for each lipid was beyond the scope of this study, as it requires extraction of serum samples with all relevant internal standards.58 This must therefore be performed prior to analysis and is better suited to targeted biomarker studies, which can be guided by our untargeted discovery analysis.59
Table 2.
Annotation of Lipids in 26-Feature Panel. Retention Time, Observed Exact Mass with Xevo Instrument (error), Observed Adduct, Predicted Elemental Formulae, p-value of Average Abundances Between Controls and TBI (p-value of Abundances Between Sham and TBI), and Fold Change (FC) Included. Positive FC Values Correspond to Species with Increased Abundance in Injured Animals, while Negative Values Indicate Higher Concentrations in Controls. Fatty Acid Chain Information was Included Only When MS/MS Experiments were Possible, which Required a Minimum Precursor Ion Abundance and No Chemical Overlaps with Other Species. SN1/SN2 Stereochemistry was Not Determined. For Those Unidentified Species, Please Refer to Table S2 for Additional Information on the Identity of Detected Fragments. Abbreviations: PE, phosphatidylethanolamine; PC, phosphatidylcholine; Cer, ceramide; DG, diacylglycerol; SM, sphingomyelin; PS, phosphatidylserine; PUA, polyunsaturated aldehyde; FFA, free fatty acid.
| feature number | RT (min) | m/z mass error (ppm) | adduct | elemental formula | ID | p-value (p-value sham vs TBI) | FC |
|---|---|---|---|---|---|---|---|
| 24 | 9.86 | 738.5081 027 |
[M-H]− | C4,H74NO8P | PE(20:4_16:0) | 0.236 0.619 |
−1.58 |
| 41 | 5.38 | 303.2323 −231 |
[M-H]− | C20H32O2 | arachidonic acid (AA) | 0.0138 0.0134 |
1.35 |
| 58 | 11.32 | 666.6038 −0.60 |
[M+HCO2]− | C40H79NO3 | Cer(dl8:l_22:0)) | 0.252 0.000168 |
−1.11 |
| 61 | 7.21 | 465.3035 −1.93 |
[M-H]− | C27H46O4S | Cholesterol sulfate (CS) | 0.00231 0.000971 |
−1.20 |
| 64 | 10.61 | 858.6225 −0.58 |
[M+HCO2]− | C46H88NO8P | PC(20:2_18:0) | 0.00280 0.380 |
−1.21 |
| 103 | 10.12 | 778.5594 −1.28 |
[M+HCO2]− | C40H80NO8P | PC(l6:0)_l6:0)) | 0.0606 0.0639 |
−1.50 |
| 118 | 10.35 | 742.5386 −0.81 −0.13 |
[M-H]− [M-CH3]− |
C41H78NO8P C42H80NO8P |
PE(18:2_18:0) PC(l8:2_l6:0)) |
0.250 0.0763 |
−1.17 |
| 128 | 10.35 | 711.5221 −0.70 |
[M+HCO2]− | C43H70O5 | DG(22:6_18:1) | 0.00169 6.92 × 10⁻⁵ |
2.23 |
| 129 | 10.37 | 818.5912 −0.57 |
[M+HCO2]− | C43H84NO8p | not identified | 0.0544 0.147 |
−1.18 |
| 245 | 0.54 | 262.8846 | not identified | not identified | not identified | 0.00449 0.0235 |
2.88 |
| 271 | 10.02 | 709.5041 −1.13 |
[M+HCO2]− | C43H68O5 | DG(22:6_18:2) | 0.000354 7.54 × 10⁻⁶ |
2.49 |
| 272 | 5.91 | 329.2483 −0.91 |
[M-H]− | C22H34O2 | docosapentaenoic acid (DPA) | 0.00405 0.0001 |
2.59 |
| 277 | 10.47 | 687.5197 −1.16 |
[M+HCO2]− | C41H70O5 | DG(20:4_18:1) | 0.00156 0.0057 |
2.61 |
| 289 | 5.02 | 283.2642 −0.35 |
[M-H]− | C18H36O2 | FFA(18:0) | 0.0153 0.000241 |
3.02 |
| 292 | 0.53 | 297.0985 | not identified | not identified | not identified | 0.0552 0.153 |
−10.8 |
| 314 | 1.48 | 295.2274 0.27 |
[M-H]− | C18H32O3 | FFA(18:2 + 1 O)c | 0.0560 0.0071 |
−2.55 |
| 357 | 9.35 | 813.617 6.64 |
[M+NH4]+ | C45H82NO8P | PE(18:0)_22:4) | 0.00835 0.387 |
−1.28 |
| 377 | 10.29 | 785.656 3.69 |
[M+H]+ | C45H89N2O6P | SM(d18:1/22:1) | 0.00241 0.000247 |
−1.37 |
| 409 | 1.32 | 548.3713 0.36 |
[M+H]+ | C28H54NO7P | LysoPC(20:2) | 0.549 0.00147 |
−1.08 |
| 479 | 0.44 | 784.4746 −1.66 |
[M+H]+ | C42H74NO10P | PS(16:0_20:4) | 0.159 0.155 |
1.21 |
| 656 | 9.78 | 684.558 2.78 |
[M+NH4]+ | C43H70O5 | DG(22:6_18:1) | 0.00104 0.000213 |
2.67 |
| 665 | 10.93 | 746.5693 −0.13 |
[M+H]+ | C41H80NO8P | not identified | 0.219 0.0492 |
−1.38 |
| 680 | 8.57 | 682.5402 −0.44 |
[M+NH4]+ | C43H68O5 | DG(22:6_18:2) | 0.000489 0.000125 |
2.60 |
| 698 | 7.14 | 822.60 −0.85 |
[M+H]+ | C47H84NO8P | Not identified | 0.370 0.0161 |
−1.36 |
| 699 | 0.92 | 582.3147 −0.17 |
[M+2Na−H]+ | C26H52NO8P | LysoPC(l8:2 + 1 O) | 0.0144 0.0076 |
1.65 |
| 719 | 10.86 | 840.6465 −1.43 |
[M+H]+ | C48H90NO8P | PC(l8:2_22:l) | 0.0103 0.426 |
−2.65 |
Among the lipids identified as potential TBI biomarkers, PUFAs and PUFA-esterified DGs were found to increase in TBI samples. Also, a decrease in SM(d18:1_22:1) was observed in the TBI group, which was accompanied by a corresponding decrease in a related ceramide- Cer(d18:1_22:0). Injuryspecific changes in abundance were also found for a variety of other membrane lipids (e.g., PCs, PEs, and a PSs) as well as for cholesterol sulfate (CS). The PE membrane lipid containing esterified arachidonic acid PE(20:4_16:0) was more abundant in controls, while the relative abundance of PS(20:4_16:0) was slightly increased following TBI. Additionally, all PCs identified by the 26-feature model were of lower relative abundance in TBI samples, while the lysoPC species observed showed an increase following injury.
In addition to the 26-lipid panel described in Table 2, other lipids were frequently selected by the 120 multivariate models built using omniClassifier, but were not part of the optimum panels highlighted in Table 1. Figure S3 details the topmost 30 features in the 120 unique individual multivariate models based on their frequency of selection, which was related to the feature’s ability to discriminate between classes. Only seven features (#30, 34, 35, 227, 311, 475, and 701) were not covered in the 26-feature panel discussed above. Box plots and chemical annotations for the most significant additional features are shown in Figure S4. These were identified by both MS and MS/MS as eicosapentaenoic acid (EPA), docosahexaenoic acid (DHA), lysoPE(20:4), PE(32:0), and PC(40:4).
To visualize the entire set of relevant features simultaneously, a volcano plot was used to represent changes in individual species. Figure 3 provides a broad overview of the most salient lipidome alterations following TBI as a function of p-value and fold change. Boundaries are drawn to illustrate features with fold change absolute values > 2 and p < 0.05. Features in the upper left and upper right regions satisfy both of these requirements and are most likely to be good candidate biomarkers of TBI if a single species was more desirable, although it is known that biomarker panels are more robust than assays based on single species.60,61 The lipids contained in the 26-feature model are indicated by red circles, with 9 of the 15 individually significant features contained in those volcano plot regions. Additionally, most of the frequently selected features not in the panel, represented by blue X’s in the plot, fell above the significance boundary, further validating the feature selection method. As shown, not all the selected features were significant or near significant individually; however, when combined into a multivariate panel, all species were critical to the accuracy of the classification.
Figure 3.
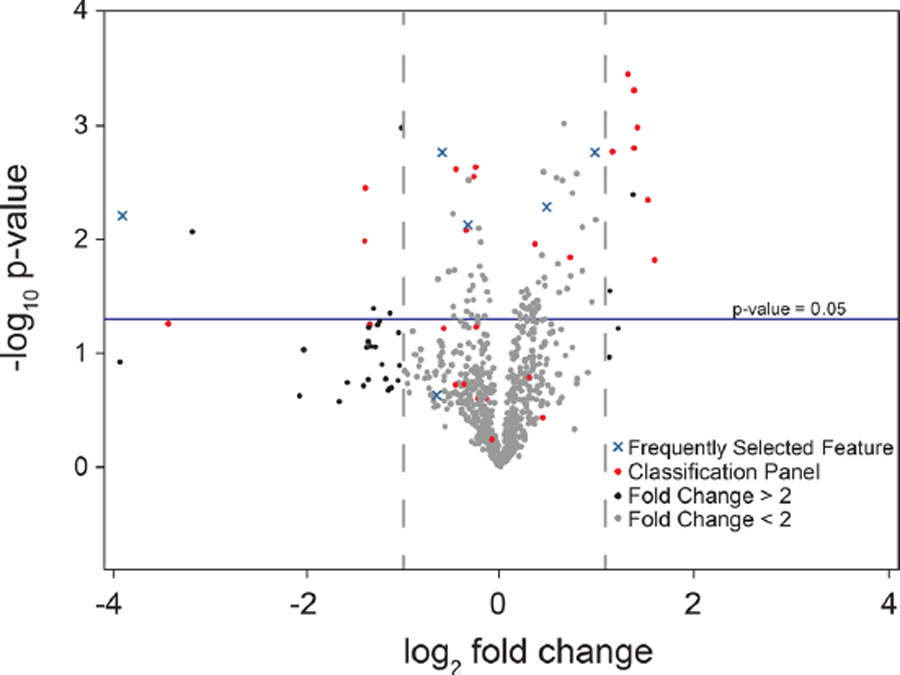
Volcano plot of processed metabolomic data set. Each point represents one feature. Features with fold change < 2 are colored in gray. Features in optimized classification panel are colored in red. Features frequently selected to build models but not in final classification panel are colored in blue. Positive fold change values correspond to increased abundance in TBI samples.
Box plots describing these trends in dysregulation and normalized relative abundances for a variety of lipid species from the classification panel are shown in Figure 4. As observed in panels A1–A3, free fatty acid concentrations (18:0, 20:4, and 22:5) were all significantly elevated in TBI samples. The same trend held for DGs, DG(20:4_18:1) and DG(22:6_18:2), as shown in panels A5 and A6. Panels B1–B3 illustrate decreases in abundance for CS as well for SM and PC species, SM(d18:1_22:1) and PC(20:2_20:0).
Figure 4.
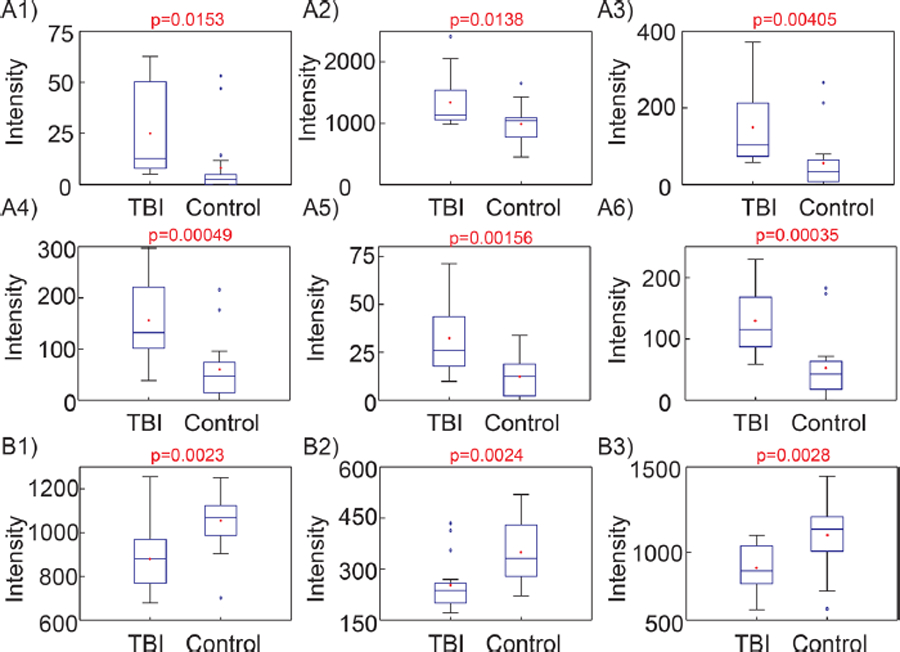
Example box plots showing significantly dysregulated species used by optimized model for classification of samples. A1–A6 show upregulated species and B1–B3 show downregulated species following injury. (A1) FFA 18:0, [M-H]− = 283.2644; (A2) arachidonic acid, [M-H]− = 303.2330; (A3) docosapentaenoic acid, [M-H]− = 329.2483; (A4) m/z = 262.8846; (A5) DG(20:4_18:1), [M+HCO2]− = 687.5197; (A6) DG(40:8), [M+HCO2]− = 709.5041; (B1) cholesterol sulfate, [M-H]− = 465.3035; (B2) SM(d18:1_22:1), [M+H]+ = 785.656; (B3) PC(20:2_20:0), [M+HCO2]− = 858.6225.
Altered lipids were subdivided into groups by describing their trend as increased, decreased, or no significant change at the 3and 7-day time points following injury (Figure 5). No significant differences were observed compared to controls at either the 3- or 7-day time point for five features, indicating that these alone are unlikely to translate to successful biomarkers. Approximately half (10/21) of the remaining features were significant across both time points (3 and 7 days) when compared to controls, while 10 more showed significant differences at only 3 or 7 days (Figure 5A,B). Most features in the panel, all except for two, did not show significant differences between 3 and 7 days, (Figure 5C). The remaining differences, however, could be attributed to reduced sample size for each pairwise comparison or type I errors stemming from multiple comparisons. Additionally, many features show temporal patterns supporting a return toward control levels at 7 days, warranting further study and inclusion of more acute time points to determine the time course of biochemical changes following injury.
Figure 5.
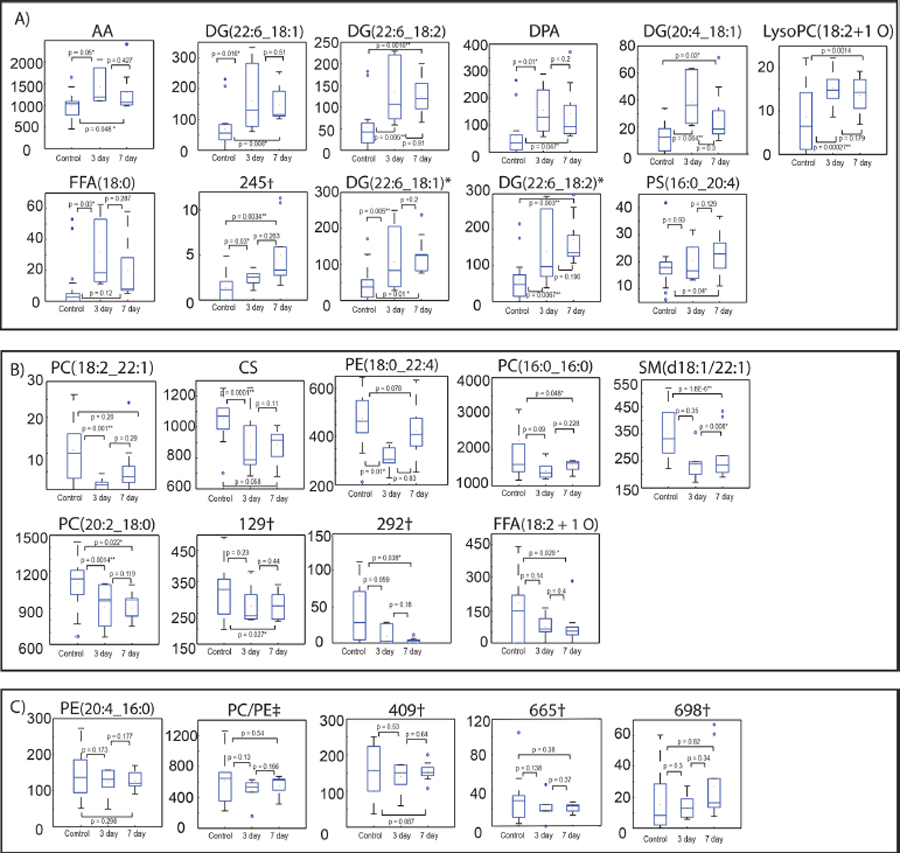
Boxplots showing time profile changes of samples following TBI at 0, 3, and 7 days. Features are divided into 3 groups: (A) features 14, 128, 271, 272, 277, 699, 289, 245, 656, 680, and 479 that showed an initial increase following TBI and then continuing to increase or decreasing at 7 days; (B) features 719, 61, 357, 103, 377, 64, 129, 292, and 314 that decreased following TBI and continued to decrease or started to return to baseline at 7 days; (C) features 24, 118, 409, 665, and 698 that showed no significant differences. †Not identified; *adduct differences; ‡corresponds to PE(18:2_18:0) or PC(18:2_16:0). See Table 2 for more information on lipids.
DISCUSSION
We utilized a broadband, discovery approach to identify novel lipid biomarkers of moderate TBI in the serum of adult male rats at 3 and 7 days postinjury. These subacute time points correspond with ongoing secondary cell degradation as well as the time course of post-traumatic inflammatory and oxidative stress cascades.26,62–68 Through the combination of high resolution mass spectrometric methods and rigorous datadriven classification models (feature selection algorithms: Bayesian, K-nearest neighbors, logistic regression, and support vector machines), we determined a 26-feature lipid panel that consistently separated TBI samples from sham-operated and naive controls with over 85% accuracy. Many of the prominent in the panel were PUFAs and PUFA-containing diacylglycerols as well as oxidized phospholipids, sphingolipids, and other lipid moieties. These dysregulated lipid species warrant further investigation and consideration for inclusion in a TBI biomarker panel. While it is expected that a biomarker panel will increase specificity over a single biomarker, 15 of the 26 lipids in the panel distinguished injury from control when considered individually, demonstrating the potential of this approach to identify TBI-specific changes in single lipid species. Among the lipids identified as potential TBI biomarkers, PUFAs were found to increase after TBI. Specifically, free fatty acids such as FFA(18:0), FFA(20:4, AA), FFA(22:5, DPA), and FFA(22:6, DHA) all showed significantly increased relative abundances following TBI, while the abundance of oxidized free fatty acid FFA(18:2 + 1 O) decreased. Similarly, elevated levels of AA have been found in rat serum following TBI using gas chromatography–mass spectrometry (GC–MS) at 1 and 5 days postinjury.69 FFA increases have also been observed in the rat brain following CCI21 as well as in the CSF of TBI patients.70,71
An increase in FFAs is known to accompany cellular injury events such as uncoupling of oxidative phosphorylation, exacerbating the disruption of ion balance and aggregation of oxidative metabolites.72 The disruption of calcium ion homeostasis in combination with energy depletion in the brain following injury leads to the activation of phospholipases A2 and C, which causes the release of FFAs from membrane phospholipids.73,74 The activation of phospholipase A2 in particular causes the liberation of AA, DPA, EPA, DHA, and other FFAs, enabling detection in serum post-TBI. Increases in phospholipase activity have been observed as early as 15 min post TBI,75 and the levels of FFAs have been reported to remain elevated at least 35 days postinjury.20 Evidence of fatty acid oxidation as well as disrupted amino acid metabolism has also been reported in patients presenting with severe blunt head trauma.76
While PUFAs are elevated following injury, FFA turnover is an essential process for membrane homeostasis and synaptogenesis,77 and these changes may be associated with postinjury repair attempts. The downstream metabolites of AA have been cited as potential biomarkers of inflammation, albeit for both pro- and anti-inflammation cascades.64 Specifically, AA is metabolized to eicosanoids through the cyclooxygenase (COX) pathway, as well to as anti-inflammatory lipoxins through the lipoxygenase (LOX) pathway, which are associated with the resolution phase of inflammation.78
Fatty acids can also undergo lipid peroxidation as a result of ROS and RNS imbalances once cleaved from membrane phospholipids, leading to the formation of α,ß-unsaturated aldehydes including malondialdehyde, 4-hydroxynonenal, and acrolein.79 We observed a decreased abundance for the oxidized FFA (18:2 + 1 O) and a lyso-phosphatidylcholine of the same species, lysoPC(18:2 + 1 O). The enzyme lipoprotein associated phospholipase A2 (Lp-PLA2) hydrolyzes oxidized phospholipids within LDL to generate oxidized lyso-PCs, which are known to induce inflammation.80 However, the resolution phase following injury is not reached if the oxygen supply in the brain is not re-established, possibly explaining the decrease in observed oxidized FFAs.81 The decreased relative abundance of these oxidation products in TBI samples may thus indicate a lack of effective controlled clearance of damaged cellular membranes following TBI, possibly due to an imbalance in PUFA concentrations. Necrotic cell death also stimulates the release of ROS and cytokines, the activation of phospholipase and sphingomyelinase, and phospholipid hydrolysis, all of which occur in TBI.82 Furthermore, the CNS has a high level of lipid content, providing abundant substrates for oxidative attack by ROS.83 Neurons are particularly vulnerable to ROS due to reduced glutathione levels, with the high degree of polyunsaturation of brain lipids providing many sites for the propagation of lipid peroxidation reactions.84
We also found that PUFA-esterified DGs changed significantly following TBI. TBI stimulates the activation of phospholipases C and D, resulting in increased abundances of PUFA-containing DGs.85 In our study, DGs- specifically those containing PUFA residues (22:6 or 20:4) were significantly increased in relative abundance following TBI. It has been shown previously that DGs in rat brains were increased immediately following CCI and remained elevated a month later compared to controls.21
While FFAs and DGs were increased in response to injury, all PCs and PEs identified in the classification panel were decreased in abundance after TBI. The majority of these lipids were esterified by PUFAs such as AA, including PE(20:4_16:0), PE (22:4_18:0), and PC(20:2_18:0), which were all decreased in TBI samples, while the relative abundance of PS(20:4_16:0) was slightly increased. Although lipid species containing only saturated fatty acids followed the same trend, none achieved statistical significance individually.
A recent study showed decreased levels of cortical and cerebellar PCs and PEs following CCI in the rat, while hippocampal PC and PE levels were elevated. Levels of overall PC, PE, and SM were lower in plasma following injury, and ether PE levels were lower in the cortices and plasma of injured mice relative to controls.19 In addition to preclinical evidence, phospholipid dysregulation has been observed in the CSF of human subjects following TBI. Clinical evidence for the disruption of CNS phospholipids has been observed within the first days following TBI, with PCs and PEs elevated to the highest concentration by day four.86 Similarly, both PCs and PEs were dramatically increased as early as 1 day following TBI, though levels decreased with time for survivors, falling below control levels by day six.87 Total PS concentrations were elevated at all measured time points, in agreement with the observed trend for the AA-containing PS molecule identified in the 26-feature panel above. Clinical evidence supports the initial increase of membrane phospholipids upon injury, followed by a decrease to levels below controls, likely indicative of ongoing hydrolysis of PC and PE species.83 Activation of phospholipases results in the hydrolysis of PUFAs esterified to membrane phospholipids, leading to decreased concentrations of PUFA-containing PC and PEs. The same pathophysiology resulting in the increased formation of FFAs also leads to a decreased rate of phospholipid resynthesis, and our results follow previous observations regarding phospholipid dysregulation following TBI.
Injury-specific changes in abundance were found for a variety of membrane lipids (e.g., PCs, PEs, and PSs) as well as for cholesterol sulfate (CS), which was significantly decreased in the TBI cohort. CS is an end product in the cholesterol metabolic pathway and may play a stabilizing role in cell membranes.88 The decrease in CS indicates a possible disturbance in AA regulation, a vital pathway in the secondary injury cascade.89 While both cholesterol and CS play key roles in lipid organization, CS is often found in high abundance in DHA rich membranes.90 While DHA was increased following moderate injury, CS was significantly decreased, potentially decreasing membrane permeability due to less efficient packing. There are some limitations to the present study that should be acknowledged. While we focused on time points that are known to show peak secondary injury changes, exploration of earlier time points may help to guide biomarker panel development in the acute period for diagnostics measures. Furthermore, we did not examine possible correlations between biomarker levels and histopathological or behavioral changes post-TBI. While such correlation is not straightforward,91,92 it will be pertinent to examine these potential links. As the lipid panel is refined, it would also beneficial to study not only other outcome measures, but also how addition of other fluid biomarkers, such as GFAP or UCH-L1, might improve specificity and sensitivity.
Additional lipid changes after both experimental and clinical TBI have been observed. Gangliosides such as GM2 have been shown to increase in the hippocampus, thalamus, and hypothalamus of mice following blast TBI, accompanied by a corresponding decrease in ceramides.22 Brain cardiolipins have been shown to be selectively oxidized following TBI,16,93,94 though none were detected in this study due to their low abundance in plasma resulting from localization within the mitochondrial membrane, as well as possible ion suppression effects.95–97 Also DGs and cholesteryl esters have been found to increase, while PCs, PEs, PIs, and cholesterol decrease in rat brains following CCI.18 Phospholipids esterified with PUFAs have been found to increase in the CSF of TBI patients.19 Similarly, levels were higher in patients with TBI who died within days after injury compared to those who survived.87,98 The results of our study thus lend support to previously identified lipidome alterations resulting from TBI and introduce a host of new potential biomarker candidates warranting further validation.
In addition to providing novel lipid biomarker candidates for TBI, the untargeted nature of our study also provides an indepth exploration of the metabolic processes in the subacute post-TBI period. Overall, many of the altered lipids are known to be involved in secondary injury pathways and would be expected to cross the BBB regardless of injury severity, increasing their likelihood of being detectable in serum, a readily accessible matrix with clinical relevance. The identified lipids may serve as prognostic biomarkers for TBI in the rat model, and it is expected that many of the same lipids could be detectable in both rodent and human blood. However, because of differences in the genome, proteome, and metabolome between rodents and humans, the diagnostic panel is unlikely to have direct clinical utility. Therefore, further discovery and validation studies are needed to assess the viability of this panel in detecting TBI in human patients. The metabolism of lipids is both complex and interwoven, but this study serves as a foundation for future targeted validation studies of TBI biomarkers. Comprehensive biomarker panels for TBI diagnosis and clinical management should consider inclusion of lipid-based molecules.
Supplementary Material
ACKNOWLEDGMENTS
This work was supported by the National Institutes of Health (GT BioMAT Training Grant Nos. T32EB006343–05, to S.R.H., R01NS079739 to R.V.B. and M.C.L., R21NS091832 to M.C.L., and R01NS101909–01 to F.M.F. and M.C.L.), VasserWooley endowed funds to F.M.F., and Parker H. Petit Institute for Bioengineering & Bioscience (GT). We gratefully acknowledge access to instrumentation from the Center for Chemical Evolution at Georgia Tech.
ABBREVIATIONS
- AA
arachidonic acid
- ANOVA
analysis of variance
- AUC
area under the curve
- BBB
blood–brain barrier
- CCI
controlled cortical impact
- Cer
ceramide
- CS
cholesterol sulfate
- CSF
cerebrospinal fluid
- CVb
coefficient of variation biological
- CVm
coefficient of variation measured
- DG
diacylglycerol
- DHA
docosahexaenoic acid
- DPA
docosapentaenoic acid
- FFA
free fatty acid
- IPA
isopropyl alcohol
- KNN
K-nearest neighbors
- LC–MS
liquid chromatography–mass spectrometry
- Lp-PLA2
lipoprotein associated phospholipase A2
- LV
latent variable
- m/z
mass to charge ratio
- mRMR
minimum redundancy, maximum relevance
- MS
mass spectrometry
- mTBI
mild traumatic brain injury
- NCE
normalized collision energy
- oPLS-DA
orthogonal partial least-squares-discriminant analysis
- PC
phosphatidylcholine
- PCA
principal component analysis
- PE
phosphatidylethanolamine
- PI
phosphatidylinositol
- PS
phosphatidylserine
- PUA
polyunsaturated aldehyde
- PUFA
polyunsaturated fatty acid
- QE
Q-exactive
- RNS
reactive nitrogen species
- ROS
reactive oxygen species
- RT
retention time
- SM
sphingomyelin
- SVM
support vector machines
- TBI
traumatic brain injury
- UPLC–MS
ultraperformance liquid chromatography–mass spectrometry
Footnotes
ASSOCIATED CONTENT
*S Supporting Information
The Supporting Information is available free of charge on the ACS Publications website at DOI: 10.1021/acs.jproteome.8b00068.
Representative base peak intensity chromatograms; inner versus outer cross validation performance plot; frequently selected peaks as prediction model features; frequently selected peaks as box plots; chromatographic gradients and MS acquisition parameters; detailed chemical annotation of 26 feature panel (PDF)
The authors declare no competing financial interest. Data are available online at https://chorusproject.org/anonymous/download/experiment/-3567265606761364215 and at http://dev.metabolomicsworkbench.org:22222/data/DRCCMetadata.php?Mode=Study&StudyID=ST000920.
REFERENCES
- (1).Faul M; Xu L; Wald MM; Coronado V Traumatic Brain Injury in the United States; Centers for Disease Control and Prevention, National Center for Injury Prevention and Control: Atlanta, GA, 2010. [Google Scholar]
- (2).Langlois JA; Rutland-Brown W; Wald MM The epidemiology and impact of traumatic brain injury: a brief overview. J. Head Trauma Rehabil 2006, 21 (5), 375–8. [DOI] [PubMed] [Google Scholar]
- (3).Daneshvar DH; Nowinski CJ; McKee AC; Cantu RC The epidemiology of sport-related concussion. Clinics in sports medicine 2011, 30 (1), 1–17. [DOI] [PMC free article] [PubMed] [Google Scholar]
- (4).Mondello S; Schmid K; Berger RP; Kobeissy F; Italiano D; Jeromin A; Hayes RL; Tortella FC; Buki A The Challenge of Mild Traumatic Brain Injury: Role of Biochemical Markers in Diagnosis of Brain Damage. Med. Res. Rev 2014, 34 (3), 503–531. [DOI] [PubMed] [Google Scholar]
- (5).Dash PK; Zhao J; Hergenroeder G; Moore AN Biomarkers for the diagnosis, prognosis, and evaluation of treatment efficacy for traumatic brain injury. Neurotherapeutics 2010, 7 (1), 100–114. [DOI] [PMC free article] [PubMed] [Google Scholar]
- (6).Pineda JA; Wang KK; Hayes RL Biomarkers of proteolytic damage following traumatic brain injury. Brain Pathol 2004, 14 (2), 202–9. [DOI] [PMC free article] [PubMed] [Google Scholar]
- (7).Plog BA; Dashnaw ML; Hitomi E; Peng W; Liao Y; Lou N; Deane R; Nedergaard M Biomarkers of traumatic injury are transported from brain to blood via the glymphatic system. J. Neurosci 2015, 35 (2), 518–26. [DOI] [PMC free article] [PubMed] [Google Scholar]
- (8).Iliff JJ; Wang M; Liao Y; Plogg BA; Peng W; Gundersen GA; Benveniste H; Vates GE; Deane R; Goldman SA; et al. A paravascular pathway facilitates CSF flow through the brain parenchyma and the clearance of interstitial solutes, including amyloid β. Sci. Transl. Med 2012, 4 (147), 147ra111–147ra111. [DOI] [PMC free article] [PubMed] [Google Scholar]
- (9).Zhang Z; Larner SF; Kobeissy F; Hayes RL; Wang KK Systems biology and theranostic approach to drug discovery and development to treat traumatic brain injury. Methods Mol. Biol 2010, 662, 317–29. [DOI] [PubMed] [Google Scholar]
- (10).Csuka E; Morganti-Kossmann MC; Lenzlinger PM; Joller H; Trentz O; Kossmann T IL-10 levels in cerebrospinal fluid and serum of patients with severe traumatic brain injury: relationship to IL6, TNF-α, TGF-β1 and blood–brain barrier function. J. Neuroimmunol 1999, 101 (2), 211–221. [DOI] [PubMed] [Google Scholar]
- (11).Kossmann T; Hans VH; Imhof H-G; Stocker R; Grob P; Trentz O; Morganti-Kossmann MC Intrathecal and serum interleukin-6 and the acute-phase response in patients with severe traumatic brain injuries. Shock 1995, 4 (5), 311–317. [DOI] [PubMed] [Google Scholar]
- (12).Viant MR; Lyeth BG; Miller MG; Berman RF An NMR metabolomic investigation of early metabolic disturbances following traumatic brain injury in a mammalian model. NMR Biomed 2005, 18 (8), 507–516. [DOI] [PubMed] [Google Scholar]
- (13).Pardridge WM The blood-brain barrier: bottleneck in brain drug development. NeuroRx 2005, 2 (1), 3–14. [DOI] [PMC free article] [PubMed] [Google Scholar]
- (14).Davson H An Introduction to the Blood–Brain Barrier; CRC Press: Boca Raton, FL, 1993. [Google Scholar]
- (15).Sheth SA; Iavarone AT; Liebeskind DS; Won SJ; Swanson RA Targeted Lipid Profiling Discovers Plasma Biomarkers of Acute Brain Injury. PLoS One 2015, 10 (6), e0129735. [DOI] [PMC free article] [PubMed] [Google Scholar]
- (16).Ji J; Kline AE; Amoscato A; Samhan-Arias AK; Sparvero LJ; Tyurin VA; Tyurina YY; Fink B; Manole MD; Puccio AM; et al. Lipidomics identifies cardiolipin oxidation as a mitochondrial target for redox therapy of brain injury. Nat. Neurosci 2012, 15 (10), 1407–1413. [DOI] [PMC free article] [PubMed] [Google Scholar]
- (17).Hankin JA; Farias SE; Barkley RM; Heidenreich K; Frey LC; Hamazaki K; Kim H-Y; Murphy RC MALDI mass spectrometric imaging of lipids in rat brain injury models. J. Am. Soc. Mass Spectrom 2011, 22 (6), 1014. [DOI] [PMC free article] [PubMed] [Google Scholar]
- (18).Roux A; Muller L; Jackson SN; Post J; Baldwin K; Hoffer B; Balaban CD; Barbacci D; Schultz JA; Gouty S; et al. Mass spectrometry imaging of rat brain lipid profile changes over time following traumatic brain injury. J. Neurosci. Methods 2016, 272, 19–32. [DOI] [PMC free article] [PubMed] [Google Scholar]
- (19).Abdullah L; Evans JE; Ferguson S; Mouzon B; Montague H; Reed J; Crynen G; Emmerich T; Crocker M; Pelot R; Mullan M; Crawford F Lipidomic analyses identify injury-specific phospholipid changes 3 mo after traumatic brain injury. FASEB J 2014, 28 (12), 5311–21. [DOI] [PubMed] [Google Scholar]
- (20).Homayoun P; Rodriguez de Turco E; Parkins N; Lane D; Soblosky J; Carey M; Bazan N Delayed phospholipid degradation in rat brain after traumatic brain injury. J. Neurochem 1997, 69 (1), 199–205. [DOI] [PubMed] [Google Scholar]
- (21).Homayoun P; Parkins N; Soblosky J; Carey M; Rodriguez De Turco E; Bazan N Cortical impact injury in rats promotes a rapid and sustained increase in polyunsaturated free fatty acids and diacylglycerols. Neurochem. Res 2000, 25 (2), 269–276. [DOI] [PubMed] [Google Scholar]
- (22).Woods AS; Colsch B; Jackson SN; Post J; Baldwin K; Roux A; Hoffer B; Cox BM; Hoffer M; Rubovitch V; et al. Gangliosides and ceramides change in a mouse model of blast induced traumatic brain injury. ACS Chem. Neurosci 2013, 4 (4), 594–600. [DOI] [PMC free article] [PubMed] [Google Scholar]
- (23).Kochanek PM; Berger RP; Bayr H; Wagner AK; Jenkins LW; Clark RS Biomarkers of primary and evolving damage in traumatic and ischemic brain injury: diagnosis, prognosis, probing mechanisms, and therapeutic decision making. Curr. Opin Crit Care 2008, 14 (2), 135–41. [DOI] [PubMed] [Google Scholar]
- (24).Anthonymuthu TS; Kenny EM; Bayir H Therapies targeting lipid peroxidation in traumatic brain injury. Brain Res 2016, 1640 (A), 57–76. [DOI] [PMC free article] [PubMed] [Google Scholar]
- (25).McAllister TW Neurobiological consequences of traumatic brain injury. Dialogues Clin. Neurosci 2011, 13 (3), 287–300. [DOI] [PMC free article] [PubMed] [Google Scholar]
- (26).Singh IN; Sullivan PG; Deng Y; Mbye LH; Hall ED Time course of post-traumatic mitochondrial oxidative damage and dysfunction in a mouse model of focal traumatic brain injury: implications for neuroprotective therapy. J. Cereb. Blood Flow Metab 2006, 26 (11), 1407–1418. [DOI] [PubMed] [Google Scholar]
- (27).Kimball BA; Cohen AS; Gordon AR; Opiekun M; Martin T; Elkind J; Lundström JN; Beauchamp GK Brain injury alters volatile metabolome. Chem. Senses 2016, 41 (5), 407–414. [DOI] [PMC free article] [PubMed] [Google Scholar]
- (28).Mondello S; Muller U; Jeromin A; Streeter J; Hayes RL; Wang KK Blood-based diagnostics of traumatic brain injuries. Expert Rev. Mol. Diagn 2011, 11 (1), 65–78. [DOI] [PMC free article] [PubMed] [Google Scholar]
- (29).Hill RL; Singh IN; Wang JA; Hall ED Time courses of post-injury mitochondrial oxidative damage and respiratory dysfunction and neuronal cytoskeletal degradation in a rat model of focal traumatic brain injury. Neurochem. Int 2017, 111, 45–56. [DOI] [PMC free article] [PubMed] [Google Scholar]
- (30).Gutteridge J Lipid peroxidation and antioxidants as biomarkers of tissue damage. Clin. Chem 1995, 41 (12), 1819–1828. [PubMed] [Google Scholar]
- (31).Giza CC; Hovda DA The new neurometabolic cascade of concussion. Neurosurgery 2014, 75 (4), S24. [DOI] [PMC free article] [PubMed] [Google Scholar]
- (32).Schiess R; Wollscheid B; Aebersold R Targeted proteomic strategy for clinical biomarker discovery. Mol. Oncol 2009, 3 (1), 33–44. [DOI] [PMC free article] [PubMed] [Google Scholar]
- (33).Iannaccone PM; Jacob HJ Rats! Dis. Models & Mech 2009, 2 (5–6), 206–210. [DOI] [PMC free article] [PubMed] [Google Scholar]
- (34).White TE; Ford GD; Surles-Zeigler MC; Gates AS; LaPlaca MC; Ford BD Gene expression patterns following unilateral traumatic brain injury reveals a local pro-inflammatory and remote anti-inflammatory response. BMC Genomics 2013, 14 (1), 282. [DOI] [PMC free article] [PubMed] [Google Scholar]
- (35).Osier N; Dixon CE The Controlled Cortical Impact Model of Experimental Brain Trauma: Overview, Research Applications, and Protocol. Methods Mol. Biol 2016, 1462, 177–92. [DOI] [PMC free article] [PubMed] [Google Scholar]
- (36).Kobeissy FH Brain Neurotrauma: Molecular, Neuropsychological, and Rehabilitation Aspects; CRC Press: Boca Raton, FL, 2015. [PubMed] [Google Scholar]
- (37).Betancur MI; Mason HD; Alvarado-Velez M; Holmes PV; Bellamkonda RV; Karumbaiah L Chondroitin Sulfate Glycosaminoglycan Matrices Promote Neural Stem Cell Maintenance and Neuroprotection Post-Traumatic Brain Injury. ACS Biomater. Sci. Eng 2017, 3 (3), 420–430. [DOI] [PMC free article] [PubMed] [Google Scholar]
- (38).Gutowski SM; Shoemaker JT; Templeman KL; Wei Y; Latour RA; Bellamkonda RV; LaPlaca MC; García AJ Protease-degradable PEG-maleimide coating with on-demand release of IL-1Ra to improve tissue response to neural electrodes. Biomaterials 2015, 44, 55–70. [DOI] [PMC free article] [PubMed] [Google Scholar]
- (39).Sharp MK; Mohammad SF Scaling of hemolysis in needles and catheters. Ann. Biomed. Eng 1998, 26 (5), 788–797. [DOI] [PubMed] [Google Scholar]
- (40).Lippi G; Salvagno GL; Montagnana M; Lima-Oliveira G; Guidi GC; Favaloro EJ Quality Standards for Sample Collection in Coagulation Testing, Seminars in Thrombosis and Hemostasis, 2012; Thieme Medical Publishers, 2012; pp 565–575. [DOI] [PubMed] [Google Scholar]
- (41).Sarafian MH; Gaudin M; Lewis MR; Martin F-P; Holmes E; Nicholson JK; Dumas M-E Objective set of criteria for optimization of sample preparation procedures for ultra-high throughput untargeted blood plasma lipid profiling by ultra performance liquid Chromatography–Mass spectrometry. Anal. Chem 2014, 86 (12), 5766–5774. [DOI] [PubMed] [Google Scholar]
- (42).Folch J; Lees M; Sloane-Stanley G A simple method for the isolation and purification of total lipids from animal tissues. J. Biol. Chem 1957, 226 (1), 497–509. [PubMed] [Google Scholar]
- (43).Bligh EG; Dyer WJ A rapid method of total lipid extraction and purification. Can. J. Biochem. Physiol 1959, 37 (8), 911–917. [DOI] [PubMed] [Google Scholar]
- (44).Pitkanen A; Schwartzkroin PA; Moshe SL Models of Seizures and Epilepsy; Academic Press: Burlington, MA, 2005. [Google Scholar]
- (45).Fahy E; Subramaniam S; Murphy RC; Nishijima M; Raetz CR; Shimizu T; Spener F; van Meer G; Wakelam MJ; Dennis EA Update of the LIPID MAPS comprehensive classification system for lipids. J. Lipid Res 2009, 50 (Supplement), S9–S14. [DOI] [PMC free article] [PubMed] [Google Scholar]
- (46).Smith CA; O’Maille G; Want EJ; Qin C; Trauger SA; Brandon TR; Custodio DE; Abagyan R; Siuzdak G METLIN: a metabolite mass spectral database. Ther. Drug Monit 2005, 27 (6), 747–751. [DOI] [PubMed] [Google Scholar]
- (47).Wishart DS; Jewison T; Guo AC; Wilson M; Knox C; Liu Y; Djoumbou Y; Mandal R; Aziat F; Dong E; et al. HMDB 3.0←the human metabolome database in 2013. Nucleic Acids Res 2012, 41 (D1), D801–D807. [DOI] [PMC free article] [PubMed] [Google Scholar]
- (48).Faul F; Erdfelder E; Lang A-G; Buchner A G* Power 3: A flexible statistical power analysis program for the social, behavioral, and biomedical sciences. Behavior research methods 2007, 39 (2), 175–191. [DOI] [PubMed] [Google Scholar]
- (49).Phan JH; Kothari S; Wang MD omniClassifier: A Desktop Grid Computing System for Big Data Prediction Modeling. Proceedings of the 5th ACM Conference on Bioinformatics, Computational Biology, and Health Informatics, 2014; ACM, 2014; pp 514–523. [DOI] [PMC free article] [PubMed] [Google Scholar]
- (50).Parry RM; Phan JH; Wang MD Win percentage: a novel measure for assessing the suitability of machine classifiers for biological problems. BMC Bioinf 2012, 13 (Suppl 3), S7. [DOI] [PMC free article] [PubMed] [Google Scholar]
- (51).Ding C; Peng H Minimum redundancy feature selection from microarray gene expression data. J. Bioinf. Comput. Biol 2005, 03 (02), 185–205. [DOI] [PubMed] [Google Scholar]
- (52).Worley B; Powers R Multivariate Analysis in Metabolomics. Curr. Metabolomics 2012, 1 (1), 92–107. [DOI] [PMC free article] [PubMed] [Google Scholar]
- (53).Boccard J; Rutledge DN A consensus orthogonal partial least squares discriminant analysis (OPLS-DA) strategy for multiblock Omics data fusion. Anal. Chim. Acta 2013, 769, 30–9. [DOI] [PubMed] [Google Scholar]
- (54).Annesley TM Ion suppression in mass spectrometry. Clin. Chem 2003, 49 (7), 1041–1044. [DOI] [PubMed] [Google Scholar]
- (55).Kliman M; May JC; McLean JA Lipid analysis and lipidomics by structurally selective ion mobility-mass spectrometry. Biochim. Biophys. Acta, Mol. Cell Biol. Lipids 2011, 1811 (11), 935–45. [DOI] [PMC free article] [PubMed] [Google Scholar]
- (56).May JC; McLean JA Advanced Multidimensional Separations in Mass Spectrometry: Navigating the Big Data Deluge. Annu. Rev. Anal. Chem 2016, 9 (1), 387–409. [DOI] [PMC free article] [PubMed] [Google Scholar]
- (57).Brügger B; Erben G; Sandhoff R; Wieland FT; Lehmann WD Quantitative analysis of biological membrane lipids at the low picomole level by nano-electrospray ionization tandem mass spectrometry. Proc. Natl. Acad. Sci. U. S. A 1997, 94 (6), 2339–2344. [DOI] [PMC free article] [PubMed] [Google Scholar]
- (58).Ivanova PT; Milne SB; Myers DS; Brown HA Lipidomics: a mass spectrometry based systems level analysis of cellular lipids. Curr. Opin. Chem. Biol 2009, 13 (5), 526–531. [DOI] [PMC free article] [PubMed] [Google Scholar]
- (59).Römisch-Margl W; Prehn C; Bogumil R; Röhring C; Suhre K; Adamski J Procedure for tissue sample preparation and metabolite extraction for high-throughput targeted metabolomics. Metabolomics 2012, 8 (1), 133–142. [Google Scholar]
- (60).Semmes OJ Defining the role of mass spectrometry in cancer diagnostics. Cancer Epidemiol. Biomarkers Prev 2004, 13 (10), 1555–7. [PubMed] [Google Scholar]
- (61).Robin X; Turck N; Hainard A; Tiberti N; Lisacek F; Sanchez J-C; Müller M PanelomiX: a threshold-based algorithm to create panels of biomarkers. Advances in Integrative Medicine 2013, 1 (1), 57–64. [Google Scholar]
- (62).Baskaya MK; Muralikrishna Rao A; Doğan A; Donaldson D; Dempsey RJ The biphasic opening of the blood–brain barrier in the cortex and hippocampus after traumatic brain injury in rats. Neurosci. Lett 1997, 226 (1), 33–36. [DOI] [PubMed] [Google Scholar]
- (63).Ansari MA; Roberts KN; Scheff SW A time course of contusion-induced oxidative stress and synaptic proteins in cortex in a rat model of TBI. Journal of neurotrauma 2008, 25 (5), 513–526. [DOI] [PubMed] [Google Scholar]
- (64).Ziebell JM; Morganti-Kossmann MC Involvement of proand anti-inflammatory cytokines and chemokines in the pathophysiology of traumatic brain injury. Neurotherapeutics 2010, 7 (1), 22–30. [DOI] [PMC free article] [PubMed] [Google Scholar]
- (65).Soares HD; Hicks RR; Smith D; McIntosh TK Inflammatory leukocytic recruitment and diffuse neuronal degeneration are separate pathological processes resulting from traumatic brain injury. J. Neurosci 1995, 15 (12), 8223–8233. [DOI] [PMC free article] [PubMed] [Google Scholar]
- (66).Chen S; Pickard J; Harris N Time course of cellular pathology after controlled cortical impact injury. Exp. Neurol 2003, 182 (1), 87–102. [DOI] [PubMed] [Google Scholar]
- (67).Cao T; Thomas TC; Ziebell JM; Pauly JR; Lifshitz J Morphological and genetic activation of microglia after diffuse traumatic brain injury in the rat. Neuroscience 2012, 225, 65–75. [DOI] [PMC free article] [PubMed] [Google Scholar]
- (68).Licastro F; Hrelia S; Porcellini E; Malaguti M; Di Stefano C; Angeloni C; Carbone I; Simoncini L; Piperno R Peripheral inflammatory markers and antioxidant response during the post-acute and chronic phase after severe traumatic brain injury. Frontiers in neurology 2016, 7, 189. [DOI] [PMC free article] [PubMed] [Google Scholar]
- (69).Yang S; Ma Y; Liu Y; Que H; Zhu C; Liu S Arachidonic acid: a bridge between traumatic brain injury and fracture healing. Journal of neurotrauma 2012, 29 (17), 2696–2705. [DOI] [PubMed] [Google Scholar]
- (70).Pilitsis JG; Coplin WM; O’Regan MH; Wellwood JM; Diaz FG; Fairfax MR; Michael DB; Phillis JW Free fatty acids in cerebrospinal fluids from patients with traumatic brain injury. Neurosci. Lett 2003, 349 (2), 136–138. [DOI] [PubMed] [Google Scholar]
- (71).Farias SE; Heidenreich KA; Wohlauer MV; Murphy RC; Moore EE Lipid mediators in cerebral spinal fluid of traumatic brain injured patients. J. Trauma 2011, 71 (5), 1211–8. [DOI] [PubMed] [Google Scholar]
- (72).Prins M; Greco T; Alexander D; Giza CC The pathophysiology of traumatic brain injury at a glance. Dis. Models & Mech 2013, 6 (6), 1307–1315. [DOI] [PMC free article] [PubMed] [Google Scholar]
- (73).Wieloch T; Siesjo BK Ischemic brain injury: the importance of calcium, lipolytic activities, and free fatty acids. Pathol Biol. (Paris) 1982, 30 (5), 269–77. [PubMed] [Google Scholar]
- (74).McIntosh; Saatman; Raghupathi; Graham; Smith; Lee; Trojanowski g The Dorothy Russell Memorial Lecture* The molecular and cellular sequelae of experimental traumatic brain injury: pathogenetic mechanisms. Neuropathol. Appl. Neurobiol 1998, 24 (4), 251–267. [DOI] [PubMed] [Google Scholar]
- (75).Shohami E; Shapira Y; Yadid G; Reisfeld N; Yedgar S Brain phospholipase A2 is activated after experimental closed head injury in the rat. J. Neurochem 1989, 53 (5), 1541–1546. [DOI] [PubMed] [Google Scholar]
- (76).Parent BA; Seaton M; Sood RF; Gu H; Djukovic D; Raftery D; O’Keefe GE Use of metabolomics to trend recovery and therapy after injury in critically ill trauma patients. JAMA surgery 2016, 151 (7), e160853–e160853. [DOI] [PMC free article] [PubMed] [Google Scholar]
- (77).da Silva TF; Sousa VF; Malheiro AR; Brites P The importance of ether-phospholipids: a view from the perspective of mouse models. Biochim. Biophys. Acta, Mol. Basis Dis 2012, 1822 (9), 1501–8. [DOI] [PubMed] [Google Scholar]
- (78).Needleman P; Truk J; Jakschik B; Morrison A; Lefkowith J Arachidonic acid metabolism. Annu. Rev. Biochem 1986, 55 (1), 69–102. [DOI] [PubMed] [Google Scholar]
- (79).Janero DR Malondialdehyde and thiobarbituric acid-reactivity as diagnostic indices of lipid peroxidation and peroxidative tissue injury. Free Radical Biol. Med 1990, 9 (6), 515–540. [DOI] [PubMed] [Google Scholar]
- (80).Zalewski A; Nelson JJ; Hegg L; Macphee C Lp-PLA2: a new kid on the block. Clin. Chem 2006, 52 (9), 1645–1650. [DOI] [PubMed] [Google Scholar]
- (81).Thomale U-W; Schaser K; Kroppenstedt S-N; Unterberg A; Stover JF Cortical hypoperfusion precedes hyperperfusion following controlled cortical impact injury In Intracranial Pressure and Brain Biochemical Monitoring; Springer, 2002; pp 229–231. [DOI] [PubMed] [Google Scholar]
- (82).Morganti-Kossmann MC; Rancan M; Stahel PF; Kossmann T Inflammatory response in acute traumatic brain injury: a double-edged sword. Current opinion in critical care 2002, 8 (2), 101–105. [DOI] [PubMed] [Google Scholar]
- (83).Adibhatla RM; Hatcher JF Role of Lipids in Brain Injury and Diseases. Future Lipidol 2007, 2 (4), 403–422. [DOI] [PMC free article] [PubMed] [Google Scholar]
- (84).Tyurin VA; Tyurina YY; Borisenko GG; Sokolova TV; Ritov VB; Quinn PJ; Rose M; Kochanek P; Graham SH; Kagan VE Oxidative stress following traumatic brain injury in rats. J. Neurochem 2000, 75 (5), 2178–2189. [DOI] [PubMed] [Google Scholar]
- (85).Tang X; Edwards EM; Holmes BB; Falck JR; Campbell WB Role of phospholipase C and diacylglyceride lipase pathway in arachidonic acid release and acetylcholine-induced vascular relaxation in rabbit aorta. Am. J. Physiol Heart Circ Physiol 2006, 290 (1), H37–45. [DOI] [PubMed] [Google Scholar]
- (86).Pasvogel AE; Miketova P; Moore IMK Cerebrospinal fluid phospholipid changes following traumatic brain injury. Biol. Res. Nurs 2008, 10 (2), 113–120. [DOI] [PubMed] [Google Scholar]
- (87).Pasvogel AE; Miketova P; Moore IM Differences in CSF phospholipid concentration by traumatic brain injury outcome. Biol. Res. Nurs 2010, 11 (4), 325–331. [DOI] [PubMed] [Google Scholar]
- (88).Banerjee R; Roy A The sulfotransferases of guinea pig liver. Molecular Pharmacol 1966, 2 (1), 56–66. [PubMed] [Google Scholar]
- (89).Blache D Enhanced arachidonic acid and calcium metabolism in cholesteryl sulfate-enriched rat platelets. J. Lipid Mediators Cell Signalling 1996, 13 (2), 127–138. [DOI] [PubMed] [Google Scholar]
- (90).Schofield M; Jenski LJ; Dumaual AC; Stillwell W Cholesterol versus cholesterol sulfate: effects on properties of phospholipid bilayers containing docosahexaenoic acid. Chem. Phys. Lipids 1998, 95 (1), 23–36. [DOI] [PubMed] [Google Scholar]
- (91).Mondello S; Shear DA; Bramlett HM; Dixon CE; Schmid KE; Dietrich WD; Wang KK; Hayes RL; Glushakova O; Catania M; et al. Insight into pre-clinical models of traumatic brain injury using circulating brain damage biomarkers: Operation brain trauma therapy. J. Neurotrauma 2016, 33 (6), 595–605. [DOI] [PubMed] [Google Scholar]
- (92).Ringger NC; O’steen B; Brabham J; Silver X; Pineda J; Wang K; Hayes R; Papa L A novel marker for traumatic brain injury: CSF αII-spectrin breakdown product levels. Journal of neurotrauma 2004, 21 (10), 1443–1456. [DOI] [PubMed] [Google Scholar]
- (93).Bayir H; Tyurin VA; Tyurina YY; Viner R; Ritov V; Amoscato AA; Zhao Q; Zhang XJ; Janesko-Feldman KL; Alexander H; Basova LV; Clark RSB; Kochanek PM; Kagan VE Selective early cardiolipin peroxidation after traumatic brain injury: an oxidative lipidomics analysis. Ann. Neurol 2007, 62 (2), 154–169. [DOI] [PubMed] [Google Scholar]
- (94).Sparvero LJ; Amoscato AA; Kochanek PM; Pitt BR; Kagan VE; Bayır H Mass-spectrometry based oxidative lipidomics and lipid imaging: applications in traumatic brain injury. J. Neurochem 2010, 115 (6), 1322–1336. [DOI] [PMC free article] [PubMed] [Google Scholar]
- (95).Cheng H; Mancuso DJ; Jiang X; Guan S; Yang J; Yang K; Sun G; Gross RW; Han X Shotgun Lipidomics Reveals the Temporally Dependent, Highly Diversified Cardiolipin Profile in the Mammalian Brain: Temporally Coordinated Postnatal Diversification of Cardiolipin Molecular Species with Neuronal Remodeling†. Biochemistry 2008, 47 (21), 5869–5880. [DOI] [PMC free article] [PubMed] [Google Scholar]
- (96).Levine JS; Branch DW; Rauch J The Antiphospholipid Syndrome. N. Engl. J. Med 2002, 346 (10), 752–763. [DOI] [PubMed] [Google Scholar]
- (97).Marinetti G; Erbland J; Stotz E Phosphatides of pig heart cell fractions. J. Biol. Chem 1958, 233 (3), 562–565. [PubMed] [Google Scholar]
- (98).Kay AD; Day SP; Kerr M; Nicoll JA; Packard CJ; Caslake MJ Remodeling of cerebrospinal fluid lipoprotein particles after human traumatic brain injury. Journal of neurotrauma 2003, 20 (8), 717–723. [DOI] [PubMed] [Google Scholar]
Associated Data
This section collects any data citations, data availability statements, or supplementary materials included in this article.