

Summary
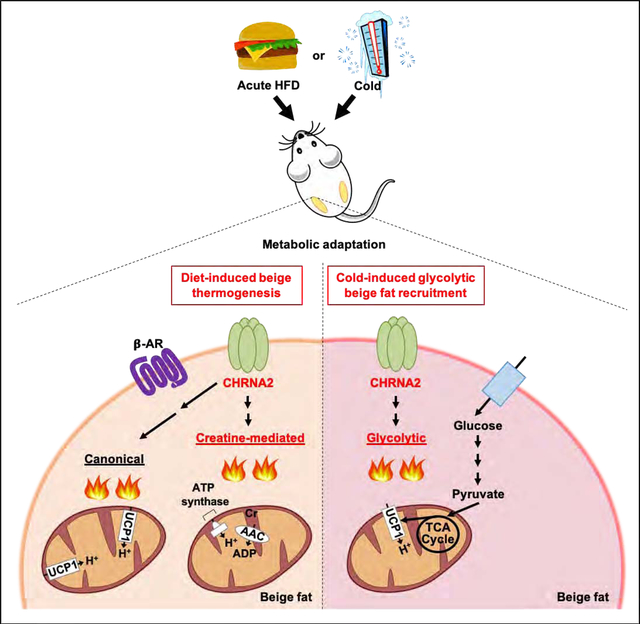
Maintaining energy homeostasis upon environmental challenges, such as cold or excess calorie intake, is essential to the fitness and survival of mammals. Drug discovery efforts targeting β-adrenergic signaling have not been fruitful after decades of intensive research. We recently identified a new beige fat regulatory pathway mediated via the nicotinic acetylcholine receptor subunit CHRNA2. Here we generated fat-specific Chrna2 KO mice and observed thermogenic defects in cold and metabolic dysfunction upon dietary challenges caused by adipocyte-autonomous regulation in vivo. We found that CHRNA2 signaling is activated after acute high-fat diet feeding and this effect is manifested through both UCP1- and creatine-mediated mechanisms. Furthermore, our data suggested that CHRNA2 signaling may activate glycolytic beige fat, a subpopulation of beige adipocytes mediated by GABPα, emerging in the absence of β-adrenergic signaling. These findings reveal the biological significance of the CHRNA2 pathway in beige fat biogenesis and energy homeostasis.
Keywords: Beige fat, CHRNA2, diet-induced thermogenesis, g-beige fat
Graphical Abstract
In brief
Jun and Ma et al. show that adipocyte-autonomous CHRNA2 signaling mediates adaptive thermogenesis after cold exposure and metabolic homeostasis during high fat diet feeding. Upon activation after acute calorie excess, CHRNA2 signaling regulates both UCP1- and creatine-mediated pathways. CHRNA2-glycolytic beige adipocytes axis regulates a β-adrenergic-independent signaling pathway.
Introduction
Obesity and related metabolic disorders remain a serious global health concern that is showing no signs of easing. The discovery of thermogenic adipocytes in humans has provided us with new avenues for improving metabolic health, however our understanding of the pathways and mechanisms that underlie fat thermogenesis is still in its infancy (Chondronikola and Sidossis, 2019; Marlatt and Ravussin, 2017).
It has been well illustrated that thermogenesis operates through the activation of β-adrenergic receptor (β-AR) signaling in response to environmental cues such as cold exposure and caloric excess (Cannon and Nedergaard, 2004; Collins, 2011). Whilst UCP1 has traditionally been regarded as the best-characterized regulator of non-shivering adaptive thermogenesis, several UCP1-independent pathways have come to light in recent years, including futile creatine metabolism (Bertholet et al., 2017; Kazak et al., 2015; Kazak et al., 2017; Kazak et al., 2019) and calcium cycling (Ikeda et al., 2017). Furthermore, the recent demonstration that glycolytic beige (g-beige) fat can emerge during thermal stress in the absence of β-AR signaling indicates the existence of heterogeneous populations of beige adipocytes and thermogenic mechanisms that operate independently of classical signaling pathways (Chen et al., 2019). However, it remains unknown how these newly discovered pathways are integrated during the acclimation to diverse environmental changes, such as nutritional and temperature changes.
Signaling via the nicotinic acetylcholine receptor subunit CHRNA2 was recently identified as a thermogenic pathway selective to beige adipocytes in mice and humans (Jun et al., 2018). Here we show distinct subcutaneous thermogenic defects in the fat-specific absence of CHRNA2, suggesting a role for CHRNA2-mediated signaling in the orchestration of energy homeostasis following environmental challenges. Thermogenic gene expression and mitochondrial metabolism were impaired in CHRNA2-deficient inguinal fat during chronic cold exposure and less protection against high-fat diet (HFD) feeding was observed in fat-specific Chrna2 KO mice, whereas no obvious defects were observed at basal level. Following an acute caloric overload that triggers diet-induced thermogenesis (DIT) (Bachman et al., 2002; de Jonge and Bray, 1997; Kazak et al., 2017; Leibel et al., 1995), we found that CHRNA2 signaling mediates DIT in subcutaneous fat through both UCP1- and creatine-dependent pathways. CHRNA2-mediated signaling operates independently of the sympathetic pathway, therefore we investigated whether CHRNA2 plays a role in g-beige fat, a population that is recruited in the absence of β-adrenergic signaling. We cold-challenged mice that had pharmacological or genetic ablation of β-adrenergic signaling, and found that Chrna2 was enriched in GABPα-mediated g-beige fat and elicited the thermogenic program in g-beige fat. Together, our results suggest that CHRNA2 signaling integrates environmental cues to orchestrate a diverse suite of thermogenic pathways in beige fat. The crosstalk between CHRNA2 signaling and g-beige fat activation may suggest innovative therapeutic targets to activate thermogenic fat in humans that may circumvent undesirable side effects associated with β-adrenergic activation.
Results and Discussion
Disruption of CHRNA2 Signaling in Adipose Tissue
Whole-body Chrna2 knockout (KO) mice show distinct thermogenic defects and exacerbated diet-induced obesity (Jun et al., 2018). Given that Chrna2 is expressed in various tissues including liver, fat and the brain (Figure 1A), we used CRISPR/Cas9 gene editing to generate a floxed Chrna2 (Chrna2fl/fl) mouse, allowing for tissue-specific Chrna2 ablation. LoxP sites flanking exon 3 of Chrna2 were introduced by homology-directed repair and the in vivo presence of the inserted LoxP sites on the targeting region was confirmed by genotyping PCR (Figure 1B). Deletion of Chrna2 by adenoviral delivery of Cre recombinase was confirmed in differentiated Chrna2fl/fl-derived inguinal preadipocytes, demonstrating that the LoxP sites appropriately targeted to the endogenous Chrna2 locus as designed (Figure 1C). To study the effects of Chrna2 deletion specifically in adipocytes, we generated adipose-specific Chrna2 KO mice (Chrna2-adKO) by crossing Chrna2fl/fl animals with Adiponectin-Cre mice (Figure 1D). Chrna2 deletion was confirmed by qPCR in inguinal white adipose tissue (IWAT), with no deletion evident in other tissues that express Chrna2, in contrast to the whole-body Chrna2 KO (Figure 1D and Figure S1A–C). Additionally, no other genes encoding nicotinic acetylcholine receptor (nAChR) subunits were induced to compensate for the loss of Chrna2 expression in IWAT (Figure S1D). We have previously shown that CHRNA2 forms a functional ion channel that can be activated in beige adipocytes in response to its agonists (Jun et al., 2018). Here, we demonstrated that both nicotine and acetylcholine induced an increase in intracellular calcium in Chrna2fl/fl-derived primary inguinal fat cells, indicating that the inserted LoxP sites did not interfere with the production of functional CHRNA2 protein. No response to either agonist was detected in Chrna2-adKO cells, demonstrating an effective ablation of CHRNA2 signaling through Cre-mediated deletion in adipocytes (Figure 1E and Figure S1E and F). Similar to what was observed in whole-body Chrna2 KO animals, fat-specific deletion of Chrna2 did not cause gross abnormality at the basal condition. Chrna2-adKO mice showed no differences in body weight, adipose tissue mass, blood glucose levels or core body temperature compared to littermate Chrna2fl/fl controls (Figure 1F–H and Figure S1G). Likewise, no morphological differences in IWAT, brown adipose tissue (BAT) or visceral white adipose tissue (VWAT) architecture were seen by H&E staining between the two genotypes, nor did Chrna2-adKO mice exhibit any changes in thermogenesis and related glucose metabolism gene expression and oxygen consumption rate (OCR) in IWAT, as well as other key metabolic organs such as BAT, VWAT and skeletal muscle (Figure 1I–N and Figure S1H–K).
Figure 1. Disruption of CHRNA2 signaling in adipose tissue.
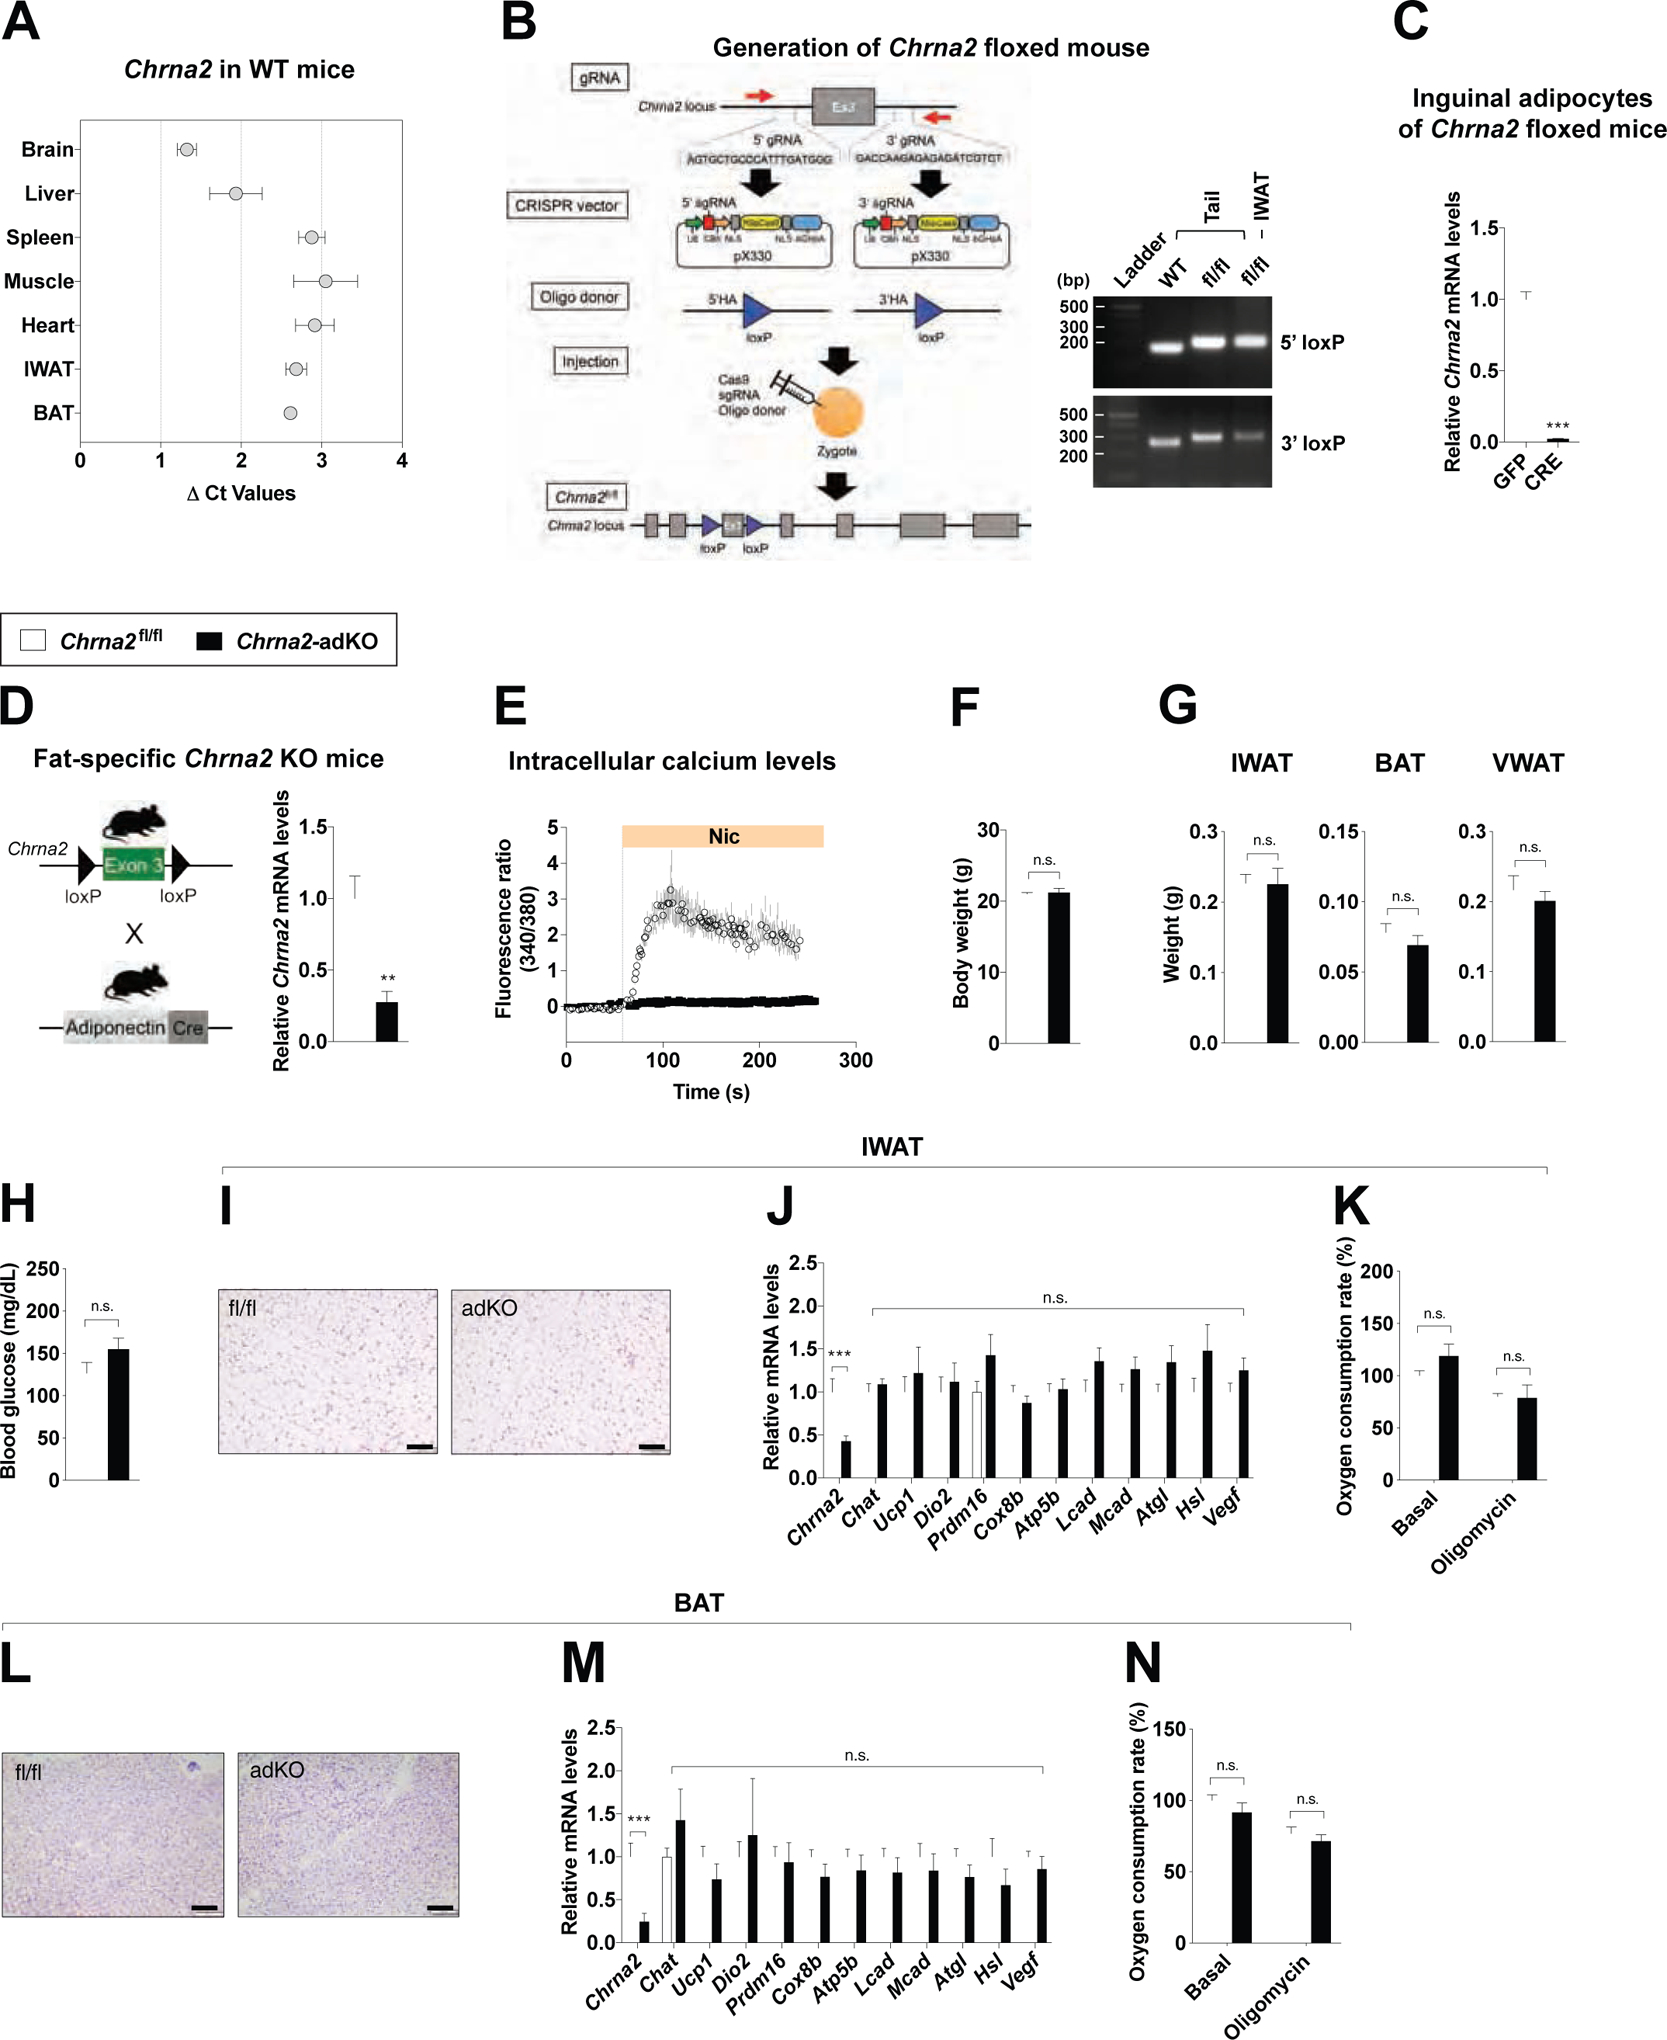
(A) qPCR analyses of Chrna2 mRNA expression across tissues from WT mice (ΔCt relative to Tbp, n = 4).
(B) Generation of floxed mice for the conditional deletion of the Chrna2 gene using the CRISPR/Cas9 system. Exon 3 of the Chrna2 gene was targeted by sgRNAs designed complementary to intronic sequences flanking the exon, then LoxP sites with a 5’ and 3’ HA were introduced by DNA donor oligonucleotides. The generated sgRNAs, donor oligos and Cas9 mRNA targeting Chrna2 were co-injected into zygotes (left). PCR analyses of floxed alleles at the targeted Chrna2 locus in genomic DNA extracted from the tails and IWAT of WT and Chrna2fl/fl mice (right).
(C) qPCR analyses of Chrna2 mRNA expression in differentiated primary inguinal preadipocytes of Chrna2fl/fl mice after transduction with adenoviral GFP or Cre recombinase (n = 6).
(D) Breeding strategy for the generation of adipose-specific Chrna2 knockout mice (Chrna2-adKO) (left). qPCR analyses of Chrna2 mRNA expression in IWAT from Chrna2fl/fl and Chrna2-adKO mice (n = 8 for fl/fl and 4 for adKO) (right).
(E) Intracellular calcium levels following stimulation with the CHRNA2 agonist nicotine (Nic, 500 μM) in differentiated primary inguinal preadipocytes from Chrna2fl/fl (n = 8) and Chrna2-adKO mice (n = 11).
(F and G) Body (F) and adipose tissue (G) weights of Chrna2fl/fl (n = 8) and Chrna2-adKO (n = 4) mice housed at room temperature on a chow diet.
(H) Fasting (4 h) blood glucose levels of Chrna2fl/fl (n = 4) and Chrna2-adKO (n = 5) mice.
(I-K) Representative H&E-stained images (I), qPCR analyses (n = 14 for fl/fl and 20 for adKO) (J), and basal and oligomycin-insensitive oxygen consumption rate (n = 6) (K) of IWAT from Chrna2fl/fl and Chrna2-adKO mice. Scale bar, 100 μm.
(L-N) Representative H&E-stained images (L), qPCR analyses (n = 11 for fl/fl and 8 for adKO) (M), and basal and oligomycin-insensitive oxygen consumption rate (n = 6) (N) of BAT from Chrna2fl/fl and Chrna2-adKO mice. Scale bar, 100 μm.
Data are presented as mean ± SEM. **p < 0.01, ***p < 0.005 by an unpaired two sample Student’s t-test for two-group comparisons. n.s., not significant (p > 0.1). See also Figure S1.
Inguinal Thermogenic Defects by Adipose-Specific Chrna2 Deletion
This newly generated mouse model with adipose-specific deletion of Chrna2 now allows us to directly test the hypothesis that the thermogenic defects observed in the IWAT of whole-body Chrna2 KO mice are mediated through an adipocyte-autonomous mechanism (Jun et al., 2018). We exposed Chrna2-adKO and control mice to chronic cold temperature (10°C for 2 weeks) and a blunted weight loss was observed in Chrna2-adKO mice compared to that observed in the control group with no differences in food intake (Figure 2A and Figure S2A). This was reflected in their higher fat content, along with their larger IWAT and VWAT mass, although no differences were seen in BAT mass between the two groups, which is consistent with the notion that the functional impact of CHRNA2 signaling is minimal in BAT (Figure 2B and C). Histological examination of Chrna2-adKO IWAT showed larger adipocytes compared to that of the control mice after cold exposure (Figure 2D). At the transcriptional level, thermogenic genes (Ucp1, Dio2, Prdm16, Cox8b, Atp5b, Lcad, Mcad, Atgl, Hsl and Vegf) were less induced upon chronic cold exposure in Chrna2-adKO mice (Figure 2E). Likewise, protein expression of UCP1 and mitochondrial oxidative phosphorylation complexes was significantly less induced in Chrna2-adKO IWAT (Figure 2F and G). These mice also exhibited less citrate synthase activity and mitochondrial DNA content in IWAT compared to that of the control animals (Figure 2H and Figure S2B). Consistent with these results, whole-body oxygen consumption (VO2) and energy expenditure as well as the local OCR of IWAT in Chrna2-adKO was lower in comparison to control with reduced utilization of both carbohydrate and fat substrates in the absence of Chrna2 (Figure 2I–K and Figure S2C–E). Additionally, lower glucose metabolism-related thermogenesis in Chrna2-adKO mice relative to controls was detected (Figure S2F and G). Given previous findings showing that CHRNA2-mediated thermogenic signaling is beige fat-selective (Jun et al., 2018), it was not surprising that no differences were seen in adipocyte histology or thermogenic responses in either BAT or VWAT from control and Chrna2-adKO mice (Figure 2L and Figure S2H–L), nor were any significant differences in shivering-related gene expression observed in the skeletal muscle (Figure S2M). In line with these findings, an impaired molecular thermogenic response to cold was seen in IWAT selectively when CHRNA2 signaling was deleted in Ucp1-expressing thermogenic adipocytes by crossing Chrna2fl/fl mice with Ucp1-Cre mice (Figure S2N and O). Together these results revealed an adipocyte-autonomous mechanism mediated through CHRNA2 that occurs primarily in the subcutaneous fat to control the thermogenic response to chronic cold exposure.
Figure 2. Inguinal thermogenic defects by adipose-specific Chrna2 deletion.
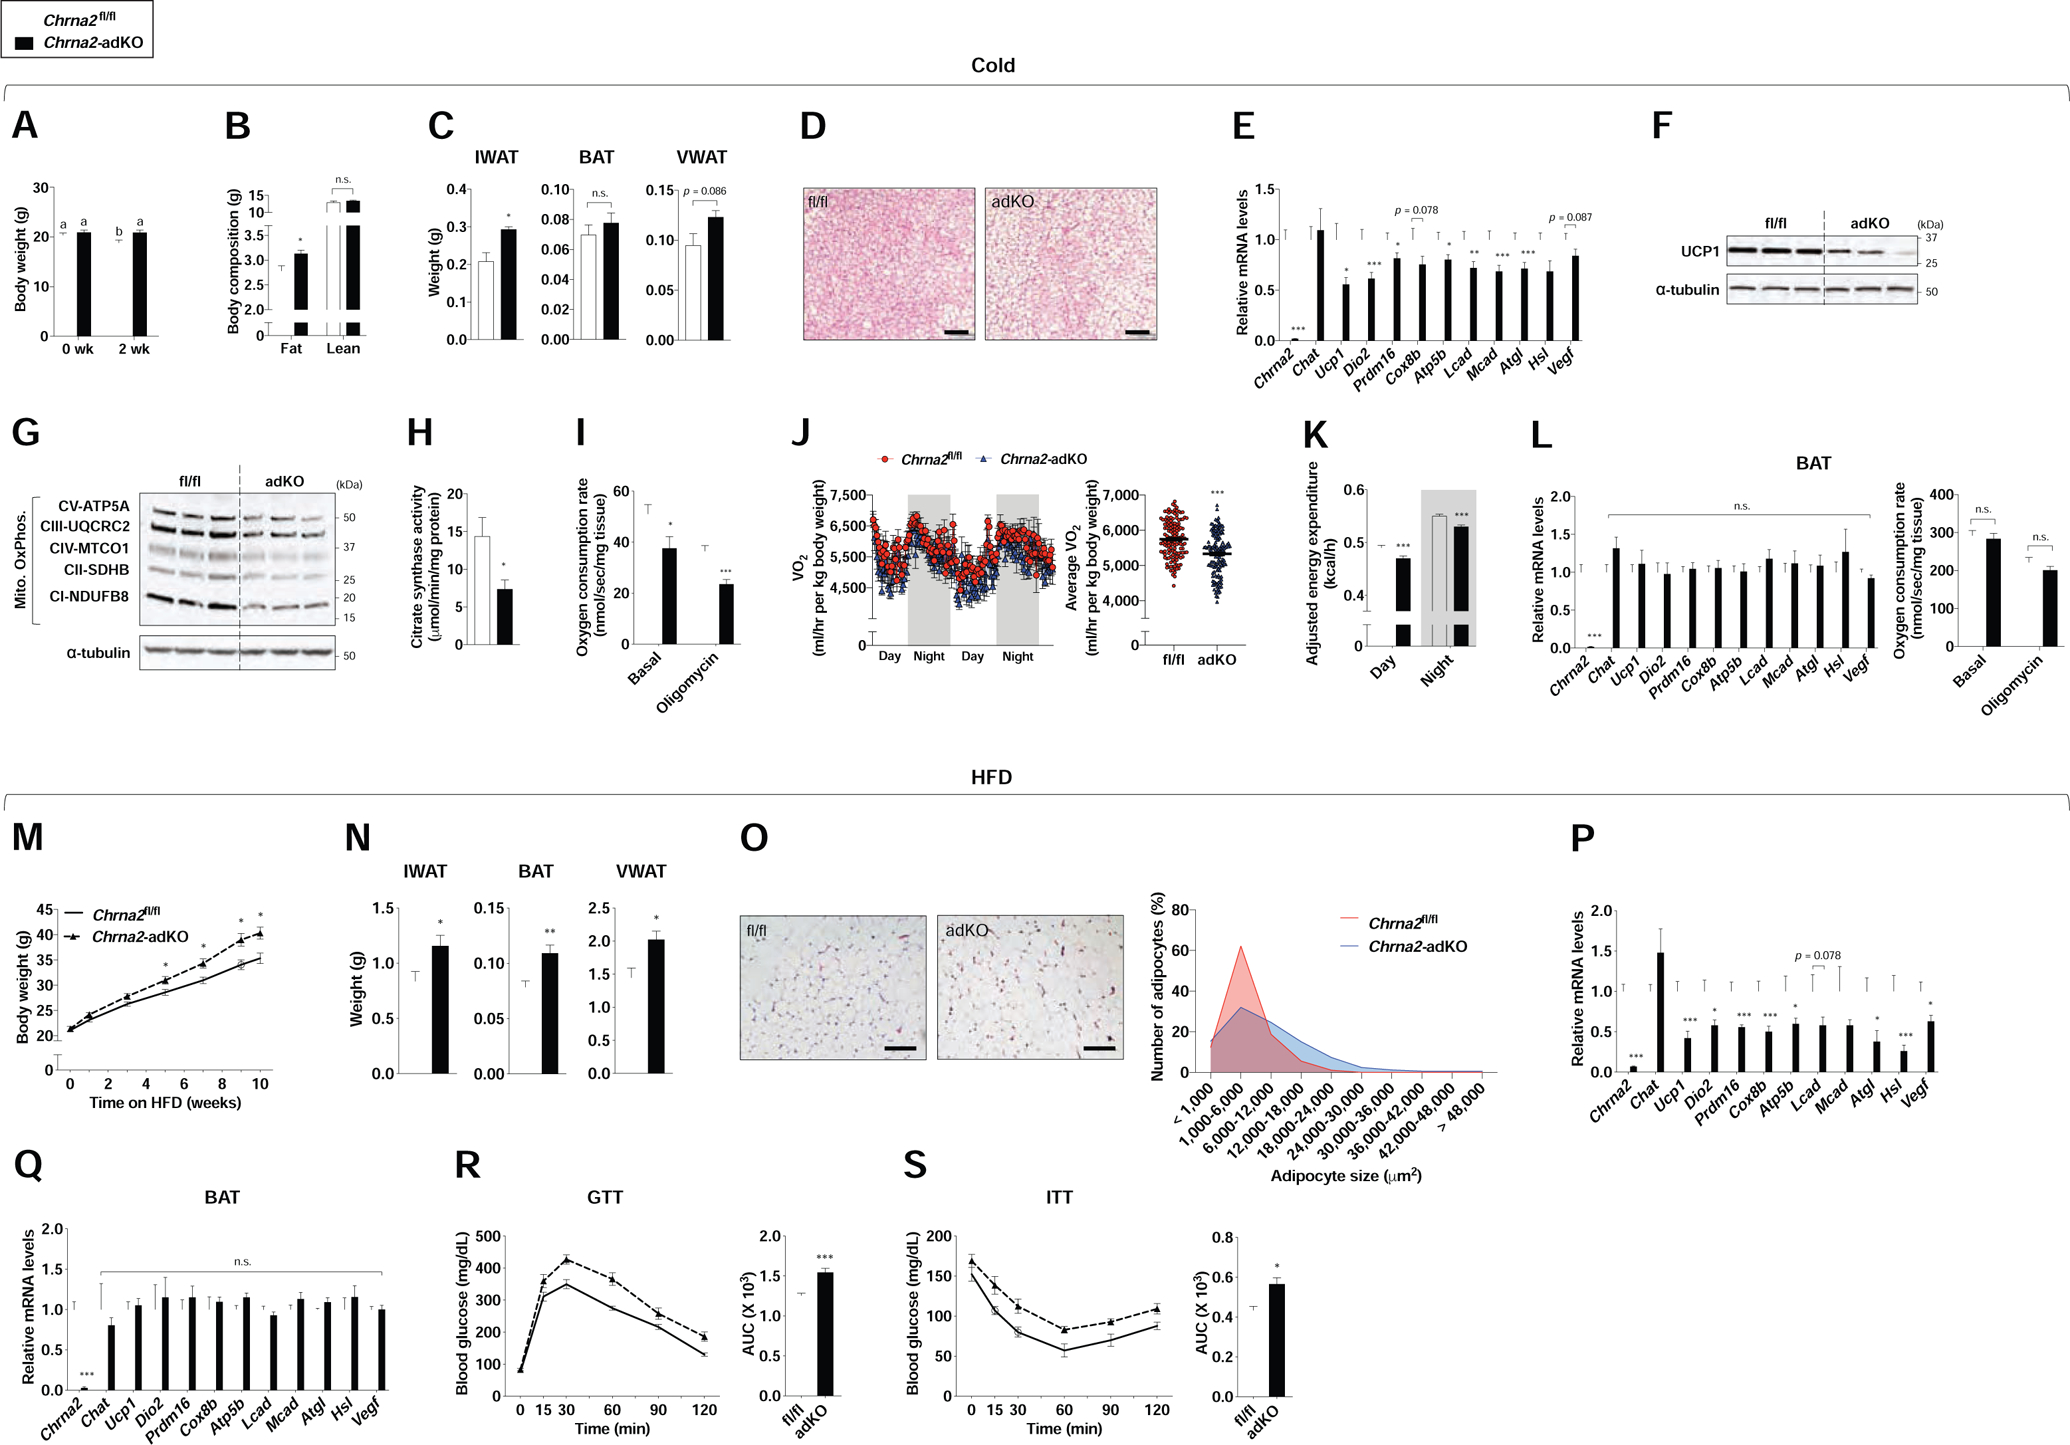
(A) Body weights of Chrna2fl/fl (n = 19) and Chrna2-adKO (n = 18) mice before and after cold exposure (CE) at 10°C for 2 weeks on a chow diet.
(B) Body composition of Chrna2fl/fl (n = 6) and Chrna2-adKO (n = 6) mice after CE.
(C) Adipose tissue weights of Chrna2fl/fl (n = 5) and Chrna2-adKO (n = 4) mice after CE.
(D) Representative H&E-stained images of IWAT from Chrna2fl/fl and Chrna2-adKO mice after CE. Scale bar, 100 μm.
(E) qPCR analyses of thermogenic gene expression in IWAT from Chrna2fl/fl (n = 17) and Chrna2-adKO (n = 20) mice after CE.
(F and G) Immunoblot analyses of UCP1 (F) and mitochondrial OxPhos components (G) in IWAT from Chrna2fl/fl and Chrna2-adKO mice after CE (n = 3). α-tubulin served as a loading control.
(H) Citrate synthase activity in homogenates of IWAT from Chrna2fl/fl (n = 6) and Chrna2-adKO (n = 8) mice following CE.
(I) Basal and oligomycin-insensitive oxygen consumption rate in freshly isolated IWAT from Chrna2fl/fl (n = 6) and Chrna2-adKO mice (n = 7) after CE.
(J) Whole-body O2 consumption (VO2) (left) and averaged VO2 (right) of Chrna2fl/fl (n = 7) and Chrna2-adKO (n = 5) mice after CE.
(K) Body weight-adjusted energy expenditure of Chrna2fl/fl (n = 7) and Chrna2-adKO mice (n = 5) after CE.
(L) qPCR analyses for thermogenic markers (n = 16 for fl/fl and 14 for adKO) (left) and basal and oligomycin-insensitive oxygen consumption rate (n = 6 for fl/fl and 9 for adKO) (right) of BAT from Chrna2fl/fl and Chrna2-adKO mice following CE.
(M) Changes in body weights of Chrna2fl/fl (n = 11) and Chrna2-adKO (n = 5) mice upon high-fat diet (HFD) feeding.
(N) Fat mass of Chrna2fl/fl (n = 10) and Chrna2-adKO (n = 7) mice after 11 weeks on HFD.
(O) Representative H&E-stained images (left) and distribution of adipocyte size (right) of IWAT from Chrna2fl/fl and Chrna2-adKO mice after HFD challenge. Scale bar, 100 μm.
(P and Q) qPCR analyses for thermogenic markers of IWAT (P) and BAT (Q) from Chrna2fl/fl (n = 5) and Chrna2-adKO (n = 7) mice following HFD feeding.
(R and S) Glucose tolerance test (GTT) (R) and insulin tolerance test (ITT) (S) in Chrna2fl/fl (n = 5) and Chrna2-adKO (n = 7) mice after 9 and 10 weeks on HFD, respectively. AUC, area under the curve.
Data are presented as mean ± SEM. *p < 0.05, **p < 0.01 and ***p < 0.005 by an unpaired two sample Student’s t-test for two-group comparisons. A different letter means a significant difference among groups at p < 0.05 by a one-way analysis of variance (ANOVA). n.s., not significant (p > 0.1). See also Figure S2.
To understand the significance of fat-specific CHRNA2 signaling in systemic metabolic homeostasis, we challenged Chrna2fl/fl and Chrna2-adKO mice with HFD. Upon HFD feeding, Chrna2-adKO mice showed greater body weight gain than control animals without differences in food intake as a result of higher fat mass in all three major fat depots, IWAT, VWAT and BAT (Figure 2M and N and Figure S2P and Q). Histological and quantitative analyses of inguinal adipocyte size confirmed that Chrna2-adKO mice had lower frequency of small-sized adipocyte but higher frequency of large-sized adipocyte compared to controls (Figure 2O). IWAT of HFD-fed Chrna2-adKO mice expressed lower levels of thermogenic gene expression than that of controls, whereas this effect was not seen in BAT (Figure 2P and Q). HFD feeding caused significantly higher levels of macrophage-related inflammatory and NADPH oxidase-related oxidative stress gene expression in VWAT of Chrna2-adKO mice relative to that of control mice (Figure S2R). Chrna2-adKO mice showed significantly impaired glucose tolerance and insulin sensitivity compared to control animals, assayed after chronic HFD feeding (Figure 2R and S). Together, these data indicate that CHRNA2 signaling in adipocytes plays an important role in systemic energy homeostasis and protects the organism against metabolic stress.
Activation of CHRNA2 Signaling in IWAT during Acute Calorie Overload
Following acute high caloric intake, compensatory increases in energy expenditure are initiated to appropriately restore energy homeostasis via a process, referred to as diet-induced thermogenesis (Leibel et al., 1995). This phenomenon is mediated, at least in part, by thermogenic fat (Bachman et al., 2002; Hibi et al., 2016; Rothwell and Stock, 1979). UCP1 and β-ARs are well-known molecular mediators that facilitate diet-induced thermogenesis in fat (Bachman et al., 2002; Feldmann et al., 2009). However, the thermogenic pathways driven by these candidates are not sufficient to explain the mechanism of diet-induced thermogenesis (Anunciado-Koza et al., 2008; Thomas and Palmiter, 1997). We next investigated how CHRNA2 signaling may respond to metabolic fluctuation following acute excess calorie intake.
Expression of genes encoding catecholamine synthesis machinery (Th, Dbh and Ddc) and ARs (nine subtypes including Adra1a, Adra1b, Adra1d, Adra2a, Adra2b, Adra2c, Adrb1, Adrb2 and Adrb3; adrenergic thermogenic regulators) was broadly upregulated in the IWAT of wild-type (WT) mice fed a HFD for 3 days, as were levels of Chrna2 and the acetylcholine synthesis enzyme Chat (cholinergic thermogenic regulators) (Figure 3A). This gene activation continued following 10 days of HFD (Figure S3A). Thermogenic activation can occur in unison with or independent of the mitochondrial uncoupling activity of UCP1 in mammalian subcutaneous fat (Ikeda et al., 2017; Kazak et al., 2015). Creatine has been reported to stimulate ADP-dependent respiration through substrate cycling in Ucp1-deleted beige fat (Kazak et al., 2015). A recent study revealed that creatine energetics participates in diet-induced thermogenesis in murine subcutaneous fat (Kazak et al., 2017). Thermogenic genes including Ucp1, Prdm16 and Cox8b were upregulated following 3 days of HFD, in addition to mild induction of Gatm (creatine biosynthesis) and Ckmt2 (mitochondrial creatine kinase), hallmarks of thermogenic creatine energetics (Figure 3B).
Figure 3. Activation of CHRNA2 signaling in IWAT during acute calorie overload.
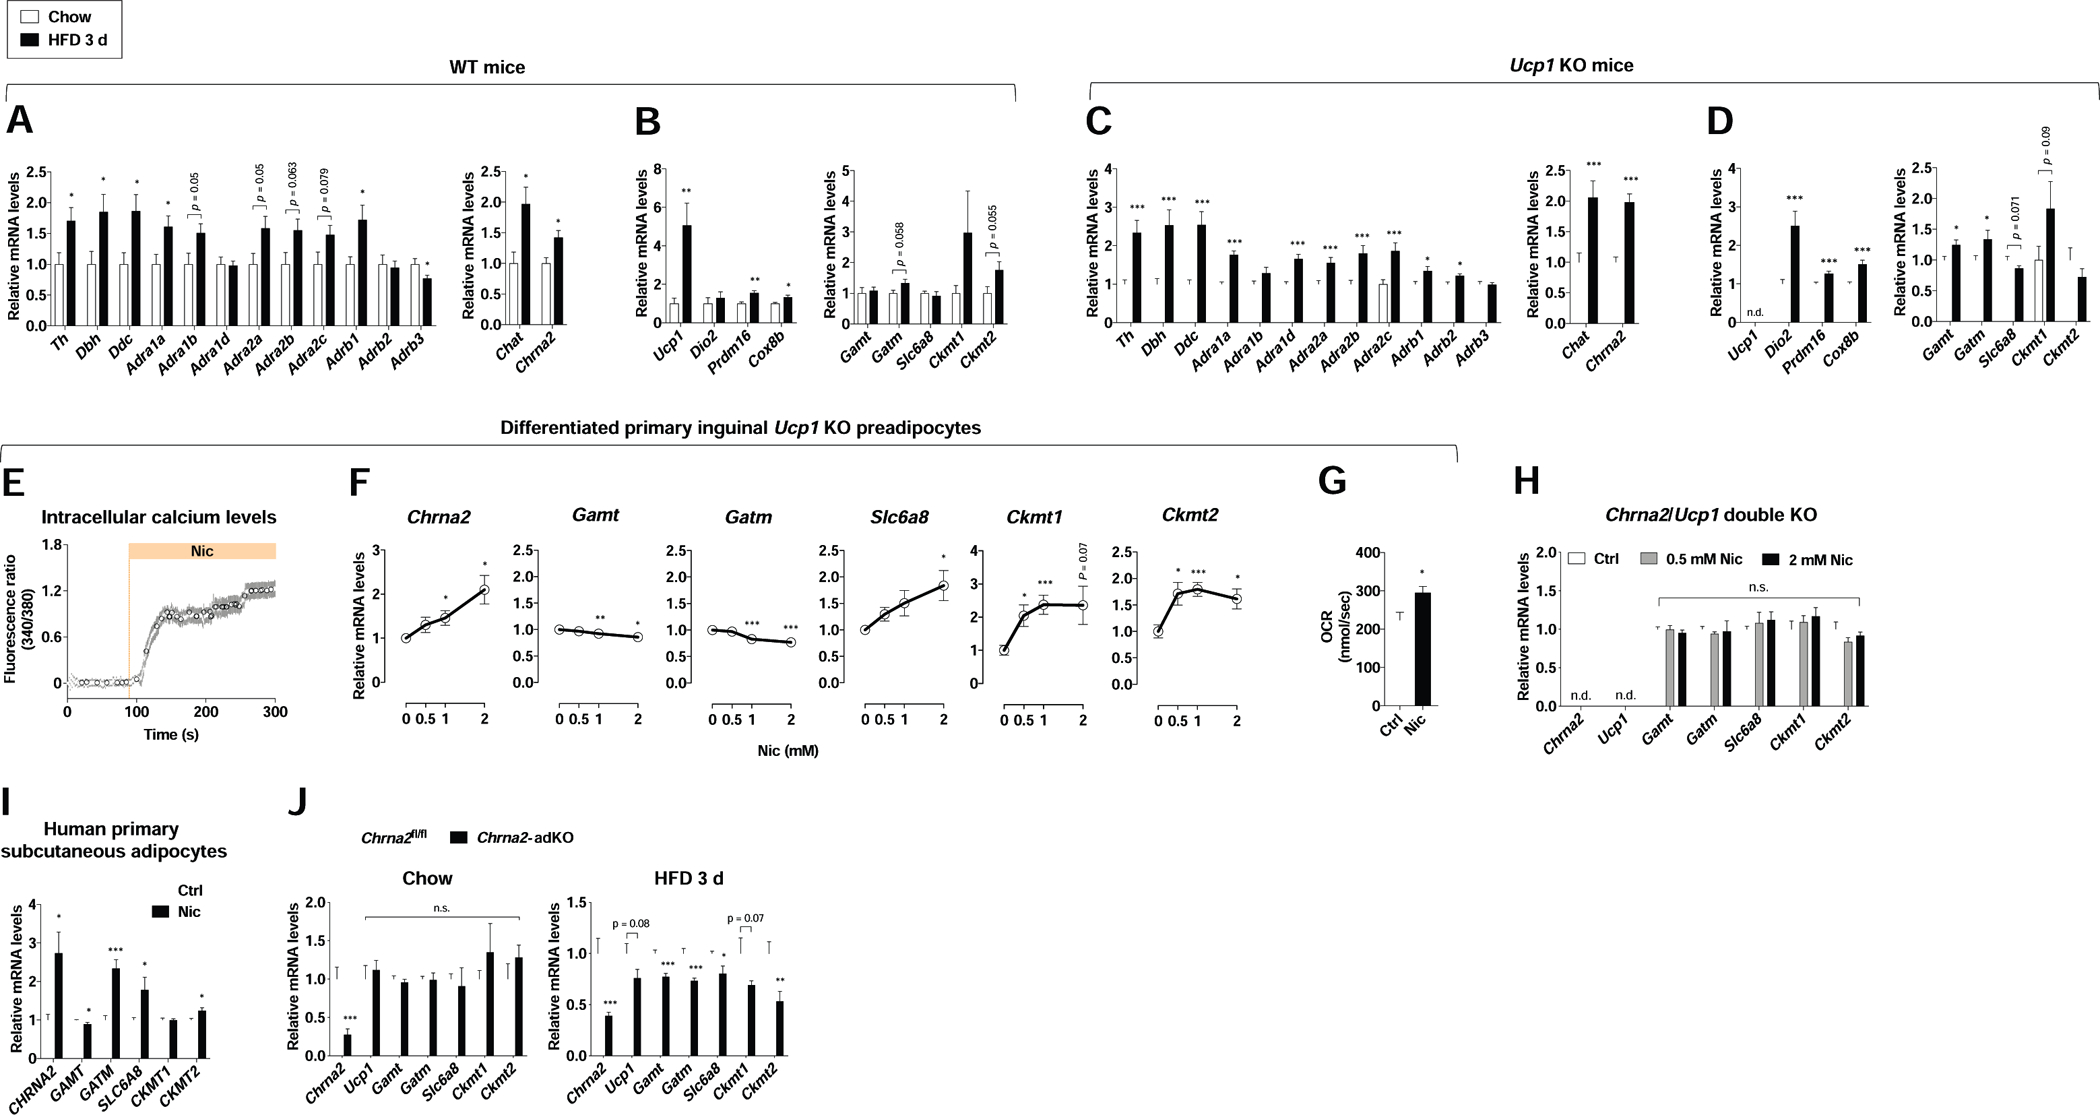
(A) qPCR analyses for upstream regulators of thermogenesis (β-AR signaling, left; CHRNA2 signaling, right) in IWAT from WT mice fed chow (n = 6) or HFD (n = 7) for 3 days at room temperature.
(B) qPCR analyses for downstream markers of thermogenesis (classical thermogenic markers, left; creatine metabolism-related genes, right) in IWAT from WT mice fed chow (n = 6) or HFD (n = 7) for 3 days at room temperature.
(C and D) qPCR analyses for upstream regulators (C) and downstream markers (D) of thermogenesis in IWAT from Ucp1 KO mice fed chow (n = 30) or HFD (n = 28) for 3 days at room temperature.
(E) Upregulation of intracellular calcium levels in response to the CHRNA2 agonist nicotine (Nic, 500 μM) in differentiated primary inguinal preadipocytes from Ucp1 KO mice (n = 11), indicating the presence and activation of CHRNA2 signaling in Ucp1 KO adipocytes.
(F) qPCR analyses of Chrna2 and creatine metabolism-related gene expression in differentiated primary inguinal preadipocytes from Ucp1 KO mice after treatment with the indicated concentration of Nic for 6 hours (n = 5 for controls and 6 for 0.5, 1, and 2 mM Nic).
(G) Basal oxygen consumption rate in differentiated primary inguinal preadipocytes from Ucp1 KO mice that were exposed to vehicle control (Ctrl) or 2 mM Nic for 6 hours (n = 6).
(H) qPCR analyses of creatine metabolism-related gene expression in differentiated primary inguinal preadipocytes isolated from Chrna2/Ucp1 double KO mice after stimulation with vehicle (Ctrl) or the indicated concentration of nicotine (Nic) for 6 hours (n = 6).
(I) qPCR analyses of CHRNA2 and creatine metabolism-related gene expression in differentiated human primary ASCs from the subcutaneous depot following stimulation with vehicle (Ctrl) or 2 mM Nic for 6 hours (n = 3).
(J) qPCR analyses of Chrna2, Ucp1 and creatine metabolism-related gene expression in IWAT of Chrna2fl/fl and Chrna2-adKO mice housed at RT on a chow diet (n = 8 for fl/fl and 4 for adKO) (left) or HFD for 3 days (n = 9) (right).
Data are presented as mean ± SEM. *p < 0.05, **p < 0.01 and ***p < 0.005 by an unpaired two sample Student’s t-test for two-group comparisons. n.s., not significant (p > 0.1). n.d. not detected. See also Figure S3.
It has been reported that creatine-dependent thermogenic mechanism plays a predominant role in the absence of UCP1. (Kazak et al., 2015). Therefore, we exposed Ucp1 KO mice to acute HFD to test whether CHRNA2 signaling plays a role in UCP1-independent thermogenesis. In IWAT of Ucp1 KO mice, activation of genes for catecholamine synthesis and ARs was seen after acute HFD challenge, as well as Chat and Chrna2 (Figure 3C). This trend was similarly observed in downstream thermogenic genes Dio2, Prdm16 and Cox8b, in addition to creatine metabolism genes, such as Gamt, Gatm and Ckmt1 (Figure 3D). We further confirmed that the transcriptional induction of Chrna2 and downstream thermogenic markers remained evident at thermoneutrality, consistent with previous reports that diet-induced thermogenesis can be sufficiently activated in the absence of thermal stress (Feldmann et al., 2009; Kazak et al., 2017) (Figure S3B).
We validated that the gene expression pattern of Chrna2, its inducibility in response to thermogenic stimuli and its functionality when treated with agonists were all unaffected by the absence of UCP1 in inguinal adipocytes (Figure 3E and Figure S3C–E). These allowed us to further investigate the role of CHRNA2 signaling in creatine-mediated beige thermogenesis in an adipocyte-autonomous manner. In differentiated primary inguinal preadipocytes from Ucp1 KO mice, Chrna2 and creatine metabolism genes were elevated by nicotine treatment (however, creatine biosynthesis genes Gamt and Gatm are mildly repressed in the conditions we tested) (Figure 3F) and this was accompanied by an increase in cellular OCR (Figure 3G). However, an induction of nicotine-dependent creatine metabolism gene expression was not seen when Chrna2 was deleted (Figure 3H). These findings are consistent with results from human primary subcutaneous adipose-derived stromal cells (ASCs), in which expression of CHRNA2, GATM, SLC6A8 and CKMT2 was activated following nicotine stimulation (Figure 3I). In line with these observations, we found that adipose-specific Chrna2 deletion indeed caused defects in diet-induced thermogenic response of IWAT with a significantly lower thermogenic gene expression in IWAT than controls after acute HFD feeding (Figure 3J). These effects persisted as HFD challenge continued in fat-specific Chrna2 KO mice (Figure S3F). Similarly, IWAT of whole-body Chrna2 KO mice expressed significantly lower thermogenic genes compared to that of control WT mice after prolonged HFD feeding (Figure S3G), leading to impaired whole-body energy expenditure as a metabolic consequence of the accumulative thermogenic defects (Jun et al., 2018). Interestingly, CHRNA2 signaling did not affect SERCA2b-mediated calcium cycling, a separate Ucp1-independent thermogenic regulatory pathway (Figure S3H–J). This is consistent with notion that CHRNA2 signaling was mediated via external Ca2+ influx (Figure S3K), whereas SERCA2b-mediated calcium cycling is dependent on internal Ca2+ release or cycling through endoplasmic reticulum. These results suggest that the activation of CHRNA2 signaling may integrate UCP1 and creatine pathways to facilitate diet-induced thermogenesis in subcutaneous fat.
Activation of CHRNA2 Signaling in IWAT in the Absence of β-AR Signaling upon Cold
The recent discovery of a developmentally-distinct subtype of thermogenic beige fat cell that relies on enhanced glucose oxidation has further consolidated our understanding of thermogenic mechanisms (Chen et al., 2019). This glycolytic beige fat is particularly relevant in the absence of β-AR signaling, and emerges from Myod-expressing progenitors through the action of the transcriptional regulator GABPα (Chen et al., 2019). To investigate whether the β-adrenergic-independent CHRNA2 signaling is involved in g-beige fat function, we pre-treated WT mice with the β-blocker propranolol or vehicle for 5 days at room temperature, then housed these mice at room temperature or 15°C for a further 5 days with the same treatment. Mice administered with β-blocker exhibited over 2-fold higher mRNA expression of Myod in inguinal stromal vascular fraction (SVF), indicating that the g-beige fat lineage is being recruited when β-adrenergic signaling is transiently blocked. Furthermore, expression levels of Chrna2 and g-beige fat metabolic genes were increased in the IWAT of these β-blocker-injected mice after cold exposure without mitochondrial dysfunction (Figure S4A and B). The simultaneous activation of CHRNA2 and the g-beige fat program is consistent with our hypothesis that these two β-adrenergic-independent pathways may coordinate with each other in regulating beige fat function. We further tested this hypothesis using β-less mice, in which β-AR signaling is genetically ablated. In the absence of β-ARs, Chrna2 expression is enriched in adipocytes and can be induced in response to stimulation with the PPARγ agonist rosiglitazone or second messenger cAMP, similar to what was observed in WT inguinal fat cells (Jun et al., 2018) (Figure 4A and B). Following treatment with the pan β-AR agonist isoproterenol, no activation of Chrna2 and Ucp1 was observed, confirming the ablation of the β-adrenergic receptors (Figure 4B). Importantly, we confirmed that CHRNA2 forms a functional calcium ion channel that can be activated by its agonists to trigger the downstream pathway in β-ARs KO inguinal adipocytes (Figure 4C and Figure S4C). Similar to what was observed in the pharmacologically blockaded model, Myod expression was higher in β-less inguinal SVF compared to that in control counterparts. The co-induction of Chrna2 and glucose metabolism genes was also observed in the IWAT of cold-exposed β-less animals with enhanced mitochondrial activity and no detectable mitochondrial damages (Figure 4D–F and Figure S4D and E). It has been reported that the β3-AR predominantly expresses in mature adipocytes whereas β1-AR expression is enriched in preadipocytes (Cannon and Nedergaard, 2004), and the relative contribution of β2-AR signaling in thermogenic fat regulation is minimal in mice (Fernandes et al., 2014). To evaluate the relative contribution of β-adrenergic signaling that occurs at the precursor or mature adipocyte stages in g-beige fat recruitment, we utilized β1WT (β1-AR WT allele was bred back into the β-less background, lacking β2 and β3-AR) and β3WT (β3-AR WT allele was bred back into β-less background, lacking β1 and β2-AR) mouse strains (Figure S4F). We found that the partial blockage of β-adrenergic signaling in these mice is still sufficient to activate the g-beige program to some extent (Figure 4G and H). However, only a modest Myod induction was observed in β1WT, consistent with the notion that g-beige cell fate determination largely occurs at the precursor recruitment phase. We further tested whether the activated CHRNA2 signaling indeed mediates g-beige fat function in a cell-autonomous manner in differentiated primary inguinal preadipocytes from β-less mice. In the presence of nicotine, CREB was phosphorylated and the expression of Ucp1 was elevated in these cells (Figure 4I and J), consistent with our previous observations (Jun et al., 2018). Nicotine stimulation also led to an increase in glucose metabolism gene expression and at the functional level, both the abundance of lactate, a product of glycolysis, and the OCR were elevated when CHRNA2 signaling was activated by its agonist nicotine in β-less inguinal adipocytes (Figure 4J–L). These data suggest that CHRNA2 signaling may directly activates g-beige fat. It is of note, animal studies showed that the recruitment of g-beige fat was significantly blunted in IWAT of Chrna2 KO mice compared to that of control mice upon cold, but not completely absent (Figure S5A–C), implicating additional unknown regulatory pathway(s) may be involved in g-beige fat formation in vivo. Detailed understanding how these pathways interact with each other will continue to evolve as more mechanistic insights of each signaling pathway and new ones are revealed.
Figure 4. Activation of CHRNA2 signaling in IWAT in the absence of β-AR signaling.
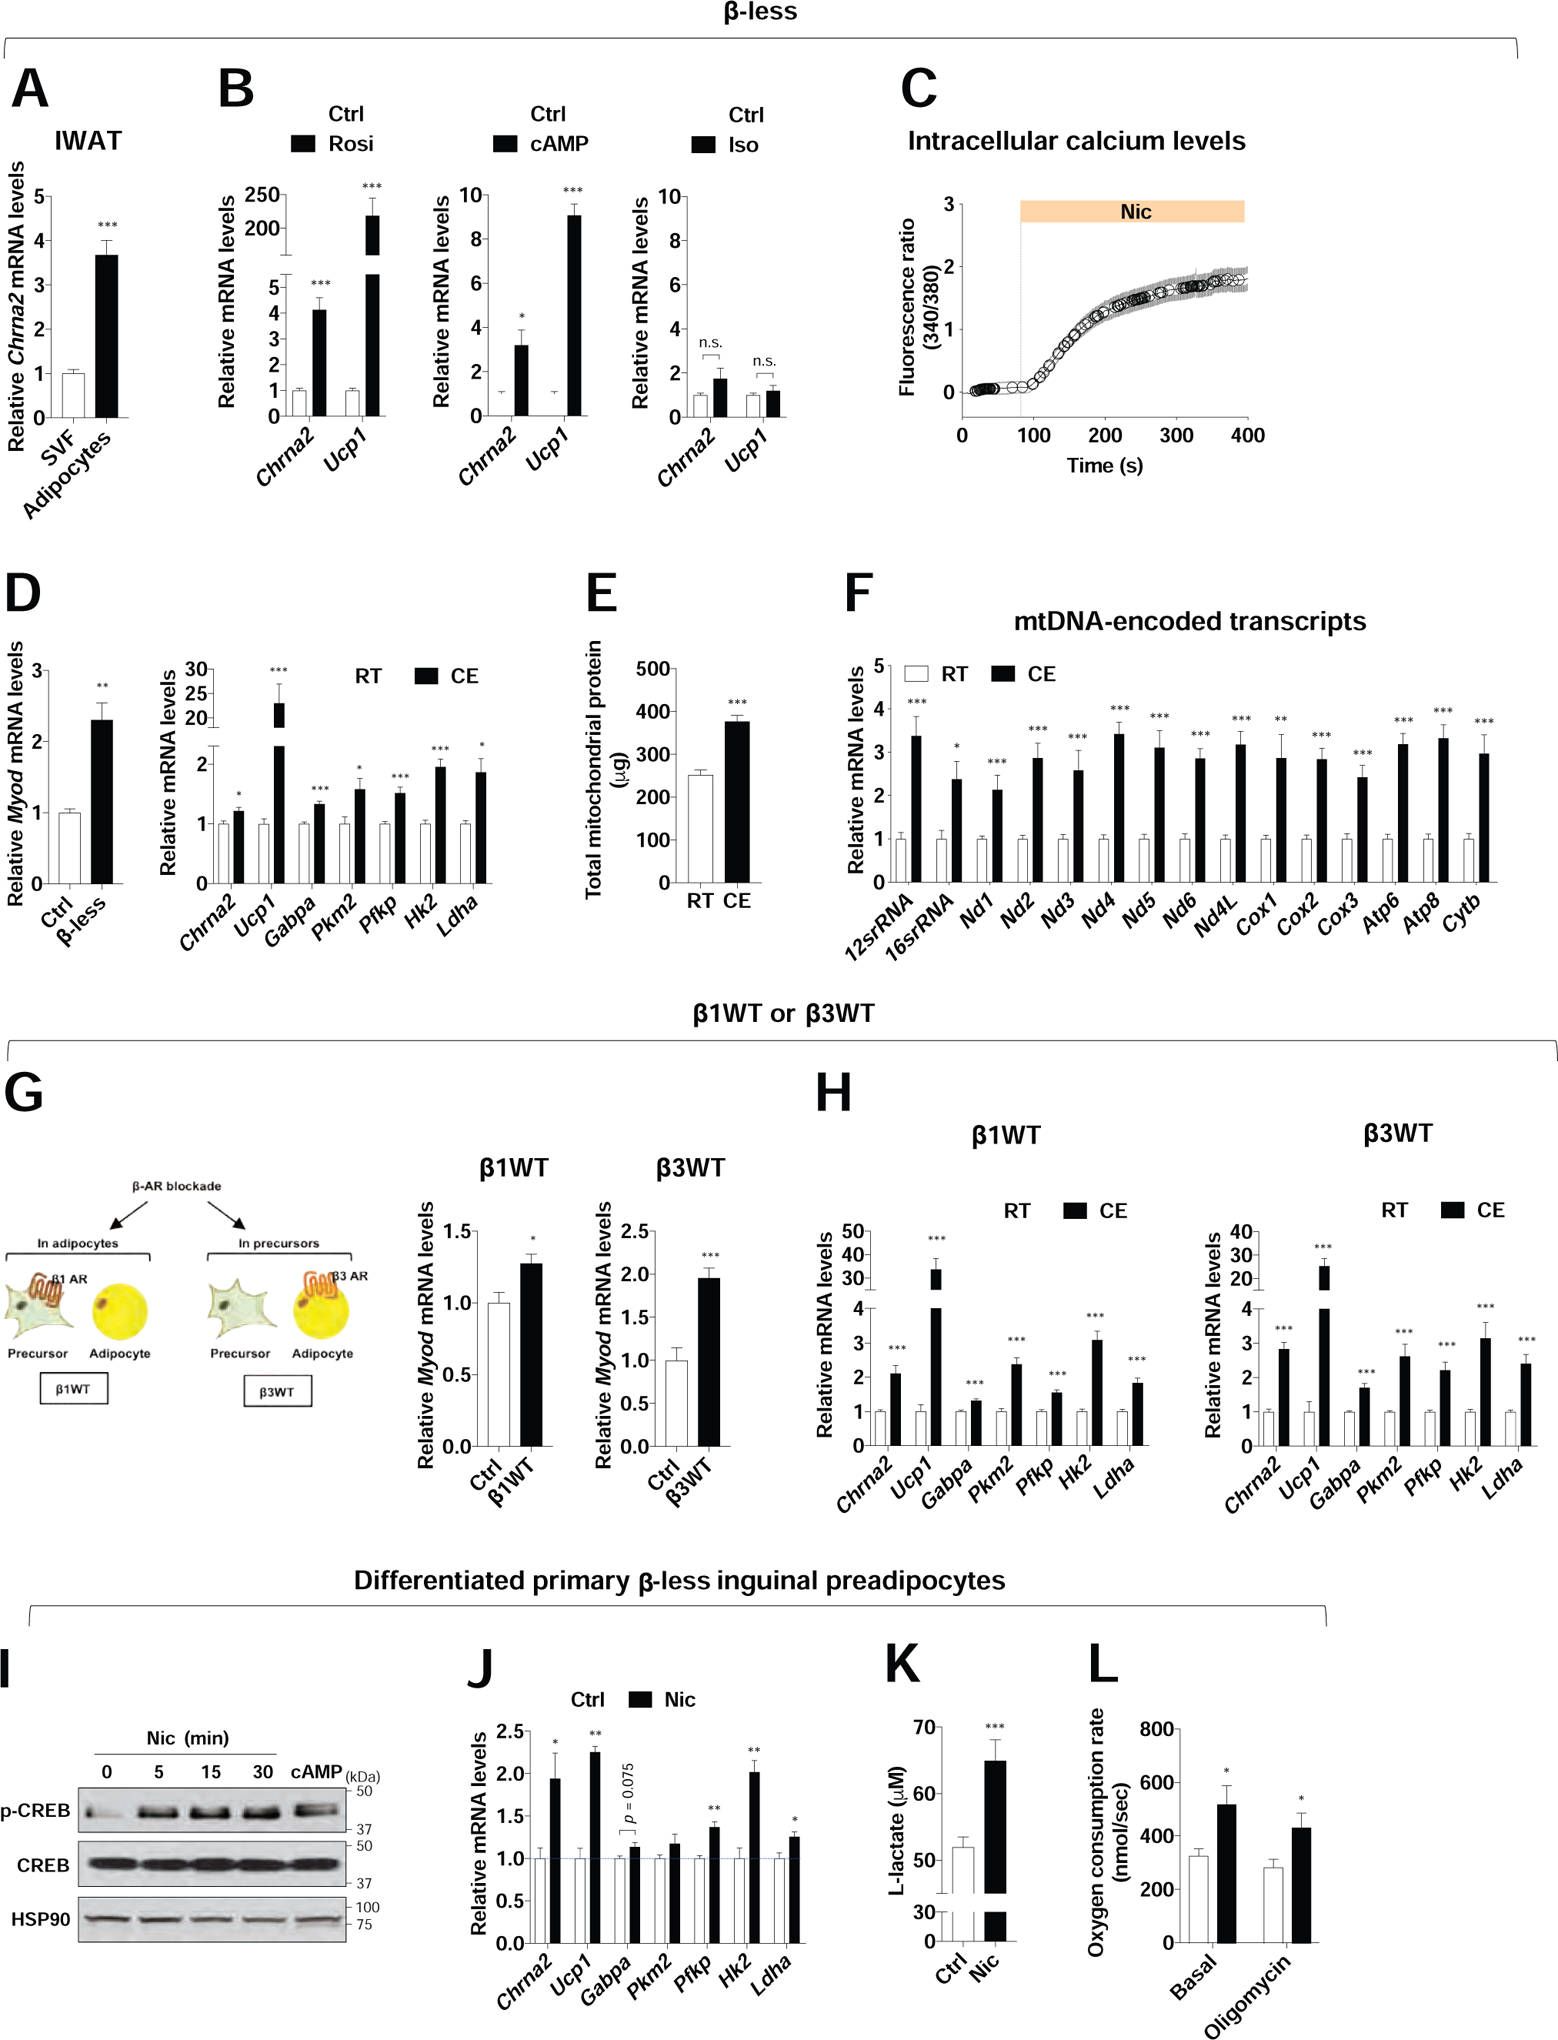
(A) qPCR analyses of Chrna2 mRNA levels in the stromal vascular fraction (SVF) and mature adipocytes of IWAT from β-less mice housed at room temperature on a chow diet (n = 6).
(B) qPCR analyses of Chrna2 and Ucp1 mRNA levels in differentiated primary inguinal preadipocytes from β-less mice after treatment with vehicle (Ctrl), 1 μM rosiglitazone (Rosi) for 2 days, 500 μM dibutyryl-cAMP (cAMP) for 4 hours or 10 μM isoproterenol (Iso) for 4 hours (n = 4).
(C) Upregulation of intracellular calcium levels in response to the CHRNA2 agonist nicotine (Nic, 500 μM) in differentiated primary inguinal preadipocytes from β-less mice (n = 24), indicating the presence and activation of CHRNA2 signaling in β-ARs-deleted adipocytes.
(D) qPCR analyses of Myod mRNA levels in inguinal SVF of control (Ctrl) and β-less mice (n = 3) (left). qPCR analyses of Chrna2, Ucp1 and glucose metabolism gene expression in IWAT of β-less mice housed at room temperature (RT) (n = 4) or 15°C (CE) (n = 6) for 5 days (right).
(E) Total mitochondrial protein mass of IWAT per mouse from β-less mice housed at RT (n = 8) or CE (n = 10).
(F) qPCR analyses of mitochondrial DNA-encoded transcripts in IWAT from β-less mice housed at RT or CE (n = 6).
(G) Mouse models for genetic deletion of β-AR signaling at the adipocyte (β1WT) or precursor (β3WT) level in IWAT (left). qPCR analyses of Myod mRNA levels in inguinal SVF of control, β1WT (n = 6 for Ctrl and 8 for β1WT) (middle) and β3WT (n = 7 for Ctrl and 4 for β3WT) (right) housed at RT.
(H) qPCR analyses of Chrna2, Ucp1 and glucose metabolism gene expression in IWAT of β1WT (n = 16 for RT and 20 for CE) (left) and β3WT (n = 14 for RT and 16 for CE) (right) mice housed at RT or CE.
(I) Immunoblot analyses for phosphorylation of CREB in differentiated primary inguinal preadipocytes isolated from β-less mice in the presence of 2 mM nicotine (Nic) for indicated time or 500 μM dibutyryl-cAMP (cAMP) for 15 minutes. HSP90 served as a loading control.
(J) qPCR analyses of Chrna2, Ucp1 and glucose metabolism gene expression in differentiated primary inguinal β-less preadipocytes that were stimulated with vehicle (Ctrl) or 2 mM Nic for 6 hours (n = 3).
(K and L) Intracellular L-lactate levels (n = 20) (K) and basal and oligomycin-insensitive oxygen consumption rate (n = 6 for Ctrl and 5 for Nic) (L) in differentiated primary inguinal β-less preadipocytes following treatments with vehicle (Ctrl) or 2 mM Nic for 6 hours.
Data are presented as mean ± SEM. *p < 0.05, **p < 0.01 and ***p < 0.005 by an unpaired two sample Student’s t-test for two-group comparisons. n.s., not significant (p > 0.1). See also Figure S4.
The Role of CHRNA2 in Glycolytic Beige Fat Recruitment
We have previously demonstrated that CHRNA2 signaling is activated during canonical beige fat activation in the presence of β-adrenergic signaling (Jun et al., 2018). To investigate how Chrna2 is activated in non-canonical g-beige fat, we directly tested whether the key regulator of g-beige fat, GABPα may be involved (Figure 5A). Because g-beige fat is originated from Myod+ progenitors in subcutaneous fat, we first tested whether this specific subpopulation of beige adipocytes indeed has a functional CHRNA2 signaling using calcium imaging assay. Intracellular calcium levels were significantly induced in response to the CHRNA2 agonist nicotine or acetylcholine in Myod+-derived g-beige adipocytes, indicating the activation of functional CHRNA2 signaling (Figure 5B). However, when we knocked down Gabpa in Myod+-derived g-beige adipocytes Chrna2 was markedly suppressed relative to controls, strongly suggesting the potential role of CHRNA2 in GABPα-mediated g-beige fat recruitment (Figure 5C).
Figure 5. The role of CHRNA2 in glycolytic beige fat recruitment.
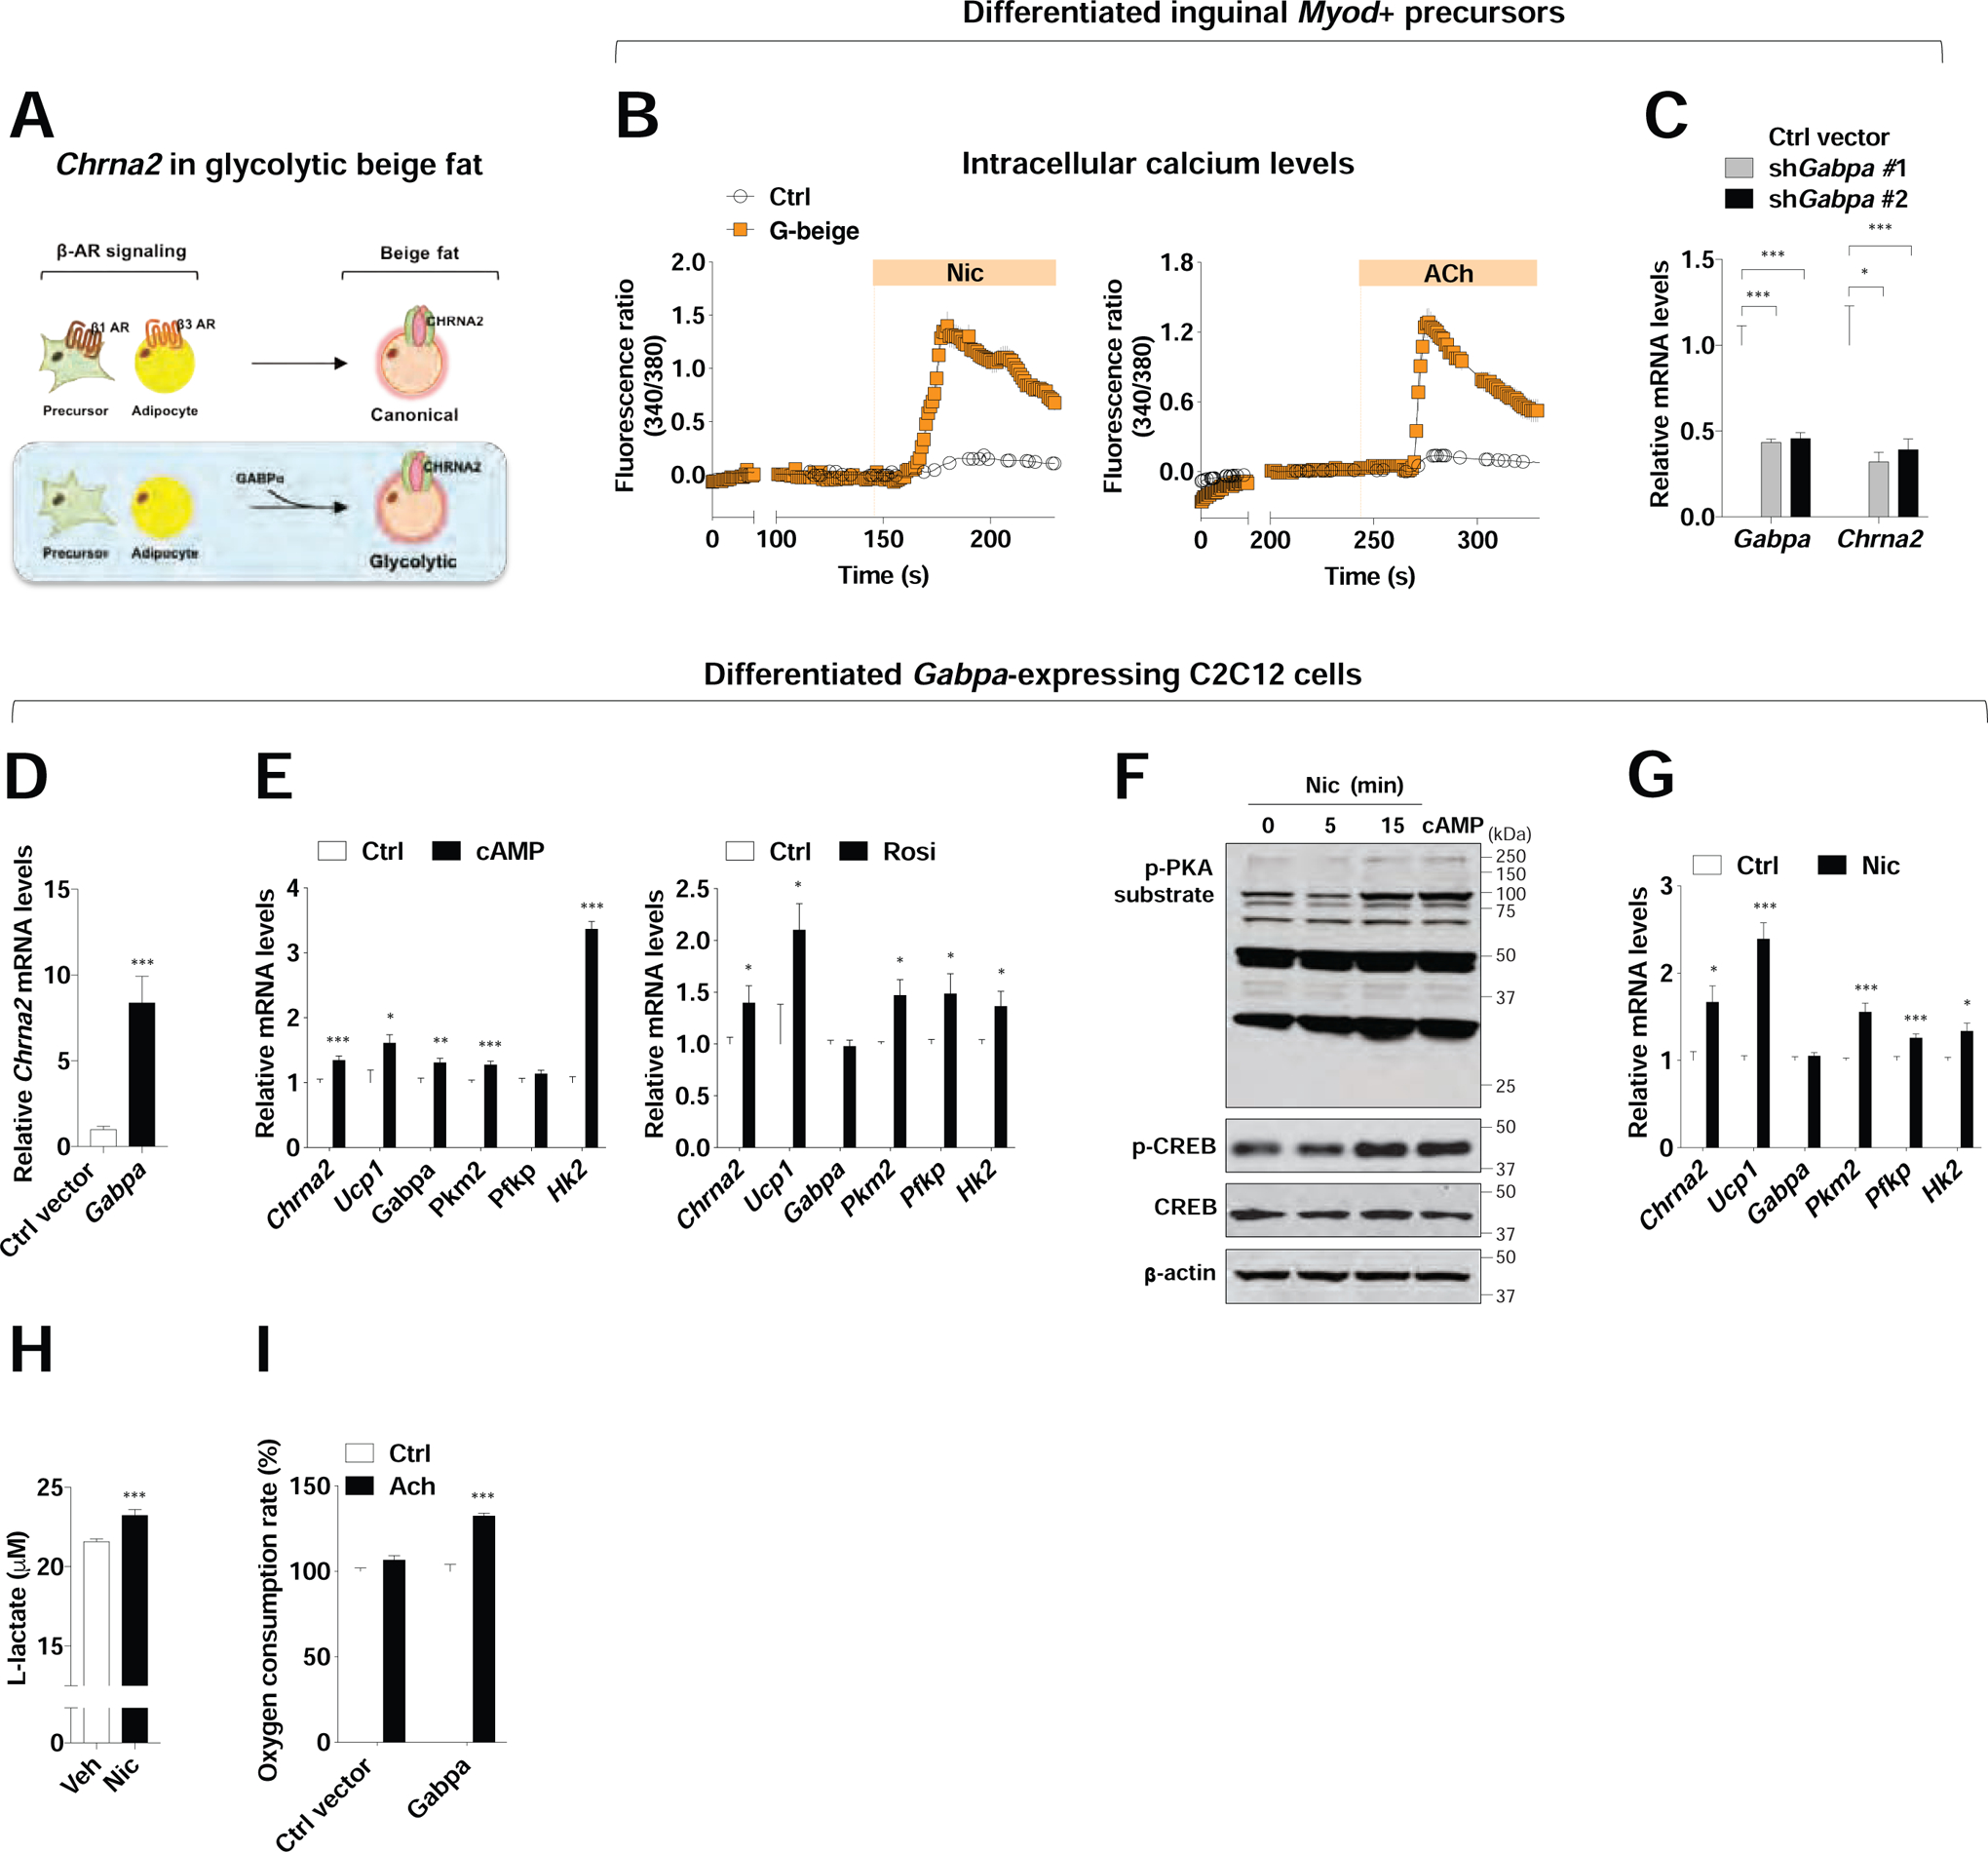
(A) The hypothesis that Chrna2 is induced during glycolytic beige fat (g-beige fat) recruitment mediated by GABPα.
(B) Increased intracellular calcium levels in the presence of the CHRNA2 agonist nicotine (Nic, 500 μM) (n = 12) or acetylcholine (ACh, 100 μM) (n = 6) in differentiated Myod+-derived g-beige adipocytes. No responses in non-differentiated control cells to the agonists (n = 13 for Nic and 16 for ACh).
(C) qPCR analyses of Gabpa (n = 7 for empty vector and 6 for shRNA) and Chrna2 (n = 5) in Myod+-derived glycolytic beige adipocytes expressing empty vector or Gabpa shRNA.
(D) qPCR analyses of Chrna2 mRNA levels in differentiated C2C12 cells expressing empty vector or Gabpa under pro-adipogenic conditions (n = 8).
(E) qPCR analyses of Chrna2, Ucp1 and glucose metabolism gene expression in differentiated C2C12 cells expressing Gabpa following stimulation with vehicle (Ctrl), 500 μM dibutyryl-cAMP (cAMP) for 6 hours (n = 6) (left), or 1 μM rosiglitazone (Rosi) for 4 days (n = 6) (right).
(F) Immunoblot analyses for phosphorylation of PKA substrate and CREB in differentiated C2C12 cells expressing Gabpa in the presence of 2 mM Nic for indicated time or 500 μM dibutyryl-cAMP (cAMP) for 15 minutes. β-actin served as a loading control.
(G) qPCR analyses of Chrna2, Ucp1 and glucose metabolism gene expression in differentiated C2C12 cells expressing Gabpa following treatment with vehicle (Ctrl) or 2mM Nic for 6 hours (n = 4).
(H) Intracellular L-lactate levels in differentiated C2C12 cells expressing Gabpa following treatment with vehicle (Ctrl) or 2 mM Nic for 6 hours (n = 12).
(I) CHRNA2 agonist ACh (500μM for 30 minutes)-induced oxygen consumption rate in differentiated C2C12 cells expressing empty vector or Gabpa under pro-adipogenic conditions (n = 10).
Data are presented as mean ± SEM. *p < 0.05, **p < 0.01 and ***p < 0.005 by an unpaired two sample Student’s t-test for two-group comparisons. See also Figure S5.
Next, we used Gabpa-expressing C2C12 myoblasts, which under pro-adipogenic conditions can differentiate into g-beige fat (Chen et al., 2019), to examine how CHRNA2 signaling affects the function of g-beige adipocytes. Chrna2 was enriched in differentiated C2C12 myoblasts expressing Gabpa under pro-adipogenic conditions, and it was further induced in response to thermogenic stimuli, such as cAMP and rosiglitazone, along with increased Ucp1 and glucose metabolism gene expression (Figure 5D and E and Figure S5D). A functional CHRNA2 signaling was detected upon stimulation with its agonist nicotine or acetylcholine in these cells, assessed using calcium imaging assay (Figure S5E). Increased phosphorylated PKA substrate and CREB, induced glucose metabolism gene expression as well as Ucp1 in the presence of nicotine were observed in these Gabpa-expressing C2C12 cells (Figure 5F and G). We further examined cellular glycolysis and OCR to test whether the activation of CHRNA2 signaling indeed stimulates glucose utilization and energy expenditure in differentiated Gabpa-expressing C2C12 cells. Both lactate levels and OCR were elevated when CHRNA2 signaling was activated by nicotine in the cultured g-beige adipocytes (Figure 5H and I). This indicated that functional CHRNA2 signaling can be induced by GABPα in a cell-autonomous fashion in g-beige fat. Conversely, It is worth noting that GABP has also been implicated in regulating the expression levels of other AChRs, such as epsilon and gamma subunits at the neuromuscular junction in skeletal muscle (Briguet and Ruegg, 2000; O’Leary et al., 2007), suggesting an intimate crosstalk between this Ets-related transcription factor and acetylcholine signaling in general. These data collectively reveal an orchestrated regulation of these distinct subset of thermogenic cells through β-adrenergic-independent CHRNA2 signaling.
Since the rediscovery of thermogenic fat in human adults, research efforts have been directed towards identifying drug targets to activate thermogenic activity, increasing energy expenditure for weight loss and metabolic fitness. Agonists targeting the canonical regulatory pathway through β-adrenergic receptors have yet to be proven viable for clinical use, due to undesirable side effects including cardiovascular irregularities and elevated blood pressure in humans (Arch, 2011; Cypess et al., 2015). The β-adrenergic-independent signaling through CHRNA2 presents an alternative mechanism that circumvents the potential complications of sympathetic activation. It has been well documented that adrenergic signaling decreases in human adipose tissue with the onset of various illnesses, obesity and aging (Faulds et al., 2003; Horowitz and Klein, 2000; Lonnqvist et al., 1990), conditions affecting people that would otherwise benefit the most from therapeutics that aim to improve metabolic health through activating adaptive thermogenesis. Glycolytic beige fat, the subpopulation of thermogenic fat cells that emerges in the absence of β-adrenergic signaling, represents a readily accessible therapeutic target in human subjects experiencing decreasing sympathetic tone and the onset of catecholamine resistance. The discovery that CHRNA2 plays a regulatory role in g-beige fat, reveals an attractive β-adrenergic-alternative therapeutic strategy in this rapidly evolving field.
STAR Methods
Experimental Model and Subject Details
Mice
All animal studies were conducted according to the protocol reviewed and approved by the Institutional Animal Care and Use Committee at the University of Michigan. All mice were housed under 12 h light/12 h dark cycle with a standard rodent chow diet (5L0D, PicoLab) unless otherwise indicated. The Adiponectin-Cre (Stock no. 010803), Myod1-CreERT2 (Stock no. 025667), Ucp1 knockout (Stock no. 003124), C57BL/6J (Stock no. 00664), Ucp1-Cre (Stock no. 024679) and Chrna2 knockout mice (Stock no. 005797) were obtained from the Jackson Laboratory. β-less mice were provided by Brad Lowell (Beth Israel Deaconess Medical Center, Boston). β1WT and β3WT mice were generated by crossing β-less animals with 129SVE mice purchased from Taconic Farms Inc (model no. 129 SVE). Chrna2fl/fl mice were generated using CRISPR/Cas9-mediated homology-directed insertion of LoxP sites flanking exon 3, by the Michigan Diabetes Research Center Molecular Genetics Core at the University of Michigan. Designed sgRNAs were validated to ensure that they cut the target sites accurately within the Chrna2 locus. Zygotes injected with the sgRNA and Cas9 were cultured until the blastocyst stage by the University of Michigan Transgenic Animal Core. The target region of sgRNAs on Chrna2 locus was amplified by PCR using genomic DNA extracted from the lysed blastocysts and verified through sequencing. Cas9, sgRNA and oligonucleotide containing LoxP sites were injected into fertilized mouse eggs and transferred to pseudo-pregnant recipient mice for gestation. Insertion of LoxP sites was confirmed by PCR amplification of the target region in tail genomic DNA from potential founders. To generate fat-specific Chrna2 KO mice (Chrna2-adKO), Chrna2fl/fl mice were crossed with Adiponectin-Cre mice. Thermogenic fat-specific Chrna2 KO mice (Ucp1-Cre;Chrna2fl/fl) were generated by crossing Chrna2fl/fl mice with Ucp1-Cre mice. CL 316,243-injected (1 mg/kg/day for 3 days) Ucp1-Cre;Chrna2fl/fl and littermate Chrna2fl/fl control mice were housed at room temperature for 21 days and then subjected to cold exposure at 10°C for 2 weeks. The CL 316,243 pretreatment and recovery for 3 weeks will ensure Cre-mediated deletion occurs in beige adipocytes in IWAT and thermogenic gene expression goes back to basal level as previously reported (Altshuler-Keylin et al., 2016; Roh et al., 2018; Wang et al., 2017).
Age-matched adult Chrna2-adKO and littermate control mice (5–10 weeks old) were used for cold and acute or chronic HFD experiments. For cold exposure studies, mice were singly housed in pre-chilled cages in a 10°C environmental chamber for 2 weeks. For acute HFD experiments, C57BL/6J and Ucp1 KO mice were maintained on either a chow diet or a HFD consisting of 60% of calories from fat (D12491, Research Diets) for 3 days or 10 days at room temperature (23°C). To study the effects of acute HFD at thermoneutrality, mice were housed at 30°C for 3 weeks on a chow diet and then received either a chow diet or a HFD for 3 days. For chronic HFD studies, mice were singly housed and fed HFD (45% of calories from fat; D12451, Research Diets) for 11 weeks at room temperature. Over this period, body weight and food intake were measured weekly.
To recruit glycolytic beige fat in IWAT of WT C57BL/6J or Chrna2 KO mice, animals were given intraperitoneal injections of β-blocker (propranolol hydrochloride) at a dose of 25 mg/kg (body weight) per day, for a period of 5 days at room temperature. Mice were then exposed to cold (15°C) or kept at room temperature for an additional 5 days under the same treatment. Mice genetically lacking β-AR signaling including β-less, β1WT and β3WT were housed at room temperature or cold for 5 days.
Cell Culture
The isolation, culture and differentiation of primary SVF from adipose depots were performed as described previously (Yu et al., 2018). Briefly, fat tissues were dissected, minced and digested in collagenase D (1.5 U/mL) and dispase II (2.4 U/mL) solution supplemented with 10 mM CaCl2 for 15 to 20 minutes in a 37 °C water bath with agitation. Digested tissues were filtered through a 100 μm cell strainer and centrifuged at 300–500 × g for 5 minutes to pellet cells. The floating mature adipocytes were collected when needed for gene expression analyses. The cell pellet was resuspended and passed through a 40 μm cell strainer and centrifuged as above. The SVF was collected when needed for gene expression analyses. The cell pellet was resuspended with culture medium (DMEM/F12 GlutaMAX containing 15 % FBS and penicillin/streptomycin) and plated onto a collagen-coated 10 cm cell culture dish. For adipocyte differentiation, confluent cultures of cells were exposed to induction medium (DMEM/F-12 GlutaMAX supplemented with 10% FBS, penicillin/streptomycin, 0.5 μg/mL insulin, 5 μM dexamethasone, 1 μM rosiglitazone and 0.5 mM IBMX). Two days after induction, cells were cultured in maintenance medium containing 10% FBS, penicillin-streptomycin and 0.5 μg/mL insulin until they were ready for analyses. For adenovirus transduction of differentiated primary preadipocytes, adipocytes were incubated with adenoviral CRE recombinase or GFP in maintenance medium for 24 hours. After replacing of the medium, the cells were cultured for an additional 48 hours.
Human adipose precursor cells from subcutaneous adipose tissue were obtained from healthy adult liposuction patients (a gift from Dr. Jeffrey M. Gimble at Tulane University). All specimens were collected under the protocols reviewed and approved by the Western Institutional Review Board (Puyallup, WA) or the University of Michigan Medical School Institutional Review Board (IRBMED). Cells were grown in MesenPRO RS medium supplemented with penicillin/streptomycin and differentiated in DMEM/F12 GlutaMAX supplemented with 10% FBS, dexamethasone (5 μM), insulin (0.5 μg/mL), IBMX (0.5 mM), rosiglitazone (5 μM), biotin (33 μM), pantothenic acid (17 μM), and BMP4 (20 ng/ml) for 3 days. On day 4, cells were cultured in maintenance medium (DMEM/F12 GlutaMAX containing 10% FBS, 0.5 μg/mL insulin, 5 μM dexamethasone, 33 μM biotin, and 17 μM pantothenic acid) until they were fully differentiated. HEK293T cells and C2C12 cell lines were obtained from ATCC. HEK293T cells were grown in DMEM supplemented with 10% FBS. C2C12 cells and the immortalized Myod+ progenitors isolated from IWAT of Myod1-CREERT2 reporter mice after injection of β-blocker for 5 days were cultured and differentiated as previously described (Chen et al., 2019).
Method Details
Metabolic Phenotyping
Fasting (4 hours) blood glucose levels at the basal condition were determined using the OneTouch Ultra Glucometer (Lifescan) in tail blood from mice. For glucose tolerance test (GTT), mice fed HFD for 9 weeks were fasted for 12 hours and received an intraperitoneal injection of 1.5 g/kg glucose. Insulin tolerance test (ITT) were performed after 10 weeks on HFD. Mice were fasted for 4 hours and 1 U/kg insulin (Eli Lilly) was administered by intraperitoneal injection. Glucose levels were determined from tail blood at 15, 30, 60, 90, and 120 minutes after glucose or insulin injection. The area under the curve (AUC) from GTT or ITT was analyzed using Prism 8. Chronic cold-exposed animals were subjected to nuclear magnetic resonance (NMR) analysis for body composition measurement (fat and lean mass). Whole-body energy expenditure (VO2 and VCO2), glucose oxidation and locomotor activity (at the x axis and y axis) of cold-exposed mice were monitored at 10°C for 48 hours using a Comprehensive Laboratory Monitoring System (Columbus Instruments) at the University of Michigan Animal Phenotyping Core. Core body temperature was measured using a RET-3 rectal probe (World Precision Instruments).
Genotyping
All knockout and Cre-transgenic mice obtained from the Jackson Laboratory were genotyped using PCR according to the protocol provided by the Jackson Laboratory. Genotyping of the Chrna2 floxed allele was performed by PCR using the following primers designed to detect the specific insertion sites of LoxP on 5’ and 3’ ends: 5’ end forward (F), 5’-AGCACCAATCTGCGTTAATCTATG-3’; 5’ end reverse (R), 5’-ACTGTGAGATAGGGACAGAAAAGA-3’ and 3’ end F, 5’-CTGCCTTTTCATGCTGCACTCC-3’; 3’ end R, 5’-CCTCAGGGTCACCCAATCACAGA-3’. To generate β1WT and β3WT mice by crossing β-less mice with 129SVE mice, primers to detect wild-type (WT) or knockout (KO) alleles in Adrb1, Adrb2 or Adrb3 were designed based on the gene targeting strategies described previously (Chruscinski et al., 1999; Rohrer et al., 1996; Susulic et al., 1995): Adrb1 WT F, 5’-TCGCTACCAGAGTTTGCTGA-3’; Adrb1 WT R, 5’-GGCACGTAGAAGGAGACGAC-3’; Adrb1 KO F/Adrb2 KO F2/Adrb3 KO F, 5’-TCGCCTTCTTGACGAGTTCT-3’; Adrb1 KO R, 5’-TGGCTCTCTACACCTTGGAC-3’; Adrb2 WT F/Adrb2 KO F1, 5’-GAGCGACTACAAACCGTCAC-3’; Adrb2 WT R, 5’-CAGCAAGTCTCCTCGGTGTA-3’ and Adrb3 WT F, 5’-CGCCGAGACTACAGACCATA-3’; Adrb3 WT R, 5’-GCATGTTGGAGGCAAAGGAA-3’; Adrb3 KO R, 5’-GCTTAGCCACAACGAACACTC-3’. Of note, the primer for Adrb1 KO F/Adrb2 KO F2/Adrb3 KO F was designed targeting to the inserted Neo cassette. The Neo cassette was reversed in Adrb2 KO animals and thus the KO alleles were genotyped using two forward primers.
Calcium Imaging Assay
SVF isolated from mouse IWAT was seeded on collagen-coated glass bottom culture dishes (MatTek Corporation) and induced to differentiate. Fully differentiated adipocytes were loaded with 10 μM of Fura 2-AM at 37°C. After 30 minutes they were washed twice with standard Tyrode’s solution (135 mM NaCl, 4 mM KCl, 10 mM glucose, 10 mM HEPES, 2 mM CaCl2, and 1 mM MgCl2, pH 7.4) at room temperature. Calcium assays were performed using an Olympus IX73 invert microscope under a 40× objective. Fluorescence signals were recorded upon sequential excitation with 340 nm followed by 380 nm with an ORCA-Flash 4.0 sCMOS camera (Hammatsu Inc.) with MetaFluor software (Molecular Devices Inc.). After establishing a baseline 340/380 nm ratio, the CHRNA2 agonist (500 μM nicotine or 100 μM acetylcholine) was perfused onto the cells.
Gene Overexpression and Knockdown
The lentiviral vector for Gabpa overexpression was purchased from GeneCopoeia (EX-Mm02614-Lv120). Lentiviral shRNA clones 1 and 2 for Gabpa were also obtained from GeneCopoeia (MSH027139-LVRU6GH for mouse Gabpa and CSHCTR001-LVRU6GH for a scrambled control). For lentivirus production, HEK293T packaging cells were transfected with 10 μg lentiviral vectors using the calcium phosphate method. After 48 hours of incubation, the viral supernatant was collected and filtered. C2C12 cells and primary inguinal adipocytes were incubated overnight with the viral supernatant supplemented with 10 μg/mL polybrene. Puromycin at a dose of 2 μg/mL or hygromycin at a dose of 200 μg/mL were used for selecting the stable-expressing cells.
Gene Expression Analysis
Total RNA from tissues and cultured cells was extracted using the Tri Reagent method (Sigma Aldrich). For quantitative real-time PCR (qPCR) analysis, an equal amount of RNA was used to synthesize cDNA according to the manufacturer’s protocol for M-MLV Reverse Transcriptase (Life Technologies). qPCR reactions were performed in a 384-well format using Power SYBR Green (Thermo Fisher Scientific). Relative mRNA levels were calculated using the ΔΔCT method and normalized to Tbp, 36B4 or Atp5e. Primer sequences can be found in Table S1.
Immunoblotting
Total protein from mouse adipose tissue was prepared in ice-cold lysis buffer (50 mM Tris-HCl, pH 7.5, 1% Triton X-100, 1% sodium deoxycholate, 0.1% SDS, 150 mM NaCl, 1 mM phenylmethylsulfonyl fluoride) supplemented with a protease inhibitor cocktail (Roche) and phosphatase inhibitors (10 mM NaF, 60 mM β-glycerolphosphate, pH 7.5, 2 mM sodium orthovanadate, 10 mM sodium pyrophosphate). Proteins were subjected to SDS-PAGE then transferred onto polyvinylidene difluoride (PVDF) membranes. The membranes were probed with following antibodies: UCP1 (Abcam, ab10983), Total OXPHOS Rodent Antibody Cocktail (Abcam, ab110413), COXIV (Cell Signaling, 4850), VDAC (Cell Signaling, 4661), HSP90 (Cell Signaling, 4874), phospho-PKA substrateS/T (Cell Signaling, 9621), phospho-CREBS133 (Cell Signaling, 9198), CREB (Cell Signaling, 9197), β-actin (Cell Signaling, 8457) and α-tubulin (Cell Signaling, 2144).
Mitochondrial DNA Content
Total DNA was extracted from IWAT of cold-exposed animals using Tri Reagent (Sigma Aldrich) according to the provided protocol. The amounts of nuclear Lpl and mitochondrial Nd1 in genomic DNA were determined using qPCR analysis. The expression levels of mitochondrial Nd1 were normalized with those of nuclear Lpl to estimate mitochondrial DNA copy numbers.
Oil Red O
Control vector- or Gabpa-expressing C2C12 cells were differentiated under pro-adipogenic conditions. Cells were fixed in 10% formalin for at least an hour, and then washed with 60% isopropanol. Subsequently, cells were dried, stained with Oil Red O solution for 10 minutes and then washed with H2O. Images were obtained with a Leica DMIRB microscope.
Intracellular Lactate levels
Intracellular lactate was extracted and measured in differentiated primary β-less inguinal preadipocytes or Gabpa-expressing C2C12 cells using L-Lactate Assay Kit (Cayman) according to the provided protocol.
Cytochrome C Release
Cytochrome c protein abundance was determined in purified mitochondria and cytosol organelles of IWAT from β-less or β-blocker-injected WT mice using Cytochrome c Release Assay Kit according to manufacturer’s instructions (Abcam). Total mitochondrial protein mass was analyzed in the isolated mitochondria fraction.
Tissue histology
Adipose tissue depots were harvested and fixed overnight in 10% formalin at 4°C. Routine paraffin-embedding and hematoxylin-eosin (H&E) staining were performed by the University of Michigan Comprehensive Cancer Center Research Histology and Immunoperoxidase Laboratory. Images were obtained with a LEICA DM2000. H&E stained images of IWAT from HFD-fed mice (n = 3 per genotype) were subjected to analysis of adipocyte size using ImageJ software (Adiposoft).
Citrate Synthase Activity
Citrate synthase activity of mouse inguinal adipose tissue was measured with a citrate synthase activity assay kit according to manufacturer’s instructions (Cayman Chemical). The homogenates of IWAT were prepared using extraction buffer (50 mM Tris-HCl, 1 mM MgCl2, 100 mM KCl, 250 mM sucrose and 30 mM 2-mercaptoethanol) and centrifuged at 1,000 × g for 15 minutes at 4 °C. The supernatants were subjected to analyses of citrate synthase activity and protein levels for normalization.
Respiration
Freshly harvested inguinal fat was weighed and minced in respiration buffer (2.5 mM glucose, 2.5 mM sodium pyruvate, 1 mM malate, 120 mM NaCl, 4.5 mM KCl, 0.7 mM Na2HPO4, 1.5 mM NaH2PO4 and 0.5 mM MgCl2, pH 7.4). Oxygen consumption was recorded at each stage (basal or uncoupled with 4 mg/mL oligomycin, Sigma) using a Clark electrode (Strathkelvin Instruments). Basal oxygen consumption rate in primary inguinal Ucp1 KO or β-less adipocytes was measured in the culture medium. Oxygen consumption in C2C12 cells was determined using the Seahorse XFe24 Analyzer (Agilent) as described previously (Chen et al., 2019).
Quantification and Statistical Analysis
All results are presented as means ± standard error of the mean (SEM) and graphed using Prism 8 software (GraphPad). Data are representative of 2–4 independent experiments. Sample sizes are biological replicates and were chosen based on preliminary data or previously published reports. Data for whole-body energy expenditure in the cold exposure study were analyzed by using analysis of covariance with body weight as a covariate. Statistical analyses were performed using Microsoft Excel or Prism software. Data were analyzed by an unpaired two sample Student’s t-test for two-group comparisons or a one-way analysis of variance (ANOVA) for multiple comparisons involving one independent variable.
Data and Code Availability
This study did not generate any unique datasets or code.
Supplementary Material
KEY RESOURCES TABLE
| REAGENT or RESOURCE | SOURCE | IDENTIFIER |
|---|---|---|
| Antibodies | ||
| Rabbit polyclonal anti-UCP1 | Abcam | Cat# ab10983 |
| Rabbit polyclonal anti-α-tubulin | Cell Signaling | Cat# 2144 |
| Total OXPHOS rodent antibody cocktail | Abcam | Cat# ab110413 |
| Rabbit monoclonal anti-phospho-CREB | Cell Signaling | Cat# 9198 |
| Rabbit monoclonal anti-CREB | Cell Signaling | Cat# 9197 |
| Rabbit polyclonal anti-HSP90 | Cell Signaling | Cat# 4874 |
| Rabbit polyclonal anti-phospho-PKA substrate | Cell Signaling | Cat# 9621 |
| Rabbit monoclonal anti-COX IV | Cell Signaling | Cat# 4850 |
| Rabbit monoclonal anti-VDAC | Cell Signaling | Cat# 4661 |
| Rabbit monoclonal anti-β-actin | Cell Signaling | Cat# 8457 |
| Chemicals | ||
| 3-Isobutyl-1-methylxanthine | Sigma Aldrich | Cat# I7018 |
| Acetylcholine chloride | Sigma Aldrich | Cat# A2661 |
| Biotin | Sigma Aldrich | Cat# B4639 |
| CL 316.243 hydrate | Sigma Aldrich | Cat# C5976 |
| Dexamethasone | Sigma Aldrich | Cat# D4902 |
| Dibutyryl-cAMP | Sigma Aldrich | Cat# D0260 |
| D-pantothenic acid hemicalcium salt | Sigma Aldrich | Cat# P5155 |
| Fura 2-AM | Sigma Aldrich | Cat# F0888 |
| Insulin for cells | Sigma Aldrich | Cat# I5500 |
| Insulin – Humulin R for ITT | Eli Lily | Cat# HI-210 |
| Isoproterenol | Sigma Aldrich | Cat# I6504 |
| Nicotine | Sigma Aldrich | Cat# N3876 |
| Oligomycin A | Sigma Aldrich | Cat# 75351 |
| Propranolol hydrochloride | Sigma Aldrich | Cat# PHR1308 |
| Tri Reagent | Sigma Aldrich | Cat# 93289 |
| Rosiglitazone | Cayman chemical | Cat# 71740 |
| Recombinant human BMP4 | R&D Systems | Cat# 3141-BP-010 |
| Collagenase D | Roche | Cat# 11088882001 |
| Dispase II | Roche | Cat# 04942078001 |
| SYBR Green | Applied Biosystems | Cat# 4368708 |
| M-MLV Reverse Transcriptase | Invitrogen | Cat# 28025021 |
| Critical Commercial Assays | ||
| Cytochrome c Release Assay Kit | Abcam | Cat# ab65311 |
| Citrate Synthase Activity Assay Kit | Cayman chemical | Cat# 701040 |
| L-Lactate Assay Kit | Cayman chemical | Cat# 1200011002 |
| Experimental Models: Cell Lines | ||
| C2C12 cells | ATCC | Cat# CRL-1772 |
| Mouse primary inguinal preadipocytes | N/A | N/A |
| Human primary adipose stromal cells | Dr. Jeffrey M. Gimble | N/A |
| Experimental Models: Organisms/Strains | ||
| Mouse: Adiponectin-Cre | The Jackson Laboratory | Cat# 010803 |
| Mouse: Myod1-CreERT2 | The Jackson Laboratory | Cat# 025667 |
| Mouse: Ucp1 knockout | The Jackson Laboratory | Cat# 003124 |
| Mouse: C57BL/6J | The Jackson Laboratory | Cat# 00664 |
| Mouse: Ucp1-Cre | The Jackson Laboratory | Cat# 024679 |
| Mouse: Chrna2 knockout | The Jackson Laboratory | Cat# 005797 |
| Mouse: β-less | Dr. Brad Lowell | N/A |
| Mouse: β1WT | Dr. Jun Wu | N/A |
| Mouse: β3WT | Dr. Jun Wu | N/A |
| Mouse: Chrna2fl/fl | Dr. Jun Wu | N/A |
| Oligonucleotides | ||
| qPCR primers, see Supplementary Table 1 | Integrated DNA Technologies | N/A |
| Genotyping: Chrna2 floxed 5’ Fwd AGCACCAATCTGCGTTAATCTATG | Integrated DNA Technologies | N/A |
| Genotyping: Chrna2 floxed 5’ Rev ACTGTGAGATAGGGACAGAAAAGA | Integrated DNA Technologies | N/A |
| Genotyping: Chrna2 floxed 3’ Fwd CTGCCTTTTCATGCTGCACTCC | Integrated DNA Technologies | N/A |
| Genotyping: Chrna2 floxed 3’ Rev CCTCAGGGTCACCCAATCACAGA | Integrated DNA Technologies | N/A |
| Genotyping: Adrb1 WT Fwd TCGCTACCAGAGTTTGCTGA | Integrated DNA Technologies | N/A |
| Genotyping: Adrb1 WT Rev GGCACGTAGAAGGAGACGAC | Integrated DNA Technologies | N/A |
| Genotyping: Adrb1 KO/Adrb2 KO 2/Adrb3 KO Fwd TCGCCTTCTTGACGAGTTCT | Integrated DNA Technologies | N/A |
| Genotyping: Adrb1 KO Rev GCCTTCTTGACGAGTTCT | Integrated DNA Technologies | N/A |
| Genotyping: Adrb2 WT/Adrb2 KO 1 Fwd GAGCGACTACAAACCGTCAC | Integrated DNA Technologies | N/A |
| Genotyping: Adrb2 WT Rev CAGCAAGTCTCCTCGGTGTA | Integrated DNA Technologies | N/A |
| Genotyping: Adrb3 WT Rev GCATGTTGGAGGCAAAGGAA | Integrated DNA Technologies | N/A |
| Genotyping: Adrb3 KO Rev GCTTAGCCACAACGAACACTC | Integrated DNA Technologies | N/A |
| Recombinant DNA | ||
| MSCV-GFP | Dr. Jun Wu | N/A |
| MSCV-CRE | Dr. Jun Wu | N/A |
| Lentiviral vector for Gabpa | GeneCopoeia | Cat# EX-Mm02614-Lv120 |
| Lentiviral shRNA clones 1 and 2 for Gabpa | GeneCopoeia | Cat# MSH027139-LVRU6GH |
| Lentiviral shRNA clones for scrambled control | GeneCopoeia | Cat# CSHCTR001-LVRU6GH |
| Software and Algorithms | ||
| ImageJ | NIH | https://imagej.nih.gov/ij/ |
| Excel | Microsoft | https://www.microsoft.com/ |
| GraphPad Prism 8 | GraphPad Software | https://www.graphpad.com/ |
Highlights.
CHRNA2 signaling in adipocytes mediates systemic energy homeostasis in vivo.
Acute high fat diet feeding activates CHRNA2 signaling in beige adipocytes.
CHRNA2 signaling regulates both UCP1- and creatine- mediated pathways.
CHRNA2 signaling regulates the activation of glycolytic beige adipocytes.
Acknowledgements
This research was supported by grants from the National Institutes of Health (R01DK107583 to JW), (R01DK97441 to SK), (R35GM126917 to XZSX) and the American Diabetes Association (1-18-IBS-281 to JW), fellowships from the Chinese Scholarship Council (201806370290 to YM, 201908420207 to JWang, and 201606100214 to XQ) and a Michigan Life Sciences Fellowship to AJK. This work utilized the Molecular Genetics Core of the Michigan Diabetes Research Center funded by NIH Grant No. P30-DK020572 from the NIDDK.
Footnotes
Publisher's Disclaimer: This is a PDF file of an unedited manuscript that has been accepted for publication. As a service to our customers we are providing this early version of the manuscript. The manuscript will undergo copyediting, typesetting, and review of the resulting proof before it is published in its final form. Please note that during the production process errors may be discovered which could affect the content, and all legal disclaimers that apply to the journal pertain.
Declaration of Interests
The authors declare no competing interests.
Descriptive Title for Excel-format Tables
Table S1. qPCR primer sequences used for gene expression analyses.
REFERENCES
- Altshuler-Keylin S, Shinoda K, Hasegawa Y, Ikeda K, Hong H, Kang Q, Yang Y, Perera RM, Debnath J, and Kajimura S (2016). Beige Adipocyte Maintenance Is Regulated by Autophagy-Induced Mitochondrial Clearance. Cell metabolism 24, 402–419. [DOI] [PMC free article] [PubMed] [Google Scholar]
- Anunciado-Koza R, Ukropec J, Koza RA, and Kozak LP (2008). Inactivation of UCP1 and the glycerol phosphate cycle synergistically increases energy expenditure to resist diet-induced obesity. J Biol Chem 283, 27688–27697. [DOI] [PMC free article] [PubMed] [Google Scholar]
- Arch JR (2011). Challenges in beta(3)-Adrenoceptor Agonist Drug Development. Ther Adv Endocrinol Metab 2, 59–64. [DOI] [PMC free article] [PubMed] [Google Scholar]
- Bachman ES, Dhillon H, Zhang CY, Cinti S, Bianco AC, Kobilka BK, and Lowell BB (2002). betaAR signaling required for diet-induced thermogenesis and obesity resistance. Science (New York, NY) 297, 843–845. [DOI] [PubMed] [Google Scholar]
- Bertholet AM, Kazak L, Chouchani ET, Bogaczynska MG, Paranjpe I, Wainwright GL, Betourne A, Kajimura S, Spiegelman BM, and Kirichok Y (2017). Mitochondrial Patch Clamp of Beige Adipocytes Reveals UCP1-Positive and UCP1-Negative Cells Both Exhibiting Futile Creatine Cycling. Cell metabolism 25, 811–822.e814. [DOI] [PMC free article] [PubMed] [Google Scholar]
- Briguet A, and Ruegg MA (2000). The Ets transcription factor GABP is required for postsynaptic differentiation in vivo. J Neurosci 20, 5989–5996. [DOI] [PMC free article] [PubMed] [Google Scholar]
- Cannon B, and Nedergaard J (2004). Brown adipose tissue: function and physiological significance. Physiol Rev 84, 277–359. [DOI] [PubMed] [Google Scholar]
- Chen Y, Ikeda K, Yoneshiro T, Scaramozza A, Tajima K, Wang Q, Kim K, Shinoda K, Sponton CH, Brown Z, et al. (2019). Thermal stress induces glycolytic beige fat formation via a myogenic state. Nature 565, 180–185. [DOI] [PMC free article] [PubMed] [Google Scholar]
- Chondronikola M, and Sidossis LS (2019). Brown and beige fat: From molecules to physiology. Biochim Biophys Acta Mol Cell Biol Lipids 1864, 91–103. [DOI] [PubMed] [Google Scholar]
- Chruscinski AJ, Rohrer DK, Schauble E, Desai KH, Bernstein D, and Kobilka BK (1999). Targeted disruption of the beta2 adrenergic receptor gene. J Biol Chem 274, 16694–16700. [DOI] [PubMed] [Google Scholar]
- Collins S (2011). beta-Adrenoceptor Signaling Networks in Adipocytes for Recruiting Stored Fat and Energy Expenditure. Frontiers in endocrinology 2, 102. [DOI] [PMC free article] [PubMed] [Google Scholar]
- Cypess AM, Weiner LS, Roberts-Toler C, Franquet Elia E, Kessler SH, Kahn PA, English J, Chatman K, Trauger SA, Doria A, et al. (2015). Activation of human brown adipose tissue by a beta3-adrenergic receptor agonist. Cell metabolism 21, 33–38. [DOI] [PMC free article] [PubMed] [Google Scholar]
- de Jonge L, and Bray GA (1997). The thermic effect of food and obesity: a critical review. Obesity research 5, 622–631. [DOI] [PubMed] [Google Scholar]
- Faulds G, Ryden M, Ek I, Wahrenberg H, and Arner P (2003). Mechanisms behind lipolytic catecholamine resistance of subcutaneous fat cells in the polycystic ovarian syndrome. J Clin Endocrinol Metab 88, 2269–2273. [DOI] [PubMed] [Google Scholar]
- Feldmann HM, Golozoubova V, Cannon B, and Nedergaard J (2009). UCP1 ablation induces obesity and abolishes diet-induced thermogenesis in mice exempt from thermal stress by living at thermoneutrality. Cell metabolism 9, 203–209. [DOI] [PubMed] [Google Scholar]
- Fernandes GW, Ueta CB, Fonseca TL, Gouveia CH, Lancellotti CL, Brum PC, Christoffolete MA, Bianco AC, and Ribeiro MO (2014). Inactivation of the adrenergic receptor beta2 disrupts glucose homeostasis in mice. J Endocrinol 221, 381–390. [DOI] [PMC free article] [PubMed] [Google Scholar]
- Hibi M, Oishi S, Matsushita M, Yoneshiro T, Yamaguchi T, Usui C, Yasunaga K, Katsuragi Y, Kubota K, Tanaka S, et al. (2016). Brown adipose tissue is involved in diet-induced thermogenesis and whole-body fat utilization in healthy humans. International Journal Of Obesity 40, 1655. [DOI] [PMC free article] [PubMed] [Google Scholar]
- Horowitz JF, and Klein S (2000). Whole body and abdominal lipolytic sensitivity to epinephrine is suppressed in upper body obese women. Am J Physiol Endocrinol Metab 278, E1144–1152. [DOI] [PubMed] [Google Scholar]
- Ikeda K, Kang Q, Yoneshiro T, Camporez JP, Maki H, Homma M, Shinoda K, Chen Y, Lu X, Maretich P, et al. (2017). UCP1-independent signaling involving SERCA2b-mediated calcium cycling regulates beige fat thermogenesis and systemic glucose homeostasis. Nature Medicine 23, 1454. [DOI] [PMC free article] [PubMed] [Google Scholar]
- Jun H, Yu H, Gong J, Jiang J, Qiao X, Perkey E, Kim D. i., Emont MP, Zestos AG, Cho J-S, et al. (2018). An immune-beige adipocyte communication via nicotinic acetylcholine receptor signaling. Nature Medicine 24, 814–822. [DOI] [PMC free article] [PubMed] [Google Scholar]
- Kazak L, Chouchani ET, Jedrychowski MP, Erickson BK, Shinoda K, Cohen P, Vetrivelan R, Lu GZ, Laznik-Bogoslavski D, Hasenfuss SC, et al. (2015). A creatine-driven substrate cycle enhances energy expenditure and thermogenesis in beige fat. Cell 163, 643–655. [DOI] [PMC free article] [PubMed] [Google Scholar]
- Kazak L, Chouchani ET, Lu GZ, Jedrychowski MP, Bare CJ, Mina AI, Kumari M, Zhang S, Vuckovic I, Laznik-Bogoslavski D, et al. (2017). Genetic Depletion of Adipocyte Creatine Metabolism Inhibits Diet-Induced Thermogenesis and Drives Obesity. Cell metabolism 26, 660–671.e663. [DOI] [PMC free article] [PubMed] [Google Scholar]
- Kazak L, Rahbani JF, Samborska B, Lu GZ, Jedrychowski MP, Lajoie M, Zhang S, Ramsay L, Dou FY, Tenen D, et al. (2019). Ablation of adipocyte creatine transport impairs thermogenesis and causes diet-induced obesity. Nature Metabolism. [DOI] [PMC free article] [PubMed] [Google Scholar]
- Leibel RL, Rosenbaum M, and Hirsch J (1995). Changes in energy expenditure resulting from altered body weight. The New England journal of medicine 332, 621–628. [DOI] [PubMed] [Google Scholar]
- Lonnqvist F, Nyberg B, Wahrenberg H, and Arner P (1990). Catecholamine-induced lipolysis in adipose tissue of the elderly. J Clin Invest 85, 1614–1621. [DOI] [PMC free article] [PubMed] [Google Scholar]
- Marlatt KL, and Ravussin E (2017). Brown Adipose Tissue: an Update on Recent Findings. Curr Obes Rep 6, 389–396. [DOI] [PMC free article] [PubMed] [Google Scholar]
- O’Leary DA, Noakes PG, Lavidis NA, Kola I, Hertzog PJ, and Ristevski S (2007). Targeting of the ETS factor GABPalpha disrupts neuromuscular junction synaptic function. Mol Cell Biol 27, 3470–3480. [DOI] [PMC free article] [PubMed] [Google Scholar]
- Roh HC, Tsai LTY, Shao M, Tenen D, Shen Y, Kumari M, Lyubetskaya A, Jacobs C, Dawes B, Gupta RK, et al. (2018). Warming Induces Significant Reprogramming of Beige, but Not Brown, Adipocyte Cellular Identity. Cell metabolism 27, 1121–1137 e1125. [DOI] [PMC free article] [PubMed] [Google Scholar]
- Rohrer DK, Desai KH, Jasper JR, Stevens ME, Regula DP Jr., Barsh GS, Bernstein D, and Kobilka BK (1996). Targeted disruption of the mouse beta1-adrenergic receptor gene: developmental and cardiovascular effects. Proc Natl Acad Sci U S A 93, 7375–7380. [DOI] [PMC free article] [PubMed] [Google Scholar]
- Rothwell NJ, and Stock MJ (1979). A role for brown adipose tissue in diet-induced thermogenesis. Nature 281, 31–35. [DOI] [PubMed] [Google Scholar]
- Susulic VS, Frederich RC, Lawitts J, Tozzo E, Kahn BB, Harper ME, Himms-Hagen J, Flier JS, and Lowell BB (1995). Targeted disruption of the beta 3-adrenergic receptor gene. J Biol Chem 270, 29483–29492. [DOI] [PubMed] [Google Scholar]
- Thomas SA, and Palmiter RD (1997). Thermoregulatory and metabolic phenotypes of mice lacking noradrenaline and adrenaline. Nature 387, 94–97. [DOI] [PubMed] [Google Scholar]
- Wang Y, Paulo E, Wu D, Wu Y, Huang W, Chawla A, and Wang B (2017). Adipocyte Liver Kinase b1 Suppresses Beige Adipocyte Renaissance Through Class IIa Histone Deacetylase 4. Diabetes 66, 2952–2963. [DOI] [PMC free article] [PubMed] [Google Scholar]
- Yu H, Emont M, Jun H, and Wu J (2018). Isolation and Differentiation of Murine Primary Brown/Beige Preadipocytes. Methods Mol Biol 1773, 273–282. [DOI] [PubMed] [Google Scholar]
Associated Data
This section collects any data citations, data availability statements, or supplementary materials included in this article.
Supplementary Materials
Data Availability Statement
This study did not generate any unique datasets or code.