

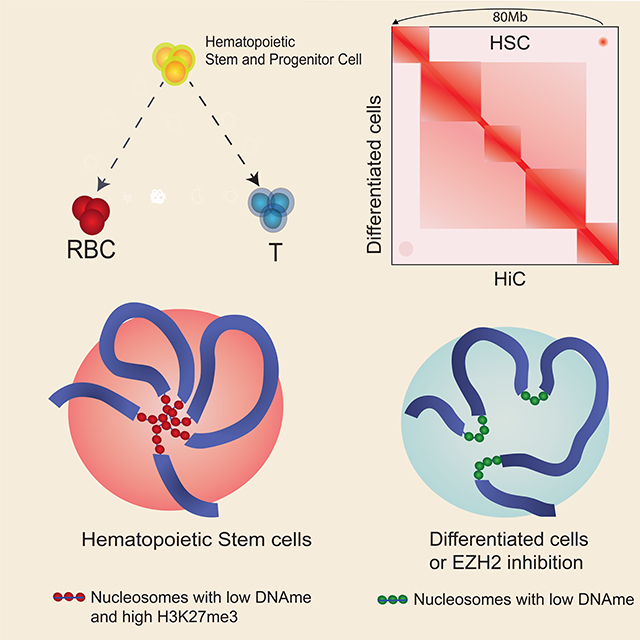
Summary
Higher-order chromatin structure and DNA methylation are implicated in multiple developmental processes, but their relationship to cell state is unknown. Here, we find that large (>7.3kb) DNA methylation nadirs (termed “grand canyons”) can form long loops connecting anchor loci that may be dozens of megabases apart, as well as interchromosomal links. The interacting loci cover a total of ~3.5Mb of the human genome. The strongest interactions are associated with repressive marks made by the Polycomb complex and are diminished upon EZH2-inhibitor treatment. The data are suggestive of the formation of these loops by interactions between repressive elements in the loci, forming a genomic subcompartment, rather than by Cohesion/CTCF-mediated extrusion. Interestingly, unlike previously characterized subcompartments, these interactions are only present in particular cell types, such as stem and progenitor cells. Our work reveals that H3K27me3-marked large DNA methylation grand canyons represent a set of very long-range loops associated with cellular identity
eTOC
Zhang et al, discovered that very large DNA methylation nadirs (grand canyons) form megabase-scale and inter-chromosomal 3D genomic interactions in primary stem and progenitor cells. H3K27me3 is strongly enriched in grand canyons and important for organizing the grand canyon interactions associated correlated with their stem cell state.
Graphical Abstract
Introduction
In the human genome, cytosine residues located in CpG dinucleotides are often, but not always, methylated (5-methyl-C). CpG islands – genomic intervals, typically 300–3000bp in length, containing many CpG dinucleotides – are an important exception (Bird et al., 1985). Frequently located near promoters, CpG islands are typically unmethylated when the nearby gene is active. Yet, despite extensive study, the mechanisms that underlie the relationship between DNA methylation and gene transcription remain poorly understood.
One possibility is that the absence of DNA methylation leads to changes in 3D chromatin architecture that influence transcription. In recent years, experiments combining DNA-DNA proximity ligation with high-throughput sequencing (Hi-C) have made it possible to generate high-resolution maps of chromatin architecture by measuring the frequency of contacts between all pairs of loci, genome-wide (Cullen et al., 1993; Dixon et al., 2015; Dixon et al., 2012; Lieberman-Aiden et al., 2009; Rao et al., 2014). These experiments have revealed two mechanisms of chromatin folding. The first is associated with the formation of a class of loops between sites bound by cohesin and CTCF, such that the CTCF motifs lie in the convergent orientation (i.e., they point toward one another) (Fudenberg et al., 2016; Sanborn et al., 2015). To explain this phenomenon, it has been hypothesized that cohesin initially forms small loops between nearby sites, which grow larger through a process of extrusion until an inward-pointing CTCF is encountered (Alipour and Marko, 2012; Fudenberg et al., 2016; Nasmyth, 2001; Nichols and Corces, 2015; Sanborn et al., 2015). The second mechanism is compartmentalization: the tendency of genomic intervals with similar histone modifications to co-segregate in 3D inside the nucleus (Lieberman-Aiden et al., 2009; Rao et al., 2014).
We were interested in exploring a potential relationship between DNA methylation and genome architecture, but the typical CpG island is too short to be reliably interrogated by Hi-C, preventing the exploration of these features. However, we recently identified exceptionally long genomic intervals (~3.5–25 Kb) that exhibit low levels of cytosine methylation, dubbed “DNA methylation canyons” (Jeong et al., 2014) (also known as DNA methylation valleys (Xie et al., 2013)). Canyons, which often contain multiple CpG islands, are strongly preserved across cell types and species. In any given cell, particular canyons are typically either repressed, and decorated with H3K27me3, or active, and decorated with H3K4me3 (Jeong et al., 2014).
Because of their unusual size, DNA methylation canyons are a natural system for exploring the influence of methylation on genome architecture. Moreover, the DNA methyltransferases regulating canyon size are highly expressed in hematopoietic stem/progenitor cells (HSPC) and are important for their differentiation (Challen et al., 2011; Jeong et al., 2014). HSPCs and their downstream progeny are well characterized, offering primary cells in which 3D architecture can be explored within a differentiation hierarchy.
Performing in situ Hi-C experiments at 10kb resolution, we observe the formation of hundreds of long-range loops between large, repressed canyons lying on the same chromosome, as well as evidence for links between canyons located on different chromosomes. Taken together, our data are consistent with the formation of a unique set of contacts in which large DNA methylation canyons from across the genome tend to co-segregate. We show that these features are present, albeit much weaker, after HSPC differentiation and in other differentiated cell types. Our findings indicate that DNA methylation works in tandem with histone modifications to influence the 3D architecture of the human genome.
Results
Generation of high-resolution contact maps in hematopoietic progenitors and differentiated cells
We first sought to generate a high-resolution contact map in primary human hematopoietic stem and progenitor cells (HSPCs). We purified HSPCs from human umbilical cord blood (UCB) as lineage-negative CD34+ CD38- cells (Figure 1A, S1A) and generated in situ Hi-C libraries (Rao et al., 2014) yielding ~1B read pairs representing 613M Hi-C contacts (Table S1) and processed the data using Juicer (Durand et al., 2016b). For comparisons to HSPCs, we also isolated differentiated T-cells (CD3+) and erythroid progenitors (EPs, via directed differentiation and sorting for CD36+ CD71+ CD235a+) (Figure 1A S1B–D). Our initial analysis showed compartments, contact domains and loops, each connecting a pair of loop anchor points on the same chromosome as reported for other cells (Figure 1B, S1E).
Figure 1. Very long-range interactions in the 3D HSPC genome.

(A) Diagram of the hematopoietic hierarchy. HSPC was selected for Hi-C profiling.
(B) An example of contacts from chromosome 11 at 10kb resolution (left) and blowout at 5kb resolution (right).
(C) Example of chromosome loops around the stem cell associated gene RUNX1. HSPCs (Upper) and T cells (Lower).
(D) Example of chromosome loops around the stem cell associated gene GATA2. HSPCs (Upper) and EPs (Lower).
(E) Example of chromosome loops around the EP associated gene SLC25A37. HSPCs (Upper) and EPs (Lower).
(F) Example of chromosome loops around the T cell associated gene GPR65. HSPCs (Upper) and T cells (Lower).
Comparing HSPCs and differentiated progeny, we found the position of contact domains was not altered significantly (Figure S1F,G). However, intra-contact domain interactions were distinct around lineage-specific genes. In HSPCs, intra-domain interactions are extensive in regions associated with key HSPC-associated genes and enhancers (Figure 1C,D), such the ~1MB RUNX1 locus (Figure 1C) and the GATA2 locus. Thus, these maps will serve as a resource for HSPC 3D interactions (e.g., KLF12 (Figure S2A)).
In differentiated cells we observed loops associated with cell type-specific genes and H3K27ac-enhancer marks (Figure 1E,F). More intra-domain interactions were evident when cell-type-specific genes were expressed. For instance, SLC25A37, a mitochondrial iron transporter, formed an a contact domain only in EPs (Figure 1E). Similarly, a contact domain at GPR65, which has a role in T cells (Choi et al., 1996) was absent in HSPCs (Figure 1F). Strong interactions around stem cell-specific genes such as RUNX1 were decreased in differentiated cells (Figure 1 C, D).
Discovery of Long Loops specifically in HSPCs
Upon further scrutiny, we identified sites of very long-distance interactions, well beyond the distance of ~2 MB typically associated with cohesin-associated loops (Rao et al., 2014). For example, we observed interactions between SHOX (Chr3:158MB), SOX2 (Chr3:181MB) and the POU3F3 (Chr2:105.4M) loci approximately 23 Mb apart, and between the ZIC2 (Chr13:100M), POU4F1(Chr13:79M) and PDX1 (Chr13:28M), approximately 72 Mb apart (Figure 2A,B and S2B, C). To quantify these, we manually annotated the maps on all chromosomes to identify 408 loops whose anchors were >2Mb apart (Table S2).
Figure 2. Long loops in HSPC and the validation of long-range interactions by 3D FISH.

(A) Example of intra multiple long-range interaction on chromosome 13. The matrices are shown at 100kb resolution and blowout of POU4F1 and ZIC2 region at 5kb resolution.
(B) Example of intra multiple long-range interaction on chromosome 3. The matrices are shown at 100kb resolution and blowout of SHOX2 and SOX2 region at 5kb resolution.
(C) Hi-C contact maps at HOXA cluster. HSPC specific contact between SP8 and the HOXA cluster is highlighted with green square. HSPC (Upper) T cells (Lower).
(D) Hi-C contact maps at HOXA cluster. HSPC specific contact between SP8 and the HOXA cluster is highlighted with green square. HSPC (Upper) EPs (Lower).
(E) Left panel. Dual color DNA FISH with probes targeting SP8 and repressive HOXA locus in HSPC, T and EP cells. Representative 3D-DNA FISH images. SP8(Red) HOXA (Green) DAPI(Blue). Right panel. The distance between SP8 and HOXA measured by FISH in HSPC and T cells. P value is calculated by two sample t-test (p=2.08e-11 HSC vs T, p=1.56e-22 HSC vs EP).
To confirm the presence of these long loops at the single cell level, we performed 3D-FISH using fluorescently labeled probes. We validated interactions between the HOXD and DLX1 loci, separated by 4Mb, using FISH probes, compared with a control probe within a similar distance. We observed close localization of HOXD and DLX1 but not the control region (Movie S1). Furthermore, we observed that another loop anchor PAX3, which is 50Mb away from HOXD, also simultaneously colocalized with HOXD and DLX1 (Movie S2). Together, these data reveal the presence of exceptionally long loops in HSPCs, with numerous anchors on the order of 50 Mb apart (median 7.5Mb), with the largest being 117Mb (Table S2) (average 15.8Mb, range 2Mb −117Mb).
Loops or contact-domains of this extraordinary size have rarely been reported except on the inactive X chromosome (Rao et al., 2014; Darrow et al., 2016). Therefore, we asked whether these were a general feature of primary hematopoietic cells. HSPC long loops were not apparent in T-cells and EPs. To confirm their absence, we performed 3D-FISH across all three cell types using two color probes that spanned the HOXA anchor and the SP8 anchor which are ~7MB apart (Figure 2C,D). Quantification of the average distance between signals showed the loci were closest in HSPCs (Figure 2E). We detected HOXA-SP8 co-localization (signals ≤ 0.15μm apart) in 20% of the HSPC nuclei, but only 1% of T cells and 0% of EP. We observed similar results from TWIST1-HOXA, DLX1-HOXD, and PAX3-DLX1-HOXD loci (Figure S3A, Movie S3). These data corroborate the Hi-C analysis indicating that the SP8 – HOXA loci and DLX1 – HOXD loci are in closer physical proximity in HSPCs compared to their differentiated progeny.
HSPC Long loops are not consistent with the Loop Extrusion Model
In order to investigate how long loops are formed and how they relate to loops mediated by CTCF-extrusion, we examined their properties systematically. First, we used our standard loop-calling algorithm HiCCUPS (Durand et al., 2016b; Rao et al., 2014) and identified 2683 loops in HSPCs (Table S2 Figure 3A and B). Many of these loops overlapped with those reported in other cell types: 2014 of these 2683 loops overlapped the 9448 loops reported in GM12878 cells, and 1832 overlapped 8040 loops reported in IMR90 cells. As in previous studies, the anchors were usually bound by CTCF (by ChIP-Seq: 74%, 4.1-fold enriched vs. random controls of similar length), with the motifs in convergent orientation (for 2534 of the 2744 loop anchors with a unique CTCF motif, the motif points inward, 92%, p=6.07×10−506). These observations confirmed the accuracy of our maps and presence of typical features.
Figure 3. Long loops are a feature of 3D genomic interactions independent of cohesion extrusion loops in HSPC.

(A) Example of regular HiCCUPS loop with convergent CTCF motifs on chromosome 3 in the WNT7A region at 5kb resolution.
(B) Example of regular HiCCUPS loop with convergent CTCF motifs on chromosome 3 in the GABRR3 region at 5kb resolution.
(C) Example of intra multiple long-range interaction on chromosome 13. The matrices are shown at 100kb resolution and blowout of CDX2, NBEA, POU4F1 and ZIC2 region at 10kb and 5kb resolution.
(D) Example of intra multiple long-range interaction on chromosome 11. The matrices are shown at 100kb resolution and blowout of NUC160, NUC98, COPB1 and NUCB2 region at 10kb and 5kb resolution.
(E) Fold Enrichment of CTCF binding sites on loop anchors as compared to random translational control regions. (HiCCUPS loops - blue bars, Long loops – red bar)
(F) Inward and outward orientation of CTCF motifs on loop anchors.
(G) Length distribution of HiCCUPS loops (blue line) versus Long loops (green line), and loops identified in GM12878 (orange) and IMR90 (purple) cells.
Interestingly, the CTCF-binding profile of the loop anchors identified using HiCCUPS depended on the size of the loop (i.e., linear distance). Whereas HSPC loops shorter than 1Mb were bound by CTCF in 77.0% of cases (4.5-fold enrichment), loops longer than 3Mb were only bound by CTCF 46.7% of the time (a 2.9-fold enrichment) (Figure 3E, Figure S3B,C). Similarly, longer loops were less likely to obey the convergent rule. For loops <1Mb, 95% of CTCF motifs at loop anchors pointed inward compared to only 57.9% for loops >3Mb (Figure 3F).
Most of the 408 manually annotated long loops (458 anchors) were not identified by our algorithms so we manually examined and annotated their CTCF profiles. Anchors at long loops exhibited minimal enrichment for CTCF (1.04-fold, Figure 3C, D), and, even when CTCF was bound, they did not obey the convergent rule (130 of 290 or 44.8% CTCF motifs pointed inward) (Figure 3C,D,F) and were significantly longer than canonical cohesion extrusion loops (Figure 3G).
Importantly, we also tested if CTCF degradation affected grand canyon interactions. We performed APA analysis on data from mouse ES cells in which CTCF had been acutely degraded (Nora et al., 2017), finding that depletion of CTCF did not change the long-loop interactions (Figure S3E). Together, these findings suggest long loops form in HSPCs by a mechanism independent of CTCF and cohesion.
DNA methylation Canyons lie at the anchor of Long loops
Next, we examined whether other features correlated with these long loops. By aligning DNA methylation profiles with the Hi-C data, we observed that anchors often corresponded to regions of very low DNA methylation (Table S3), and thus analyzed the relationship in detail. The anchor position of long loops had lower average DNA methylation levels than standard loop anchors (Figure S3D) and often overlapped with DNA methylation canyons (Figure 4A–C). To quantify this, we compared the position of loop anchors with the 282 canyons longer than 7.3Kb (dubbed “grand canyons”), reasoning that shorter canyons might not reliably influence our HSPC contact map given the limitations of Hi-C resolution. Strikingly, we found that the rate of overlap with grand canyons depended strongly on the size of the loop. Of the anchors of HSPC loops <1Mb, 1.8% overlapped a grand canyon (77 of 4287, 4X enrichment). By contrast, 29.0% of anchors of HSPC loops >3Mb annotated by HiCCUPS overlapped a grand canyon – a 45-fold enrichment (18 of 62). Similarly, of the 458 manually annotated long loop anchors, 24% (110) overlapped a grand canyon (16.7-fold enrichment (Figure 4D)).
Figure 4. DNA methylation Canyons are long loop anchors.

(A) Example of HiCCUPS loops and Long loops on chromosome 2. Blue dots represent Long loops and green dots represent HiCCUPS loops. The matrices are shown at 100kb resolution and blow out of POU3F3, HOXD and PAX3 regions at 5kb resolution. Green bars represent DNA methylation canyons.
(B) Example of Long loops on chromosome 6 convergent on grand canyon regions. The matrices are shown at 100kb resolution and blowout of POUF2, PRDM13 and SIM1 regions at 5kb resolution.
(C) Example of Long loops on chromosome 7 with grand canyons. The matrices are shown at 100kb resolution of TWIST1, SP8 and HOXA regions.
(D) Fold enrichment of grand canyons at loop anchors (HiCCUPS loops - blue bars, Long loops – red bar).
(E) Upper panel: The enrichment of H3K27ac and H3K27me3 in the grand canyon region. Lower panel: The comparison of ChIP-seq signal of H3K27ac and H3K27me3 in grand canyon region (>7.3kb), short Canyon region (3.5–7.3kb), UMRs between 3.5kb and 1kb. and UMRs less than 1kb. UMR = under-methylated region.
(F) The aggregated peak analysis (APA) on Grand canyon interactions, with different length scale and inter-chromosomal interactions in HSPCs. Loop interactions are shown as a control. RGC: Repressive grand canyons. srUMR: short repressive UMR. srUMRs are UMRs shorter than 3.5kb and enriched for H3K27me3 signal. HMEC: Human Primary Epithelial Mammary Cells.
Canyons are typically decorated with either active or repressive histone marks. We considered whether a particular group of canyons was associated with the long loops, performing ChIP-Seq in HSPCs for histone marks indicative of repressive and active chromatin (H3K27me3 and H3K27ac respectively). We found that nearly all grand canyons (85%, 241 of 282) exhibit broad H3K27me3 indicating a repressed state (Figure 4E). Further comparisons between shorter canyons and under-methylated regions (UMRs) showed that grand canyons have a distinctly high H3K27me3 signal, while being depleted of H3K27ac, distinguishing them from other CpG islands (Figure 4E). A small number instead exhibited broad H3K27ac indicating a more active state (18%, 53 of 282); these were much less likely to be involved in long loops relative repressed (H3K27me3) grand canyons (5 of 39 vs 100 of 227 respectively, a 3.4-fold depletion) (Table S3).
Because the loops forming between grand canyons were so long, we wondered whether they formed links to different chromosomes. To address this, we used Aggregate Peak Analysis (APA), to computationally superimpose Hi-C submatrices from the vicinity of multiple putative loops (Durand et al., 2016b; Rao et al., 2014), allowing contact frequencies to be visualized even when individual loops are not discernable. We thus examined pairs of grand canyons separated by varying linear distances, as well as pairs lying on different chromosomes. As controls, we examined anchors of HSPC short loops and anchors of previously published loops. We found that pairs of grand canyons tended to form loops regardless of their linear distance and to form links even when located on different chromosomes (Figure 4F). In contrast, the control anchors showed high APA scores only on the same chromosome and at distances <2Mb (Figure 4F). To determine the relevance of the polycomb-mediated histone modification H3K27me3, we ran APA analysis with UMRs enriched for H3K27me3. We found these short repressive UMRs (srUMRs) did not show significant long-range interactions in comparison with repressive grand canyons. These data show that long loops are closely associated with DNA methylation grand canyons that primarily exhibit repressive histone marks, and that repressive marks alone are insufficient to explain the interactions. Notably, the inter-chromosomal interactions are inconsistent with the loop-extrusion model which can only facilitate intra-molecular loops, but not inter-molecular links.
EZH2 inhibition results in loss of grand canyon interactions
The observation that grand canyons with the highest levels of H3K27me3 enrichment are interacting suggests that this mark plays a key role in establishing these loops. To investigate this, we treated HSPCs with a small molecule inhibitor of EZH2, (EPZ6438 (Sneeringer et al., 2010)), the main catalytic component of the PRC2 complex that generates the H3K27me3 mark. We reasoned that treatment with the inhibitor during modest ex vivo expansion of HSPCs would blunt formation of H3K27me3 and potentially impact grand canyon interactions (Figure 5A). EZH2 inhibition revealed a global decrease of H3K27me3 at grand canyons (e.g. HOXC, PAX6 and WT1 (Figure 5C)), as well as at short canyons and UMRs ≤3.5kb (Figure 5B). Furthermore, we observed weak activation of a few loci after EZH2 inhibitor treatment (Figure S4A). We then performed Hi-C on cells treated with vehicle or EPZ6438. While ex vivo expansion diminished the grand canyon interactions to 73% of that observed in uncultured cells, EZH2 inhibition dramatically reduced the interactions to 22% of those in fresh HSPCs (Figure 5D). Meanwhile, the loss of H3K27me3 did not show any significant impact on CTCF-mediated loops (Figure 5D, E). These data suggest that the H3K27me3 deposited by EZH2 in grand canyon loci is essential for long-loop interaction. We also verified that the EZH2 inhibitor disrupted distribution of H3K27me3 in HSPCs. The H3K27me3 in DMSO treated cells formed patches overlapping with nucleus especially on the periphery (Figure 5F). After EZH2 inhibitor treatment, these patches disappeared and the H3K27me3 signal became very weak (Figure 5F). Next, we tested the distribution of PRC2 protein SUZ12 in DMSO and inhibitor-treated cells. We found that SUZ12 also formed foci and patches in the nucleus, but inhibitor treatment did not alter the foci and patches significantly (Figure S4B). This suggests that the loss of grand canyon interaction is due to the loss of H3K27me3, but not Polycomb complex binding per se. Overall, these data suggest that while the H3K27me3 marks generated by the Polycomb complex are important for long-range interactions, it is only those regions with the highest concentration, or the longest regions, that are able to participate in very long-range contacts (Figure 5F, Figure S4C). We propose that a size of around 7.3 kb is the lower limit for repressed grand canyon loci to segregate together, and expect a dependence on local H3K27me3 nucleosome concentration.
Figure 5. Grand canyon interactions requires high H3K27me3 deposited by EZH2.

(A). The experimental scheme. Cord blood CD34+ cells are treated with EZH2 inhibitor for 7 days in the ex vivo culture condition. The CD34+CD38- cells are isolated for in situ HiC, RNA-seq and ChIP-seq.
(B) Level of global H3K27me3 ChIP-seq signal on CD34+CD38- cells after vehicle and EZH2 inhibitor treatment for 7 days. MACS2 enrichment fold change is shown on the y axis.
(C) H3K27me3 enrichment on CD34+CD38- cells around HOXC cluster and PAX6-WT1 locus after vehicle and EZH2 inhibitor treatment for 7 days.
(D). APA analysis on grand canyon interactions and CTCF loops in vehicle and EZH2 inhibitor treatment cells.
(E) Example of grand canyon interaction loss in EZH2 inhibitor treated cells in PRDM13 and SIM1.
(F) Immunostaining of H3K27me3 in DMSO and EZH2 inhibitor treated cells. Scale bar =10μm. Representative image is displayed with the same exposure time.
Long Loops associated with repressive grand canyons are limited to primary cells
Next, we considered whether HSPC long loops were present in other human cell types (Figure 6A). We used APA to re-analyze a total of ~30 billion Hi-C read pairs from 19 human cell types in which loop-resolution Hi-C maps are available (Bonev et al., 2017; Darrow et al., 2016; Haarhuis et al., 2017; Rao et al., 2014; Rao et al., 2017; Sanborn et al., 2015). In every cell type examined, the aggregate signal was either absent (18 cell types), or nearly absent (GM12878 lymphoblastoid; diminished by 88%) (Figure 6B). In contrast, loops with convergent CTCF sites were preserved across cell types (except in HCT-116 cells after cohesin degradation (Rao et al., 2017)).
Figure 6. Canyon interactions are strongly enriched in undifferentiated cell types.

(A) Example of HiCCUPS loops (circles) and Long loops (squares) on chromosomes 3 and 6 across cell types (left). APA for loops with convergent CTCF and Long loops with repressive grand canyons across cell types (right). Canyons are indicated in green (top).
(B) APA on the indicated human cell types.
(C) APA on the indicated mouse cell types.
(D) Levels of H3K27me3 in the grand canyon, canyon, and UMRs<3,5kb in cells with both HiC data and H3K27me3 in B. (H3K27me3ChIP-input) FKPM value from deeptool 2.0 is shown on the y axis. H3K27me3 data is from ENCODE listed in STAR method.
(E) Levels of DNA methylation in the grand canyon, canyon, and UMRs<3,5kb in cells with both HiC data and WGBS data in B. DNA methylation level value is shown on the y axis. The red line indicates the methylation level of grand canyon in HSPC. Grey box indicates that the corresponding DNA methylation data is not available through ENCODE.
To dissect why long loops are only seen in primary cells, we examined the level of H3K27me3 and DNA methylation in grand canyons, canyons and UMRs <3.5kb. We found that HSPCs exhibit the highest H3K27me3 enrichment levels among human cell lines with available high resolution Hi-C data (Figure 6D). In cancer cell lines (HCT116, Hela, K562), H3K27me3 was significantly lower in grand canyon regions. Other immortalized cell lines (GM12878, IMR90, HMEC) as well as EPs also showed reduced H3K27me3. While primary cells (NHEK, T cells) and IMR90 cells showed enrichment of H3K27me3 in grand canyons, the H3K27me3 level was still lower than in HSPCs (Figure 6D). Importantly, HSPCs also exhibited the lowest DNA methylation levels in grand canyons, while hypermethylation occurs in many cell lines (HMEC, IMR90, GM12878, K562 and HCT116). Regions flanking grand canyons were hypomethylated in K562 and GM12878 cell lines, consistent with their general global hypomethylation. DNA methylation in grand canyons increased mildly in EP and T-cells (Figure 6E). Together, these data suggest that DNA methylation guides long-range grand canyon interactions, while polycomb-associated H3K27me3, is critical to the formation of these loops (Figure 6E, Figure S5A).
We also used APA to analyze 10 murine cell types in which loop-resolution Hi-C maps are available (>35 billion read pairs) (Bonev et al., 2017; Kieffer-Kwon et al., 2017). We observed strong conservation of long loops in mouse ES and neural progenitor cells (Bonev et al., 2017) (Figure 6C). All other more differentiated cell types had little or no discernable APA signal, except for activated (but not resting) B-cells (Figure S6A–C). Together, this demonstrates a correlation between long-loops and stem and progenitor cells. APA analysis of the T-cells and EPs from our study also confirmed that long-loops were not evident in the progeny of human HSPCs (Figure S5B, C). Interestingly, in mouse somatic cells, we found that activated B cells also bear some grand canyon interactions. In these cells, H3K27me3 in grand canyons is higher than resting B cells (Figure S5D), consistent with a Polycomb association.
A stem cell grand canyon interaction maintains HOXA gene expression
Finally, we sought to explore the functional significance of long loops by removing a grand canyon at a loop anchor. As most grand canyons are associated with promoters and exons, the functional impact of canyon deletion could be confounded by the effect gene loss. To obviate this concern, we identified a grand canyon lacking an obvious gene (“geneless” canyon, or “GLS”). The GLS is 17 Kb long and lies 1.4 Mb upstream of the HOXA1 gene (Figure 7A). In HSPCs, the GLS is coated with H3K27me3, lacks transcriptional activity and interacts with multiple canyons (e.g. TWIST and SP8). GLS also interacts downstream with the complex HOXA locus. The HOXA cluster contains an active multi-canyon component (HOXA7-10; H3K27ac marked) flanked by two repressed components (Figure 7B, H3K27me3) with which the GLS interacts. The active HOX genes become repressed as HSPCs differentiate. The active canyons bear correctly oriented CTCF motifs consistent with extrusion loops between active HOXA segments (Figure 7A,B). The Hi-C data and epigenomic profile suggest the HOXA9 region forms a 3D genomic structure modeled in Figure 7H. Thus, we hypothesized that the GLS and repressed HOXA interactions would be important for HSC function.
Figure 7. HOXA long-range Interactions Maintain HSPC Identity.

(A) Epigenome browser track image of the geneless (GLS) canyon between the MIR148A and the RNU6-16P locus. H3K4me3, H3K27me3, H3K27ac, H3K4me1, CTCF orientation and DNA methylation are displayed for HSPCs. Green arrowheads indicate the reverse CTCF and Red arrowheads indicate the forward CTCF sites.
(B) Contact matrices of GLS and HOXA cluster region on chromosome 7 at 5kb resolution in CD34+ HSPCs. Red squares: Canyons. Black squares: grand canyons. Black arrow indicating the interaction between active HOXA genes with upstream H3K27ac marked enhancers. Red arrow indicating grand canyon interactions of GLS and repressive HOXA regions.
(C) Schematic representation of CRISPR/Cas9 targeting of the geneless (GLS) canyon.
(D) Scheme for testing the role of GLS in HSPC maintenance by CRISPR/Cas9 deletion of GLS in HSPC.
(E) ddPCR quantification of GLS deletion band.
(F) Interaction in GLS-HOXA locus after EZH2 inhibitor treatment (Lower triangle) in comparison with DMSO (Upper triangle) in ex vivo culture system from CD34+ CD38- HSPCs, H3K27me3 ChIP-seq is shown on top. Blue shade indicates the site of GLS and HOXA. Arrow points to GLS-HOXA interaction in HSPC.
(G) FKPM value of genes between HOXA cluster and GLS after EZH2 inhibitor treatment in ex vivo culture system from CD34+ CD38- HSPCs. n=2 in each treatment.
(H) 3D model of genomic interactions between GLS and HOXA.
To test this, we deleted the GLS in HSPCs (Gundry et al., 2016) and compared these with unedited wild-type (WT) HSPCs (Figure 7C, Figure S7A). The deletion efficiency of the ~17Kb GLS was estimated at about 50% (Figure 7C). To determine if GLS deletion affected self-renewal and differentiation, we used digital droplet (dd) PCR to quantify the edited and unedited HSPCs in the CD34+ CD38– versus CD34+CD38+ (more differenentiated) fractions (Figure 7D). Cells with GLS deletion were enriched in the more differentiated population (Figure 7E), suggesting maintenance of the GLS is associated with stem cell identity.
Since high H3K27me3 is critical for maintaining grand canyon interactions, we asked if its modulation would hinder the GLS-HOXA interaction and alter gene expression. We treated HSPCs with the EZH2 inhibitor and found that H3K27me3 was reduced at the GLS locus. While the GLS-HOXA interaction became attenuated in the ex vivo expanded HSPCs, it was further disrupted in the presence of the EZH2 inhibitor as seen by Hi-C (Figure 7F). Concomitantly, HOXA9 expression significantly decreased by almost 2-fold (Figure 7G), while the previously repressed HOXA11 gene became activated after EZH2 inhibitor treatment. These data support the concept that the H3K27me3 interactions in the GLS and HOXA canyons are maintaining, rather than repressing, appropriate gene expression at this locus.
In summary, the genetic and epigenetic modulation of the GLS-HOXA interactions support the concept that the GLS-HOXA canyons support a superstructure that enables expression of stem cell-associated transcription factors HOXA9/10 in HSCs. We speculate that this represents a dedicated 3D structure that connects enhancers to the active HOXA genes (Figure 7H). Disruption of the GLS-HOXA canyon interaction results in decreased expression of active HOXA genes.
Discussion
Here we describe a unique class of very long loops that are frequently anchored at DNA methylation canyons bearing histones with the highest levels of the repressive H3K27me3 mark. These loops are highly enriched in stem and progenitor cells, including ES cells, neural stem cells, and HSPCs. Deletion of one particular repressed grand canyon demonstrated a functional association with HSPC multipotency.
These long loops differ from those previously observed in several aspects: (i) they bind CTCF much less frequently; (ii) they do not respect the CTCF convergent rule; and (iii) their anchors form links at arbitrary distances and across different chromosomes. In all of these aspects, the long loops and links we report here are similar to those between super-enhancers (Beagrie et al., 2017; Rao et al., 2017; Sabari et al., 2018). However, they differ in two key ways: (i) the loops and links in HSPCs connect repressed DNA methylation canyons, rather than active regions; and (ii) they form in primary cells under physiological conditions.
Recently, we proposed that some loops form via cohesin-associated extrusion, whereas others form by compartmentalization (Rao et al., 2014; Rao et al., 2017; Sanborn et al., 2015). Loop extrusion is restricted to pairs of loci on the same chromosome, whereas compartmentalization can occur between chromosomes. The grand canyon interactions here appear distinct from the B1 subcompartment. In aggregate, grand canyons only span ~3.5 Mb or roughly 0.1% of the human genome and are more enriched in H3K27me3 than other regions of the genome (Figure 4E). The B1 subcompartment covers a much larger portion of the genome (~400 Mb)(Rao et al., 2014). While polycomb has also been implicated in some long-range interactions in ES cells (Bonev et al., 2017), these were associated with RING1B binding and showed a low association with H3K27me3. Furthermore, from Epigenome Roadmap data (Roadmap Epigenomics et al., 2015), we estimate the entire H3K27me3-covered region in human HSPCs to be on the order of 655 MB. Therefore, the grand canyons that anchor the long loops we are describing represent a tiny subset of the genome that is marked by the highest levels of H3K27me3.
Megabase-size loops have been described in some other studies. The transcription factor LHX1 has been shown to regulate long-range interactions in the context of olfactory receptor expression (Monahan et al.). Similarly, a ~2.8Mb interaction is associated with MYC activation by a super-enhancer (Schuijers et al., 2018). Both of these cases represent interactions between active rather than repressed, loci.
Taken together, our data pinpoint sites of very long-range loops that represent a class of interactions specific to primary stem and progenitor cells. The absence of such interactions in cell lines suggests that tissue culture can affect grand canyon interactions (Figure 5D), but we cannot exclude interactions that improved bioinformatic tools may uncover.
A Phase Separation-Like Nature for Grand Canyon Interactions
These long loops are consistent with a model in which repressed grand canyons tend to co-segregate with multiple anchors simultaneously. Recently, co-segregation of active regions has been proposed to occur as a consequence of phase separation (Hnisz et al., 2017; Larson et al., 2017; Rowley et al., 2017; Strom et al., 2017). Our analysis indicated that the most distant interactions were between canyons exhibiting the highest H3K27me3 signals, suggesting critical levels of H3K27me3 may be required to segregate together and into long range interactions. This concept is supported by the EZH2 inhibitor treatment which led to reduced H3K27me3 and loss of long loops. Together, the H3K27me3 concentration-dependence for the long-range interactions is consistent with a phase separation nature (Alberti, 2017), a concept supported by other studies (Lorzadeh et al., 2016; Xu et al., 2018).
Polycomb proteins have previously been shown to exhibit liquid-liquid phase-separation features by forming condensates mediated by CBX2 or by SAM-domain polymerization of PHC2 (Isono et al., 2013; Pirrotta and Li, 2012; Tatavosian et al., 2018). In the classic polycomb model, PRC1 proteins such as RING1B are recruited by H3K27me3. Thus, an alternative explanation for our data is that high levels of H3K27me3 recruit high levels of PRC1 components such as RING1B that in turn form condensate foci (Isono et al., 2013) when a critical concentration is reached.
The role of DNA methylation in grand canyon interactions
The alignment of the sharply delineated DNA methylation canyons with long distance contacts is striking. We propose that DNA methylation nadirs enable distal interactions in part by guiding precise deposition of histone marks that mediate the genomic interactions. The DNA methylation patterns are maintained by competing DNMT3A and TET protein activity (Gu et al., 2018; Jeong et al., 2014; Zhang et al., 2016), which serve to restrict the boundary of these regions. Our data show that DNA methylation demarcates regions with the highest levels of H3K27me3. Consistent with this role for DNA methylation is the recent observations that DNA methylation is required for the Polycomb-associated interaction in ES cells (McLaughlin et al., 2019).
Interestingly, Drosophila HOX genes, when repressed by polycomb, have been shown to interact at a distance (Bantignies et al., 2011; Boettiger et al., 2016). While drosophila lack DNA methylation, they have polycomb response elements (PREs) that enable formation of well-demarcated polycomb domains. We speculate that the sharp DNA methylation transitions at canyons may enable very high localized polycomb concentrations, analogous to role of the PRE.
If DNA methylation is important, how do DNA methylation changes affect these higher order interactions? Human cell lines used in all early Hi-C studies lack these long-range interactions and are known to exhibit aberrant DNA methylation patterns (Jones, 2012; Jones and Baylin, 2002). Moreover, modest DNA methylation increases at canyons in differentiated erythroid and T-cells are accompanied by a loss of the canyon-canyon interactions. Whether DNA methylation changes alter canyon-canyon interactions needs to be determined.
It is also possible that DNA methylation changes affect long-range through known mechanisms, such as changing the affinity of binding of DNA methylation-sensitive transcription factors (Hashimoto et al., 2016; Lewis and Bird, 1991) or of CTCF (Bell and Felsenfeld, 2000; Hark et al., 2000; Hashimoto et al., 2017). Changes in DNA methylation may affect chromatin organization through multiple non-exclusive mechanisms.
Grand canyon interactions regulates HOXA cluster gene expression in HSPC
The importance of appropriate HOXA locus expression for HSPCs is well established (Di-Poi et al., 2010; Soshnikova et al., 2013). In particular, HOXA9 and HOXA10 are highly expressed in HSPCs, are important for self-renewal, and are commonly dysregulated in acute myeloid leukemia (AML) (Spencer et al., 2015) where they maintain a stem-cell-like state. EZH2 inhibitor treatment led to reduced canyon-canyon interactions and alterations in HOX expression, suggesting that repressed domains can be important for distal gene expression, analogous to role of enhancers. One possible model is that the repressive domains provide a scaffold that enables appropriate HOXA expression (Figure 7H). We propose that polycomb domains, together with local nuclear structure allow a three-dimensional structure that segments the HOXA locus ensuring stable appropriate HOXA gene expresion. The concept of spatially proximate active and repressive domains has some precedent in ES cells and drosophila (Barbieri et al., 2017; Cattoni et al., 2017), but the importance of the repressive domains for appropriate activity of linked regions has not been established.
The GLS represents a heretofore unknown putative regulatory element of the HOXA locus. The mouse GLS homolog has recently been implicated in limb development, also through a proposed interaction between the repressive domain with the HoxA region (Gentile et al., 2019). While most canyons includes the promoter of a protein-coding gene, some, such as the GLS, are upstream of known genes. Importantly, canyon marks are cell-type specific: canyons may bear active or repressive marks depending on the cell type (Jeong et al., 2014). Therefore, the GLS may be active, perhaps as an enhancer, in some contexts (Figure S7B). Given that super-enhancers, which overlap with active canyons when active (Jeong et al., 2014), participate in nuclear condensates (Sabari et al., 2018), and PRC domains are also implicated in a distinct phase, canyons may represent elements that can switch between different types of nuclear condensates.
In summary, we show here that DNA methylation grand canyons represent an important genome element that mediate chromatin looping when decorated with H3K27me3. Rather than forming by extrusion, these loops are likely to form by compartmentalization. These loops and links are enriched in stem and progenitor cells, diminishing as cells differentiate. These findings coalesce observations from several other studies and illuminate the role of DNA methylation in the genome.
STAR method
Lead Contact and Materials Availability
All materials and data are available upon request to Margaret Goodell (goodell@bcm.edu) Raw FISH and immunostaining data are deposited at Mendeley data: DOI: 10.17632/y56xsrrrp8.1. Datasets generated in this study have been deposited in the Gene Expression Omnibus under the Accession number GSE104579, GSE144124, GSE144126, GSE144131. All contact maps reported here can be explored interactively via Juicebox at http://www.aidenlab.org/juicebox/
Experimental Model and Subject Details
HSPCs, T-cells and erythroid progenitors
Human cord blood was obtained under the institutional guidelines of Baylor College of Medicine. CD34+ HSPCs were obtained as lineage negative CD34+CD38- cells, by performing magnetic enrichment for CD34+ cells using Automacs (Milteny Biotech) with human CD34 micro beads (Miltenyi Biotech #130-100-453) and then flow sorting for CD45-FITC (BD #340664), CD34-PE (BD #340669), and CD38-APC (BD #340677). T cells were sorted as CD3+ cells using CD45-FITC (BD #340664), CD3-APC (BD #340661). For erythroid progenitor (EP) cells, 0.5-1X10⁶ cells magnetically enriched for CD34+ were kept in SFEM II stem cell expansion medium (Stem Cell Technologies) supplemented with 50ng/mL SCF, 25ng/mL Flt3L and 50ng/mL TPO for 5 days. CD34+ CD38- HSPCs were then sorted out. Erythroid differentiation was carried out based on previous protocol (Madzo et al., 2014) with modifications. Briefly, CD34+ CD38- progenitors were cultured in 70% IMDM, 15% FBS, 15% human serum (Sigma) supplemented with 50ng/mL human SCF, 2U/mL human EPO (Invitrogen Life technologies) and 2ng/mL human IL3. Culture medium was then replaced by the same base medium with 25ng/mL SCF, 2U/mL EPO on day 3 and 10ng/mL SCF, 2U/mL EPO on day 6. CD36+ CD71+ CD235ahi erythroid progenitors were sorted and then fixed in 1% of formaldehyde for 10 min and quenched in 125mM glycine for 5min. The cell pellet was then collected and stored at –80 for Hi-C library construction.
Method details
In situ Hi-C library construction and data analysis
In situ Hi-C libraries were generated as described in (Rao et al., 2014). Briefly, one to five million cells were crosslinked with 1% formaldehyde for 10 min at room temperature. After nuclei permeabilization, DNA was digested with MboI, and digested fragments were labeled using biotinylated d-ATP and ligated. After reverse crosslinking, ligated DNA was purified and sheared to a length of ~400 bp and biotin labeled DNA fragments were pulled down with streptavidin beads and prepped for Illumina sequencing. The final libraries were sequenced using an Illumina X Ten instrument and sequenced reads were analyzed using the Juicer pipeline (Durand et al., 2016b). We sequenced 1,125,460,828 Hi-C read pairs in HSPC cells, yielding 613,206,292 Hi-C contacts; 965,167,644 Hi-C read pairs in T-cells, yielding 474,124,006 Hi-C contacts; we also sequenced 1,377,731,051 Hi-C read pairs in EP cells, yielding 855,246,973 Hi-C contacts. Loci were assigned to A and B compartments at 500 kB resolution.
Standard loops were annotated using HiCCUPS at 5kB and 10kB resolutions with default Juicer parameters. This yielded a list of 2682 loops in HSPC, 1234 loops in T-cells and 1811 loops in EP.
To identify long loops, we performed visual examination with 25–100kb resolution with balanced normalization mode. We excluded loops that were within 2 Mb of the diagonal, revealing 408 long loops. Contact domains were annotated using the Arrowhead algorithm at 5kB resolution with default Juicer parameters. This yielded a list of 3079 contact domains in HSPC, 563 in T-cells and 306 contact domains in EP.
Long loops could also be identified by running HiCCUPS at course resolution and using less stringent parameters, given the large size of these loops, and the fact that the HSPC Hi-C map was not extremely deep. Specifically, HiCCUPS recognized 34 of 408 long loops in this mode.
All the code used in the above steps is publicly available at (github.com/theaidenlab). The Hi-C maps can be viewed at aidenlab.org/juicebox and additional resources are available at aidenlab.org.
CRISPR-mediated deletion in CD34+ cells
Cas9 protein (PNA bio/ IDT/NEB) and in vitro transcribed sgRNA (NEB Hi-Scribe kit) was used to delete the geneless canyon as previously described (Gundry et al., 2016) using in vitro transcribed sgRNAs. 1ug Cas9 protein and a total of 1ug sgRNA were incubated at room temperature for 15min. 2X10⁵ CD34+ cells were electroporated with the Neon transfection system with R buffer. One day after electroporation, cells were taken out to assay for the deletion.
The oligos for sgRNA synthesis and Canyon deletion detection is listed below (target sequence in sgRNA is in Upper case):
GLS-sgRNA-5’: ttaatacgactcactataGGAAAAGACACACCGGCGTGgttttagagctagaaatagc
GLS-sgRNA-3’: ttaatacgactcactataGGTCAGGAGGAAGGAGAACCgttttagagctagaaatagc
GLS-del-F: TCCTACTGTGCAGTTGTGTATG
GLS-del-R’: ATGGGATGAGCAAATGGAAATG
GLS-WT-F: GACAGAAACTTC CCA GGA TGG
GLS-WT-R: GGGTTGGTGAGATTAGCCATAAA
Cord Blood CD34+ HSPCs were isolated as previously described and placed in the CD34+ expansion medium- SFEM medium (Stem Cell Technology) supplemented with 100ng/mL human SCF, 100ng/mL human FLT3 and 100ng/mL human TPO. One day after culture expansion, 2×10⁵ cord blood CD34+ HSPC is electroporated with Cas9 RNP complex and placed into CD34+ expansion medium. 16–24hrs later, Cells are tested for the deletion of desired regions by PCR and RNA is extracted and saved for RNA-seq analysis. For the colony forming assay, CD34+ CD38- HSPC (CD34-APC, CD38-PE both from BD) is sorted and plated into 6well plate with methocult medium (StemCell Technologies #4034). Sorted live cells were crosslinked with fresh 1% formaldehyde and stored for Hi-C library preparation.
EZH2 inhibitor treatment
CD34+ cells are cultured in ex vivo expansion medium with SFEM II medium with human TPO, SCF and FLT3L (100μg/mL each). DMSO or 0.5μM EPZ-6438 was added to medium. Cells are maintained for 6–7 days. Then CD34+ CD38- cells are isolated with flow cytometry using CD34+ CD38- antibody listed above. Isolated cells are fixed with formaldehyde as described in ChIP-seq protocol for in situ HiC and ChIP-seq.
Whole genome bisulfite sequencing (WGBS) and analysis
WGBS was performed on EP cells purified as described above. Genomic DNA was extracted from the sorted EPs using the PureLink Genomic DNA mini kit (Invitrogen #K182001). Bisulfite conversion and purification was carried out using 100ng of genomic DNA and the EZ DNA Methylation Gold kit (Zymo Research #D5005). After bisulfite conversion, Truseq DNA Methylation kit (Illumina, #EGMK81312) was used for WGBS library preparation. Briefly, after bisulfite conversion, the DNA synthesis primers were annealed to the converted and denatured ssDNA. DNA was synthesized from the random hexamers with a terminal tag. After making di-tagged DNA Ampure XP beads (Beckman Coulter # 5067-5582) were used. Finally, illumina single-index primers were added and the library was amplified for 10 cycles at 95°C for 30 seconds, 55°C for 30 seconds, 68°C for 3 minutes. The PCR amplified final library was cleaned up using 1X Ampure XP beads and quantified using the KAPA library quantification kit (Kapa Biosystem #KK4844). Finally, 1 ul of undiluted library was run on the tape station using D1000 screen tape (Agilent #5056-5582). Paired end 85bp sequencing was performed using Nextseq 500 mid output kit (FC-404-2001) with the illumina NextSeq platform. The software of BSMAP(Xi and Li, 2009) was used to align the reads to the human genome (hg19), and the adapters and low-quality sequences were trimmed as the default threshold of BSMAP. The methylation ratio of CpGs with sequencing depth of at least 5 reads were computed using the software MOABS(Sun et al., 2014). The genome-wide under-methylated regions (UMRs) were identified based on a two-state first-order hidden Markov model as described previously (Jeong et al., 2014). WGBS data for HSPCs (GSM916025) and T-cells (GSM1186660) was obtained from ENCODE.
Canyon Identification
To identify HSPC DNA methylation canyons, we used a Hidden Markov Model to identify UMRs with average proportion of methylation ≤ 10% and required at least 5 CpGs per kb to satisfy the permutation-based FDR 5%. UMRs of 3.5 kb or longer were defined as canyons, and those 7.5 kb or longer were defined as grand canyons.
DNA FISH
3D FISH was adapted from (Bonev et al., 2017). Briefly, HSPCs, T and EP cells were crosslinked with 1% PFA in PBS for 10 min at room temperature. After nuclei permeabilization, Chromosome FISH probes (Empiregenomics) were added to slide and sealed the coverslip with rubber cement. Cell DNA and probes were co-denaturated at 72°C for 2 minutes and hybridization was performed at 42°C overnight in Thermobrite (Abbot molecular). Cells were then washed 2 min at 72°C 0.3% Igepal/0.4XSSC and 1 min at RT 0.1%Igepal/2X SSC. After washing coverslips were mounted on slides with Vectashield (Clinisciences, France). Images were taken on an API Deltavision deconvolution microscope (Applied Precision).
ChIP-sequencing (ChIP-seq)
Chromatin Immunoprecipitation (ChIP) was performed as described previously (Luo et al 2015). Briefly, Sorted HSPCs were cross linked with 1% formaldehyde at room temperature for 10 min, and the reaction was stopped by 0.125M glycine at RT 5 min. Cross linked cells were washed once with ice cold PBS containing protease inhibitor cocktail (GenDepot #P3100-001) and the cell pellet was stored at −80°C. Cells were thawed on ice and lysed in 50μl lysis buffer (10 mM Tris pH 7.5, 1mM EDTA, 1% SDS), then diluted with 150 μl of PBS/PIC, and sonicated using Bioruptor (Diagenode) 30sec on 30 sec off 7 cycles to 200–500 bp fragments. The sonicated chromatin was centrifuged at 4°C for 5 min at 13,000rpm to remove precipitated SDS. 180 μl was then transferred to a new 0.5 ml collection tube, and 180 μl of 2X RIPA buffer (20 mM Tris pH 7.5, 2 mM EDTA, 2%Triton X-100, 0.2% SDS, 0.2% sodium deoxycholate, 200 mM NaCl/PIC) was added to recovered supernatants. A 1 /10 volume (36 μl) was removed for input control. ChIP-qualified CTCF (Cell signaling #2899), H3K27ac (abcam #ab4729) and H3K27me3 (Millipore #07-449) antibodies were added to the sonicated chromatin and incubated at 4°C overnight. Previously washed 10 μl of protein A magnetic beads (Invitrogen #88846) were added and incubated for additional 2 hours at 4°C. Immunoprecipitated complexes were washed three times with RIPA buffer and twice with TE (10 mM Tris pH 8.0/1 mM EDTA) buffer. Following transfer into new 1.5 ml collection tube, genomic DNA was eluted for 2 hours at 68 °C in 100 μl Complete Elution Buffer (20 mM Tris pH 7.5, 5 mM EDTA, 50 mM NaCl, 1% SDS, 50 μg/ml proteinase K), and combined with a second elution of 100 μl Elution Buffer (20 mM Tris pH 7.5, 5 mM EDTA, 50 mM NaCl) for 10 min at 68 °C. ChIPed DNA was purified by MinElute Purification Kit (Qiagen #28006) and eluted in 12 μl elution buffer. ChIP-seq libraries were prepared using ThruPLEX-DNA library preparation kit without extra amplification (Rubicon #R400406). Paired-end 85bp sequencing was performed on Illumina NextSeq 500. The sequenced reads were aligned to the human genome (hg19) using Bowtie2 (version 2.2.1) allowing at most two mismatches. H3K27ac and CTCF enriched regions were determined using Model-based Analysis of ChIP-Seq (MACS) 2.1.1 using a p-value threshold of 1e-9. For H3K27me3, the – broadPeaks flag was used to call enriched regions. Tracks were generated using bedtools genomecov (version 2.25.0) to compute coverage across the entire genome.
CTCF occupancy and orientation
The list of loops called by HiCCUPS was split into 4 groups based on the length of the loops: 0–1Mb, 1–2Mb, 2–3Mb and over 3Mb. Then the loops within each group were split into anchors and overlapping anchors were merged using bedtools. Anchors smaller than 15kb were expanded to 15kb and the number of anchors that overlap with at least one CTCF ChiP-seq peaks were counted using bedtools. We calculated fold enrichment of CTCF occupancy by comparing the counts with the average overlap of ten random translational controls with the same length distribution as the loop anchors. Orientation of CTCF motifs at loop anchors was identified using MotifFinder in Juicer (Durand et al., 2016b). Only loop anchors with a unique CTCF motif identified were included in the calculation. Similarly, we took the list of long loops annotated by hand, split the long loops into anchors, merged overlapping anchors, and counted the number of anchors that overlap with at least one CTCF ChiP-seq peak. Orientation of CTCF motifs at long loop anchors was identified using MotifFinder in Juicer. Only long loop anchors with a unique CTCF motif identified were included in the calculation.
RNA-Seq
Total RNA was extracted from cells using RNeasy mini kit (Qiagen). RNA-seq was performed using the illumine Truseq Stranded mRNA library kit (Illumina #RS-122-2101). Total RNA was isolated from the sorted HSCs using RNeasy micro kit (Qiagen #28006) together with RNase-free DNase treatment on the column (Qiagen #79254). RNA samples were poly-A selected and fragmented at 94 for 8 min. First strand and second strand cDNA synthesized and followed by A-tailing and adaptor ligation. Ligated double strand libraries are purified and amplified 8–9 cycles. Multiplexed libraries are pooled and paired-end 85bp sequencing was performed on Illumina NextSeq 500. Reads were mapped to the genome using hisat2 (version 2.0.4). Transcript assembly was performed using cuffquant followed by cuffnorm mapped to hg19 refSeq annotation.
Aggregated peak analysis (APA) of canyon interaction
The original APA was implemented in Juicer (Durand et al., 2016b). To accommodate inter-chromosomal interaction probing and varying color scales, we implemented a revised version of APA for canyon interactions. To check for interaction patterns across distances, we implemented APAvsDistance, which completes Aggregate Peak Analysis (APA) on multiple sets of peaks in a contact matrix, where each set is defined by a range of distances, containing peaks with anchors separated by a distance within that predetermined range. We divided a list of canyons into subgroups based on length or histone activity. For each subgroup, we paired the canyons using an all-by-all method, generating a list of 2D locations where canyons could interact in theory. The locations are binned based on the distance between the anchoring canyons, with each bin covering a predetermined range. APA was run on the list of locations in each bin at 10Kb resolution. The resulting APA plot and APA score show the aggregate signal from the listed locations in each bin, and collectively show the change in aggregate signal when anchoring canyons are separated at different distances in the respective subgroup. In addition, we generated lists of inter-chromosomal interactions for canyons in each subgroup and ran APA on those lists. As control, we ran APAvsDistance on HiCCUPS loops in HSPC and three published in situ Hi-C data sets: GM12878, IMR90 and HMEC. The loop lists were split into anchors and using an all-by-all method, generating a list of 2D locations where loop anchors could interact in theory. The original loop list is excluded to remove bias as those locations definitely carry strong peak signal.
APA analysis on published Hi-C data
APA from Juicer was run using lists of HSPC loops, HSPC loops with convergent CTCF, HSPC loops with HSPC repressive grand canyons, HSPC Long loops without HSPC repressive grand canyons, HSPC Long loops with HSPC repressive grand canyons, pairs of HSPC repressive grand canyons and pairs of mouse HSC repressive grand canyons on published in situ Hi-C data sets at 10Kb resolution. The peak enrichment in HSPC was set to 100% and the peak enrichment in the other maps were calculated as a percentage of the peak enrichment in HSPC.
Cross sample H3K27me3 ChIP-seq analysis and data visualization
H3K27me3 and corresponding ChIP-seq reads were trimmed to exclude low quality bases and adapter sequences using Trim Galore (v0.5.0). The trimmed reads were then mapped to the hg19 reference genome with bowtie2(v2.4.3)(Langmead and Salzberg, 2012). uniquely alignments were kept for downstream analysis. For visualization of H3K27me3 signal over grand canyons, canyons, cUMRs and their flanking 5kb regions, bamCompare(deeptools v3.1.3 ) was used to count RPKM(duplicates were ignored, with signal of input subtracted ) of each 100bp bin(Ramirez et al., 2014).
Data availability
Datasets generated in this study have been deposited in the Gene Expression Omnibus under the Accession number GSE104579, GSE144124, GSE144126, GSE144131.
Supplementary Material
Movie S1. Related to Figure 2. 3D rotation DNA FISH image of the HSPC nucleus. HOXD (green), DLX1(red) and Control (blue).
Movie S2. Related to Figure 2. 3D rotation DNA FISH image of the HSPC nucleus. HOXD (green), DLX1(red) and PAX3 (blue).
Movie S3. Related to Figure 2. 3D rotation DNA FISH image of the HSPC/T cell/EP nucleus for HOXD (green), DLX1(red) and PAX3 (blue); TWST1(red) and HOXA (blue).
Table S1. Related to Figure 1. Hi-C statistics
Table S2. Related to Figure 2. HSPC short and Long loops
Table S3. Related to Figure 3. DNA methylation canyons
KEY RESOURCES TABLE.
| REAGENT or RESOURCE | SOURCE | IDENTIFIER |
| Antibodies | ||
| CD34 Micro beads | Miltenyi Biotech | 130-100-453 |
| Human CD34-PE | BD bioscience | 340699 |
| Human CD45-FITC | BD bioscience | 340664 |
| Human CD38-APC | BD bioscience | 340677 |
| Human CD36-FITC | BD bioscience | 555454 |
| Human CD71-APC | BD bioscience | 551374 |
| Human CD235a-PE | BD bioscience | 340947 |
| H3K27ac | Abcam | Ab4729 |
| H3K27me3 | Millipore | 07-449 |
| CTCF | Cell signaling | 2899 |
| RING1B | Gift from H. Koseki, RIKEN | |
| Chemicals, Peptides, and Recombinant Proteins | ||
| SCF | Peprotech | 300-07 |
| FLT3L | Peprotech | 300-19 |
| TPO | Peprotech | 300-18 |
| IL-3 | Peprotech | 200-03 |
| EPO | Peprotech | 100-64 |
| SFEM II | Stem Cell Technologies | 09655 |
| Cas9 Protein | PNA bio | CP01200 |
| Protease inhibitor cocktail | GenDepot | P3100-001 |
| EZH2 inhibitor-EPZ6438 | Selleckchem | S7128 |
| Biological Samples | ||
| Cord Blood | Stem Cell transplantation Group | http://mdanderson.org/ |
| Critical Commercial Assays | ||
| Truseq DNA methylation kit | Illumina | EGMK81312 |
| Purelink Genomic DNA kit | Invitrogen | K182001 |
| EZ DNA Methylation kit | Zymo Research | D5005 |
| Ampure XP beads | Beckman Coulter | 5067-5582 |
| Kapa Quantification kit | Kapa Biosystem | KK4844 |
| Nextseq Mid output | Illumina | FC-404-2001 |
| MinElute Purification kit | Qiagen | 28006 |
| RNeasy micro kit | Qiagen | 28006 |
| RNase free DNase | Qiagen | 79254 |
| Truseq Stranded mRNA kit | Illumina | RS-122-2101 |
| TruPLEX-DNA library prep kit | Rubicon | R400406 |
| HiScribe RNA Synthesis kit | NEB | E2040S |
| Deposited Data | ||
| Raw NGS data | This Paper |
GSE104579 GSE144124 GSE144126 GSE144131 |
| Analyzed public data | ||
| HSPC H3K27me3 ChIP-seq | Epigenome Roadmap (GSE19465) | GSM486704 |
| EP H3K27me3 ChIP-seq | GEO | |
| CD3+ T cell H3K27me3 ChIP-seq | Epigenome Roadmap(GSE18927) | GSM1102787 |
| K562 H3K27me3 ChIP-seq | ENCODE(GSE29611) | GSM733658 |
| GM12878 H3K27me3 ChIP-seq | ENCODE(GSE29611) | GSM733758 |
| IMR90 H3K27me3 ChIP-seq | Roadmap(GSE16256) | GSM469968 |
| HeLa-S3 H3K27me3 ChIP-seq | ENCODE(GSE29611) | GSM733696 |
| HMEC H3K27me3 ChIP-seq | ENCODE(GSE29611) | GSM733722 |
| NHEK H3K27me3 ChIP-seq | ENCODE(GSE29611) | GSM733701 |
| HCT116 H3K27me3 ChIP-seq | GEO: GSE104334 | GSM2809625 |
| ESC H3K27me3 ChIP-seq | GEO: GSE104334 | GSM2809626 |
| NPC H3K27me3 ChIP-seq | GEO: GSE99009 | GSM2629941 |
| CN H3K27me3 ChIP-seq | GEO: GSE96107 | GSM2533870 |
| Activated B cell H3K27me3 ChIP-seq | GEO: GSE96107 | GSM2533888 |
| Resting B cell H3K27me3 ChIP-seq | GEO: GSE82144 | GSM2184236 |
| GM12878 WGBS | ENCODE | ENCSR890UQO |
| HMEC WGBS | ENCODE | ENCSR656TQD |
| K562 WGBS | ENCODE | ENCSR765JPC |
| IMR90 WGBS | ENCODE | ENCSR888FON |
| HCT116 WGBS | GEO: GSE60106 | GSM1465024 |
| Experimental Models: Cell Lines | ||
| Human Hematopoietic Stem/progenitor Cells | TMC Stem Cell transplantation Group | http://mdanderson.org/ |
| Human T cells | TMC Stem Cell transplantation Group | http://mdanderson.org/ |
| FISH probes | ||
| GLC-Green-dUTP | BAC clone: RP11-1025G19 | Invitrogen |
| Repressive HOXA-Orange-dUTP | BAC clone: RP11-598H18 | Invitrogen |
| TWIST1-Orange-dUTP | BAC clone: RP11.C-178P2 | Invitrogen |
| Oligonucleotides | ||
| GLS-sgRNA-5’ | ttaatacgactcactataGGAAAAGACACACCGGCGTGgttttagagctagaaatagc | IDT |
| GLS-sgRNA-3’ | ttaatacgactcactataGGTCAGGAGGAAGGAGAACCgttttagagctagaaatagc | IDT |
| GLS-del-F | TCCTACTGTGCAGTTGTGTATG | IDT |
| GLS-del-R | ATGGGATGAGCAAATGGAAATG | IDT |
| GLS-WT-F | GACAGAAACTTC CCA GGA TGG | IDT |
| GLS-WT-R | GGGTTGGTGAGATTAGCCATAAA | IDT |
| Software and Algorithms | ||
| Juicer | (Durand et al., 2016b) | https://github.com/theaidenlab/juicer/wiki |
| Juicebox | (Durand et al., 2016a; Durand et al., 2016b) | http://aidenlab.org/juicebox/ |
| MACS2.0 | (Zhang et al., 2008) | https://github.com/taoliu/MACS |
| BSMAP | (Xi and Li, 2009) | https://github.com/genome-vendor/bsmap |
| HISAT2 | (Kim et al., 2018) | https://github.com/infphilo/hisat2 |
| Bowtie2 | (Langmead and Salzberg, 2012) | http://bowtie-bio.sourceforge.net/bowtie2/index.shtml |
| deepTools | (Ramirez et al., 2014) | https://deeptools.readthedocs.io/en/develop/ |
| Trim Glore | https://www.bioinformatics.babraham.ac.uk/projects/trim_galore/ | |
| APA | This Paper (Durand et al., 2016b) | |
Bullet Points.
Long DNA methylation canyons (grand canyon) form Mb-scale 3D genomic interactions
Grand canyon 3D interactions are specific to primary stem and progenitor cells
Grand canyon 3D interactions do not require CTCF and cohesion
High H3K27me3 levels in grand canyons are required for their interactions
Acknowledgements
This work was supported by NIH grants: CA125123, 1DP2OD008540, HG007538 CA228140, DK092883, DK56338, CA183252, 5T32DK60445, U01HL130010, UM1HG009375, ES030285, 1S10OD023469, and the Sam Waxman Cancer Research Foundation Investigator. Also, by the NSF (PHY-1427654), the Welch Foundation (Q-1866), an NVIDIA Research Award, an IBM University Challenge Award, a Google Research Award, the Cancer Prevention Research Institute of Texas (R1304; RP180672, RR024574, RP150578, RP170719), the McNair Medical Institute, and the President’s Early Career Award in Science and Engineering. X.Z is supported by the American Society of Hematology, the EvansMDS Foundation and a VARI fellowship. We also thank Dr. Xudong Wu (Tianjin Medical University) and Dr. Fei Lan (Fudan University) for helpful discussions.
Footnotes
Declaration of Interests
All authors have no conflict of interest to declare.
Publisher's Disclaimer: This is a PDF file of an unedited manuscript that has been accepted for publication. As a service to our customers we are providing this early version of the manuscript. The manuscript will undergo copyediting, typesetting, and review of the resulting proof before it is published in its final form. Please note that during the production process errors may be discovered which could affect the content, and all legal disclaimers that apply to the journal pertain.
References
- Alberti S (2017). Phase separation in biology. Curr Biol 27, R1097–R1102. [DOI] [PubMed] [Google Scholar]
- Alipour E, and Marko JF (2012). Self-organization of domain structures by DNA-loop-extruding enzymes. Nucleic Acids Res 40, 11202–11212. [DOI] [PMC free article] [PubMed] [Google Scholar]
- Bantignies F, Roure V, Comet I, Leblanc B, Schuettengruber B, Bonnet J, Tixier V, Mas A, and Cavalli G (2011). Polycomb-dependent regulatory contacts between distant Hox loci in Drosophila. Cell 144, 214–226. [DOI] [PubMed] [Google Scholar]
- Barbieri M, Xie SQ, Torlai Triglia E, Chiariello AM, Bianco S, de Santiago I, Branco MR, Rueda D, Nicodemi M, and Pombo A (2017). Active and poised promoter states drive folding of the extended HoxB locus in mouse embryonic stem cells. Nat Struct Mol Biol 24, 515–524. [DOI] [PubMed] [Google Scholar]
- Beagrie RA, Scialdone A, Schueler M, Kraemer DC, Chotalia M, Xie SQ, Barbieri M, de Santiago I, Lavitas LM, Branco MR, et al. (2017). Complex multi-enhancer contacts captured by genome architecture mapping. Nature 543, 519–524. [DOI] [PMC free article] [PubMed] [Google Scholar]
- Bell AC, and Felsenfeld G (2000). Methylation of a CTCF-dependent boundary controls imprinted expression of the Igf2 gene. Nature 405, 482–485. [DOI] [PubMed] [Google Scholar]
- Bird A, Taggart M, Frommer M, Miller OJ, and Macleod D (1985). A fraction of the mouse genome that is derived from islands of nonmethylated, CpG-rich DNA. Cell 40, 91–99. [DOI] [PubMed] [Google Scholar]
- Boettiger AN, Bintu B, Moffitt JR, Wang S, Beliveau BJ, Fudenberg G, Imakaev M, Mirny LA, Wu CT, and Zhuang X (2016). Super-resolution imaging reveals distinct chromatin folding for different epigenetic states. Nature 529, 418–422. [DOI] [PMC free article] [PubMed] [Google Scholar]
- Bonev B, Mendelson Cohen N, Szabo Q, Fritsch L, Papadopoulos GL, Lubling Y, Xu X, Lv X, Hugnot JP, Tanay A, et al. (2017). Multiscale 3D Genome Rewiring during Mouse Neural Development. Cell 171, 557–572 e524. [DOI] [PMC free article] [PubMed] [Google Scholar]
- Cattoni DI, Cardozo Gizzi AM, Georgieva M, Di Stefano M, Valeri A, Chamousset D, Houbron C, Dejardin S, Fiche J-B, Marti-Renom MA, et al. (2017). Single-cell absolute contact probability detection reveals that chromosomes are organized by modulated stochasticity. bioRxiv. [DOI] [PMC free article] [PubMed] [Google Scholar]
- Challen GA, Sun D, Jeong M, Luo M, Jelinek J, Berg JS, Bock C, Vasanthakumar A, Gu H, Xi Y, et al. (2011). Dnmt3a is essential for hematopoietic stem cell differentiation. Nat Genet 44, 23–31. [DOI] [PMC free article] [PubMed] [Google Scholar]
- Choi JW, Lee SY, and Choi Y (1996). Identification of a putative G protein-coupled receptor induced during activation-induced apoptosis of T cells. Cell Immunol 168, 78–84. [DOI] [PubMed] [Google Scholar]
- Cullen KE, Kladde MP, and Seyfred MA (1993). Interaction between transcription regulatory regions of prolactin chromatin. Science 261, 203–206. [DOI] [PubMed] [Google Scholar]
- Darrow EM, Huntley MH, Dudchenko O, Stamenova EK, Durand NC, Sun Z, Huang SC, Sanborn AL, Machol I, Shamim M, et al. (2016). Deletion of DXZ4 on the human inactive X chromosome alters higher-order genome architecture. Proc Natl Acad Sci U S A 113, E4504–4512. [DOI] [PMC free article] [PubMed] [Google Scholar]
- Di-Poi N, Koch U, Radtke F, and Duboule D (2010). Additive and global functions of HoxA cluster genes in mesoderm derivatives. Dev Biol 341, 488–498. [DOI] [PubMed] [Google Scholar]
- Dixon JR, Jung I, Selvaraj S, Shen Y, Antosiewicz-Bourget JE, Lee AY, Ye Z, Kim A, Rajagopal N, Xie W, et al. (2015). Chromatin architecture reorganization during stem cell differentiation. Nature 518, 331–336. [DOI] [PMC free article] [PubMed] [Google Scholar]
- Dixon JR, Selvaraj S, Yue F, Kim A, Li Y, Shen Y, Hu M, Liu JS, and Ren B (2012). Topological domains in mammalian genomes identified by analysis of chromatin interactions. Nature 485, 376–380. [DOI] [PMC free article] [PubMed] [Google Scholar]
- Durand NC, Robinson JT, Shamim MS, Machol I, Mesirov JP, Lander ES, and Aiden EL (2016a). Juicebox Provides a Visualization System for Hi-C Contact Maps with Unlimited Zoom. Cell Syst 3, 99–101. [DOI] [PMC free article] [PubMed] [Google Scholar]
- Durand NC, Shamim MS, Machol I, Rao SS, Huntley MH, Lander ES, and Aiden EL (2016b). Juicer Provides a One-Click System for Analyzing Loop-Resolution Hi-C Experiments. Cell Syst 3, 95–98. [DOI] [PMC free article] [PubMed] [Google Scholar]
- Fudenberg G, Imakaev M, Lu C, Goloborodko A, Abdennur N, and Mirny LA (2016). Formation of Chromosomal Domains by Loop Extrusion. Cell Rep 15, 2038–2049. [DOI] [PMC free article] [PubMed] [Google Scholar]
- Gentile C, Berlivet S, Mayran A, Paquette D, Guerard-Millet F, Bajon E, Dostie J, and Kmita M (2019). PRC2-Associated Chromatin Contacts in the Developing Limb Reveal a Possible Mechanism for the Atypical Role of PRC2 in HoxA Gene Expression. Dev Cell. [DOI] [PubMed] [Google Scholar]
- Gu T, Lin X, Cullen SM, Luo M, Jeong M, Estecio M, Shen J, Hardikar S, Sun D, Su J, et al. (2018). DNMT3A and TET1 cooperate to regulate promoter epigenetic landscapes in mouse embryonic stem cells. Genome biology 19, 88. [DOI] [PMC free article] [PubMed] [Google Scholar]
- Gundry MC, Brunetti L, Lin A, Mayle AE, Kitano A, Wagner D, Hsu JI, Hoegenauer KA, Rooney CM, Goodell MA, et al. (2016). Highly Efficient Genome Editing of Murine and Human Hematopoietic Progenitor Cells by CRISPR/Cas9. Cell Rep 17, 1453–1461. [DOI] [PMC free article] [PubMed] [Google Scholar]
- Haarhuis JHI, van der Weide RH, Blomen VA, Yanez-Cuna JO, Amendola M, van Ruiten MS, Krijger PHL, Teunissen H, Medema RH, van Steensel B, et al. (2017). The Cohesin Release Factor WAPL Restricts Chromatin Loop Extension. Cell 169, 693–707 e614. [DOI] [PMC free article] [PubMed] [Google Scholar]
- Hark AT, Schoenherr CJ, Katz DJ, Ingram RS, Levorse JM, and Tilghman SM (2000). CTCF mediates methylation-sensitive enhancer-blocking activity at the H19/Igf2 locus. Nature 405, 486–489. [DOI] [PubMed] [Google Scholar]
- Hashimoto H, Wang D, Horton JR, Zhang X, Corces VG, and Cheng X (2017). Structural Basis for the Versatile and Methylation-Dependent Binding of CTCF to DNA. Mol Cell 66, 711–720 e713. [DOI] [PMC free article] [PubMed] [Google Scholar]
- Hashimoto H, Wang D, Steves AN, Jin P, Blumenthal RM, Zhang X, and Cheng X (2016). Distinctive Klf4 mutants determine preference for DNA methylation status. Nucleic Acids Res 44, 10177–10185. [DOI] [PMC free article] [PubMed] [Google Scholar]
- Hnisz D, Shrinivas K, Young RA, Chakraborty AK, and Sharp PA (2017). A Phase Separation Model for Transcriptional Control. Cell 169, 13–23. [DOI] [PMC free article] [PubMed] [Google Scholar]
- Isono K, Endo TA, Ku M, Yamada D, Suzuki R, Sharif J, Ishikura T, Toyoda T, Bernstein BE, and Koseki H (2013). SAM domain polymerization links subnuclear clustering of PRC1 to gene silencing. Dev Cell 26, 565–577. [DOI] [PubMed] [Google Scholar]
- Jeong M, Sun D, Luo M, Huang Y, Challen GA, Rodriguez B, Zhang X, Chavez L, Wang H, Hannah R, et al. (2014). Large conserved domains of low DNA methylation maintained by Dnmt3a. Nat Genet 46, 17–23. [DOI] [PMC free article] [PubMed] [Google Scholar]
- Jones PA (2012). Functions of DNA methylation: islands, start sites, gene bodies and beyond. Nat Rev Genet 13, 484–492. [DOI] [PubMed] [Google Scholar]
- Jones PA, and Baylin SB (2002). The fundamental role of epigenetic events in cancer. Nat Rev Genet 3, 415–428. [DOI] [PubMed] [Google Scholar]
- Kieffer-Kwon KR, Nimura K, Rao SSP, Xu J, Jung S, Pekowska A, Dose M, Stevens E, Mathe E, Dong P, et al. (2017). Myc Regulates Chromatin Decompaction and Nuclear Architecture during B Cell Activation. Mol Cell 67, 566–578 e510. [DOI] [PMC free article] [PubMed] [Google Scholar]
- Kim T, Seo HD, Hennighausen L, Lee D, and Kang K (2018). Octopus-toolkit: a workflow to automate mining of public epigenomic and transcriptomic next-generation sequencing data. Nucleic Acids Res 46, e53. [DOI] [PMC free article] [PubMed] [Google Scholar]
- Langmead B, and Salzberg SL (2012). Fast gapped-read alignment with Bowtie 2. Nat Methods 9, 357–359. [DOI] [PMC free article] [PubMed] [Google Scholar]
- Larson AG, Elnatan D, Keenen MM, Trnka MJ, Johnston JB, Burlingame AL, Agard DA, Redding S, and Narlikar GJ (2017). Liquid droplet formation by HP1alpha suggests a role for phase separation in heterochromatin. Nature 547, 236–240. [DOI] [PMC free article] [PubMed] [Google Scholar]
- Lewis J, and Bird A (1991). DNA methylation and chromatin structure. FEBS Lett 285, 155–159. [DOI] [PubMed] [Google Scholar]
- Lieberman-Aiden E, van Berkum NL, Williams L, Imakaev M, Ragoczy T, Telling A, Amit I, Lajoie BR, Sabo PJ, Dorschner MO, et al. (2009). Comprehensive mapping of long-range interactions reveals folding principles of the human genome. Science 326, 289–293. [DOI] [PMC free article] [PubMed] [Google Scholar]
- Lorzadeh A, Bilenky M, Hammond C, Knapp D, Li L, Miller PH, Carles A, Heravi-Moussavi A, Gakkhar S, Moksa M, et al. (2016). Nucleosome Density ChIP-Seq Identifies Distinct Chromatin Modification Signatures Associated with MNase Accessibility. Cell Rep 17, 2112–2124. [DOI] [PubMed] [Google Scholar]
- Madzo J, Liu H, Rodriguez A, Vasanthakumar A, Sundaravel S, Caces DBD, Looney TJ, Zhang L, Lepore JB, Macrae T, et al. (2014). Hydroxymethylation at gene regulatory regions directs stem/early progenitor cell commitment during erythropoiesis. Cell Rep 6, 231–244. [DOI] [PMC free article] [PubMed] [Google Scholar]
- McLaughlin K, Flyamer IM, Thomson JP, Mjoseng HK, Shukla R, Williamson I, Grimes GR, Illingworth RS, Adams IR, Pennings S, et al. (2019). DNA Methylation Directs Polycomb-Dependent 3D Genome Re-organization in Naive Pluripotency. Cell Rep 29, 1974–1985 e1976. [DOI] [PMC free article] [PubMed] [Google Scholar]
- Monahan K, Horta A, and Lomvardas S (2019). LHX2- and LDB1-mediated trans interactions regulate olfactory receptor choice. Nature 565, 448–453. [DOI] [PMC free article] [PubMed] [Google Scholar]
- Nasmyth K (2001). Disseminating the genome: joining, resolving, and separating sister chromatids during mitosis and meiosis. Annu Rev Genet 35, 673–745. [DOI] [PubMed] [Google Scholar]
- Nichols MH, and Corces VG (2015). A CTCF Code for 3D Genome Architecture. Cell 162, 703–705. [DOI] [PMC free article] [PubMed] [Google Scholar]
- Nora EP, Goloborodko A, Valton AL, Gibcus JH, Uebersohn A, Abdennur N, Dekker J, Mirny LA, and Bruneau BG (2017). Targeted Degradation of CTCF Decouples Local Insulation of Chromosome Domains from Genomic Compartmentalization. Cell 169, 930–944 e922. [DOI] [PMC free article] [PubMed] [Google Scholar]
- Pirrotta V, and Li HB (2012). A view of nuclear Polycomb bodies. Curr Opin Genet Dev 22, 101–109. [DOI] [PMC free article] [PubMed] [Google Scholar]
- Ramirez F, Dundar F, Diehl S, Gruning BA, and Manke T (2014). deepTools: a flexible platform for exploring deep-sequencing data. Nucleic Acids Res 42, W187–191. [DOI] [PMC free article] [PubMed] [Google Scholar]
- Rao SS, Huntley MH, Durand NC, Stamenova EK, Bochkov ID, Robinson JT, Sanborn AL, Machol I, Omer AD, Lander ES, et al. (2014). A 3D map of the human genome at kilobase resolution reveals principles of chromatin looping. Cell 159, 1665–1680. [DOI] [PMC free article] [PubMed] [Google Scholar]
- Rao SSP, Huang SC, Glenn St Hilaire B, Engreitz JM, Perez EM, Kieffer-Kwon KR, Sanborn AL, Johnstone SE, Bascom GD, Bochkov ID, et al. (2017). Cohesin Loss Eliminates All Loop Domains. Cell 171, 305–320 e324. [DOI] [PMC free article] [PubMed] [Google Scholar]
- Roadmap Epigenomics C, Kundaje A, Meuleman W, Ernst J, Bilenky M, Yen A, Heravi-Moussavi A, Kheradpour P, Zhang Z, Wang J, et al. (2015). Integrative analysis of 111 reference human epigenomes. Nature 518, 317–330. [DOI] [PMC free article] [PubMed] [Google Scholar]
- Rowley MJ, Nichols MH, Lyu X, Ando-Kuri M, Rivera ISM, Hermetz K, Wang P, Ruan Y, and Corces VG (2017). Evolutionarily Conserved Principles Predict 3D Chromatin Organization. Mol Cell 67, 837–852 e837. [DOI] [PMC free article] [PubMed] [Google Scholar]
- Sabari BR, Dall’Agnese A, Boija A, Klein IA, Coffey EL, Shrinivas K, Abraham BJ, Hannett NM, Zamudio AV, Manteiga JC, et al. (2018). Coactivator condensation at super-enhancers links phase separation and gene control. Science. [DOI] [PMC free article] [PubMed] [Google Scholar]
- Sanborn AL, Rao SS, Huang SC, Durand NC, Huntley MH, Jewett AI, Bochkov ID, Chinnappan D, Cutkosky A, Li J, et al. (2015). Chromatin extrusion explains key features of loop and domain formation in wild-type and engineered genomes. Proc Natl Acad Sci U S A 112, E6456–6465. [DOI] [PMC free article] [PubMed] [Google Scholar]
- Schuijers J, Manteiga JC, Weintraub AS, Day DS, Zamudio AV, Hnisz D, Lee TI, and Young RA (2018). Transcriptional Dysregulation of MYC Reveals Common Enhancer-Docking Mechanism. Cell Rep 23, 349–360. [DOI] [PMC free article] [PubMed] [Google Scholar]
- Sneeringer CJ, Scott MP, Kuntz KW, Knutson SK, Pollock RM, Richon VM, and Copeland RA (2010). Coordinated activities of wild-type plus mutant EZH2 drive tumor-associated hypertrimethylation of lysine 27 on histone H3 (H3K27) in human B-cell lymphomas. Proc Natl Acad Sci U S A 107, 20980–20985. [DOI] [PMC free article] [PubMed] [Google Scholar]
- Soshnikova N, Dewaele R, Janvier P, Krumlauf R, and Duboule D (2013). Duplications of hox gene clusters and the emergence of vertebrates. Dev Biol 378, 194–199. [DOI] [PubMed] [Google Scholar]
- Spencer DH, Young MA, Lamprecht TL, Helton NM, Fulton R, O’Laughlin M, Fronick C, Magrini V, Demeter RT, Miller CA, et al. (2015). Epigenomic analysis of the HOX gene loci reveals mechanisms that may control canonical expression patterns in AML and normal hematopoietic cells. Leukemia 29, 1279–1289. [DOI] [PMC free article] [PubMed] [Google Scholar]
- Strom AR, Emelyanov AV, Mir M, Fyodorov DV, Darzacq X, and Karpen GH (2017). Phase separation drives heterochromatin domain formation. Nature 547, 241–245. [DOI] [PMC free article] [PubMed] [Google Scholar]
- Sun D, Xi Y, Rodriguez B, Park HJ, Tong P, Meong M, Goodell MA, and Li W (2014). MOABS: model based analysis of bisulfite sequencing data. Genome Biol 15, R38. [DOI] [PMC free article] [PubMed] [Google Scholar]
- Tatavosian R, Kent S, Brown K, Yao T, Duc HN, Huynh TN, Zhen CY, Ma B, Wang H, and Ren X (2018). Nuclear condensates of the Polycomb protein chromobox 2 (CBX2) assemble through phase separation. J Biol Chem. [DOI] [PMC free article] [PubMed] [Google Scholar]
- Xi Y, and Li W (2009). BSMAP: whole genome bisulfite sequence MAPping program. BMC bioinformatics 10, 232. [DOI] [PMC free article] [PubMed] [Google Scholar]
- Xie W, Schultz MD, Lister R, Hou Z, Rajagopal N, Ray P, Whitaker JW, Tian S, Hawkins RD, Leung D, et al. (2013). Epigenomic analysis of multilineage differentiation of human embryonic stem cells. Cell 153, 1134–1148. [DOI] [PMC free article] [PubMed] [Google Scholar]
- Xu J, Ma H, Jin J, Uttam S, Fu R, Huang Y, and Liu Y (2018). Super-Resolution Imaging of Higher-Order Chromatin Structures at Different Epigenomic States in Single Mammalian Cells. Cell Rep 24, 873–882. [DOI] [PMC free article] [PubMed] [Google Scholar]
- Zhang X, Su J, Jeong M, Ko M, Huang Y, Park HJ, Guzman A, Lei Y, Huang YH, Rao A, et al. (2016). DNMT3A and TET2 compete and cooperate to repress lineage-specific transcription factors in hematopoietic stem cells. Nat Genet 48, 1014–1023. [DOI] [PMC free article] [PubMed] [Google Scholar]
- Zhang Y, Liu T, Meyer CA, Eeckhoute J, Johnson DS, Bernstein BE, Nusbaum C, Myers RM, Brown M, Li W, et al. (2008). Model-based analysis of ChIP-Seq (MACS). Genome Biol 9, R137. [DOI] [PMC free article] [PubMed] [Google Scholar]
Associated Data
This section collects any data citations, data availability statements, or supplementary materials included in this article.
Supplementary Materials
Movie S1. Related to Figure 2. 3D rotation DNA FISH image of the HSPC nucleus. HOXD (green), DLX1(red) and Control (blue).
Movie S2. Related to Figure 2. 3D rotation DNA FISH image of the HSPC nucleus. HOXD (green), DLX1(red) and PAX3 (blue).
Movie S3. Related to Figure 2. 3D rotation DNA FISH image of the HSPC/T cell/EP nucleus for HOXD (green), DLX1(red) and PAX3 (blue); TWST1(red) and HOXA (blue).
Table S1. Related to Figure 1. Hi-C statistics
Table S2. Related to Figure 2. HSPC short and Long loops
Table S3. Related to Figure 3. DNA methylation canyons
Data Availability Statement
Datasets generated in this study have been deposited in the Gene Expression Omnibus under the Accession number GSE104579, GSE144124, GSE144126, GSE144131.