

Abstract
The prevalence of chronic kidney disease (CKD) is increasing and dietary interventions may be a strategy to reduce this burden. In the general population, higher potassium intake is considered protective for cardiovascular health. Due to the risk of hyperkalemia in CKD, limiting potassium intake is often recommended. However, given that poor cardiovascular function can cause kidney damage, following a low-potassium diet may be deleterious for patients with CKD. The aim of this systematic review was to summarize the evidence on dietary potassium intake and CKD progression. Multiple databases were searched on 7 June 2019 and data were managed with Covidence. No intervention trials met the inclusion criteria. Eleven observational studies met the inclusion criteria (10 post hoc analyses, 1 retrospective cohort), representing 49,573 stage 1–5 predialysis patients with CKD from 41 different countries. Of the 11 studies, 6 studies reported exclusively on early CKD (stage 1–2), 4 studies separately reported analyses on both early and late (stage 3–5) CKD, and 2 studies reported exclusively on late CKD. A total of 9 studies reported risk of disease progression in early CKD; in 4 studies high potassium intake was associated with lower risk, while in 2 studies the low intake showed a higher progression of risk, and 3 studies reported no relation. In late CKD, results are mixed: 2 studies suggested benefit of higher potassium intake and 1 suggested benefit of lower potassium intake, whereas 3 studies were neutral. These results should be interpreted with caution, as considerations preventing firm conclusions include 1) the overall low range of dietary potassium intake, with all studies reporting an average intake below the 2004 Kidney Disease Outcomes Quality Initiatives guidelines, and 2) the method used to assess potassium intake in most studies (i.e., urine) in late stages of CKD. Ideally, well-controlled intervention studies are needed to understand how dietary potassium intake is linked to CKD progression.
Keywords: chronic kidney disease, potassium, dietary intake, disease progression, pre-dialysis
Introduction
The prevalence of chronic kidney disease (CKD) is growing and dietary interventions may be a potential strategy to ease this growth (1). Potassium is a considered a vital nutrient for human health (2). In the general population, higher dietary potassium intake reduces cardiovascular risk factors (3–5). A systematic review of randomized controlled trials found that higher potassium intake from fruits and vegetables was cardioprotective (6). Additionally, in a cross-sectional study in >500,000 older adults in free-living conditions, the highest quartile of potassium intake (5.5 g/d) was associated with the lowest risk of experiencing death from a renal cause (7). Potassium positively affects cardiovascular function and hypertension through the following: 1) potassium's role in vasodilation and 2) by reducing the intravascular volume of blood plasma through reduced sodium reabsorption (2). Additionally, lower dietary acid load is hypothesized to be protective for kidney health (8–10) and a higher potassium intake lowers dietary acid load.
There is a well-defined bidirectional relation between cardiovascular and renal health (11). Reduced cardiac function increases the risk of renal hypoperfusion and congestion, which are associated with reduced kidney function over time. Reduced kidney function increases the risk of atherosclerosis and atherosclerotic and cardiomyopathy disease (11). Additionally, both cardiovascular and renal disease have common risk factors such as diabetes and hypertension (11). Given this relation, it could be hypothesized that improving cardiovascular health and other risk factors through higher potassium intake could lower CKD progression rates. Despite this, the optimal level of potassium intake that would delay or impact CKD progression is currently not known. No intervention trials have specifically investigated the impact of dietary potassium intake on CKD progression.
A vital consideration for potassium intake in CKD is knowing the importance of maintaining normal serum potassium concentrations to reduce mortality risk (12). A 2018 meta-analysis concluded that hyperkalemia increases the risk of all-cause mortality, cardiovascular mortality, and end-stage renal disease in both the general and CKD population (12). Decreased kidney function is considered the primary risk factor for hyperkalemia, with prevalence rates of hyperkalemia reported to be as high as 11.6% when estimated glomerular filtration rate (eGFR) is ≤40 mL · min−1 · 1.73 m−2, compared with <1.6% when eGFR is >40 mL · min−1 · 1.73 m−2 (13). As decreased kidney function is a risk factor for hyperkalemia, and given the serious health consequences of hyperkalemia (13) in addition to changes in medications, management of glycemic concentrations, and acidosis, dietary potassium restriction is often advised for the CKD population (14–17).
Current recommendations for dietary potassium intake mainly focus on restriction when hyperkalemia is present, yet there is no consensus on the target dietary potassium intake. The 2004 Kidney Disease Outcomes Quality Initiatives (KDOQI) guidelines recommend that patients with CKD stage 3–5 limit potassium to 2–4 g/d (16). The 2010 Academy of Nutrition and Dietetics CKD guidelines recommend that patients with CKD stage 3–5 who have hyperkalemia limit their dietary potassium intake to <2.4 g/d (17). The 2013 Caring for Australians with Renal Impairment guidelines do not stipulate a dietary potassium target but recommend that patients with hyperkalemia lower their potassium intake with the assistance of a dietitian (15). The 2015 Dietitians of Canada Practice-Based Evidence in Nutrition guideline recommends reducing dietary potassium intake to 2 g/d when hyperkalemia is present (14). In 2019, Kidney Disease Improving Global Outcomes (KDIGO) released executive conclusions on potassium management in the CKD population; they highlight the lack of evidence on potassium intake and CKD outcomes (18). Furthermore, they concluded that routine potassium restriction to manage serum concentrations may prevent patients from the benefits of potassium-rich foods (18). In summary, most guidelines recommend limiting potassium intake, although the target is not consistent and a lower limit for potassium intake is rarely specified.
To the best of our knowledge, there is currently no review reporting the findings of studies regarding restriction of potassium intake in CKD and its impact on delaying disease progression, improving hyperkalemia rates, or reducing mortality. The primary outcome was to understand how different amounts of potassium intake impact CKD progression in both early CKD (stage 1–2) and late CKD (stage 3–5). The secondary outcomes were to investigate how potassium intake in CKD impacts mortality and serum potassium concentrations or hyperkalemia rates.
Methods
This review followed the guidelines for Preferred Reporting Items for Systematic Reviews and Meta-Analyses (PRISMA) (19) and used Covidence, a platform provided by Cochrane to standardize systematic reviews, track screening, and manage literature. The PRISMA diagram is presented in Figure 1.
FIGURE 1.

PRISMA diagram. PRISMA, Preferred Reporting Items for Systematic Reviews and Meta-Analyses.
Study eligibility criteria
This review included studies that investigated the association between dietary potassium intake and CKD progression in adults as the primary outcome. If the studies included information on mortality, serum potassium concentrations, or hyperkalemia rates, this information was collected as the secondary outcome. Study inclusion criteria were as follows: the amount of dietary potassium intake was reported, the population had predialysis CKD, and biomarkers of kidney function were provided [e.g., serum creatinine concentrations, eGFR or measured glomerular filtration rate (mGFR), or proteinuria]. Studies were not excluded based on medications taken by the subjects, including renin angiotensin aldosterone system inhibitors (RAASi) or mineralocorticoid receptor antagonists, even though these are known to influence serum potassium concentrations through decreased potassium excretion in the kidney. Exclusion criteria were dialysis, transplant, a pediatric population, and animal studies.
Search strategy
A systematic search of the literature was conducted using multiple databases: MEDLINE, Cumulative Index to Nursing and Allied Health Literature (CINAHL), and EMBASE in the order listed. The search terms included potassium, kidney and disease progression, and all potential synonyms. For the full list of search terms see Supplemental Tables 1–3. No limits were activated during the search to avoid omission of any relevant publications. The database searches were conducted by KP on 7 June 2019. Duplicates found in multiple databases were excluded. Two authors (KP and MIBS) independently screened the titles and abstracts for relevance to the review. Full texts were then reviewed to assess eligibility based on diet intervention, population, and outcomes. Multiple articles published on the same trial were retrieved and reference lists were assessed in order to report on all relevant outcomes. Two authors (KP and MIBS) compared the results and came to a consensus on the final list of papers to include in the review.
Quality assessment for risk of bias within studies
There were no intervention trials found related to this topic. Among the 11 reference articles analyzed in this systematic review, 10 were cross-sectional post hoc analyses of cohort studies (6 prospective longitudinal, 3 randomized controlled trials, and 1 case-control) (20–30). One was a retrospective observational cohort specially designed to assess the association between potassium intake and renal outcomes in patients with diabetes (28). We used the National Heart, Lung, and Blood Institute Quality Assessment Tool for Observational Cohort, Cross-sectional Studies, and Case-Control Studies to assess the quality of each study. Studies were graded in 3 broad categories: the definition and representativeness of the studied population, definition and measurement of exposure and outcome, and data analysis. Each category was broken down into subcategories, with 1 point awarded per subcategory if clearly presented in the article. The maximum score was 20 points, and a score ≥16 (80%) was defined as high quality (Supplemental Table 4).
Results
Data extraction
Data were independently extracted from each study by KP and MIBS using a standard form determined a priori, which included subject characteristics as summarized in Table 1. The outcomes of interest were changes in glomerular filtration rate (GFR), serum creatinine, or proteinuria and initiation of dialysis or transplant to evaluate disease progression. The secondary outcome measures were all-cause mortality and serum potassium concentrations or hyperkalemia rates.
TABLE 1.
Summary of studies1
| Ref | Year | Study design | Subject sample, n | Age, y | Male, % | Baseline kidney function (presented overall when available or based on categories as provided in the articles) | Dietary potassium assessment method | Follow-up duration | ROB score (out of 20)2 |
|---|---|---|---|---|---|---|---|---|---|
| Araki et al. (20) | 2015 | Shiga prospective trial (Japan) | 623 CKD etiology NR | 59 ± 10 | 57 | Overall : eGFR 89 ± 19ACR 12 μg/min (6–29).Per K intake quartile:Q1 eGFR 89(22), ACR 11(5–28)Q2 eGFR89(19), ACR 11 (6–24) Q3 eGFR 87(16), ACR 12 (6–35) Q4 eGFR 87(16), ACR 12 (7–37) | 24-h urine (single measure) | Median 11 y | 18 |
| Chang et al. (21) | 2017 | PREMIER prospective trial (USA) | 481 (subgroup analysis from 810 in the PREMIER trial)CKD etiology NR | 51 (8.5) | 43% Elevated UAE, 38% normal UAE | Elevated UAE ≥10 mg/d; eGFR NR; 24 hour UAE 22 mg/d (13.7–45.2) vs. 3.2 (2.1–5.0) | 24-h urine (baseline and 6 mo) | 6 mo | 19 |
| Deriaz et al. (22) | 2019 | CoLaus prospective trial (Switzerland) | 4141; CKD etiology NR | Men 50.4 (IQR 42.8–60.0) Women 52.5 (IQR 44.3–61.3) | 46% | MeneGFR 87.7 (14.7), ACR: 4.3 (3–7.5) mg/gWomeneGFR 84 (14.6) ACR 5.5 (3.7–9.2) | Spot urine (at baseline) | 5.4 y | 18 |
| He et al. (23) | 2016 | CRIC prospective trial (USA) | 3757CKD etiology: excluded PCKD and GN requiring immunosuppression | Overall NR. As reported across potassium quartiles: Q1 57.5 Q2 57.6 Q3 57.6 Q4 58.2 | Overall NRQ1 40.4Q2 47.7Q3 59.4 Q4 74.9 | Overall eGFR 20–70.As reported across K quartiles:Q1 eGFR 41.5 (15.2)Q2 eGFR 43.4 (14.4)Q3 eGFR 44.5 (14.6)Q4 eGFR 48.5 (14.6) | 24-h urine (baseline, 1 and 2 y) | 15,807 person- year F/U CRIC protocol was 60 mo | 18 |
| Kim et al. (24) | 2019 | KNOW-CKD prospective trial (Korea) | 1821CKD etiology: DN 24% HTN 18% GN 35%PCKD 18% Other 6% | 55 | 61 | Overall eGFR 47 (29-75)As reported across K quartiles:Q1 eGFR 38 (24-63) Q2 eGFR 44 (29-68)Q3 eGFR 46 (29-73)Q4 eGFR 58 (36-93) | Spot UK:CrSpot UK24-h UK | 5326 person-year F/UKNOW-CKD protocol was 10y F/U | 18 |
| Leonberg-Yoo et al. (25) | 2017 | MDRD prospective cohort (USA) | 812CKD etiology:PCKD 23.8%GN 31.4%Other 44.8%IDDM (T1 or T2) excluded | 51.8 ± 12 .4 | 60.1 | mGFR 32.6 ± 12.0, eGFR >70 excluded.As reported across K quartiles:Q1 mGFR 29.8 ± 11.7Q2 mGFR 32.3 ± 12.6Q3 mGFR 31.9 ± 11.6Q4 mGFR 36.5 ± 11.3 | Monthly 24 hour urine collections | 6.1 y (IQR: 3.5–11.7 y) | 20 |
| Li et al. (26) | 2014 | AASK prospective trial (USA) | 74CKD etiology:Hypertension 100%All other etiologies excluded | 53.7 (45.4, 58.9) | 67 | Overall: eGFR 55.8 (44.1, 61.8) Pro:Creat 0.05 (0.02, 0.11)D/S eGFR 60.6 (55.4, 68.0) Pro:Creat (g/g) 0.05 (0.03, 0.11)S/D eGFR 49.7 (41.1, 57.3) Pro:Creat (g/g) 0.05 (0.02, 0.12) | 24 hour urine collections at baseline, 1 and 2 y | 3–6.4 y, 32 mo for decline periods and 50 mo for stable periods | 19 |
| Mun et al. (27) | 2019 | MR cohort prospective trial (Korea) | 6145CKD etiology NR | NTN59.9 ± 9.2 HTN 62.7 ± 8.5 | NTN 37 HTN 38 | NTN eGFR 75.8 ± 17.5HTN eGFR 73.82 ± 7.71 | FFQ—106 items | NTN47.8 ± 19.6 moHTN 46.7 ± 18.8 mo | 16 |
| Nagata et al. (28) | 2016 | Single-center retrospective cohort study (Japan) | 1230CKD etiology NR | 62.2 ± 10.9 | 52.9 | Overall eGFR 78.6 ± 19.524-h UAE 44.4 mg/d ± 117.9As reported across K quintiles:Q1 eGFR 78.2 ± 21.4UAE 41.5 ± 101.3Q2 eGFR 77.2 ± 19.7UAE 57.7 ± 163.3Q3 eGFR 78.6 ± 18.1UAE 34.7 ± 81.7 Q4 eGFR 79.5 ± 20.4UAE 34.7 ± 104.8Q5 eGFR 81.5 ± 16.8UAE 50.6 ± 87.6 | 24 hour urine K at baseline | 5.47 y | 15 |
| Sharma et al. (29) | 2013 | NHANES cross-sectional (USA) | Total 13,917All CKD population 2333eGFR <60 1146eGFR >60 with albuminuria 1514 CKD etiology NR | 45.0 (0.4) | Overall NRQ1 29.5 Q2 41.7 Q3 50.8 Q4 68.5 | Overall eGFR 88 (SE 0.6)As reported across K quartiles:Q1 albuminuria 10.1%eGFR 89.1 (SE 0.7)Q2 albuminuria 9.7%eGFR 87.4 (SE 0.8)Q3 albuminuria 7.3%eGFR 87.2 (SE 0.7)Q4 albuminuria 7.0%eGFR 88.4 (SE 0.7) | 24 hour recall × 2 | NA—cross-sectional study | 16 |
| Smyth et al. (30) | 2014 | TRANSCEND and ONTARGET trials (40 countries) | 28,879CKD etiology NR | 66.5 ± 7.2 | 70.6 | Overall eGFR 68.4 ± 17.6ACR 5.33 ± 24.21As reported across K quartiles:Q1 eGFR 65.2 ± 18.2ACR 2.52 ± 10.53; Q2 eGFR 66.6 ± 17.7ACR 4.15 ± 18.86Q3 eGFR 68.2 ± 17.3ACR 5.53 ± 21.02Q4 eGFR 71 ± 17.1ACR 6.62 ± 26.55 Q5 eGFR 73.9 ± 16.9ACR 9.49 ± 48.7 | Spot urine—single fasting sample, Kawaski Formula to estimate 24 hour urine excretion | Mean 4.5 y, 56 mo | 16 |
AASK, African American Study of Kidney Disease; ACR, albumin creatinine ratio; CKD, chronic kidney disease; CRIC, Chronic Renal Insufficiency Cohort; DN, diabetic nephropathy; D/S, period of GFR decline followed by period of GFR stability; eGFR, estimated glomerular filtration rate; EUA, elevated urine albumin excretion; FFQ, food-frequency questionnaire; F/U, follow-up; GN, glomerulonephritis; HTN, hypertension; IDDM, insulin dependent diabetes; KNOW-CKD, KoreaN cohort study for Outcome in patients With Chronic Kidney Disease; MDRD, Modification of Diet in Renal Disease; mGFR, measured glomerular filtration rate; MR, Multi-Rural; NA, not applicable; NR, not reported; NTN, normotensive; ONTARGET, Ongoing Telmisartan Alone and in Combination with Ramipril Global Endpoint Trial; PCKD, polycystic kidney disease; Pro:Creat, protein to creatinine ratio; Q, quartile or quintile; Ref, reference; ROB, risk of bias; S/D, period of GFR stability followed by period of GFR decline; T1, type 1; T2, type 2; TRANSCEND, Telmisartan Randomised AssessmeNt Study in ACE iNtolerant subjects with cardiovascular Disease; UAE, urine albumin excretion; UK, urine potassium; UK:Cr, urine potassium to creatinine ratio.
ROB score was performed based on the National Heart, Lung, and Blood Institute proposed criteria for Quality Assessment Tool for Observational Cohort, Cross-sectional Studies and Case-Control Studies.
Study selection
From the original 2404 articles retrieved from the search, 1733 abstracts were screened once the duplicates were removed. Eighty-six full-text articles were reviewed. Eleven studies were included that met the inclusion criteria.
Patient demographics and CKD
All of the studies included in the final analysis were post hoc analyses (n = 10) or retrospective studies (n = 1), as summarized in Table 1. The studies ranged from 6 mo to 11 y of follow-up. The overall quality of the studies was good, with 10 out of 11 studies scoring ≥16 out of 20 on the risk-of-bias assessment tool (Supplemental Table 5 and Supplemental Figure 1). Four studies provided subanalyses based on CKD stage—reporting separate analyses for late-stage CKD (24, 28–30). The studies included a total of 49,573 stage 1–5 predialysis CKD patients from 41 different countries. Most of the participants (n = 33,555) had stages 1–2 CKD and the remaining participants (n = 16,018) had stage 3–5 CKD based on the mean reported GFR. Only Kim et al. (24), specifically provided the numbers of participants across all stages of CKD and reported including 115 stage 5 CKD patients. Smyth et al. (30) reported including 390 stage 4–5 CKD patients, defined as having an eGFR <30 mL · min−1 · 1.73 m−2. Baseline Chronic Renal Insufficiency Cohort (CRIC) participant characteristics were reported as including 18% stage 4, 70% stage 3, and 11% stage 2 CKD patients (31). The mean ages across the studies ranged from 40.4 to 66.5 years, 37.2–70.6% of study participants were male, and the mean BMI (in kg/m2) ranged from 23.6 to 32.7.
Methods used to assess dietary potassium intake
To estimate dietary potassium intake a variety of methods were used. Deriaz et al. (22) and Smyth et al. (30) estimated 24-h urine excretion using a single-spot urine collection from the Kawasaki formula (32). Kim et al. (24) predominantly used spot urine collections as well, although they reported on a subset (n = 855 from the total 1821) of 24-h urine collections, which they used to validate the results from the spot collections. Araki et al. (20), Chang et al. (21), and Nagata et al. (28) used a single 24-h urine sample. Li et al. (26) had 24-h urine collection results at baseline and 1 and 2 y and compared the differences in these excretion values during periods of GFR decline and periods of GFR stability. He et al. (23) and Leonberg-Yoo et al. (25) used repeated 24-h urine samples. Mun et al. (27) and Sharma et al. (29) used dietary recall to estimate potassium intake.
Dietary potassium intake and disease progression in early-stage CKD
Out of the 9 studies conducted in patients in early CKD (stage 1 and 2), 6 reported either a protective effect of high dietary potassium intake on CKD progression or a harmful effect of low potassium intake on CKD progression (20, 24, 27–30); 3 reported a neutral association (21, 22, 26) (Table 2, Figure 2A). Dietary potassium intakes in the highest quartile/quintile averaged >2500 mg/d, whereas the lowest quartile/quintile had an average potassium intake of ∼1500 mg/d. For studies that reported a protective effect of dietary potassium on CKD progression when comparing the highest quartile with the lowest quartile, the HR ranged from 0.33 to 0.74 (20, 27, 28, 30).
TABLE 2.
Dietary potassium and disease progression in early CKD1
| Study (ref) | Renal outcomes | Dietary potassium intake, mg/d | Analyzed for and adjusted for | Results |
|---|---|---|---|---|
| Araki et al. (20) | 50% eGFR decline, progression to stage 4, rate of decline | Q1: 1400 ± 300; Q2: 2000 ± 200; Q3: 2600 ± 200; Q4: 3600 ± 600 | HR (95% CI) Fully adjusted model: age, sex, BMI, HbA1c, TC, log TG, log HDL-C, LDL-C, SBP, RAASi, HTN, log UAE, eGFR, smoking, UNaE | Higher K is beneficial; lowest risk of CKD progression in the highest quartile vs. lowest quartile; unadjusted HR 0.48 (0.29 to 0.80); fully adjusted HR 0.33 (0.18 to 0.62) |
| Chang et al. (21) | Compare group with elevated UAE to without elevated UAE | Potassium quartiles NR; elevated UAE potassium 2570 ± 874 mg; normal UAE potassium 2633 ± 956 mg | Fully adjusted model: age, site, African-American race, current smoking, baseline systolic BP and baseline ln(UAE) | Neutral, numbers not provided |
| Deriaz et al. (22) | Annual change in eGFR | Q1: 1299–1922; Q2: 1922–2220; Q3: 2220–2493; Q4: 2493–2838; Q5: 2838–3827 | β-Value, P value, and 95% CI Fully adjusted model: eGFR, age, sex, PA, smoking, DM, antihypertensive medication, SBP, BMI, TG, uric acid, CRP, 25-hydroxyvitamin D, and ACR | Neutral: β 0.02, P value 0.3; 95% CI: 0.02–0.05 |
| Kim et al. (24) | Incidence of ESRD or 50% eGFR reduction | Potassium to creatinine ratio: Q1: <33.9 mmol/L; Q2: 33.99–45.94 mmol/L; Q3: 45.95–61.89 mmol/L; Q4: ≥61.7 mmol/L | HR (95% CI) Fully adjusted model: age, sex, smoking, BMI, DM, CVD, MAP, eGFR, PCr ratio, 24-hCo UProE, CRP, iPTH, Alb, Ca, random UNa/Cr, 24-h UNaE, and LDL-C, statins, RAASi, diuretics | Lower K has higher risk; highest risk of CKD progression in Q1 vs. Q4; unadjusted HR 2.35 (1.75 to 3.16); fully adjusted HR 1.47 (1.01–2.21) |
| Li et al. (26) | Rapidly declining GFR: 1) trajectory decreased ≥4 mL/min per 1.73 m2 per year during the entire period; 2) the total decline ≥8 mL/min per 1.73 m2 | During stable period mean K was 2060 mg; during decline period mean K was 2050 mg | Neutral, numbers not provided | |
| Mun et al. (27) | 15% decline in eGFR | Q1: <1302; Q2: 1302–1766; Q3: 1766–2364; Q4: >2364 | HR (95% CI)Fully adjusted model: age, gender, BMI, smoking, etOH, DM, TC, TG, HDL-C, kcal (by target) and Protein (by target) | Higher K is beneficial; lowest risk of CKD progression in the highest quartile vs. lowest quartile; unadjusted HR 0.54 (0.44–0.67); fully adjusted HR 0.69 (0.51–0.93) |
| Nagata et al. (28) | 30% decline in renal function | Q1: <1500; Q2: 1500–2000; Q3: 2000–2500; Q4: 2500–3000; Q5: >3000 | HR (95% CI) Fully adjusted model: age, sex, BMI, CVD, DM retinopathy, BP, HbA1c, eGFR, uric acid, TC, HDL-C, 24-h UAE, 24-h UNaE | Moderate K is beneficial; lowest risk of CKD progression in Q3 and Q4 vs. Q1.Q3 vs. Q1: unadjusted HR 0.44 (0.26–0.74); fully adjusted HR 0.49(0.28–0.84). Q4 vs. Q1: unadjusted HR 0.36 (0.19–0.70); fully adjusted HR 0.44 (0.22–0.87) |
| Sharma et al. (29) | eGFR <60 or eGFR >60 with albuminuria (ACR >30 mg/g) | Q1: <1737; Q2: 1738–2455; Q3: 2456–3341; Q4: >3342 | OR (95% CI) Fully adjusted model: age, sex, BMI, DM, HTN, CVD, and CHF status | Lower K is harmful; highest odds of CKD in lowest quartile vs. highest quartile; unadjusted OR 1.72 (1.39–2.12); fully adjusted OR 1.44 (1.16–1.79) |
| Smyth et al. (30) | eGFR decline >30 % or chronic dialysis | T1: 1700; T2: 2100; T3: 2700 | OR (95% CI) Fully adjusted model: age, sex, ethnicity, 6-wk eGFR, run-in UACR, DM, BMI, smoking, RAASi, diuretic, and UNaE | Higher K is beneficial; lowest risk of CKD progression in T3 vs. T1; unadjusted HR 0.87 (0.80–0.95); fully adjusted HR 0.74 (0.67–0.82) |
ACR, albumin creatinine ratio; Alb, albumin; BP, blood pressure; Ca, calcium; CKD, chronic kidney disease; CHF, congestive heart failure; CRP, C-reactive protein; CVD, cardiovascular disease; DM, diabetes mellitus; eGFR, estimated glomerular filtration rate; ESRD, end-stage renal disease; etOH, alcohol consumption; HbA1c, glycated hemoglobin; HDL-C, HDL cholesterol; HTN, hypertension; iPTH, intact parathyroid hormone; LDL-C, LDL cholesterol; MAP, mean arterial pressure; NR, not reported; PA, physical activity; PCr, protein creatinine ratio; Q, quartile or quintile; RAASi, renin angiotension aldosterone system inhibitors; SBP, systolic blood pressure; T, tertile; TC, total cholesterol; TG, triglycerides; UACR, urine albumin creatinine ratio; UAE, urine albumin excretion; UNa/Cr, urine sodium to creatinine ratio; UNaE, urine sodium excretion; UProE, urine protein excretion.
FIGURE 2.
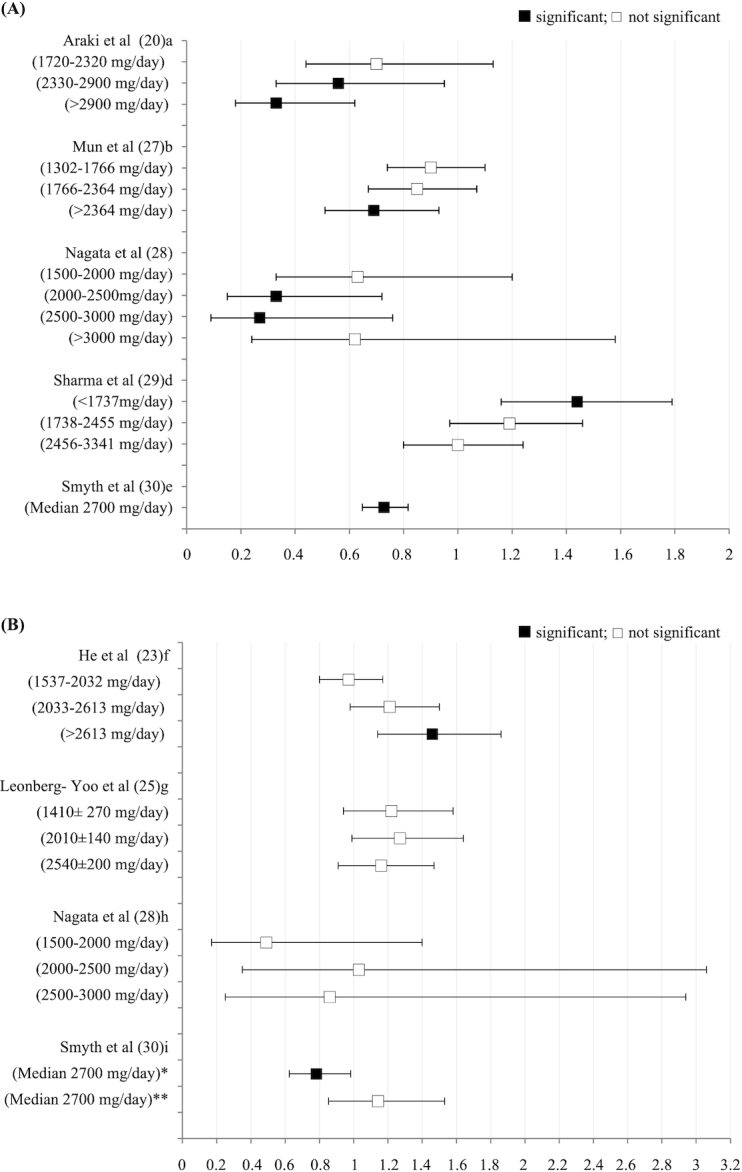
Potassium intake in early (A) and late (B) CKD and risk of disease progression Legend: significant—95% CI does not cross 1; not significant—95% CI crosses 1 NOTE: The potassium intake (mg/day) used by each author to determine the HR or OR of 1.0 was: 1 <1720, 2 <1302, 3 <1500, 4 >3342, 5 median=1700, 6 <1537, 7 3600±660, 8 <1500, 9 median=1700. *Displaying OR of the highest tertile (median 2700mg) compared to lowest tertile (median 1700mg) for participants with eGFR between 45-60 mL/(min · 1.73 m²). **Displaying OR highest tertiles (median 2700mg) compared to the lowest tertile (median 1700mg) for participants with eGFR below 45 mL/(min · 1.73 m²).
The Premier trial reported by Chang et al. (21) was the shortest study, with a 6-mo follow-up, and compared only 2 measures of kidney health at baseline and again at 6 mo. Additionally, Chang et al. (21) used the outcome measure of albuminuria, while all other studies monitored disease progression using the GFR. In the CoLaus study reported by Deriaz et al. (22), their CKD outcome measure was annual rate of eGFR decline as opposed to a specific eGFR change target (i.e., 15–50% GFR decline as set out by all the other studies that found a protective benefit). In the study by Li et al. (26), a subsample of participants from the African American Study of Kidney Disease (AASK) trial were analyzed; in this study, no association between potassium excretion and mGFR stability or decline was found, although they had the smallest sample size (i.e., 74 participants) of the studies included in this review (26).
Dietary potassium and disease progression in later-stage CKD
In later-stage CKD, inconsistent results were reported for the relation between dietary potassium intake and CKD progression (Table 3, Figure 2B). However, He et al. (23) was the only study to report a deleterious effect of high dietary potassium intake on CKD progression, with the highest quartile of potassium having the highest risk of disease progression (adjusted HR: 1.46; 95% CI: 1.14, 1.86). Smyth et al. (30) ran 2 separate analyses for patients with stage 3a CKD only and patients with stage 3b–5 CKD. In their analysis of stage 3a CKD, their results were neutral, while in their analysis of stage 3b–5 CKD, they reported an increased risk in the lowest tertile of intake. Two additional studies were neutral (25, 28), and 1 additional study agreed with Smyth et al. (30), reporting an increased risk with low potassium intake (24). Of note, Kim et al. (24) reported potassium intake as a ratio to creatinine and observed a significant association between a ≥50% decline in eGFR with the lowest quartile of potassium intake as a ratio of creatinine (<35.1 mmol/g: HR: 1.95; 95% CI: 1.05, 3.62) (results not shown in Figure 2B).
TABLE 3.
Dietary potassium intake and disease progression in late CKD1
| Study (ref) | Renal outcome | Dietary potassium intake, mg/d | Analyzed and adjusted for | Results |
|---|---|---|---|---|
| Stage 3 only | ||||
| Nagata et al. (28) (subgroup analysis eGFR between 30 and 60) | 30% decline in renal function | Q1: <1500; Q2: 1500–2000; Q3: 2000–2500; Q4: 2500–3000; Q5 >3000 | HR (95% CI)Fully adjusted model: age, sex, BMI, CVD, DM retinopathy, BP, HbA1c, eGFR, uric acid, TC, HDL-C, 24-h UAE, 24-h UNaE | Neutral: does not achieve statistical significance in fully adjusted model; risk of CKD progression in Q1 vs. Q5; fully adjusted HR 1.66 (0.42–6.54) |
| Smyth et al. (30) (subgroup analysis eGFR 45–60) | eGFR decline >30 % or chronic dialysis | T1: 1700; T2: 2100; T3: 2700 | OR (95% CI)Model adjusted for age, sex, ethnicity, 6-wk eGFR run-in, UACR, diabetes, BMI, smoking, diuretic use, use of on-study RAASi, and sodium excretion | Benefit of higher K; reduced odds in T3 vs. T1; OR 0.783 (95% CI 0.624–0.983) |
| Stage 3a-5 | ||||
| He et al. (23) | Incidence of ESRD or 50% eGFR reduction | Q1: <1537; Q2: 1537–2032; Q3: 2033–2613; Q4: >2613 | HR (95% CI)Fully adjusted model: age, sex, race, UCreE, clinic site, education, WC, LBM, BMI, cigarette, etOH, PA, lipids, DM, CVD, diuretics, RAASi, other BP medications, eGFR, UNaE | Lower K is beneficial; lowest risk of CKD progression in Q1 vs. Q4; unadjusted HR 1.64 (1.29–2.07); fully adjusted HR 1.46 (1.14–1.86) |
| Leonberg-Yoo et al. (25) | Initiation of dialysis or transplant | Q1: 1410 ± 270Q2: 2.01± 0.14 Q3: 2.54 ± 0.20 Q4: 3.60 ± 0.66 | HR (95% CI) | Neutral: does not achieve statistical significance in fully adjusted model; risk of CKD progression in Q1 vs. Q4; unadjusted HR 1.39 (1.11–1.74); fully adjusted HR 1.22 (0.94–1.58) |
| Stage 3b-5 | ||||
| Kim et al. (24)(subgroup analysis eGFR ≤45) | Incidence of ESRD or 50% eGFR reduction | Potassium to creatinine ratioQ1: <33.9 mmol/L; Q2: 33.99–45.94 mmol/L; Q3: 45.95–61.69 mmol/LQ4: ≥ 61.70 mmol/L | HR (95% CI) Fully adjusted model: age, sex, smoking, BMI, DM, CVD, MAP, eGFR, PCr ratio, 24-h UProE, CRP, iPTH, Alb, Ca, random UNa/Cr, 24-h UNaE and LDL, statins, RAASi, diuretics | Lower K is harmful; per 1-SD lower spot urinary potassium-to-creatinine ratio (millimoles per gram) on log scale; fully adjusted HR 1.21 (1.01–1.87) |
| Smyth et al. (30)(subgroup analysis eGFR ≤45) | eGFR decline >30 % or chronic dialysis | T1: 1700; T2: 2100; T3: 2700 | OR (95% CI) Model adjusted for age, sex, ethnicity, 6-wk eGFR, run-in UACR, diabetes, BMI, smoking, diuretic use, use of on-study RAASi, and sodium excretion | Neutral: does not achieve statistical significance in adjusted model; risk of CKD progression in T3 vs. T1; OR 1.143 (95% CI 0.853–1.532) |
Alb, albumin; BP, blood pressure; Ca, calcium; CKD, chronic kidney disease; CRP, C-reactive protein; CVD, cardiovascular disease; DM, diabetes mellitus; eGFR, estimated glomerular filtration rate; ESRD, end-stage renal disease; etOH, alcohol consumption; HbA1c, glycated hemoglobin; HDL-C, HDL cholesterol; iPTH, intact parathyroid hormone; LBM, lean body mass; MAP, mean arterial pressure; PA, physical activity; PCr, protein creatinine ratio; Q, quartile or quintile; RAASi, renin angiotension aldosterone system inhibitors; ref, reference; T, tertile; TC, total cholesterol; UACR, urine albumin creatinine ratio; UAE, urine albumin excretion; UCreE, urine creatinine excretion; UNa/Cr, urine sodium to creatinine ratio; UNaE, urine sodium excretion; UProE, urine protein excretion; WC, waist circumference.
Dietary potassium intake and mortality
Results for dietary potassium intake and all-cause mortality were either positive or neutral as presented in Table 4. Four studies investigated dietary potassium intake and mortality, reporting either a benefit of high potassium intake (20, 25, 28) or no association (23). Of note, no studies reported a higher risk of mortality with increased potassium intake.
TABLE 4.
Dietary potassium intake and mortality1
| Study (reference) | Summary of results | Statistics as provided by the article |
|---|---|---|
| Araki et al. (20) | Higher potassium is beneficial; highest quartile had lowest all-cause mortality | HR (95% CI): 0.71 (0.56, 0.90) |
| He et al. (23) | Neutral; not associated with all-cause mortality; 95% CI across all quartiles crossed 1 | HR (95% CI) Q4 vs. Q1: 0.89 (0.64, 1.23) |
| Leonberg-Yoo et al. (25) | Lower potassium is harmful; all-cause mortality average follow-up 19.2 y (10.8–20.6 y); lower quartiles higher risk for mortality | HR (95% CI) Q1 vs. Q4: 1.71 (1.23, 2.38) |
| Nagata et al. (28) | Moderate potassium is beneficial; death—comparing reference category of <1.5 g to 2.0–2.5 g and 2.5–3 g, lowest risk in higher quintiles | HR (95% CI): 0.36 (0.19, 0.70) |
Q, quartile or quintile.
Dietary potassium intake and serum potassium concentrations or hyperkalemia rates
With regard to the relation between dietary potassium intake and serum potassium concentrations or hyperkalemia rates, 4 studies reported on this outcome. Studies unanimously reported no association between potassium intake and serum potassium or hyperkalemia rates (Table 5). Smyth et al. (30) reported a higher OR for hyperkalemia with increased potassium intake; however, the association became nonsignificant after adjusting for known risk factors (including age, sex, eGFR, urine albumin-to-creatinine ratio, diabetes, RAASi, diuretic use, BMI, smoking, and urine sodium excretion; OR: 1.16; 95% CI: 0.99, 1.36).
TABLE 5.
Dietary potassium intake and serum potassium concentrations or hyperkalemia rate1
| Study (reference) | Serum potassium, mEq/L | Hyperkalemia (≥5.5 mmol/L) |
|---|---|---|
| Araki et al. (20) | Overall: 4.4 ± 0.3 | Not reported |
| Q1: 4.3 ± 0.4 | ||
| Q2: 4.3 ± 0.3 | ||
| Q3: 4.4 ± 0.3 | ||
| Q4: 4.4 ± 0.4 | ||
| Kim et al. (24) | Overall: 4.6 ± 0.6 | Reported as rates, n (%) |
| Q1: 4.7 ± 0.6 | Overall: 160 (9) | |
| Q2: 4.6 ± 0.6 | Q1: 52 (12) | |
| Q3: 4.6 ± 0.6 | Q2: 37 (9) | |
| Q4: 4.6 ± 0.5 | Q3: 37 (9) | |
| Q4: 34 (8) | ||
| Nagata et al. (28) | Overall: 4.44 ± 0.37 | Not reported |
| Q1: 4.31 ± 0.39 | ||
| Q2: 4.42 ± 0.36 | ||
| Q3: 4.48 ± 0.39 | ||
| Q4: 4.50 ± 0.37 | ||
| Q5: 4.51 ± 0.31 | ||
| Smyth et al. (30) | Not reported | OR: 1.16 (0.99–1.36) in high vs. low potassium intake adjusted for known risk factors including age, sex, ethnicity, 6-wk eGFR, run-in urine albumin creatinine ratio, diabetes, BMI, smoking, use of on-study renin-angiotension aldosterone system blockade, diuretic use, and sodium excretion |
eGFR, estimated glomerular filtration rate; Q, quartile or quintile.
Discussion
The overall aim of this systematic review was to investigate the impact of dietary potassium intake on CKD progression in nondialysis CKD patients. In an effort to manage and prevent hyperkalemia in the CKD population, dietary potassium intake is often restricted (14). Yet, the evidence supporting the current nutrition recommendations in CKD patients is scarce, with several limitations (18).
CKD progression and dietary potassium intake in early CKD
In stage 1–2 CKD, findings from this systematic review point toward an overall protective effect of higher potassium intakes on CKD progression (20, 24, 27–30). Although many factors could explain this association, high-potassium diets are generally associated with a lower risk of cardiovascular disease (CVD) and mortality in the general population (5). By improving CVD health this could prevent CKD progression. The 3 studies that reported a neutral association (21, 22, 26) between potassium intake and CKD progression all used a different measure to assess CKD progression—that is, none of them used a percentage of GFR decline compared with the studies that reported benefit. Given the progressive nature of CKD, some GFR decline will be anticipated in these patients. Using percentage of GFR decline over time allows for the identification of those who are declining at a faster rate. Moreover, the Chang et al. (21) study was the only study that used urinary albumin excretion as the marker of disease outcome/progression. In addition to differences in measuring disease progression, Li et al. (26) and Chang et al. (21) had the smallest 2 sample sizes of the 11 studies included in the review with 74 and 481 participants, respectively. Therefore, the neutral association might be attributable to the fact that those post hoc analysis studies were underpowered to detect a significant association. The difference in sample size and method of assessing CKD progression may, in part, explain the difference in reported results between studies.
CKD progression and dietary potassium in late CKD
The results for dietary potassium intake and CKD progression in stage 3–5 are inconsistent. One explanation for the variability in these results could be related to how CKD etiologies differ in a given CKD population and how this affects potassium handling at later stages of the disease. For example, polycystic kidney disease (PCKD) increases trans-tubular potassium excretion, resulting in lower rates of hyperkalemia and higher concentrations of urine potassium (33). This may, in part, explain why the study reported by Leonberg-Yoo et al. (25), which had 23.8% of patients with PCKD, showed no association. Conversely, CRIC as reported by He et al. (23) excluded PCKD patients and had a high percentage of patients with diabetes (46.6%) and found deleterious effects of high potassium intake. Diabetes is known to be an important risk factor for CKD progression (34). While this is yet to be explored, an interesting hypothesis could be that the ideal dietary potassium intake may depend on the etiology of CKD.
Variability in the results may also be related to other mechanisms that impact potassium handling, such as insulin and aldosterone (35). Insulin maintains potassium in the intracellular space through stimulation of Na+/K+ATPase pumps in muscle and liver tissues; if glucose concentrations are high or insulin concentrations are low more potassium will be found in the extracellular space (35). Patients with diabetic nephropathy are more likely to experience hypoinsulinemia and hyperglycemia, which may increase this population's risk of hyperkalemia and make them more sensitive to high-potassium diets.
Aldosterone is a key potassium homeostasis hormone and alters the amount of urinary potassium excretion (36). Medications that compete with aldosterone binding sites (including angiotensin-converting enzyme inhibitors, angiotensin-II receptor antagonist, and mineral-corticoid receptor antagonists) are more likely to reduce potassium elimination. Patients with hypertension- or diabetes-related kidney damage may be more likely to be prescribed these agents, which theoretically could make them more sensitive to higher potassium intake (34). In late CKD, the analyzed studies in this review reporting the association between potassium intake and disease progression also described the frequency of RAASi and diurectic usage. Smyth et al. (30) and Kim et al. (24) reported the highest use of RAASi, >80%. He et al. (23) reported RAASi use ranging from 64% to 71% across the quartiles of potassium intake. Leonberg-Yoo et al. (25) reported one of the lowest rates of RAASi use, at only 36.1%. Given the variability in RAASi use across studies, the use of these agents alone cannot explain the variability in these results. However, it is interesting to note that He et al. (23) had the highest rates of diuretic use at 56–62% across quartiles, while Smyth et al. (30), Kim et al. (24), and Leonberg-Yoo et al. (25) all reported use in the 30–40% range. Unfortunately, the articles did not describe which type of diuretics were used—either potassium sparing or potassium wasting. While all models corrected for the use of RAASi and diuretics in their models, given how these medications impact urinary potassium excretion and that these studies relied on urine markers for intake may, in part, explain the controversial results.
Regardless of the underlying mechanisms, given the current nutrition guidelines, an interesting finding in this review is the number of studies reporting no association between disease progression and potassium intake at the later stages of the disease. Both Kim et al. (24) and Leonberg-Yoo et al. (25) included dialysis initiation as part of their disease progression outcome. Given that unmanageable serum potassium (chronic hyperkalemia >5.5 mmol/L) concentrations can be an indication for dialysis, these results may suggest that those consuming more potassium are not necessarily experiencing persistent hyperkalemia requiring dialysis initiation. Conversely, that lower potassium excretion was found to be neither protective nor harmful may suggest a need to consider whether dietary restrictions are necessary or if patients may be able to consume potassium ad libitum.
Taken together, several factors could explain the variability in the results. Ultimately, to understand the relation between potassium intake and CKD progression at later stages, more studies are needed that include different CKD etiologies and medication regimes while also distinguishing between stages 3, 4, and 5.
Mortality, serum potassium concentrations, and dietary potassium intake
In earlier stages of CKD, higher dietary potassium intake was found to be associated with lower mortality rates (20, 28). This may have occurred for 2 reasons. First, high-potassium diets are beneficial for CVD, the main cause of mortality in CKD. Second, as demonstrated in this review, in the early stages, higher potassium intake is associated with a lower rate of CKD disease progression, which, in and of itself, may improve mortality rates. In late CKD, none of the results suggest that lower potassium intake is associated with lower mortality risk. Theoretically, given that hyperkalemia rates increase in later stages of CKD (13) and that hyperkalemia is associated with an increase in mortality (12) one could have expected to see higher potassium intake associated with higher mortality, although this was not found in this systematic review.
Another interesting finding is that, despite hyperkalemia being a concern for CKD patients, of the studies included in this review only 4 reported either serum potassium concentrations or hyperkalemia rates across the quartiles of dietary potassium intake. All 4 studies (20, 24, 28, 30) reported no association between potassium intake and serum potassium concentrations or hyperkalemia rates. However, understanding these results is challenging; none of the studies included information on whether additional medications to manage serum potassium concentrations were used, such as potassium-wasting diuretics or sodium polystyrene sulfonate in the different quartiles. Additionally, it is unknown if patients who presented with hyperkalemia were counseled to lower their dietary potassium, such that serum potassium concentrations normalized.
Considerations in evaluating the evidence
Another finding from this systematic review is how much potassium CKD patients are consuming (Tables 2 and 3). The highest quartiles/quintiles reported intake in the 3000-mg range, which falls within the potassium-restricted diet definition provided by KDOQI. Aside from potential limitations of methodology, which are discussed in detail below, this finding highlights several unknown factors about these patients. First, it is unknown if patients who were included in this review were already following potassium-restricted diets. Second, even if patients were consuming potassium ad libitum, potassium intake may be impacted if they were following other dietary restrictions, such as low protein, low sodium, and/or low phosphorus, which are all components of diet therapy to protect kidney health (17). Additionally, as none of the authors commented on overall nutritional status, it is possible that better overall nutritional intake and lower rates of malnutrition in the top quartile for potassium intake contributed to the beneficial effects seen in the higher quartiles. Thus, this lack of information may limit the interpretation of these results.
Underestimation of potassium intake from the urine samples or diet tools may also be a factor. For studies using urine samples, consideration of potassium bioavailability may be important. Naismith and Braschi (37) published a review of 3 trials comparing the results of 24-h urine collections with known dietary potassium intake data. In their analysis, potassium recovery from a diet high in whole fruits and vegetables was only 76.8%, while potassium recovery from a diet high in animal foods and processed fruits and vegetables was 96.3% (37). Urinary potassium recovery from additives in processed food is 90% (38). For studies using diet recalls, one consideration is how changes in food regulations impact the amount of potassium additives in processed foods. As food manufacturers change recipes and increase potassium in processed foods, databases may not be keeping pace. This was documented in 2018 by Parpia et al. (39), who analyzed 91 meat, fish, and poultry products and compared them with the potassium content listed in the Canadian Nutrient File (whose main data source is the USDA). In their sample, 40% of analyzed items had >2 SDs from the mean differences for the posted potassium content (39). However, underestimation alone is not likely the sole cause of the low reported potassium intake. Data from the NHANES 2009–2010, which used dietary recalls, reported that mean potassium intake among American men and women was 3172 mg and 2408 mg, respectively (40), which is higher than the potassium intake reported in the CKD cohorts of this review.
Strengths and limitations of the study
A strength of this review was the rigorous searching method in reviewing the literature. However, all the studies performed on the topic to date are cohort studies where cause-and-effect relations cannot be established. Therefore, there is an urgent need for well-controlled intervention trials to determine the optimal amount of potassium intake to recommend to CKD patients. The low number of studies and the lack of intervention trials is surprising considering that dietary potassium restriction recommendations are universal in all guidelines on nutrition and kidney disease. Another strength is the average length of follow-up in these studies, with 9 of the 11 studies following patients for a mean of 5–11 y (20, 22–28, 30). Given the slowly progressing nature of CKD, trials lasting many years are required to understand how dietary potassium exposure impacts the progression of the disease.
A significant limitation of the studies conducted in this area is that the majority of studies used a single sample of urine to estimate potassium intake at baseline to assign potassium quartiles for disease progression follow-up (20–22, 24, 28, 30). In 2018, Engberink et al. (41) examined 541 participants who had repeated 24-h urine collections. They found that 43% of participants changed tertiles for potassium excretion when their baseline and follow-up data were compared and concluded that one 24-h urine collection was not sufficient to understand long-term dietary intake and disease risk (41). In this review, the studies that used repeated urine potassium measures (23, 25, 26), reported different results [for early-stage CKD, neutral (26); for later-stage CKD, 1 beneficial (25) and 1 harmful (23)], which may suggest that the assessment methods were not the sole cause of variability.
Two of the 11 studies used dietary recalls to estimate potassium intake, Mun et al. (27) and Sharma et al. (29). Mun et al. (27) used a 106-question food-frequency questionnaire (FFQ). Sharma et al. (29), reporting on NHANES, used a 24-h diet recall completed with each participant twice. Validation of diet recalls for potassium was reviewed in 2015 by Freedman et al. (42). In their review, they reported good concordance rates between the FFQ and 24-h diet recall and 24-h urine potassium excretions in the general population, with underreporting rates of 5–6% and 0–4%, respectively. Results from both studies using dietary recalls suggest a beneficial effect of higher potassium intake and CKD progression (42). However, as validation is done against a single biomarker of urine, it is important to consider the limitations of the biomarker at assessing intake as well.
Another limitation is how to fully adjust for physiological changes in potassium handling at later stages of CKD. In 2016, Ueda et al. (43) studied how urinary potassium excretion changes across stage 1–5 CKD. In their results, decreased urinary potassium excretion started in stage 3b CKD (eGFR <45 mL · min−1 · 1.73 m−2) and further decreased with increasing CKD stage, reaching a maximum decrease of 25 mEq/d or 1000 mg/d (43). While all the statistical models corrected for GFR differences across the quartiles, it would be impossible to fully correct the change that occurs with decreased potassium excretion as a result of reduced kidney function. Although 3 studies documented collecting dietary intake in their cohorts (21, 23, 25), none of them considered nutritional data in their model. In the CKD population, there would be an inherent strength in using both diet intake and urine excretion data to ensure that potassium intake was accurately estimated. Ideally, a well-designed diet intervention trial in CKD patients is needed to provide insight into dietary potassium intake and disease progression.
Although no intervention trials have directly assessed potassium intake and disease progression, 2 feeding trials investigating high-potassium diets in CKD have been conducted. In 1 study, acidosis was the outcome, and in the other study, blood pressure was the outcome (44, 45). Tyson et al. (44) investigated the Dietary Approaches to Stop Hypertension (DASH) diet, providing 4700 mg of potassium to moderate-stage CKD patients and found very little changes in serum potassium concentrations. Goraya et al. (45) significantly increased fruits and vegetable consumption (including high-potassium fruits and vegetables such as bananas and potatoes) in the diet of stage 4 CKD patients to correct metabolic acidosis and reported minimal impact on serum potassium concentrations. There is also an ongoing trial using potassium supplements in CKD (46) to examine renal outcomes. Results of this study are not yet reported; however, pending their findings of serum concentrations, this may also help establish safety protocols. Therefore, while high-potassium diets may pose some risk of hyperkalemia, preliminary evidence suggests that the risk of hyperkalemia may be low with a high-potassium diet. Yet, studies aiming at determining the ideal potassium intake in different stages of CKD are required.
Conclusions
The ideal amount of dietary potassium intake for patients with CKD at different stages of the disease is unknown. Due to the risk of hyperkalemia in this population, dietary potassium intake is often restricted. In early stages of CKD, higher potassium intake appears to be protective against disease progression, while in late stages, results are unclear. Important considerations that prevent firm conclusion are as follows: 1) the overall low range of dietary potassium intake, with all studies reporting an average intake below the 2004 KDOQI guidelines, and 2) the method used to assess potassium intake in most studies (i.e., urine) in late stages of CKD. Therefore, well-designed intervention feeding trials are required in different stages of CKD using multiple approaches to accurately assess dietary potassium intake while also following renal function over time to understand the cause-and-effect relation between potassium intake and CKD progression.
Supplementary Material
ACKNOWLEDGEMENTS
The authors’ responsibilities were as follows: KP and CR conceptualized the article. DM provided clinical and scientific expertise on CKD. KP and MIBS completed data extraction and KP wrote the manuscript with the assistance of CR and DM. All authors critically reviewed the manuscript and approved the final version of the manuscript to be submitted. All authors read and approved the final manuscript.
Notes
The authors reported no funding received for this study. Outside the submitted work, CR reports grants from the Canadian Institutes of Health Research (CIHR), the Natural Sciences and Engineering Research Council of Canada, Egg Farmers of Canada, and Dairy Farmers of Canada. DM is currently funded by the CIHR, Kidney Foundation of Canada, and several other grants. While the Kidney Foundation of Canada grant addresses this population, that work was not relevant to the submission of this manuscript.
Author disclosures: The authors report no conflicts of interest.
Supplemental Tables 1–6 and Supplemental Figure 1 are available from the “Supplementary data” link in the online posting of the article and from the same link in the online table of contents at https://academic.oup.com/advances/.
Abbreviations used: CKD, chronic kidney disease; CRIC, Chronic Renal Insufficiency Cohort; CVD, cardiovascular disease; eGFR, estimated glomerular filtration rate; FFQ, food-frequency questionnaire; GFR, glomerular filtration rate; KDOQI, Kidney Disease Outcomes Quality Initiatives; mGFR, measured glomerular filtration rate; PCKD, polycystic kidney disease; PRISMA, Preferred Reporting Items for Systematic Reviews and Meta-Analyses; RAASi, renin angiotension aldosterone system inhibitor(s).
Contributor Information
Kelly Picard, Department of Agricultural, Food, and Nutritional Sciences, Li Ka Shing Centre for Health Innovation, University of Alberta, Edmonton, Alberta, Canada; Nutrition Services, Alberta Health Services, Edmonton, Alberta, Canada.
Maria Ines Barreto Silva, Department of Agricultural, Food, and Nutritional Sciences, Li Ka Shing Centre for Health Innovation, University of Alberta, Edmonton, Alberta, Canada.
Diana Mager, Department of Agricultural, Food, and Nutritional Sciences, Li Ka Shing Centre for Health Innovation, University of Alberta, Edmonton, Alberta, Canada.
Caroline Richard, Department of Agricultural, Food, and Nutritional Sciences, Li Ka Shing Centre for Health Innovation, University of Alberta, Edmonton, Alberta, Canada.
References
- 1. Bowe B, Xie Y, Li T, Mokdad AH, Xian H, Yan Y, Maddukuri G, Al-Aly Z. Changes in the US burden of chronic kidney disease from 2002 to 2016: an analysis of the Global Burden of Disease Study. JAMA. 2018;1(7):e184412. [DOI] [PMC free article] [PubMed] [Google Scholar]
- 2. Weaver CM. Potassium and health. Adv Nutr. 2013;4(3):368S–77S. [DOI] [PMC free article] [PubMed] [Google Scholar]
- 3. Newberry SJ, Chung M, Anderson CA, Chen C, Fu Z, Tang A, Zhao N, Booth M, Marks J, Hollands S et al.. Sodium and potassium intake: effects on chronic disease outcomes and risks. Compartive Effectiveness Review. 2018;206, Rockbille (MD): Agency for Health Research and Quality, Report No.: 18-EHC009-EF. [PubMed] [Google Scholar]
- 4. Vinceti M, Filippini T, Crippa A, de Sesmaisons A, Wise LA, Orsini N. Meta-analysis of potassium intake and the risk of stroke. J Am Heart Assoc. 2016;5(10):e004210. [DOI] [PMC free article] [PubMed] [Google Scholar]
- 5. Aburto NJ, Hanson S, Gutierrez H, Hooper L, Elliott P, Cappuccio FP. Effect of increased potassium intake on cardiovascular risk factors and disease: systematic review and meta-analyses. BMJ. 2013;346:f1378. [DOI] [PMC free article] [PubMed] [Google Scholar]
- 6. Aaron KJ, Sanders PW. Role of dietary salt and potassium intake in cardiovascular health and disease: a review of the evidence. Mayo Clin Proc. 2013;88(9):987–95. [DOI] [PMC free article] [PubMed] [Google Scholar]
- 7. Smyth A, Griffin M, Yusuf S, Mann JF, Reddan D, Canavan M, Newell J, O'Donnell M. Diet and major renal outcomes: a prospective cohort study: the NIH-AARP Diet and Health Study. J Ren Nutr. 2016;26(5):288–98. [DOI] [PubMed] [Google Scholar]
- 8. Scialla JJ, Anderson CA. Dietary acid load: a novel nutritional target in chronic kidney disease?. Adv Chronic Kidney Dis. 2013;20(2):141–9. [DOI] [PMC free article] [PubMed] [Google Scholar]
- 9. Scialla JJ, Asplin J, Dobre M, Chang AR, Lash J, Hsu C, Kallem RR, Hamm LL, Feldman HI, Chen J et al.. Higher net acid excretion is associated with a lower risk of kidney disease progression in patients with diabetes. Kidney Int. 2017;91(1):204–15. [DOI] [PMC free article] [PubMed] [Google Scholar]
- 10. Di Iorio BR, Di Micco L, Marzocco S, De Simone E, De Blasio A, Sirico ML, Nardone L. Very low-protein diet (VLPD) reduces metabolic acidosis in subjects with chronic kidney disease: the “Nutritional Light Signal” of the renal acid load. Nutrients. 2017;9(1):69. [DOI] [PMC free article] [PubMed] [Google Scholar]
- 11. Shamseddin MK, Parfrey PS. Mechanisms of the cardiorenal syndromes. Nat Rev Nephrol. 2009;5(11):641. [DOI] [PubMed] [Google Scholar]
- 12. Kovesdy CP, Matsushita K, Sang Y, Brunskill NJ, Carrero JJ, Chodick G, Hasegawa T, Heerspink HL, Hirayama A, Landman GWD et al.. Serum potassium and adverse outcomes across the range of kidney function: a CKD Prognosis Consortium meta-analysis. Eur Heart J. 2018;39(17):1535–42. [DOI] [PMC free article] [PubMed] [Google Scholar]
- 13. Gilligan S, Raphael KL. Hyperkalemia and hypokalemia in CKD: prevalence, risk factors, and clinical outcomes. Adv Chronic Kidney Dis. 2017;24(5):315–8. [DOI] [PubMed] [Google Scholar]
- 14. Dietitians of Canada. When are electrolyte, mineral and fluid restrictions (i.e. sodium, potassium, phosphorus, fluid) required in adults with chronic kidney disease (CKD)?. In: Practice-based Evidence in Nutrition [PEN] 2015 Mar 24 [cited 2019 Sep 23] [Internet]. Available from: http://www.pennutrition.com. [Google Scholar]
- 15. Johnson DW, Atai E, Chan M, Phoon RK, Scott C, Toussaint ND, Turner GL, Usherwood T, Wiggins KJ. KHA‐CARI guideline: early chronic kidney disease: detection, prevention and management. Nephrology. 2013;18(5):340–50. [DOI] [PubMed] [Google Scholar]
- 16. Levey AS, Rocco MV, Anderson S, Andreoli SP, Bailie GR, Bakris GL, Callahan MB, Greene JH, Johnson CA, Lash JP et al.. K/DOQI clinical practice guidelines on hypertension and antihypertensive agents in chronic kidney disease. Am J Kidney Dis. 2004;43(5 Suppl 1):S1–290. [PubMed] [Google Scholar]
- 17. Academy of Nutrition and Dietetics. 2010 Chronic kidney disease (CKD) evidence-based nutrition practice guideline. Evidence Analysis Library. 2010; [Internet]. [Accessed 2019 Nov 29]. Available from: https://www.andeal.org/topic.cfm?menu=5303&pcat=3927&cat=3929. [Google Scholar]
- 18. Clase CM, Carrero J, Ellison DH, Grams ME, Hemmelgarn BR, Jardine MJ, Kovesdy CP, Kline GA, Lindner G, Obrador GT et al.. Potassium homeostasis and management of dyskalemia in kidney diseases: conclusions from a Kidney Disease: Improving Global Outcomes (KDIGO) Controversies Conference. Kidney Int. 2020;97(1):42–61. [DOI] [PubMed] [Google Scholar]
- 19. Moher D, Shamseer L, Clarke M, Ghersi D, Liberati A, Petticrew M, Shekelle P, Stewart LD, PRISMA-P Group. Preferred Reporting Items for Systematic Review and Meta-Analysis Protocols (PRISMA-P) 2015 statement. Syst Rev. 2015;4(1):1. [DOI] [PMC free article] [PubMed] [Google Scholar]
- 20. Araki S, Haneda M, Koya D, Kondo K, Tanaka S, Arima H, Kume S, Nakazawa J, Chin-Kanaski M, Ugi S et al.. Urinary potassium excretion and renal and cardiovascular complications in patients with type 2 diabetes and normal renal function. Clin J Am Soc Nephrol. 2015;10(12):2152–8. [DOI] [PMC free article] [PubMed] [Google Scholar]
- 21. Chang AR, Miller ER, Anderson CA, Juraschek SP, Moser M, White K, Henry B, Krekel C, Oh S, Charleston J, Appel LJ. Phosphorus additives and albuminuria in early stages of CKD: a randomized controlled trial. Am J Kidney Dis. 2017;69(2):200–9. [DOI] [PMC free article] [PubMed] [Google Scholar]
- 22. Deriaz D, Guessous I, Vollenweider P, Devuyst O, Burnier M, Bochud M, Ponte B. Estimated 24-h urinary sodium and sodium-to-potassium ratio are predictors of kidney function decline in a population-based study. J Hypertens. 2019;37(9):1853–60. [DOI] [PubMed] [Google Scholar]
- 23. He J, Mills KT, Appel LJ, Yang W, Chen J, Lee BT, Rosas SE, Porter A, Makos G, Weir MR et al.. Urinary sodium and potassium excretion and CKD progression. J Am Soc Nephrol. 2016;27(4):1202–12. [DOI] [PMC free article] [PubMed] [Google Scholar]
- 24. Kim HW, Park JT, Yoo T, Lee J, Chung W, Lee K, Chae D, Ahn C, Kang S, Choi KH et al.. Urinary potassium excretion and progression of CKD. Clin J Am Soc Nephrol. 2019;14(3):330–40. [DOI] [PMC free article] [PubMed] [Google Scholar]
- 25. Leonberg-Yoo AK, Tighiouart H, Levey AS, Beck GJ, Sarnak MJ. Urine potassium excretion, kidney failure, and mortality in CKD. Am J Kidney Dis. 2017;69(3):341–9. [DOI] [PMC free article] [PubMed] [Google Scholar]
- 26. Li L, Chang A, Rostand SG, Hebert L, Appel LJ, Astor BC, Lipkowitz MS, Wright JT, Kendrick C, Wang X et al.. A within-patient analysis for time-varying risk factors of CKD progression. J Am Soc Nephrol. 2014;25(3):606–13. [DOI] [PMC free article] [PubMed] [Google Scholar]
- 27. Mun KH, Im Yu G, Choi BY, Kim MK, Shin M, Shin DH. Association of dietary potassium intake with the development of chronic kidney disease and renal function in patients with mildly decreased kidney function: the Korean Multi-Rural Communities Cohort Study. Med Sci Monit. 2019;25:1061. [DOI] [PMC free article] [PubMed] [Google Scholar]
- 28. Nagata T, Sobajima H, Ohashi N, Hirakawa A, Katsuno T, Yasuda Y, Matsuo S, Tsuboi N, Maruyama S. Association between 24 h urinary sodium and potassium excretion and estimated glomerular filtration rate (eGFR) decline or death in patients with diabetes mellitus and eGFR more than 30 ml/min/1.73m2. PLoS One. 2016;11(5):e0152306. [DOI] [PMC free article] [PubMed] [Google Scholar]
- 29. Sharma S, McFann K, Chonchol M, De Boer IH, Kendrick J. Association between dietary sodium and potassium intake with chronic kidney disease in US adults: a cross-sectional study. Am J Nephrol. 2013;37(6):526–33. [DOI] [PMC free article] [PubMed] [Google Scholar]
- 30. Smyth A, Dunkler D, Gao P, Teo KK, Yusuf S, O'Donnell MJ, Mann JFE, Clase CM; ON TARGET and TRANSCEND Investigators. The relationship between estimated sodium and potassium excretion and subsequent renal outcomes. Kidney Int. 2014;86(6):1205–12. [DOI] [PubMed] [Google Scholar]
- 31. Lash JP, Go AS, Appel LJ, He J, Ojo A, Rahman M, Townsend RR, Xie D, Cifelli D, Cohan J et al.. Chronic Renal Insufficiency Cohort (CRIC) Study: baseline characteristics and associations with kidney function. Clin J Am Soc Nephrol. 2009;4(8):1302–11. [DOI] [PMC free article] [PubMed] [Google Scholar]
- 32. Kawasaki T, Itoh K, Uezono K, Sasaki H. A simple method for estimating 24 h urinary sodium and potassium excretion from second morning voiding urine specimen in adults. Clin Exp Pharmacol Physiol. 1993;20(1):7–14. [DOI] [PubMed] [Google Scholar]
- 33. Kim H, Park S, Jhee JH, Yun H, Park JT, Han SH, Kim SW, Kim YH, Oh YK, Kang S et al.. Urinary angiotensinogen level is associated with potassium homeostasis and clinical outcome in patients with polycystic kidney disease: a prospective cohort study. BMC Nephrol. 2019;20(1):104. [DOI] [PMC free article] [PubMed] [Google Scholar]
- 34. Diabetes Canada Clinical Practice Guidelines Expert Committee. Diabetes Canada 2018 clinical practice guidelines for the prevention and management of diabetes in Canada. Can J Diabetes. 2018;42(Suppl 1):S1–325.29650079 [Google Scholar]
- 35. Lehnhardt A, Kemper MJ. Pathogenesis, diagnosis and management of hyperkalemia. Pediatr Nephrol. 2011;26(3):377–84. [DOI] [PMC free article] [PubMed] [Google Scholar]
- 36. Rosano GM, Tamargo J, Kjeldsen KP, Lainscak M, Agewall S, Anker SD, Ceconi C, Coats AJS, Drexel H, Filippatos G et al.. Expert consensus document on the management of hyperkalaemia in patients with cardiovascular disease treated with renin angiotensin aldosterone system inhibitors: coordinated by the Working Group on Cardiovascular Pharmacotherapy of the European Society of Cardiology. Eur Heart J Cardiovasc Pharmacother. 2018;4(3):180–8. [DOI] [PubMed] [Google Scholar]
- 37. Naismith DJ, Braschi A. An investigation into the bioaccessibility of potassium in unprocessed fruits and vegetables. Int J Food Sci Nutr. 2008;59(5):438–50. [DOI] [PubMed] [Google Scholar]
- 38. Braschi A, Gill L, Naismith DJ. Partial substitution of sodium with potassium in white bread: feasibility and bioavailability. Int J Food Sci Nutr. 2009;60(6):507–21. [DOI] [PubMed] [Google Scholar]
- 39. Parpia AS, Darling PB, L'Abbé MR, Goldstein MB, Arcand J, Cope A, Shaikh A. The accuracy of Canadian Nutrient File data for reporting phosphorus, potassium, sodium, and protein in selected meat, poultry, and fish products. Can J Public Health. 2018;109(1):150–2. [DOI] [PMC free article] [PubMed] [Google Scholar]
- 40. Hoy MK, Goldman JD. Potassium intake of the U.S. population: What We Eat in America, NHANES 2009–2010. Washington (DC): USDA/Agricultural Research Service Beltsville Human Nutrition Research Center Food Surveys Research Group; 2012. [Google Scholar]
- 41. Engberink RO, Peters-Sengers H, van den Born B, Vogt L. Single versus multiple 24-hour urine collections for estimation of long-term potassium intake and the associated renal risk. Nephrol Dial Transplant; 2018;; 33:1617. [Google Scholar]
- 42. Freedman LS, Commins JM, Moler JE, Willett W, Tinker LF, Subar AF, Spiegelmen D, Rhodes D, Potischman N, Neuhouser ML et al.. Pooled results from 5 validation studies of dietary self-report instruments using recovery biomarkers for potassium and sodium intake. Am J Epidemiol. 2015;181(7):473–87. [DOI] [PMC free article] [PubMed] [Google Scholar]
- 43. Ueda Y, Ookawara S, Ito K, Miyazawa H, Kaku Y, Hoshino T, Tabei K, Morishita Y. Changes in urinary potassium excretion in patients with chronic kidney disease. Kidney Res Clin Pract. 2016;35(2):78–83. [DOI] [PMC free article] [PubMed] [Google Scholar]
- 44. Tyson CC, Lin P, Corsino L, Batch BC, Allen J, Sapp S, Barnhart H, Nwankwo C, Burroughs J, Svetkey LP. Short-term effects of the DASH diet in adults with moderate chronic kidney disease: a pilot feeding study. Clin Kidney J. 2016;9(4):592–8. [DOI] [PMC free article] [PubMed] [Google Scholar]
- 45. Goraya N, Simoni J, Jo C, Wesson DE. A comparison of treating metabolic acidosis in CKD stage 4 hypertensive kidney disease with fruits and vegetables or sodium bicarbonate. Clin J Am Soc Nephrol. 2013;8(3):371–81. [DOI] [PMC free article] [PubMed] [Google Scholar]
- 46. Gritter M, Vogt L, Yeung SM, Wouda RD, Ramakers CR, de Borst MH, Hoorn EJ. Rationale and design of a randomized placebo-controlled clinical trial assessing the renoprotective effects of potassium supplementation in chronic kidney disease. Nephron. 2018;140(1):48–57. [DOI] [PMC free article] [PubMed] [Google Scholar]
Associated Data
This section collects any data citations, data availability statements, or supplementary materials included in this article.