Abstract
Obesity is a metabolic disease and causes significant changes in host and gut microbial metabolite levels. However, little research has been done on the relationship between host and gut microbial metabolites. Thus, this study investigated the connection of the chemicals, based on the different effects of two Inonotus obliquus extracts on high-fat-diet-induced mice and their mechanisms. In this study, C57BL6/J mice fed with a high-fat diet were given I. obliquus ethanol extract (IOE) and polysaccharide (IOP). 1H NMR-based metabolomics, 16S rRNA sequencing, and real-time reverse transcription polymerase chain reaction (RT-PCR) were used to detect metabolites, cecal microbes, and expressions of genes in liver. IOE and IOP effectively improved the obesity of mice, including the adjustment of body weight gain, energy intake, energy efficiency, liver glucose metabolism and triglyceride metabolism, tricarboxylic acid (TCA) cycle, and degradation of three major nutrients (carbohydrate, lipid, and protein). IOE significantly increased cecal propionate based on Bacteroides and Akkermansia, thereby inhibiting energy intake and fat accumulation in mice. IOP remarkably improved the level of cecal butyrate by Lactobacillus and the Bacteroidales S24-7 group, resulting in increased energy consumption, and fat degradation by regulating the TCA cycle of the host. Two extracts containing different bioactive substances of I. obliquus improved obesity in mice through different effects on production of cecal microbial metabolites. Moreover, cecal butyrate (not propionate) was connected with chemicals of mice, including four metabolites of the TCA cycle and other metabolism-related chemicals.
Introduction
Obesity is a metabolic disease characterized by an excessive accumulation of lipids, mainly due to the long-term imbalance of energy intake and expenditure.1 A great deal of research has indicated that obesity increases the risk of diabetes, osteoarthritis, and cardiovascular diseases.2 Moreover, it was the cause of over 60% of deaths.3 According to a report of World Health Organization (WHO), more than 18% of children (380 million) and 39% of adults (1.9 billion) are overweight or obese.4 Thus, studies of obesity had attracted significant attention.
Many studies have observed that obesity affects the metabolism of the host and gut microbiota.5,6 The effect was reflected in the levels of metabolites.6−8 For example, diet-induced obesity suppresses the levels of citric acid,9 ketoglutarate, and other metabolites in the host and short-chain fatty acids of gut microbiota.10 Moreover, many studies treated obesity through the metabolites of the host or gut microbiota.11,12 However, there were few studies on the metabolites of host and gut microbiota together. Therefore, little is known about the connections between host and gut microbial chemicals.
Inonotus obliquus is a medicinal and edible mushroom, and its ethanol extract (IOE) and polysaccharide (IOP) have been investigated and found to have a significant effect on metabolic diseases (such as obesity, type 2 diabetes, and hyperuricemia).13,14 Previous studies revealed that IOE mainly included phenolic acids and triterpenes15,16 and IOPs consisted of a β-glucose backbone in the chain and were rich in glucose, galactose, arabinose, and fucose.17 The research suggested that IOE and IOP inhibited metabolic diseases through different mechanisms.
The purpose of this study was to explore the relationship between host and gut microbial metabolites, based on the different effects of the two I. obliquus extracts (IOP and IOE) on obesity and their mechanisms.
Results
Body Weight, Body Mass Intake, Adipose Tissue Weight, and Energy Intake
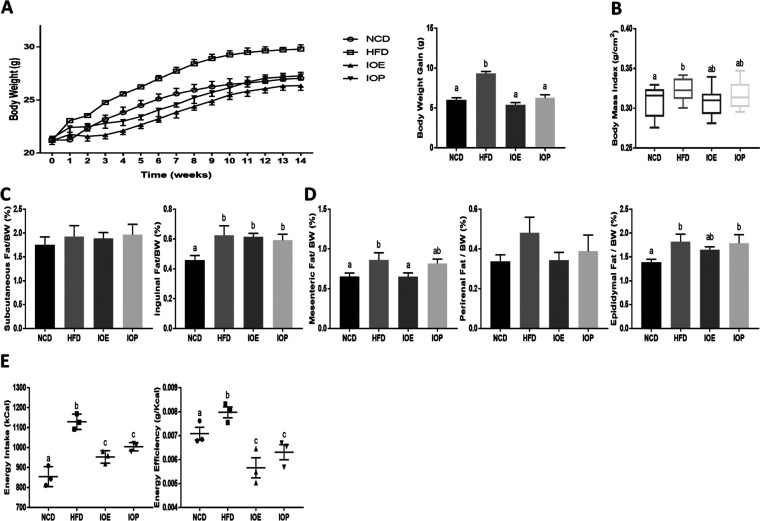
During the feeding process, mice fed with a high-fat diet showed a higher weight growth rate than those fed with a regular diet. At the end of the experiment, mice in the high-fat diet (HFD) group showed an increase in body weight gain, body mass index, inguinal fat, and epididymal fat compared with mice in the normal chow diet (NCD) group (Figure 1A–D). Both IOE and IOP reduced the weight growth rate and weight gain during feeding of high-fat diets. Compared with the HFD group, IOE decreased the body mass index (p = 0.0625) and mesenteric fat, while IOP showed no effect on body fat (Figure 1C,D). In addition, IOE has a stronger regulating effect on body weight than IOP (p = 0.085) (Figure 1A,B).
Figure 1.
Effects of IOE/IOP administration on the body weight and the percent of adipose tissue and energy intake in mice. (A) Body weight curves and body weight gain; (B) body mass index; (C) relative weight of subcutaneous fat and inguinal fat; (D) relative weight of mesenteric fat, perinephric fat, and epididymal fat; and (E) energy intake and energy efficiency (the ratio of body weight gain to energy intake).
Energy intake and energy efficiency (body weight gain/energy intake) were introduced to explore why IOE and IOP inhibit the increase in body weight gain induced by a high-fat diet. As shown in Figure 1E, IOE and IOP reduced the elevation in energy intake and energy efficiency caused by high-fat diet feeding, and mice in the IOE group had less energy intake compared with those in the IOP group (p = 0.078).
These results suggested that IOE and IOP improved the obesity of mice fed with a high-fat diet, which is related to the energy metabolism, and IOE was more effective.
Biochemical Parameters
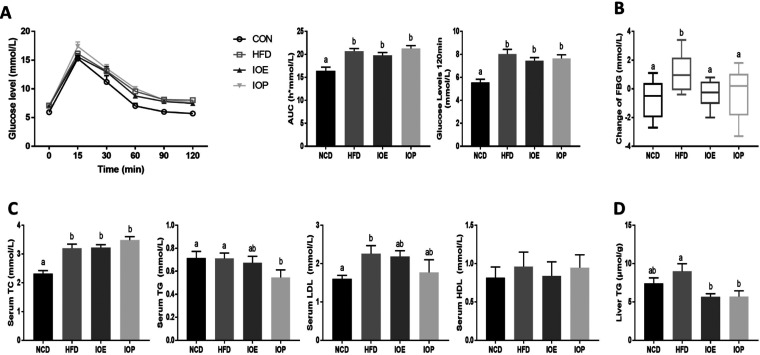
A high-fat diet causes changes in many biochemical indicators. Therefore, glucose tolerance and serum lipid levels were measured. The area under the curve (AUC) and the blood glucose level at 2 h after the meal increased in the mice given the high-fat diet compared with the NCD group, indicating that 10 weeks of high-fat diet resulted in an increase in glucose tolerance, i.e., impaired blood glucose regulation (Figure 2A). Moreover, the difference in fasting blood glucose between the 10th week and the beginning of the experiment was higher in the HFD group than in the NCD group (Figure 2B), again indicating a disorder of glucose metabolism caused by the high-fat diet. Although the intake of IOE and IOP did not improve the glucose tolerance induced by high-fat diet feeding in mice, both extracts reduced the increase in fasting glucose difference induced by the high-fat diet (Figure 2A,B). These results indicate that IOE and IOP ameliorated the disorder of glucose metabolism induced by high-fat diet feeding in mice but not in a manner that affected the ability of blood glucose regulation.
Figure 2.
Effects of IOE/IOP administration on the biochemical index. (A) Oral glucose tolerance test (OGTT) curve, area under the concentration–time curve (AUC) for the OGTT and the glucose level at 120 min after the glucose gavage. (B) Changes of fasting glucose determination at 0 and 10 weeks. (C) Concentrations of total cholesterol (TC), triglyceride (TG), high-density lipoprotein (HDL), and low-density lipoprotein (LDL) in the serum. (D) Concentrations of TG in the liver.
Serum lipid profiles showed that cholesterol and LDL were increased by the high-fat diet, but I. obliquus extracts did not show significant effects on these biochemical parameters. However, IOP reduced the serum triglyceride level in HFD-fed mice, illustrating that triglyceride metabolism was regulated by I. obliquus (Figure 2C). Subsequent measurements of hepatic triglycerides showed that both IOE and IOP reduced the hepatic triglyceride accumulation induced by the high-fat diet (Figure 2D).
These results indicated that IOE and IOP regulated glucose metabolism and triglyceride metabolism in HFD mice.
Real-Time Quantitative PCR
To further understand how IOE or IOP regulated glucose metabolism and triglyceride metabolism, liver mRNA expressions of key genes were determined.
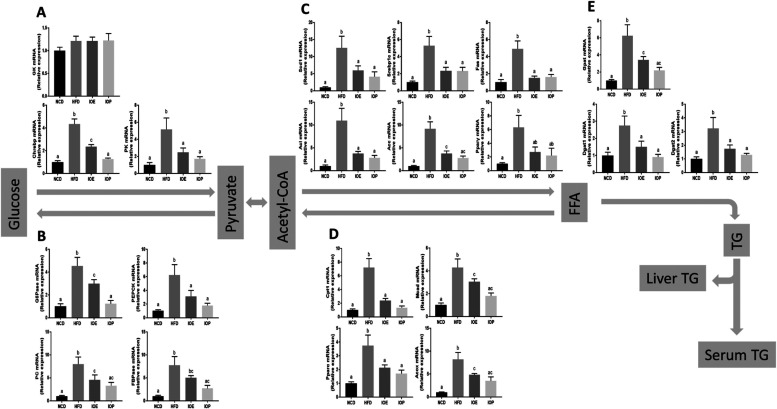
Feeding with high-fat diet increased the mRNA expression of 19 genes involved in glucose metabolism and triglyceride metabolism (pyruvate kinase (PK) and carbohydrate-responsive element binding protein (Chrebp) of the glycolysis pathway; G6 Pase, fructose-1,6-bisphosphatase (FBPase), pyruvate carboxylase (PC), and phosphoenolpyruvate carboxykinase (PEPCK) of the gluconeogenesis pathway; sterol regulatory element binding protein-1c (Srebp1c), acetyl-CoA carboxylase (Acc), ATP-citrate lyase (Acl), stearoyl-CoA desaturase 1 (Scd1), fatty acid synthase (Fas), and peroxisome proliferator-activated recepto γ (PPAR-γ) of the de novo fatty acid synthesis pathway; PPAR-α, acyl-CoA oxidase (Acox), carnitine palmitoyltransferase I (Cpt1), and medium-chain acyl-CoA dehydrogenase (Mcad) of the β oxidation pathway; and glycerol-3-phosphate acyltransferase (Gpat), diacylglycerol acyltransferase 1 (Dgat1), and diacylglycerol acyltransferase 2 (Dgat2) of the triglyceride synthesis pathway), and the expression of these genes was suppressed by either IOE or IOP (Figure 3A–E). Compared with the IOE group, the expression levels in the IOP group were more similar to those in the NCD group. The modulation of the expression of seven genes (Chrebp for the glycolysis pathway, G6 Pas and PEPCK for the gluconeogenesis pathway, Acc for the de novo fatty acid synthesis pathway, Acox and Mcad for the beta oxidation pathway, and Gpat for the triglyceride synthesis pathway) in the IOE group was not as strong as that in the IOP group (Figure 3A–E). Compared with the IOE group, the expression of Chrebp of the glycolysis pathway and G6PAS of the gluconeogenesis pathway was more strongly suppressed in the IOP group (Figure 3A,B). In addition, unlike other enzymes and regulators, the expression levels of six genes in the de novo fatty acid synthesis pathway were very similar in the IOE and IOP groups (Figure 3C). Interestingly, the expression of glucokinase (GK) of the glycolytic pathway, which expressed an enzyme not inhibited by the product glucose-6-phosphate, was not affected by IOE or IOP intake (Figure 3A).
Figure 3.
Effects of IOE/IOP administration on the expression of genes related to glucose metabolism and triglyceride metabolism in the liver. IOE/IOP induces transcriptional responses of genes related to glycolysis (A), gluconeogenesis (B), fatty acid synthesis (C), β-oxidation (D), and TG synthesis (E) in the liver.
In summary, both IOE and IOP ameliorated liver glucose metabolism and triglyceride metabolism in HFD mice, and the regulation ability of IOP was stronger.
1H NMR-Based Metabolomics for Determination of Urine and Serum
The metabolomes of serum and urine reflected the overall metabolic changes of the host and explained the changes in glucose metabolism and triglyceride metabolism in HFD mice. Therefore, we interrogated changes in the metabolome using 1H NMR-based metabolomics techniques.
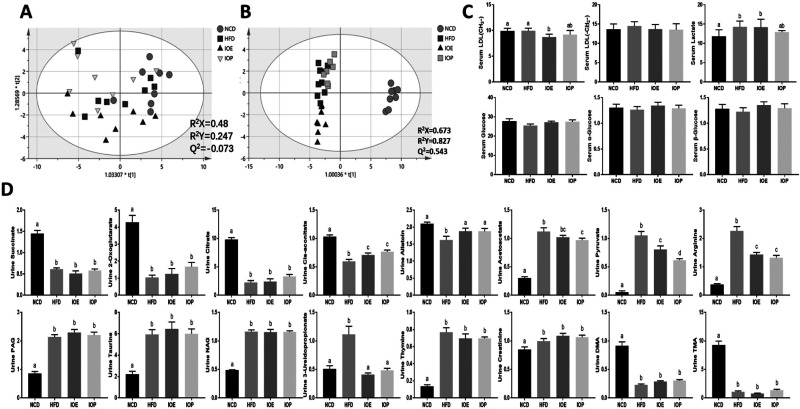
The serum modeling was not ideal (R2X = 0.48, R2Y = 0.247, Q2 = −0.073). The separation was poor in the two-dimensional (2D) score scatter plot of the four experimental groups (Figure 4A), and the difference among the four experimental groups was seen in the three-dimensional (3D) score scatter plot (Figure S1A). The 2D score scatter plot of urine showed a significant separation of the basal diet group and the three groups of high-fat diet (Figure 4B), and in the 3D score scatter plot, the separation of HFD group, IOE group, and IOP group was also observed (Figure S1B).
Figure 4.
Effects of IOE/IOP administration on metabolites of mice. 2D score scatter plots of the orthogonal partial least-squares discriminant analysis (OPLS-DA) classification of (A) urine and (B) serum. Main metabolites (variable importance of projection (VIP) > 2) identified through 1H NMR data of (C) serum samples and (D) urine samples.
After screening (VIP > 2, Figure S2) and identification (Table S1), several metabolites in serum are presented in Figure 4C. We found an increase of lactate in serum metabolites with the high-fat diet compared with the basal diet. However, compared with the HFD group, LDL (CH3−) was decreased in the IOE group, and LDL (CH3−) (p = 0.049) and lactate (p = 0.071) were less in the IOP group.
The 16 major metabolites in urine were divided into two categories (Table S2 and Figure 4D). Some metabolites were decreased by HFD, including citrate, 2-oxoglutarate, succinate, cis-aconitate, allantoin, dimethylamine, and trimethylamine, and other metabolites were increased by HFD, including pyruvate, acetoacetate, 3-ureidopropionate, taurine, arginine, N-acetylglutamate, phenylacetylglycine, and creatinine. We found that both IOE and IOP increased the levels of cis-aconitine (TCA cycle) and allantoin (the end product of ATP and GTP) and decreased the levels of 3-ureidopropionate (substrate for coenzyme A (CoA) synthesis), arginine (Amino acid metabolism), and pyruvate (glucose metabolism). Moreover, the levels of citrate (p = 0.0526, TCA cycle), 2-oxoglutarate (p = 0.0661, TCA cycle), and acetoacetate (fatty acid metabolism) were also promoted by IOP.
Metabolic pathway analyses were conducted using MetaboAnalyst 4.0 (http://www.metaboanalyst.ca/) based on the differentially expressed metabolites.18 The identified pathways associated with the effect of IOE/IOP on HFD mice are presented according to the p-values from the pathway enrichment analysis (y-axis) and pathway impact values from pathway topology analysis (x-axis). We found that the TCA cycle, pantothenate and CoA biosynthesis, and other metabolic pathways were perturbed (Figure S3). Moreover, the TCA cycle is the most affected by IOE (p = 0.011) and IOP (p = 1.82 × 10⁻⁶).
These results indicated that IOE and IOP improved the metabolism of mice disturbed by high-fat diet feeding, mainly in the TCA cycle and degradation of three major nutrients. Moreover, IOP showed stronger adjustment ability than IOE.
1H NMR-Based Metabolomics for Determination of Cecum Contents
Recent studies have shown that the metabolites of gut microbiota played an important and even decisive role in the regulation of host metabolism by extracts of plants and mushrooms.19,20 Therefore, metabolites in cecum contents were measured.
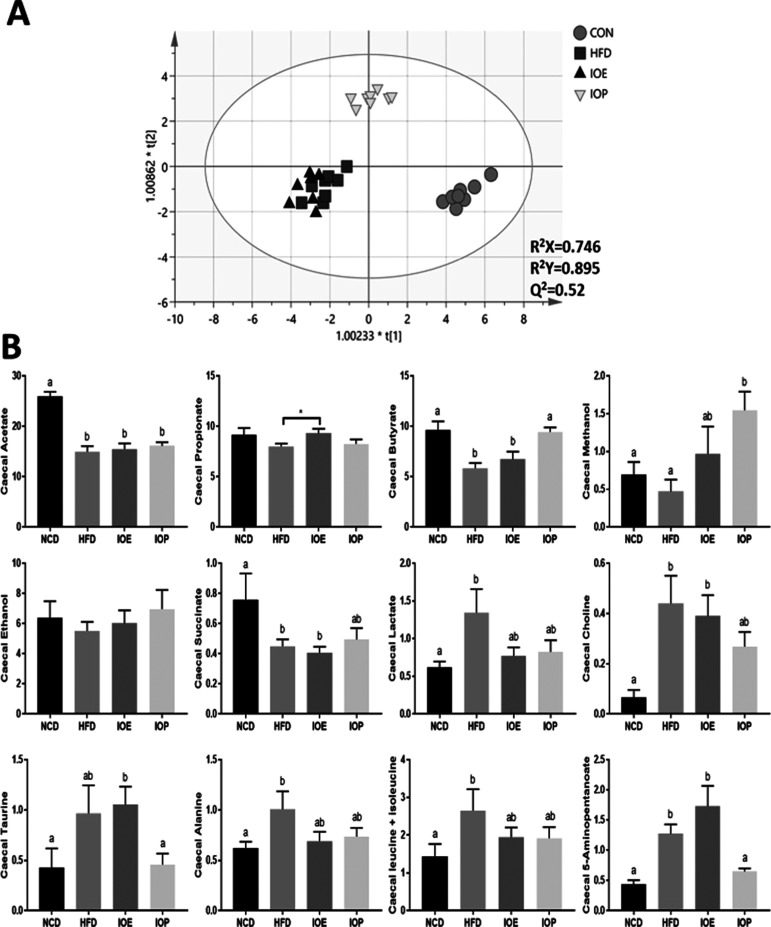
As shown in Figure 5A, NCD and IOP groups were significantly separated from the HFD group in the 2D score scatter plot, and the IOE group was also well separated from the HFD group in the 3D score scatter plot. Twelve metabolites were picked up. Except for ethanol, the other 11 metabolites showed statistical differences in the comparison of the experimental groups (Table S3 and Figure 5B). Compared with the NCD group, HFD feeding decreased the relative content of acetate, butyrate, and succinate and increased the relative content of lactate, choline, alanine, taurine, leucine/isoleucine, and 5-aminopentanoate. Compared with the HFD group, the intake of IOE increased the relative content of propionate (p = 0.0281) in the cecum, and IOP increased the relative content of butyrate and methanol (metabolites of short-chain fatty acid (SCFA)) and decreased the relative content of 5-aminopentanoate in the cecum compared with the HFD group.
Figure 5.
Effects of IOE/IOP administration on metabolites of gut microbiota. (A) 2D score scatter plots of the OPLS-DA classification of cecum content samples. (B) Main metabolites (VIP > 2) identified through 1H NMR data of cecum content samples.
In conclusion, IOE and IOP altered the metabolism of gut microbiota in HFD mice, mainly in SCFA metabolism.
Gut Microbiota Analysis
The production of specific metabolites was related to some bacteria.21 Therefore, we analyzed the changes in the microbiota of cecum contents induced by diet and extract, to investigate how changes in the intestinal microbiota affect metabolite conversion.
As shown in Figure S4, the alpha diversity in the NCD group, IOE group, or IOP group was not significantly different from that in the HFD group, which illustrated that neither the change in diet nor the intake of extracts changed the alpha diversity of the microbiota in both cecum contents. However, the Shannon index of cecal microbiota was higher and the Simpson index of cecal microbiota was lower in the IOE group than those in NCD and IOP groups. In addition, the beta diversity of cecal microbiota in each group showed significant differences (p = 0.001).
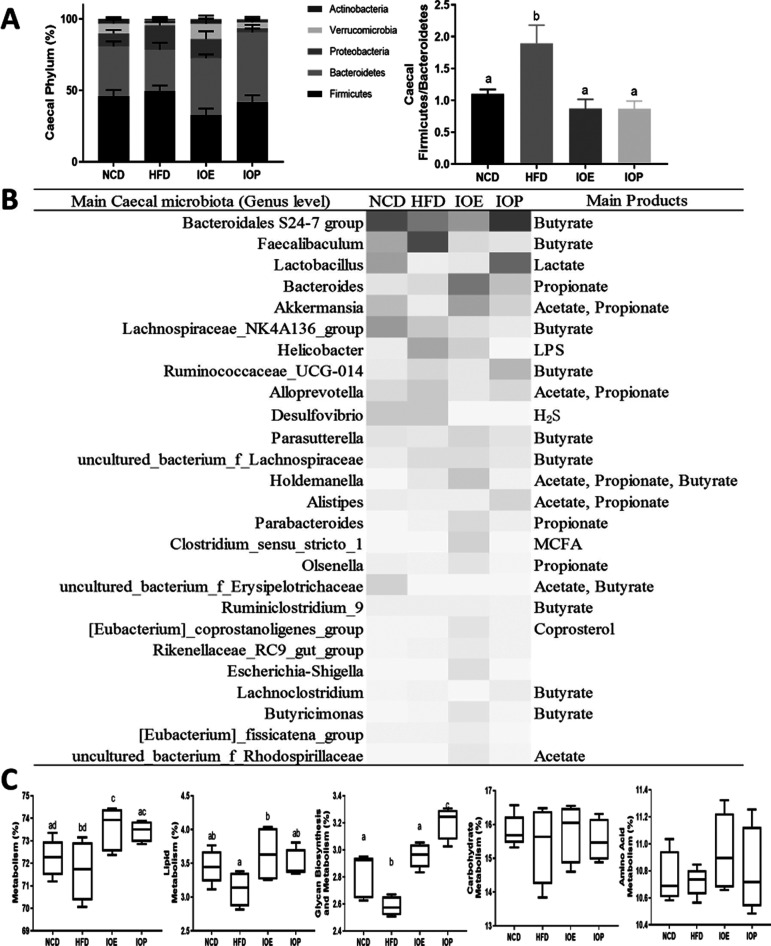
After the DNA sequencing of cecal microbiota, we found that HFD feeding and I. obliquus extracts changed the proportion of cecal bacteria (Figure 6A,B). At the phylum level, compared with the NCD group, the high-fat diet caused an increase in the Firmicutes-to-Bacteroidetes ratio (F/B), while IOE and IOP decreased the F/B increase caused by the high-fat diet. At the genus level, we analyzed bacterial changes with relative abundances greater than 1%. Compared with the HFD group, the Bacteroidales S24-7 group that produced butyrate and Lactobacillus that produced lactate were enriched in NCD and IOP groups, propionate producers Akkermansia and Bacteroides were enriched in the IOE group, and SCFA-producing bacteria Holdemanella and Ruminococcaceae_UCG-014 were enriched in the IOE group and IOP group. Additionally, we found that Faecalibaculum that produced butyrate, Helicobacter that produced lipopolysaccharide (LPS), and Desulfovibrio that produced H2S were abundant in the HFD group.
Figure 6.
Effects of IOE/IOP administration on gut microbiota. (A) Relative abundance of microbiota at the phylum level and the ratio of Firmicutes to Bacteroidetes (F/B) in the cecum. (B) Heatmaps generated by the relative abundance of cecal microbiota at the genus level. (C) Function prediction of cecal microbiota.
The gut microbiota functional profile showed that high-fat diet feeding caused a decrease in metabolism (class 1) of cecal microbiota, while IOE and IOP increased the metabolism. Moreover, IOE and IOP modulated the glycan biosynthesis and metabolism of the microbiota (class 2), and there was a significant increase in lipid metabolism by IOE (Figure 6C).
These results showed that IOE and IOP modulated the structure and function of the cecal microbiota in HFD mice.
Correlation Analysis
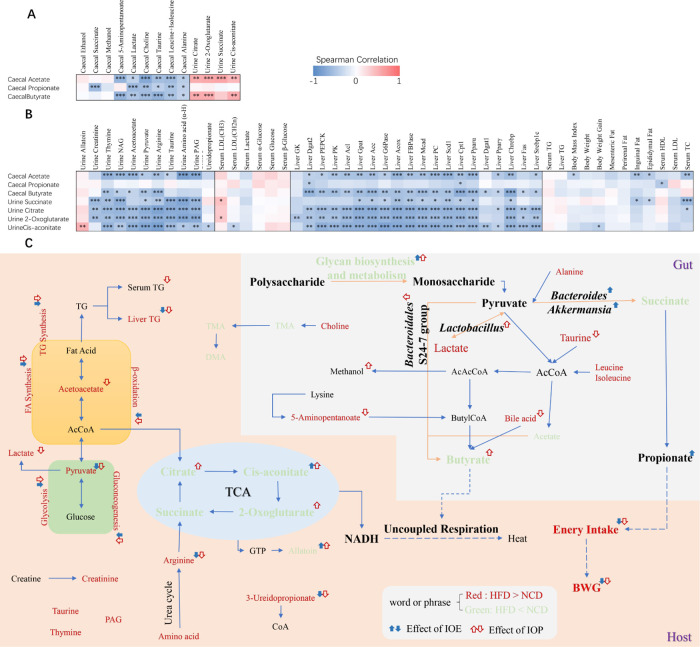
In this study, key metabolites (three SCFAs and four metabolites of the TCA cycle) were correlated with other metabolites and measures separately (Figure 7A,B). We found that there was a positive correlation between butyrate and four metabolites of the TCA cycle, while propionate was irrelevant to the metabolites of the TCA cycle (Figure 7B). Moreover, there were significantly negative correlations between the three SCFAs and most other cecal metabolites and between the four metabolites of the TCA cycle and most other urine metabolites. Furthermore, butyrate was significantly negatively correlated with most urinary metabolites, expression of genes involved in glucose, and triglyceride metabolism in the liver, but propionate was correlated with few measures.
Figure 7.
Heatmaps generated by Spearman’s correlations (A, B) and schematic overview of SCFA production and obesity improvement (C). The color at each intersection of heatmaps indicates the value of the r coefficient; * indicates a significance correlation between these two parameters (*p < 0.05, **p < 0.01, ***p < 0.001).
Discussion
I. obliquus is a medicinal and edible mushroom and has been used for the prevention and treatment of various diseases for several centuries.13 Its two extracts (IOP and IOE) rich in many active ingredients have been proved to prevent or treat diabetes, cardiovascular diseases, obesity, and neurodegenerative diseases.13 Moreover, their effect on HFD-induced obesity caused changes in many metabolites of the mice and gut microbiota. This study investigated the difference in effects of two I. obliquus extracts (IOE and IOP) on HFD-induced obesity and associated the host and gut microbial metabolites through the changes of the chemicals by the two extracts.
This study is the first to investigate the effects of IOE on obese individuals and the comparison of the effects between IOE and IOP. By measuring the usual indices of obesity, we found that both IOE and IOP significantly ameliorated HFD-induced obesity and regulated hepatic glucose metabolism and triglyceride metabolism to varying degrees. Previous studies have shown that a high-fat diet led to intestinal flora imbalance, causing bacterial metabolic disorders.22 We performed an in-depth examination and analysis of the gut microbiota composition and metabolome. Previous studies have reported that the ratio of Firmicutes to Bacteroidetes was tightly linked to microbiota metabolic capacity, polysaccharide metabolism, and SCFA production.23 Consistent with this, in this experiment, Firmicutes/Bacteroidetes were increased in the cecum of the HFD group and the microbiota polysaccharide metabolic function and SCFA levels were decreased. The two extracts modulated the microbiota structure, function, and metabolite levels. At the genus level, although the HFD group was enriched with many SCFA-producing bacteria, such as Faecalibaculum that had the main advantage, the overall ability of the microbiota to degrade polysaccharides was low due to its lack of ability to degrade polysaccharides,24 resulting in the decrease of SCFA levels. In the IOE group, compared with the HFD group, the total relative abundance of Bacteroides, Akkermansia, Holdemanella, and Olsenella significantly enriched in the cecum, and they were all propionate-producing bacteria.25,26 In the IOP group, Lactobacillus, which was significantly enriched in the cecum compared with the HFD group, did not produce butyrate directly, but it got converted into lactate and then to pyruvate,27 a substrate required for butyrate production, and it was often symbiotic with butyrate producers, including the Bacteroidales S24-7 group.28 In addition, production of SCFAs was closely related to degradation of amino acids and dietary fats.29−31 We observed higher amino acid levels in the HFD group with low cecal SCFA levels. However, IOE and IOP groups with higher SCFA levels had lower amino acid levels compared with the HFD group. Moreover, we found that SCFAs were significantly negatively correlated with most other metabolites in cecum (Figure 7A). These results suggested that IOE and IOP exerted different effects on the microbiota structure and function, resulting in different SCFA profiles. There was a higher propionate level in the IOE group and a higher butyrate level in the IOP group.
Intestinal SCFAs produce many metabolic benefits to the host, and the improvement of energy metabolism mainly includes the regulation of energy intake and energy expenditure.20 The most main mechanism by which SCFAs regulate energy intake is to promote the release of two anorexigenic gut hormones, glucagon-like peptide (GLP-1) and peptide YY (PYY), from intestinal L colonocytes by activating G-protein-coupled receptors GPR41 and GPR43.32,33 In this study, the mice in the IOE group had the least energy intake. Although acetate and butyrate are also involved in the regulation of energy intake, propionate has a higher affinity for GPR41 and GPR43.33,34
When SCFA increases host energy consumption, the increase of TCA cycle level has been often observed,35 but their correlation has been rarely mentioned. In our study, the TCA cycle and butyrate, which played a key role in host metabolism and microbial metabolism, were found to be significantly correlated. Previous studies have shown that butyrate promoted host mitochondrial uncoupling, which led to accelerate the rate of NADH production, thereby increasing the level of the TCA cycle, and finally resulted in promoting degradation of nutrients and reducing the accumulation of metabolites.36−38 Moreover, IOE and IOP reduced 3-ureidopropionate, a synthetic substrate of CoA. It is well known that CoA is an important coenzyme in the degradation of nutrients and reflects the levels of nutrient degradation and metabolite accumulation. Similarly, metabolites produced during nutrient degradation and the expression of associated genes, which was regulated by metabolite levels, are able to more intuitively reflect the levels of nutrient degradation and metabolite accumulation. In this experiment, both IOE and IOP improved high levels of metabolites and the expression of related genes caused by the diet. Moreover, the improvement of IOP was more effective. Consistent with this, in our study, in addition to a significant decrease in hepatic lipid accumulation in the IOE group, which inhibited energy intake by propionate enrichment, hepatic lipids were also significantly reduced in the mice in the IOP group, which was largely enriched with butyrate. Compared with the IOE group, IOP had a stronger regulatory effect on hepatic metabolism and triglyceride metabolism and higher levels of TCA cycle in the host. In addition, butyrate has the ability to promote browning of white adipose tissue (WAT) to brown adipose tissue (BAT).39,40 WAT stores energy, whereas BAT uses energy for heating and consequently host energy expenditure increases.41,42 However, adipose tissue weight does not change after WAT browning.43 Therefore, the weight of adipose tissue of mice in the IOP group dominated by butyrate was greater than that of the mice in the IOE group dominated by propionate.
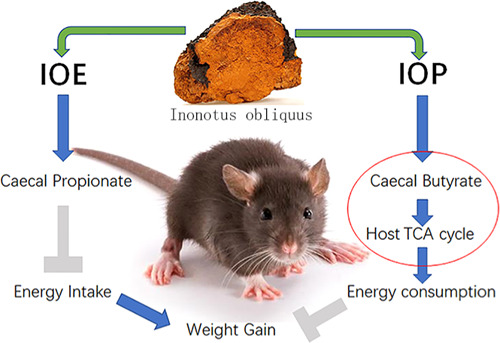
In conclusion (Figure 7C), the improvement of obesity condition in mice by both I. obliquus extracts was attributed to their effects on gut microbiota and SCFA profiles. IOE increased the levels of propionate-producing bacteria Bacteroides and Akkermansia in the cecum of HFD-fed mice, resulting in the enrichment of propionate. Propionate reduced weight gain in mice by inhibiting energy intake. IOP increased the levels of butyrate-production-associated bacteria Lactobacillus and the Bacteroidales S24-7 group in the cecum of HFD-fed mice, resulting in the enrichment of butyrate. Butyrate increased energy consumption, TCA cycle levels, and degradation of carbohydrates and lipids in mice by promoting mitochondrial decoupling.
Conclusions
IOE and IOP ameliorated HFD-induced obesity condition in mice through differential modulatory effects on gut microbial metabolism. Moreover, we found the connections between cecal butyrate (not propionate) and chemicals of mice, including four metabolites of the TCA cycle and other metabolism-related chemicals.
Materials and Methods
Preparation of IOE/IOP
The dried and powdered I. obliquus (1.0 kg) was extracted with ultrapure water (30 L) at 90 °C for 3 h and concentrated. The supernatant was evaporated in vacuo at 45 °C, followed by extracting with 4 vol of ethanol to get crude extract. The extract was deproteinized by the Sevage method five times. The supernatant was dried in vacuo and lyophilized to get IOP (62.5 g). After I. obliquus was extracted with water, the residue was extracted with 80% ethanol at 80 °C in a water bath for 2 h. The supernatant was dried in vacuo and lyophilized to get IOE (30.9 g).
Animal Experimental Design
The experimental protocol was approved by the Animal Ethics Committee of Jilin University and complied with national laws. Five-week-old C57BL/6J male mice (15–17 g) were divided into four groups, 12 mice per group. The mice in the NCD group were fed with normal chow diet, and the mice in the HFD group, IOE group, and IOP group were fed with high-fat diet. The compositions of mice diets are presented in Tables S4 and S5. The mice in the IOP group were gavaged with IOP at a dose of 1000 mg/kg per day according to previous studies,44 and the mice in the IOE group were gavaged with IOE at a dose of 500 mg/kg per day according to the extraction rate of IOE/IOP and the dose of IOP. After 14 weeks of treatment, the mice were sacrificed for specimens.
Oral Glucose Tolerance Test (OGTT)
OGTT was performed using a previously described method.45
Serum Biochemical Analysis
Serum and liver lipid were measured using the method of kits obtained from Nanjing Jiancheng Bioengineering Institute (Nanjing, China).
RNA Preparation and Quantitative PCR Analysis
The total RNA extraction and the reverse transcription (RT)-qPCR analysis of the gene expression were performed using a previously described method.46 Primer sequences for the targeted mouse genes are shown in Table S6.
Sample Collection
Urine was collected using metabolic cages at 14th week, and 50 μL of sodium azide solution (0.1% w/w) was added into each urine sample. Cecum contents were washed from cecum in a 2 mL Eppendorf tube containing 1.0 mL of cold phosphate-buffered saline (PBS) (pH 7.4). All samples were then stored in a −80 °C freezer for later analysis.
All samples were thawed at room temperature. Serum was prepared by mixing 100 μL of each sample with a solution of 500 μL of PBS in D2O (containing 3-(tri-methyl-silyl) propionic-2,2,3,3-d4 acid sodium salt (TSP)). Then, 200 μL exudate of cecum contents was mixed with a solution of 400 μL of PBS in D2O (containing TSP). Supernatants (550 μL) were pipetted into NMR analysis tubes after centrifuging (15 000 rpm, 15 min, 4 °C) and passing through 0.22 μm membrane filters. For each urine sample, 400 μL of the sample was mixed with a solution of 200 μL of PBS in H2O. Then, 500 μL of supernatants was pipetted into NMR analysis tubes after centrifuging (15 000 rpm, 5 min, 4 °C), and 50 μL of D2O containing TSP was also added to each tube. D2O provided a field frequency lock and TSP a chemical shift reference (1H, δ 0.0).
NMR Data Acquisition and Processing
All samples were analyzed by an AVANCE III 600M MHz NMR spectrometer at 298.2 K. 1H NMR spectra were acquired by one-dimensional (1D) version CPMG (serum samples) and noesyphpr (urine and cecal samples) pulse sequence with water suppression during the relaxation delay of 3 s and a mixing time of 0.1 s. Sixty-four free induction decays were collected into 64 K data points with a spectral width of 7812.5 Hz (serum samples) and 8417.5 Hz (urine and cecal samples) and an acquisition time of 2 s. Free induction decay (FID) was zero-filled to 64 K prior to Fourier transformation.
Metabolite identifications were confirmed using the Human Metabolome Database (HMDB) and previous studies,47 based on chemical shifts of hydrogen and peak multiplicity (Figures S5–S7 and Table S7).
All of the spectra were manually phased and baseline-corrected in software MestreNova 12.0 (Mestre-lab Research SL). Each spectrum was segmented into regions with a width of 0.005 ppm between δ 9.6 and 0.4. The δ 5.48–6.20 region in urine spectra and δ 4.72–5.20 region in all spectra were excluded to eliminate the effects of urea signals and water suppression. All remaining regions of the spectra were then normalized to the total sum of the integrated spectral area to reduce any significant concentration differences.
Sequencing, Diversity Analysis, and Function Prediction of Cecal Microbiota
DNA extraction, sequencing, and data processing were performed using a previously described method.48
Four parameters of the alpha diversity were used to assess the overall diversity thoroughly. The Ace and Chao (only presence/absence of taxa considered) indexes determine the richness in a community, while the Shannon and Simpson indexes (additionally accounts for the number of times that each taxon was observed) determine the richness and/or evenness of a community. In addition, a higher Shannon index or a lower Simpson index indicates higher community diversity. Unlike alpha diversity, beta diversity was used to measure the division of diversity between two or more communities. Microbial communities had often been characterized using divergence-based measures of beta diversity to determine whether two or more communities were significantly different.
We used PICRUSt (phylogenetic investigation of communities by reconstruction of unobserved states) to perform functional predictions. PICRUSt generates metagenomic predictions from 16S rRNA data using annotations of sequenced genomes in the IMG database. Moreover, the Kyoto Encyclopedia of Genes and Genomes (KEGG) database was used for functional classification.49
Statistical Analysis
The data were expressed as means ± standard errors of the means (SEM). One-way analysis of variance (ANOVA) was performed to identify significant differences among four groups, followed by the indicated post hoc test (lysergic acid diethylamide (LSD) comparison test). The results were considered statistically significant at p-value < 0.05 unless otherwise specified in the figures. P-value between two independent groups was analyzed using an unpaired two-tailed t-test. Metabolomics data were subjected to OPLS-DA using software SIMCA 14.0 (Umetrics, Sweden) and used to construct multivariate statistical models. Bivariate correlations were calculated using Spearman’s r coefficients. Heatmaps were constructed using Excel 2016.
Accession Number
High-throughput sequencing data have been submitted to the NCBI Sequence Read Archive (SRA) under the accession number PRJNA576716.
Acknowledgments
This work was supported by the Jilin Province Science and Technology Institute of China (No. 20180201078YY).
Glossary
Abbreviations Used
- TC
total cholesterol
- TG
triglycerides
- HDL
high-density lipoprotein cholesterol
- LDL
low-density lipoprotein cholesterol
- TSP
3-(tri-methyl-silyl) propionic-2, 2, 3, 3-d4 acid sodium salt
- PBS
phosphate-buffered saline
- Chrebp
carbohydrate-responsive element binding protein
- GK
glucokinase
- PK
pyruvate kinase
- PEPCK
phosphoenolpyruvate carboxykinase
- PC
pyruvate carboxylase
- FBPase
fructose-1,6-bisphosphatase
- G6Pase
glucose-6-phosphatase
- Ppar-γ
peroxisome proliferator-activated recepto γ
- Srebp1c
sterol regulatory element binding protein-1c
- Fas
fatty acid synthase
- Acl
ATP-citrate lyase
- Scd1
stearoyl-CoA desaturase 1
- Acc
acetyl-CoA carboxylase
- Acox
acyl-CoA oxidase
- Ppar-α
peroxisome proliferator-activated recepto α
- Cpt1
carnitine palmitoyltransferase I
- Mcad
medium-chain acyl-CoA dehydrogenase
- Dgat1
diacylglycerol acyltransferase 1
- Dgat2
diacylglycerol acyltransferase 2
- Gpat
glycerol-3-phosphate acyltransferase
- VIP
variable importance of projection
- OPLS-DA
orthogonal partial least-squares discriminant analysis
- CoA
coenzyme A
- SCFA
short-chain fatty acids
Supporting Information Available
The Supporting Information is available free of charge at https://pubs.acs.org/doi/10.1021/acsomega.0c01566.
3D score plots of the OPLS-DA classification; VIP plot of OPLS-DA; pathway analysis based on different metabolites; effects of IOE/IOP on gut microbial diversity; 1H NMR spectra of mice serum, urine, and cecal contents (Figures S1–S7); main metabolites of serum, urine, and cecum contents; compositions of NCD and HFD; primer sequence for amplification of the fragments; and metabolite identifications (Tables S1–S7) (PDF)
Author Contributions
Conceptualization, J.Y., H.X., and Q.X.; investigation, J.Y.; supervision and resources, H.X. and Q.X.; Writing-original draft, J.Y. and J.-Y.X.
The authors declare no competing financial interest.
Supplementary Material
References
- Canfora E. E.; Meex R. C. R.; Venema K.; Blaak E. E. Gut microbial metabolites in obesity, NAFLD and T2DM. Nat. Rev. Endocrinol. 2019, 15, 261–273. 10.1038/s41574-019-0156-z. [DOI] [PubMed] [Google Scholar]
- Ng M.; Fleming T.; Robinson M.; Thomson B.; et al. Global, regional, and national prevalence of overweight and obesity in children and adults during 1980-2013: a systematic analysis for the Global Burden of Disease Study 2013. Lancet 2014, 384, 766–781. 10.1016/S0140-6736(14)60460-8. [DOI] [PMC free article] [PubMed] [Google Scholar]
- Reilly J. J. Health Effects of Overweight and Obesity in 195 Countries. N. Engl. J. Med. 2017, 377, 1495–1497. 10.1056/NEJMc1710026. [DOI] [PubMed] [Google Scholar]
- WHO. W.H.O. Obesity and Overweight. 2016; Available from: https://www.who.int/news-room/fact-sheets/detail/obesity-and-overweight.
- Kim M.-S.; Kim I. Y.; Sung H. R.; Nam M.; et al. Metabolic dysfunction following weight regain compared to initial weight gain in a high-fat diet-induced obese mouse model. J. Nutr. Biochem. 2019, 69, 44–52. 10.1016/j.jnutbio.2019.02.011. [DOI] [PubMed] [Google Scholar]
- Guirro M. A.; Gual-Grau A.; Gibert-Ramos A.; Alcaide-Hidalgo J. M.; et al. Metabolomics Elucidates Dose-Dependent Molecular Beneficial Effects of Hesperidin Supplementation in Rats Fed an Obesogenic Diet. Antioxidants 2020, 9, 79 10.3390/antiox9010079. [DOI] [PMC free article] [PubMed] [Google Scholar]
- Yue S.; Zhao D.; Peng C.; Tan C.; et al. Effects of theabrownin on serum metabolites and gut microbiome in rats with a high-sugar diet. Food Funct. 2019, 10, 7063–7080. 10.1039/C9FO01334B. [DOI] [PubMed] [Google Scholar]
- Mayengbam S.; Mickiewicz B.; Trottier S. K.; Mu C.; et al. Distinct Gut Microbiota and Serum Metabolites in Response to Weight Loss Induced by Either Dairy or Exercise in a Rodent Model of Obesity. J. Proteome Res. 2019, 18, 3867–3875. 10.1021/acs.jproteome.9b00304. [DOI] [PubMed] [Google Scholar]
- Torres Santiago G.; Serrano Contreras J. I.; Meléndez Camargo M. E.; Zepeda Vallejo L. G. NMR-based metabonomic approach reveals changes in the urinary and fecal metabolome caused by resveratrol. J. Pharm. Biomed. Anal. 2019, 162, 234–241. 10.1016/j.jpba.2018.09.025. [DOI] [PubMed] [Google Scholar]
- Murugesan S.; Nirmalkar K.; Hoyo-Vadillo C.; García-Espitia M.; et al. Gut microbiome production of short-chain fatty acids and obesity in children. Eur. J. Clin. Microbiol. Infect. Dis. 2018, 37, 621–625. 10.1007/s10096-017-3143-0. [DOI] [PubMed] [Google Scholar]
- Mayengbam S.; Lambert J. E.; Parnell J. A.; Tunnicliffe J. M.; et al. Impact of dietary fiber supplementation on modulating microbiota-host-metabolic axes in obesity. J. Nutr. Biochem. 2019, 64, 228–236. 10.1016/j.jnutbio.2018.11.003. [DOI] [PubMed] [Google Scholar]
- Sundekilde U. K.; Yde C. C.; Honore A. H.; Caverly Rae J. M.; et al. An Integrated Multi-Omics Analysis Defines Key Pathway Alterations in a Diet-Induced Obesity Mouse Model. Metabolites 2020, 10, 80 10.3390/metabo10030080. [DOI] [PMC free article] [PubMed] [Google Scholar]
- Duru K. C.; Kovaleva E. G.; Danilova I. G.; Bijl P. The pharmacological potential and possible molecular mechanisms of action of Inonotus obliquus from preclinical studies. Phytother. Res. 2019, 33, 1966–1980. 10.1002/ptr.6384. [DOI] [PubMed] [Google Scholar]
- Han Y.; Nan S.; Fan J.; Chen Q.; Zhang Y. Inonotus obliquus polysaccharides protect against Alzheimerʼs disease by regulating Nrf2 signaling and exerting antioxidative and antiapoptotic effects. Int. J. Biol. Macromol. 2019, 131, 769–778. 10.1016/j.ijbiomac.2019.03.033. [DOI] [PubMed] [Google Scholar]
- Glamočlija J.; Ciric A.; Nikolic M.; Fernandes A.; et al. Chemical characterization and biological activity of Chaga (Inonotus obliquus), a medicinal “mushroom”. J. Ethnopharmacol. 2015, 162, 323–332. 10.1016/j.jep.2014.12.069. [DOI] [PubMed] [Google Scholar]
- Liu C.; Zhao C.; Pan H. H.; Kang J.; et al. Chemical constituents from Inonotus obliquus and their biological activities. J. Nat. Prod. 2014, 77, 35–41. 10.1021/np400552w. [DOI] [PubMed] [Google Scholar]
- Wold C. W.; Kjeldsen C.; Corthay A.; Rise F.; et al. Structural characterization of bioactive heteropolysaccharides from the medicinal fungus Inonotus obliquus (Chaga). Carbohydr. Polym. 2018, 185, 27–40. 10.1016/j.carbpol.2017.12.041. [DOI] [PubMed] [Google Scholar]
- Chong J.; Soufan O.; Li C.; Caraus I.; et al. MetaboAnalyst 4.0: towards more transparent and integrative metabolomics analysis. Nucleic Acids Res. 2018, 46, W486–W494. 10.1093/nar/gky310. [DOI] [PMC free article] [PubMed] [Google Scholar]
- Zhang L. S.; Davies S. S. Microbial metabolism of dietary components to bioactive metabolites: opportunities for new therapeutic interventions. Genome Med. 2016, 8, 46 10.1186/s13073-016-0296-x. [DOI] [PMC free article] [PubMed] [Google Scholar]
- Hu J.; Lin S.; Zheng B.; Cheung P. C. K. Short-chain fatty acids in control of energy metabolism. Crit. Rev. Food Sci. Nutr. 2018, 58, 1243–1249. 10.1080/10408398.2016.1245650. [DOI] [PubMed] [Google Scholar]
- Kawaguchi H.; Miyagawa H.; Nakamura-Tsuruta S.; Takaya N.; et al. Enhanced Phenyllactic Acid Production in Escherichia coli Via Oxygen Limitation and Shikimate Pathway Gene Expression. Biotechnol. J. 2019, 14, 1800478 10.1002/biot.201800478. [DOI] [PubMed] [Google Scholar]
- Murphy E. A.; Velazquez K. T.; Herbert K. M. Influence of high-fat diet on gut microbiota: a driving force for chronic disease risk. Curr. Opin. Clin. Nutr. Metab. Care 2015, 18, 515–520. 10.1097/MCO.0000000000000209. [DOI] [PMC free article] [PubMed] [Google Scholar]
- Wang S.; Li Q.; Zang Y.; Zhao Y.; et al. Apple Polysaccharide inhibits microbial dysbiosis and chronic inflammation and modulates gut permeability in HFD-fed rats. Int. J. Biol. Macromol. 2017, 99, 282–292. 10.1016/j.ijbiomac.2017.02.074. [DOI] [PubMed] [Google Scholar]
- Ramirez-Farias C.; Slezak K.; Fuller Z.; Duncan A.; et al. Effect of inulin on the human gut microbiota: stimulation of Bifidobacterium adolescentis and Faecalibacterium prausnitzii. Br. J. Nutr. 2009, 101, 541–550. 10.1017/S0007114508019880. [DOI] [PubMed] [Google Scholar]
- Wrigley D. M. Inhibition of Clostridium perfringens sporulation by Bacteroides fragilis and short-chain fatty acids. Anaerobe 2004, 10, 295–300. 10.1016/j.anaerobe.2004.05.006. [DOI] [PubMed] [Google Scholar]
- Adamberg K.; Adamberg S.; Ernits K.; Larionova A.; et al. Composition and metabolism of fecal microbiota from normal and overweight children are differentially affected by melibiose, raffinose and raffinose-derived fructans. Anaerobe 2018, 52, 100–110. 10.1016/j.anaerobe.2018.06.009. [DOI] [PubMed] [Google Scholar]
- Gänzle M. G. Lactic metabolism revisited: metabolism of lactic acid bacteria in food fermentations and food spoilage. Curr. Opin. Food Sci. 2015, 2, 106–117. 10.1016/j.cofs.2015.03.001. [DOI] [Google Scholar]
- Meisel M.; Mayassi T.; Fehlner-Peach H.; Koval J. C.; et al. Interleukin-15 promotes intestinal dysbiosis with butyrate deficiency associated with increased susceptibility to colitis. ISME J. 2017, 11, 15–30. 10.1038/ismej.2016.114. [DOI] [PMC free article] [PubMed] [Google Scholar]
- Cummings J. H.; Macfarlane G. T. The control and consequences of bacterial fermentation in the human colon. J. Appl. Bacteriol. 1991, 70, 443–459. 10.1111/j.1365-2672.1991.tb02739.x. [DOI] [PubMed] [Google Scholar]
- Wall R.; Ross R. P.; Shanahan F.; OʼMahony L.; et al. Metabolic activity of the enteric microbiota influences the fatty acid composition of murine and porcine liver and adipose tissues. Am. J. Clin. Nutr. 2009, 89, 1393–1401. 10.3945/ajcn.2008.27023. [DOI] [PubMed] [Google Scholar]
- Zhang H.; Wang P.; Qi Q. Molecular effect of FadD on the regulation and metabolism of fatty acid in Escherichia coli. FEMS Microbiol. Lett. 2006, 259, 249–253. 10.1111/j.1574-6968.2006.00277.x. [DOI] [PubMed] [Google Scholar]
- Tolhurst G.; Heffron H.; Lam Y. S.; Parker H. E.; et al. Short-chain fatty acids stimulate glucagon-like peptide-1 secretion via the G-protein-coupled receptor FFAR2. Diabetes 2012, 61, 364–371. 10.2337/db11-1019. [DOI] [PMC free article] [PubMed] [Google Scholar]
- Bohan R.; Tianyu X.; Tiantian Z.; Ruonan F.; et al. Gut microbiota: a potential manipulator for host adipose tissue and energy metabolism. J. Nutr. Biochem. 2019, 64, 206–217. 10.1016/j.jnutbio.2018.10.020. [DOI] [PubMed] [Google Scholar]
- Chambers E. S.; Morrison D. J.; Frost G. Control of appetite and energy intake by SCFA: what are the potential underlying mechanisms?. Proc. Nutr. Soc. 2015, 74, 328–336. 10.1017/S0029665114001657. [DOI] [PubMed] [Google Scholar]
- Gual-Grau A.; Guirro M.; Mayneris-Perxachs J.; Arola L.; Boqué N. Impact of different hypercaloric diets on obesity features in rats: a metagenomics and metabolomics integrative approach. J. Nutr. Biochem. 2019, 71, 122–131. 10.1016/j.jnutbio.2019.06.005. [DOI] [PubMed] [Google Scholar]
- Rose S.; Bennuri S. C.; Davis J. E.; Wynne R.; et al. Butyrate enhances mitochondrial function during oxidative stress in cell lines from boys with autism. Transl. Psychiatry 2018, 8, 42 10.1038/s41398-017-0089-z. [DOI] [PMC free article] [PubMed] [Google Scholar]
- Mollica M. P.; Mattace Raso G.; Cavaliere G.; Trinchese G.; et al. Butyrate Regulates Liver Mitochondrial Function, Efficiency, and Dynamics in Insulin-Resistant Obese Mice. Diabetes 2017, 66, 1405–1418. 10.2337/db16-0924. [DOI] [PubMed] [Google Scholar]
- Valvassori S. S.; Calixto K. V.; Budni J.; Resende W. R.; et al. Sodium butyrate reverses the inhibition of Krebs cycle enzymes induced by amphetamine in the rat brain. J. Neural Transm. 2013, 120, 1737–1742. 10.1007/s00702-013-1056-3. [DOI] [PubMed] [Google Scholar]
- Li B.; Li L.; Li M.; Lam S. M.; et al. Microbiota Depletion Impairs Thermogenesis of Brown Adipose Tissue and Browning of White Adipose Tissue. Cell Rep. 2019, 26, 2720.E5–2737.E5. 10.1016/j.celrep.2019.02.015. [DOI] [PubMed] [Google Scholar]
- Li Z.; Yi C. X.; Katiraei S.; Kooijman S.; et al. Butyrate reduces appetite and activates brown adipose tissue via the gut-brain neural circuit. Gut 2018, 67, 1269–1279. 10.1136/gutjnl-2017-314050. [DOI] [PubMed] [Google Scholar]
- Montanari T.; Poscic N.; Colitti M. Factors involved in white-to-brown adipose tissue conversion and in thermogenesis: a review. Obes. Rev. 2017, 18, 495–513. 10.1111/obr.12520. [DOI] [PubMed] [Google Scholar]
- Kajimura S.; Saito M. A new era in brown adipose tissue biology: molecular control of brown fat development and energy homeostasis. Annu. Rev. Physiol. 2014, 76, 225–249. 10.1146/annurev-physiol-021113-170252. [DOI] [PMC free article] [PubMed] [Google Scholar]
- Stanford K. I.; Middelbeek R. J.; Townsend K. L.; An D.; et al. Brown adipose tissue regulates glucose homeostasis and insulin sensitivity. J. Clin. Invest. 2013, 123, 215–223. 10.1172/JCI62308. [DOI] [PMC free article] [PubMed] [Google Scholar]
- Chou Y.-J.; Kan W. C.; Chang C. M.; Peng Y. J.; et al. Renal Protective Effects of Low Molecular Weight of Inonotus obliquus Polysaccharide (LIOP) on HFD/STZ-Induced Nephropathy in Mice. Int. J. Mol. Sci. 2016, 17, 1535 10.3390/ijms17091535. [DOI] [PMC free article] [PubMed] [Google Scholar]
- Gao X.; Xie Q.; Kong P.; Liu L.; et al. Polyphenol- and Caffeine-Rich Postfermented Pu-erh Tea Improves Diet-Induced Metabolic Syndrome by Remodeling Intestinal Homeostasis in Mice. Infect. Immun. 2018, 86, e00601–e00617. 10.1128/iai.00601-17. [DOI] [PMC free article] [PubMed] [Google Scholar]
- Gao X.; Xie Q.; Liu L.; Kong P.; et al. Metabolic adaptation to the aqueous leaf extract of Moringa oleifera Lam.-supplemented diet is related to the modulation of gut microbiota in mice. Appl. Microbiol. Biotechnol. 2017, 101, 5115–5130. 10.1007/s00253-017-8233-5. [DOI] [PubMed] [Google Scholar]
- Wan C.; Zhan Y.; Xue R.; Wu Y.; et al. Gd-DTPA-induced dynamic metabonomic changes in rat biofluids. Magn. Reson. Imaging 2017, 44, 15–25. 10.1016/j.mri.2017.01.009. [DOI] [PubMed] [Google Scholar]
- Wang Y.; Xie Q.; Sun S.; Huang B.; et al. Probiotics-fermented Massa Medicata Fermentata ameliorates weaning stress in piglets related to improving intestinal homeostasis. Appl. Microbiol. Biotechnol. 2018, 102, 10713–10727. 10.1007/s00253-018-9438-y. [DOI] [PubMed] [Google Scholar]
- Douglas G. M.; Beiko R. G.; Langille M. G. I. Predicting the Functional Potential of the Microbiome from Marker Genes Using PICRUSt. Methods Mol. Biol. 2018, 1849, 169–177. 10.1007/978-1-4939-8728-3_11. [DOI] [PubMed] [Google Scholar]
Associated Data
This section collects any data citations, data availability statements, or supplementary materials included in this article.


