SUMMARY
Metastasis is the major driver of cancer deaths and begins when cancer cells invade surrounding tissues. Invasion and metastasis have been proposed to initiate following loss of the intercellular adhesion protein, E-cadherin (E-cad)1,2, based upon inverse correlations between in vitro migration and E-cad levels3. This hypothesis is inconsistent, however, with the observation that most breast cancers are invasive ductal carcinomas (IDC) and express E-cad in primary tumors and metastases4. To resolve this discrepancy, we tested the genetic requirement for E-cad in metastasis using murine and human models of both luminal and basal IDC. Here we show that E-cad promotes metastasis in IDC. While loss of E-cad increased invasion, it also reduced cancer cell proliferation and survival, circulating tumor cell number, seeding of cancer cells in distant organs, and metastasis formation. Transcriptionally, loss of E-cad was associated with upregulation of TGFβ, reactive oxygen, and apoptosis signaling pathways. At the cellular level, disseminating E-cad-negative cells exhibited nuclear enrichment of SMAD2/3, oxidative stress, and elevated apoptosis rates. Colony formation of E-cad-negative cells was rescued by inhibition of TGFβ receptor signaling, reactive oxygen accumulation, or apoptosis. Our results reveal that E-cad acts as a survival factor in IDC during the detachment, systemic dissemination, and seeding phases of metastasis by limiting reactive oxygen-mediated apoptosis. Identifying molecular strategies to inhibit E-cad mediated survival in metastatic breast cancer cells could potentially be a new therapeutic approach for breast cancer.
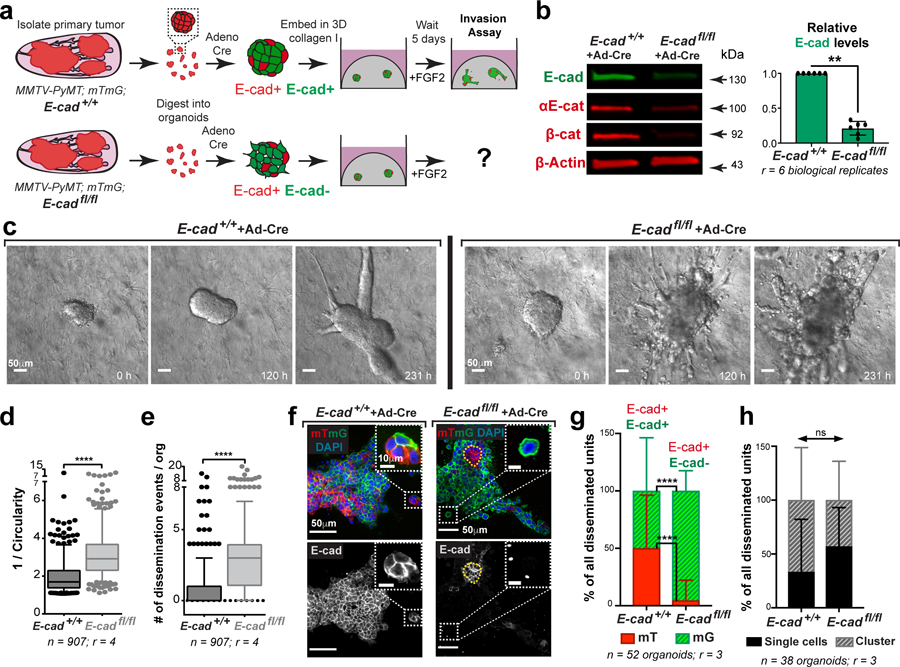
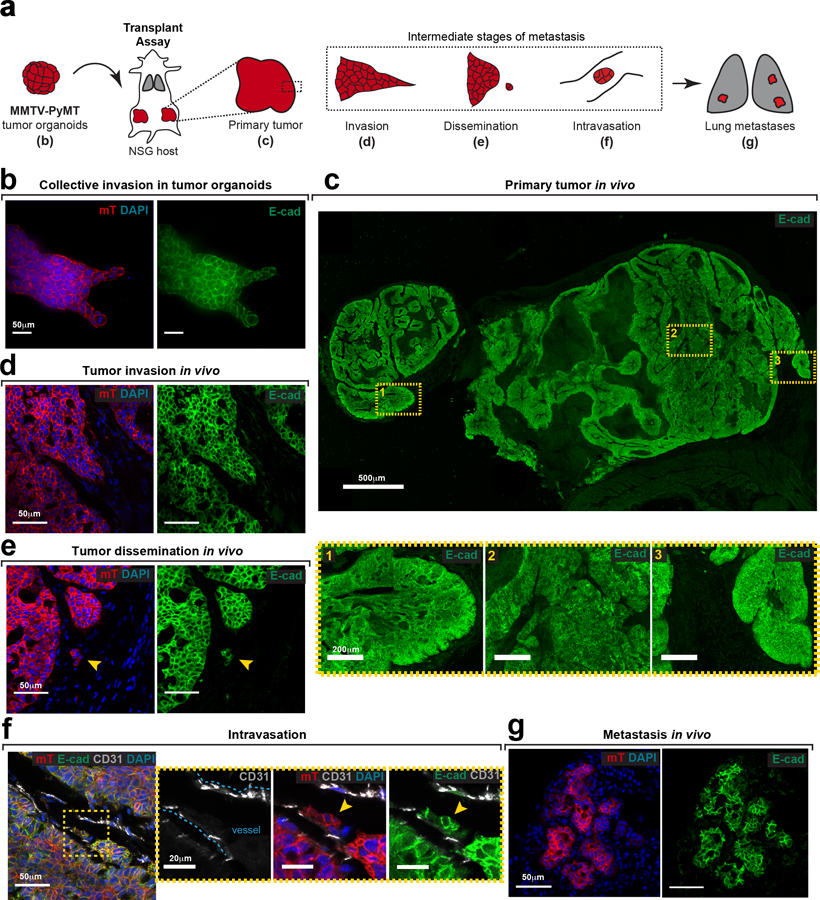
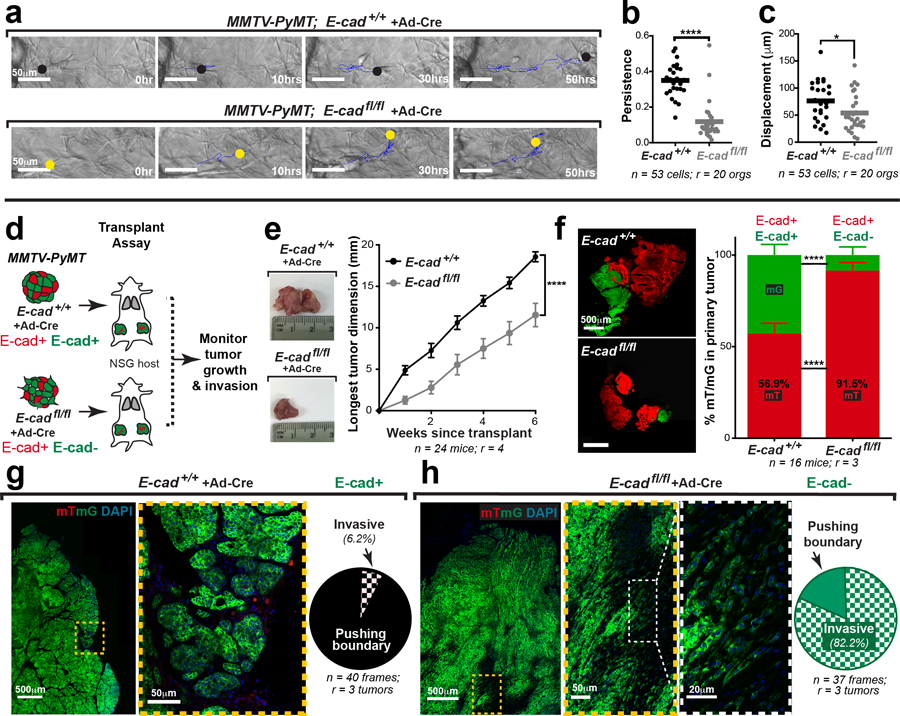
We began our analysis in the luminal MMTV-PyMT IDC model, as it retains E-cad during growth, invasion, dissemination, and metastatic colonization (Extended Data Fig. 1a–g). We introduced floxed E-cad alleles and a Cre reporter (mTmG), permitting inducible deletion of E-cad following infection with adenoviral Cre recombinase (adeno-Cre). For 3D invasion assays, primary tumors from MMTV-PyMT, E-cad+/+ or E-cadfl/fl mice were processed to organoids, transduced with adeno-Cre, then embedded in collagen I5 (Fig. 1a). This strategy reduced protein levels of E-cad, αE-catenin and β-catenin (Fig. 1b). Control MMTV-PyMT organoids retained E-cad and invaded collectively into collagen I5,6 (Fig. 1c). E-cad loss increased invasion and dissemination of predominantly E-cad- cells, with indistinguishable proportions of single cell and cluster dissemination events (Fig. 1c–h, Supplemental Video 1,2). E-cad- cells exhibited lower migratory persistence and displacement (Extended Data Fig. 2a–c).
Fig. 1: E-cad loss increases invasion and dissemination into 3D collagen I.
a) Schematic of 3D collagen I invasion assay using adeno-Cre treated organoids isolated from either MMTV-PyMT; E-cad+/+ or E-cadfl/fl tumors.
b) Representative Western blot depicting reduced protein levels of E-cad, β-catenin, and αE-catenin in adeno-Cre transduced E-cadfl/fl organoids relative to control (loading control on same gel; 6 replicates of E-cad were quantified for summary graph). Mean +/− SD. **p = 0.0022 (Mann-Whitney test, two-sided).
c) Representative timelapse DIC micrographs of adeno-Cre transduced E-cad+/+ and E-cadfl/fl organoids. Scale bar, 50 μm.
d-e) There is a significant increase in (d) invasion and (e) dissemination of adeno-Cre transduced E-cadfl/fl organoids, relative to control organoids. 5–95 percentile; ****p <0.0001 (Mann-Whitney test, two-sided).
f) Representative confocal images of adeno-Cre transduced E-cad+/+ and E-cadfl/fl organoids (scale bar, 50 μm) with zoomed insets for disseminated units (scale bar, 10 μm).
g) Relative proportion of mT vs mG dissemination units in adeno-Cre treated E-cad+/+ and E-cadfl/fl organoids. Graph depicts mean +/− SD. nsp = 0.324 (two-way ANOVA).
h) Relative proportion of single cell vs cluster dissemination in adeno-Cre treated E-cad+/+ and E-cadfl/fl organoids. Graph depicts mean +/− SD. ****p <0.0001 (two-way ANOVA).
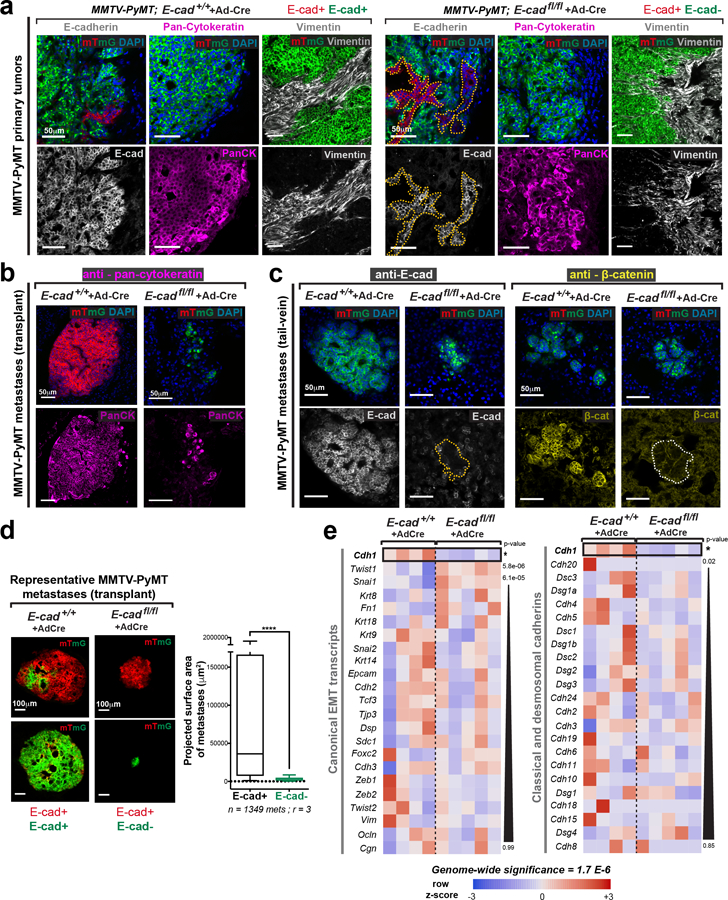
We next tested the requirement for E-cad in tumor growth, invasion, and dissemination in vivo. Briefly, adeno-Cre treated MMTV-PyMT; E-cad+/+ or E-cadfl/fl organoids were transplanted orthotopically into NOD-SCID gamma mice (NSG; Extended Data Fig. 2d). Tumors arising from E-cadfl/fl organoids were smaller and E-cad- cells (mG+) were underrepresented, suggesting negative selection (Extended Data Fig. 2e,f). Analysis of control tumors in vivo revealed bulky cytokeratin+, E-cad+ collective invasion strands along <10% of the boundary (Extended Data Fig. 2g,3a). In contrast, analysis of the E-cad- (mG+) regions of E-cadfl/fl tumors revealed vimentin-, cytokeratin+ single file invasion along >80% of the boundary, suggesting retention of epithelial identity. (Extended Data Fig. 2h,3a).
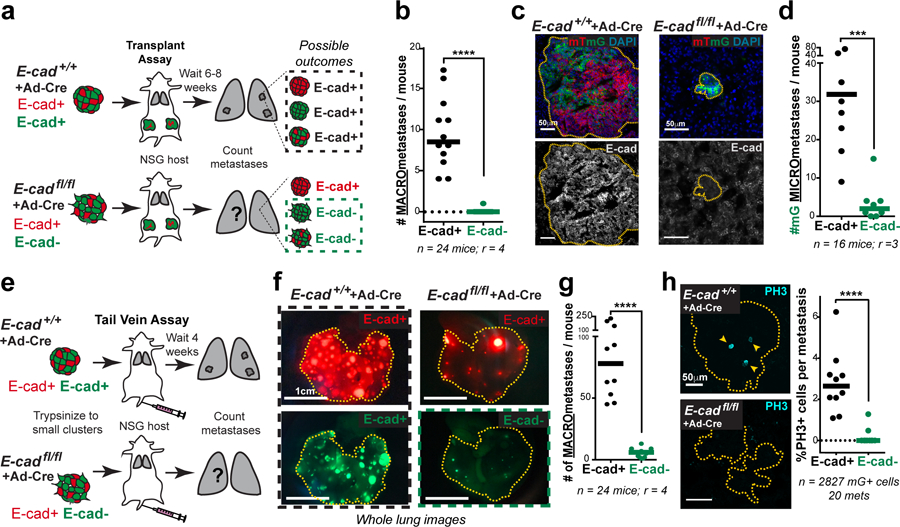
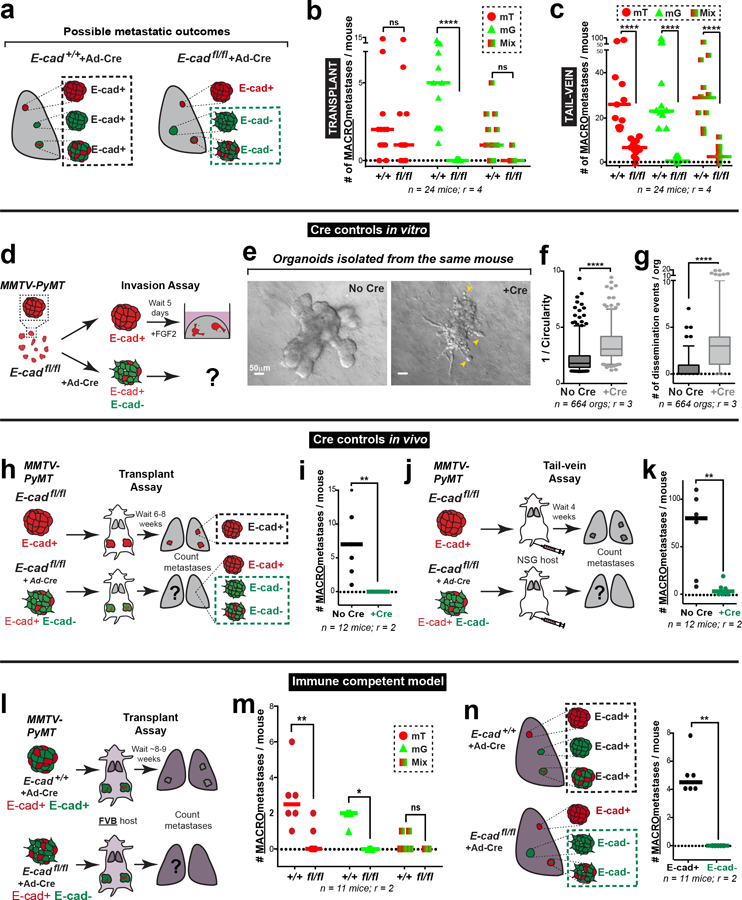
E-cad’s function as an invasion suppressor suggests that it should suppress metastasis7. However, invasion is an early step in metastasis and may not be rate limiting.8 We, therefore, tested whether loss of E-cad increases metastasis in vivo. Briefly, we transplanted adeno-Cre treated MMTV-PyMT; E-cad+/+ or E-cadfl/fl organoids into NSG mice and quantified lung macro-metastases (Fig. 2a). Surprisingly, tumors derived from E-cadfl/fl organoids generated essentially no E-cad- macro-metastases (Fig. 2b,c; Extended Data Fig. 4a,b). The few E-cad- metastases that formed were cytokeratin+ (Extended Data Fig. 3b). Loss of E-cad therefore increased invasion and decreased metastasis.
Fig. 2: E-cad loss inhibits metastasis.
a) Adeno-Cre transduced MMTV-PyMT E-cad+/+ or E-cadfl/fl tumor organoids were transplanted into NSG mice. Lungs were harvested 6–8 weeks later, and metastases counted. All metastases arising in control mice are E-cad+. Only mG+ containing metastases in E-cadfl/fl transplant mice are E-cad-.
b) E-cad- cancer cells rarely contribute to macro-metastases in E-cadfl/fl transplant mice. Bar – median. ****p-value<0.0001 (Mann-Whitney test, two-sided).
c) As seen by immunofluorescence, metastases in control mice are E-cad+. mG+ metastases arising in E-cadfl/fl transplant mice are E-cad-. Scale bar, 50 μm.
d) The number of mG+ micro-metastases is greatly reduced in E-cadfl/fl mice relative to control mice. Bar – median. ***p = 0.0003 (Mann-Whitney test, two-sided).
e) Adeno-Cre transduced MMTV-PyMT; E-cad+/+ or E-cadfl/fl organoids were trypsinized into small clusters and injected via the tail vein of NSG mice. Lungs were harvested after 4 weeks and examined for macro-metastases.
f) Whole lung micrographs of mT (Cre-) and mG (Cre+) metastases. Black box represents E-cad+ metastases in control mice. Green box represents E-cad- metastases in mice injected with adeno-Cre treated E-cadfl/fl cells. Scale bar, 1 cm.
g) E-cad negative cancer cells rarely contribute to metastases in a tail-vein assay. Bar – median. ****p<0.0001 (Mann-Whitney test, two-sided).
h) Left: Representative confocal images of PH3+ nuclei within mG+ (E-cad+) metastasis in control mice and mG+ (E-cad-) metastases in mice injected with adeno-Cre transduced E-cadfl/fl cell clusters. Arrowheads – PH3+ nuclei. Scale bar, 50 μm. Right: %PH3+ nuclei per metastasis is represented. Bar – median. ****p<0.0001 (Mann-Whitney test, two-sided).
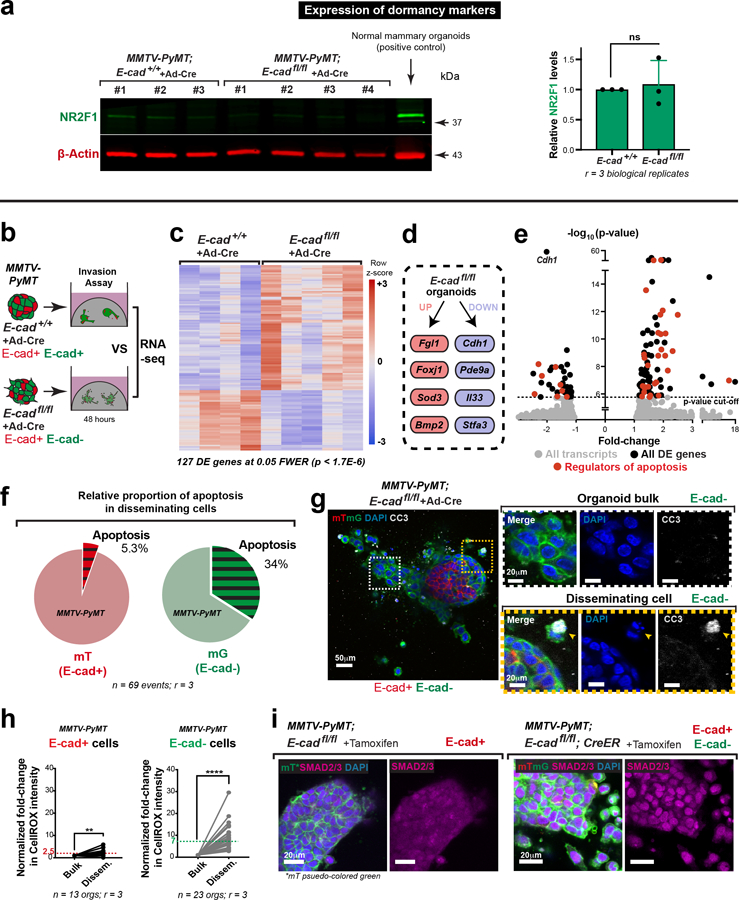
We sought to explain the reduced metastasis in orthotopic transplants by quantifying the number and size of micro-metastases. We observed a 15-fold reduction in the number of micro-metastases and a 16-fold reduction in metastatic area in mice with E-cadfl/fl tumors, relative to control (Fig. 2d; Extended Data Fig. 3d). This reduction in metastatic burden suggested a survival and proliferative defect. To exclude possible confounding by underrepresentation of E-cad- cells in the primary tumor, we confirmed this finding by injecting equal numbers of cells from adeno-Cre treated MMTV-PyMT; E-cad+/+ or E-cadfl/fl tumors into the tail veins of NSG mice (Fig. 2e). Mice injected with E-cadfl/fl clusters had a 10-fold reduction in E-cad- (mG+) metastases (Fig. 2f,g; Extended Data Fig. 4a,c). We next demonstrated that the mitotic fraction in metastases from tail vein assays was higher in control vs. E-cad- metastases (Fig. 2h). We did not observe differences in the dormancy marker NR2F19 based on E-cad status (Extended Data Fig. 8a) but cannot exclude other dormancy mechanisms. To further establish the requirement for E-cad in metastasis, we controlled for differences between donor mice, for effects of the immune microenvironment, and for possible cell non-autonomous effects of E-cad loss (Extended Data Fig. 4d–k,4l–n,5a–b, respectively). Across all contexts and in both orthotopic and tail vein assays, loss of E-cad increases invasion and reduces metastatic potential.
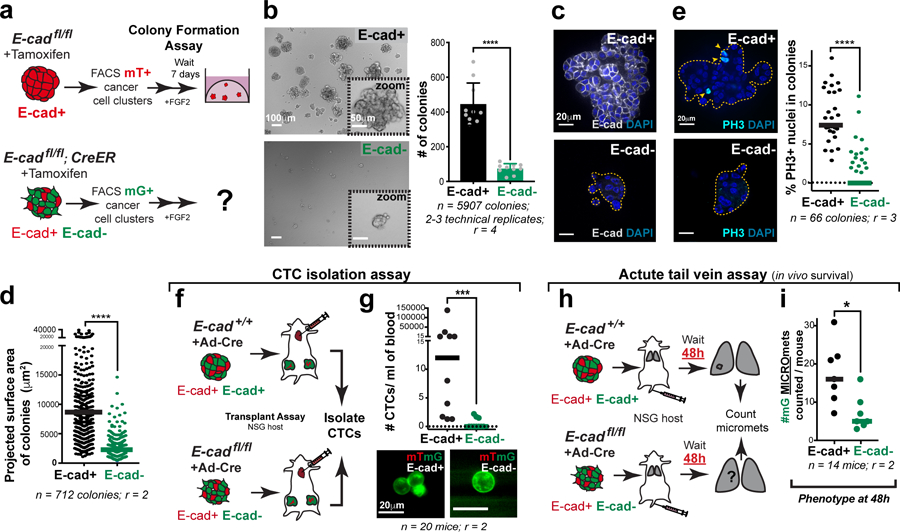
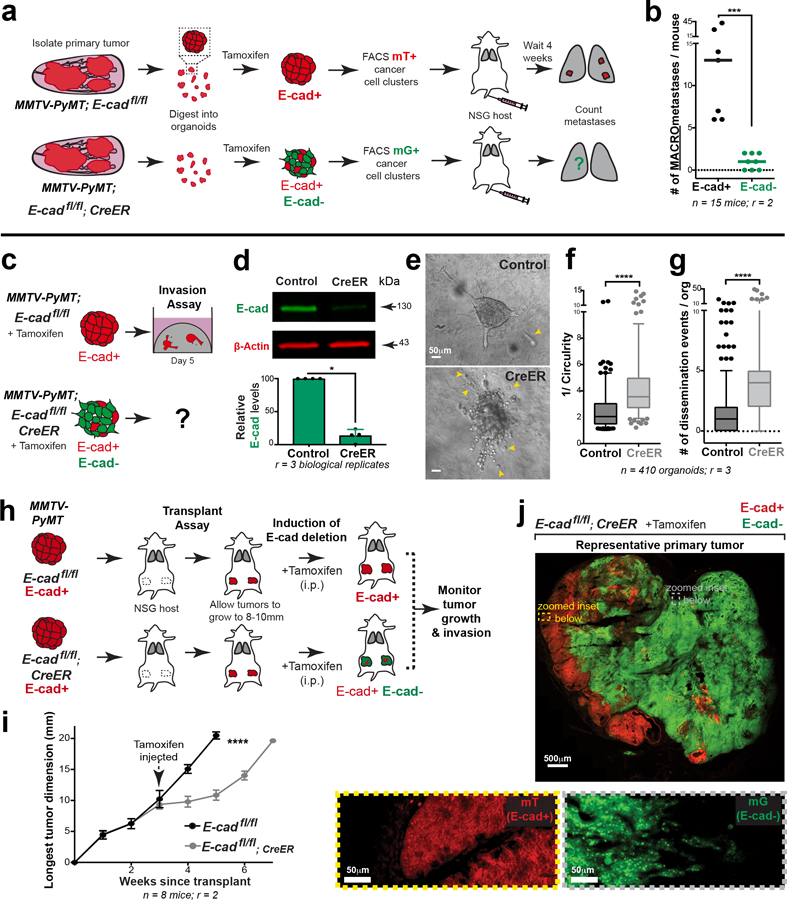
We dissected the mechanistic basis of the reduction in metastatic potential by developing a high-throughput 3D colony formation assay. To enable synchronous, non-viral E-cad deletion, we introduced a tamoxifen-regulated CreER allele into MMTV-PyMT tumor mice. The tamoxifen-induced model had phenotypes analogous to the adeno-Cre induced model, resulted in similar levels of E-cad deletion, increased invasion and dissemination into 3D collagen I, and reduced tumor growth and increased invasion in situ (Extended Data Fig. 5c–j). Comparing colonies grown from FACS sorted cancer cell clusters, E-cad loss resulted in a reduction of 5.5-fold in colony number, 4-fold in colony size, and 6-fold in mitotic fraction (Fig. 3a–e; Extended Data Fig. 7a–c).
Fig. 3: E-cad loss decreases colony formation.
a) Flow sorting strategy to isolate E-cad+ (mT+) or E-cad- (mG+) cancer cell clusters from MMTV-PyMT tumor mice. Colony formation potential was assessed after 7 days of culture in 3D Matrigel.
b) Left: Representative DIC micrographs of colonies arising from E-cad+ and E-cad- cancer cell clusters (scale bar, 100 μm), with zoomed insets for individual colonies (scale bar, 50 μm). Right: E-cad- cancer cell clusters have decreased colony forming potential. Mean +/− SD. ****p<0.0001 (Mann-Whitney test, two-sided).
c) Representative colonies stained for E-cad and DAPI. Scale bar, 20 μm.
d) Colonies arising from E-cad- cancer cell clusters are smaller than control colonies. Bar – median. ****p<0.0001 (Mann-Whitney, two-sided).
e) Left: Representative colonies stained for PH3 and DAPI. Arrowheads – PH3+ nuclei. Scale bar, 20 μm. Right: E-cad- colonies have a significantly lower %PH3+ nuclei. Bar – median. ****p <0.0001 (Mann-Whitney test, two-sided).
f) CTCs were isolated via cardiac puncture performed on NSG mice transplanted with adeno-Cre treated MMTV-PyMT E-cad+/+ or E-cadfl/fl organoids. CTC enumeration was performed based on the mT/mG reporting of E-cad status.
g) Top: There is a significant decrease in the number CTCs arising from E-cad- cancer cells. Bar – Median. ***p = 0.0005 (Mann-Whitney test, two-sided). Bottom: Representative images of E-cad+ and E-cad- CTCs. Scale bar, 20 μm.
h) Adeno-Cre transduced E-cad+/+ or E-cadfl/fl organoids isolated from MMTV-PyMT tumor mice were trypsinized into small clusters and injected via the tail vein of NSG mice. Lungs from these mice were harvested after 48 hours, sectioned, and examined for micro-metastases.
i) The number of mG+ micro-metastases in mice injected with adeno-Cre transduced E-cadfl/fl cancer cells were significantly lower than control, 48 hours post-injection. Bar – median. *p = 0.011 (Mann-Whitney test).
To test the role of E-cad in intravasation and survival in vivo, we quantified circulating tumor cell (CTC) numbers arising from E-cad+ or E-cad- tumors and the acute survival of E-cad+ or E-cad- cancer cells in the lungs. CTCs were isolated in an antigen-agnostic fashion in mice bearing large tumors resulting from transplantation of adeno-Cre treated MMTV-PyMT; E-cad+/+ or E-cadfl/fl organoids (Fig. 3f). Mice with E-cad- tumors had 7.5-fold fewer mG+ CTCs relative to mice with E-cad+ tumors (Fig. 3g). We cannot exclude that the underrepresentation of E-cad- cells in the primary tumor may contribute to this reduction in CTC number. To test the effect of E-cad on acute survival in distant organs, we injected adeno-Cre treated cancer cell clusters isolated from MMTV-PyMT; E-cad+/+ or E-cadfl/fl tumors into NSG mice and harvested the lungs two days later (Fig. 3h). The number of E-cad- micro-metastases was 3-fold lower at 48 hours (Fig. 3i). Taken together, our data reveal a requirement for E-cad in cell survival during systemic circulation and initial metastatic seeding.
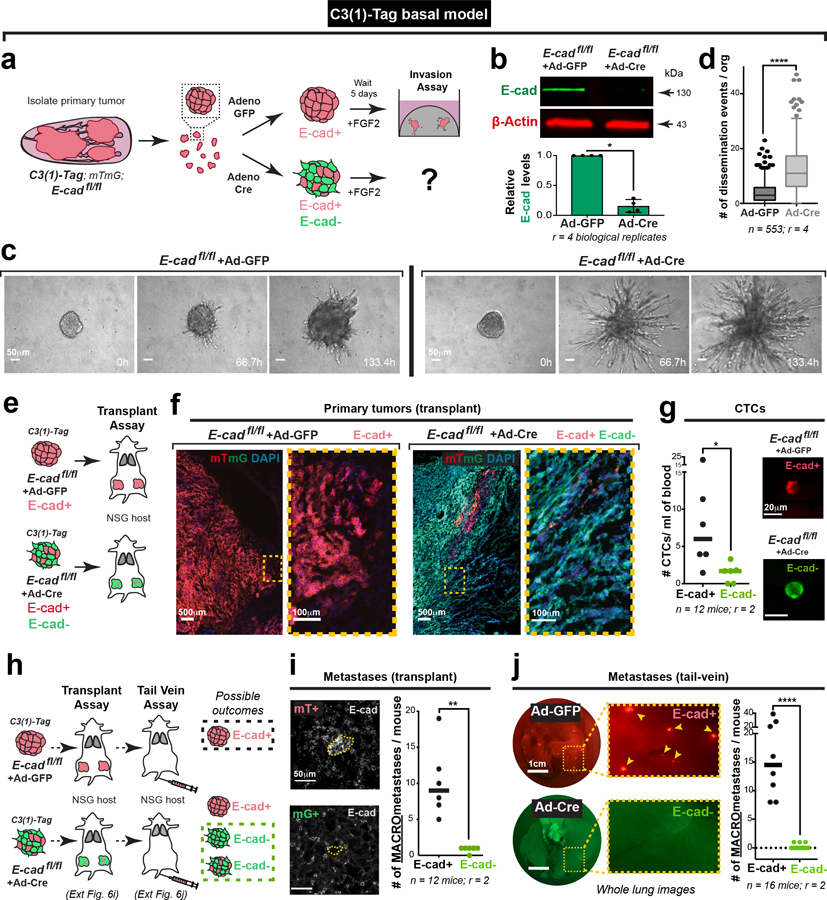
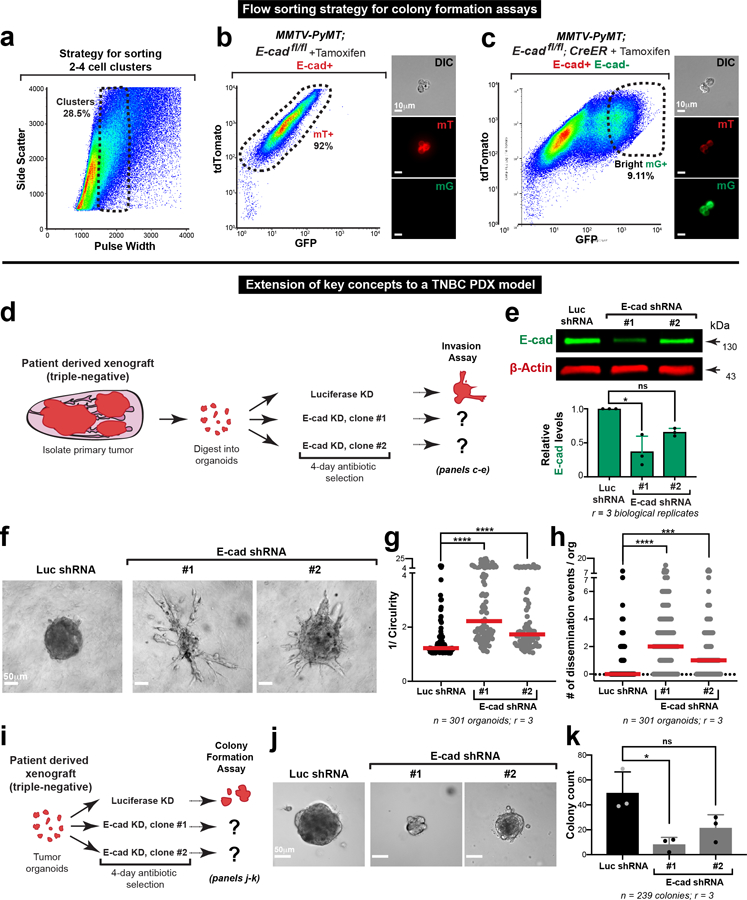
To test the generality of our conclusions, we introduced floxed E-cad alleles and a mTmG Cre reporter into a basal IDC model, C3(1)-Tag, and deleted E-cad with adeno-Cre (Extended Data Fig. 6a,b). Both in 3D organoid culture and in vivo, the C3(1)-Tag control retains E-cad and invades collectively, and loss of E-cad increased invasion and dissemination (Extended Data Fig. 6c–f; Supplemental Video 3,4). We next demonstrated a requirement for E-cad in metastasis of the basal C3(1)-Tag model, using both orthotopic and tail vein assays. (Extended Data Fig. 6h–j). As in the MMTV-PyMT model, we observed fewer mG+ CTCs in mice with E-cad- C3(1)-Tag tumors compared to CTCs in mice with control E-cad+ C3(1)-Tag tumors (Extended Data Fig. 6g). We next analyzed an E-cad+ patient-derived xenograft (PDX) model of triple negative IDC (Extended Data Fig. 7d). We used lentiviral shRNA to knockdown E-cad and observed increased invasion and dissemination into collagen I and decreased colony formation (Extended Data Fig. 7e–k). Our data reveal that in diverse IDC cancer models, loss of E-cad increases invasion but reduces metastatic potential
We next investigated the molecular basis of reduced metastatic potential. We compared the RNA-seq transcriptomes of adeno-Cre treated MMTV-PyMT; E-cad+/+ and E-cadfl/fl organoids and identified 127 differentially expressed (DE) genes at a stringent 5% family-wise error rate (0.05 FWER; Extended Data Fig. 8b,c). We did not observe significant differences in expression in canonical EMT transcripts, in N-cadherin10, or in other classical or desmosomal cadherins (Extended Data Fig. 3e). E-cad loss in MMTV-PyMT cancer cells therefore inhibits multiple stages of metastasis without complete loss of epithelial or complete gain of mesenchymal fate.
E-cad loss led to increased expression of Fgl1, Foxj1, and Bmp2, all genes whose expression is high in breast cancer patients with good prognosis11–13, and decreased expression of pro-metastatic and pro-inflammatory transcripts such as Il3314 and Stfa315 (Extended Data Fig. 8d). These findings support our concept of E-cad as a metastasis promoter. Furthermore, 35 of the 127 DE genes regulate apoptosis (Extended Data Fig. 8e; supplementary Table 1). Among the 35 DE apoptosis regulators, 24 of 26 promoters were upregulated and 6 of 9 inhibitors were downregulated. We characterized pathway-level changes using the Hallmark sets in MSigDB. We found a strong positive association of E-cad loss with apoptotic response and several stress-related pathways, including inflammatory response, TNFα signaling, UV response, and p53 pathway (supplementary Table 2). These transcriptional increases in apoptotic signaling and stress pathways following E-cad loss are consistent with E-cad’s role as a survival mediator16.
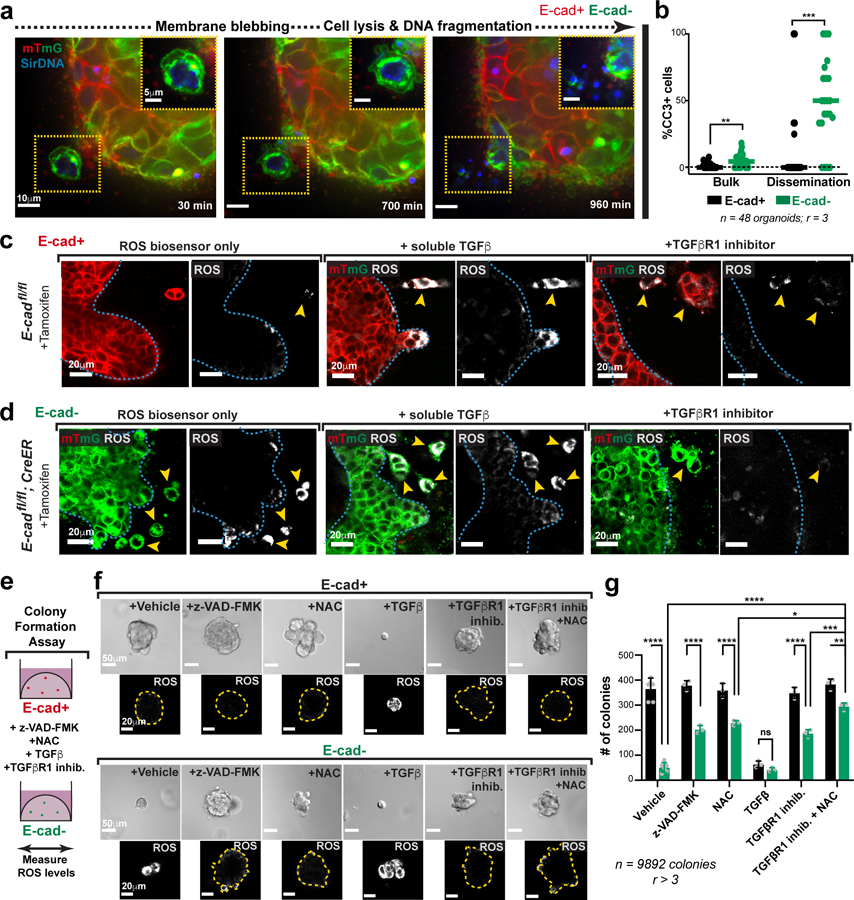
Morphological features and cleaved-caspase 3 (CC3) staining confirmed large increases in apoptosis in disseminating E-cad- cells in 3D culture (Fig. 4a,b; Extended Data Fig. 8f,g; Supplemental Video 5). We also detected elevated CC3+ staining in vivo, in the tumor bulk, invasion strands, and locally disseminated cells, and distant metastases of transplanted E-cad- MMTV-PyMT primary tumors (Extended Data Fig. 9a–e). We next demonstrated that inhibition of apoptosis (z-VAD-FMK) enhanced invasion and dissemination of E-cad- organoids in collagen I and colony formation of E-cad- clusters in Matrigel, with no effect on controls (Extended Data Fig. 10a–d, Fig. 4e–g). Consistent with a regulated induction of apoptosis, E-cad+ and E-cad- MMTV-PyMT cancer cells were similarly sensitive to chemotherapy (Extended Data Fig. 9f,g). Collectively, our data reveal that E-cad loss induces apoptotic signaling and cell death in this luminal IDC model.
Fig. 4: Disseminated E-cad- cells frequently undergo TGFβ-dependent ROS-mediated apoptosis.
a) An E-cad-negative cancer cell disseminating from an adeno-Cre transduced MMTV-PyMT; E-cadfl/fl organoid exhibits classical morphological features of apoptosis (scale bar, 10 μm), with zoomed insets for the disseminating cell (scale bar, 5 μm).
b) Relative proportions of apoptosis in E-cad+ or E-cad- cancer cells within the organoid bulk or disseminated cells. Bar – median; **p = 0.0016, ***p = 0.0004 (Mann-Whitney test, two-sided).
c–d) Representative images depicting ROS levels within tamoxifen-treated organoids isolated from MMTV-PyMT E-cadfl/fl (c) or E-cadfl/fl; CreER (d) tumors (scale bar, 20 μm). From left to right: organoids were treated with ROS biosensor only, biosensor in addition to soluble TGFβ (4nM) or TGFβR1 inhibitor (SB525334; 1μM). Observations were made across at least 3 independent E-cadfl/fl or E-cadfl/fl; CreER tumors.
e) The colony formation potential of E-cad+ or E-cad- cancer cells was tested in the presence of an apoptosis inhibitor (z-VAD-FMK), antioxidant (NAC), soluble TGFβ, or a TGFβ inhibitor.
f) Top: Representative DIC micrographs of colonies arising from E-cad+ or E-cad- cancer cells in the presence of z-VAD-FMK (100μm), NAC (1mM), TGFβ (4nM), TGFβR1 inhibitor (1μM), or combination of TGFβR1 and NAC. Scale bar, 50 μm. Bottom: Representative images depicting relative ROS levels within colonies (distinct from the corresponding top row). Yellow lines – colony boundaries. Scale bar, 20 μm.
g) Colony formation by E-cad- cancer cells is rescued by treatment with z-VAD-FMK, NAC or TGFβR1 inhibitor alone. NAC and TGFβR1 inhibitor also act together to provide a more complete rescue. Mean +/− SD. ****p<0.0001, ***p = 0.0003, **p = 0.002, *p = 0.046 by two-way ANOVA.
We next sought to identify how apoptosis is induced. Our analysis revealed enrichment of the TNFα17, TGFβ18, and p5319 pathways after E-cad loss; each can induce oxidative stress and reactive oxygen species (ROS) has been shown to regulate metastasis20. We therefore hypothesized that detachment could induce ROS accumulation. To test this hypothesis, we cultured MMTV-PyMT; E-cadfl/fl organoids +/− CreER in the presence of CellROX, a dye whose intensity serves as a surrogate for cellular ROS abundance. Relative to the organoid bulk, detached E-cad+ cells showed a ~2.5-fold ROS increase and detached E-cad- cells show a ~7-fold ROS increase (Fig. 4c,d; Extended Data Fig. 8h). Our data reveal that local dissemination is intrinsically stressful and E-cad limits ROS levels.
Enrichment of ROS suggests that oxidative stress increases apoptosis and decreases metastasis. In our ex vivo colony forming assay, E-cad+ colonies had undetectable ROS, while E-cad- colonies had high ROS (Fig. 4e,f). We then assayed the effects of an anti-oxidant, N-acetyl cysteine (NAC)21. NAC had no significant effect on dissemination of control or E-cad- cells into collagen I. However, NAC rescued colony formation in E-cad- cells with no effect on control cells (Fig. 4f,g; Extended Data Fig. 10e,f). Our data reveal that E-cad loss increases ROS levels, and that antioxidants rescue the colony forming potential of E-cad- cancer cells.
We hypothesized that TGFβ signaling was a “master regulator” of the diverse phenotypes following E-cad loss, as it can promote invasion, inhibit proliferation, regulate apoptosis, and increase oxidative stress22,23. Consistent with our hypothesis, RNA-seq revealed increased TGFβ signaling after E-cad loss, including increases in BMP2, BMP4, and ID3 (supplementary Table 2). At the protein level, control cells had cytoplasmic SMAD2/3, while E-cad- cells exhibited nuclear SMAD2/3 (Extended Data Fig. 8i). In collagen I invasion assays, TGFβ1 increased dissemination of both E-cad+ and E-cad- cells, while inhibition of TGFβR1 blocked dissemination (Extended Data Fig. 10e–f). Furthermore, TGFβ1 increased ROS levels in control cells during dissemination but did not affect ROS levels in E-cad- cells (Fig. 4c,d). Conversely, TGFβR1 inhibition prevented ROS enrichment in locally disseminated E-cad- cells (Fig. 4c–d). We next manipulated TGFβ signaling during colony formation in Matrigel. TGFβ1 decreased the number and size of colonies from both E-cad+ and E-cad- cancer cells and increased ROS in the E-cad+ colonies (Fig. 4f,g). In contrast, TGFβR1 inhibition was sufficient to rescue colony formation by E-cad- clusters (Fig. 4f,g). Combined NAC addition and TGFβR1 inhibition increased the extent of rescue (Fig. 4f,g). E-cad loss therefore triggers TGFβ signaling-dependent ROS enrichment in locally disseminated cancer cells, leading to apoptosis and decreased colony formation.
We next validated the role of ROS in limiting metastasis following E-cad loss in vivo. We focused on NAC treatment, as TGFβR1 has multiple functions and apoptosis inhibition would not be specific. Accordingly, we isolated organoids from MMTV-PyMT; E-cadfl/fl mice, treated with adeno-Cre or adeno-GFP, digested to clusters, incubated with 1 mM NAC for 24 hours, then injected into the tail veins of NSG mice. We assayed micro-metastases at 48 hours to measure of survival and seeding and at 1 week to assay proliferation and outgrowth (Extended Data Fig. 10g). We observed complete rescue at 48 hours and substantial rescue at one week, without NAC supplementation (Extended Data Fig. 10h–i). We conclude that ROS dependent cell death limits the metastatic potential of E-cad- cells during seeding and metastatic outgrowth in vivo.
In this study, we have demonstrated that E-cad functions as an invasion suppressor, survival factor, and metastasis promoter in diverse models of IDC. This result was surprising, as loss of E-cad has been proposed as a trigger for both invasion and metastasis1. However, clinical evidence supports the concept of metastasis from E-cad+ tumors in inflammatory breast cancer24, IDC of the breast25, ovarian cancer26, and colorectal cancer27. Interestingly, loss of E-cad did not induce broad mesenchymal gene expression, consistent with the clinical data that E-cad- invasive lobular carcinoma cells retain epithelial identity28. However, E-cad dependent metastasis could still involve EMT transcription factors29, E-cad protein level dynamics30, or a partial/hybrid EMT state31. The tumor microenvironment may also reinforce epithelial identity in E-cad- cancer cells32.
Our data support the concept of metastasis as a complex, multi-step process in which invasion is not necessarily rate-limiting8,33. The combination of increased invasive and death signals following E-cad loss leads us to speculate that collective invasion and epithelial metastasis represent a compromise between migration and survival. This balance may be particularly important during systemic dissemination and early seeding, with E-cad critical for limiting ROS and apoptosis. Finally, our data reveal a context dependent role for E-cad in promoting metastasis in IDC and suppressing metastasis in invasive lobular carcinoma1,2. Our studies suggest that E-cad mediated survival signaling could be a therapeutic target for IDC patients.
METHODS
Further information about experiments and requests for reagents should be directed to, and will be fulfilled by, the Lead Contact, Andrew J. Ewald (andrew.ewald@jhmi.edu).
Mice
All mouse husbandry, procedures performed, and assay endpoints were in accordance with protocols approved by the Johns Hopkins Medical Institute Animal Care and Use Committee (ACUC). All mice were female and were backcrossed and maintained on the FVB/n background. MMTV-PyMT34, C3(1)-Tag35, mT/mG36, E-cadfl/fl 37 mice were obtained from the Jackson Laboratories. The R26::Cre-ER mouse line38 was a gift from J. Nathans (Johns Hopkins University, Baltimore, MD). The triple negative PDX model of invasive ductal carcinoma used in this study was obtained from Jackson Laboratories (#TNM00089) and was passaged subcutaneously in NSG mice. In all experiments involving tumor mice, mice were sacrificed when the maximum tumor diameter was 20 mm or less, consistent with out ACUC approved protocol limit of 20 mm. For in vivo experiments, littermates were randomized into different treatment groups and no statistical tests were used to predetermine sample size because the direction and magnitude of effect was unknown. Lung metastasis and CTC enumeration for transplant experiments were blinded for treatment group.
Isolation and 3D culture of primary mammary tumor organoids
We performed 3D invasion assays using primary tumor organotypic culture, as previously described5,6. We harvest 15–20 mm mammary tumors from 10–12-week-old mice MMTV-PyMT mice or 22–25-week-old C3(1)-Tag mice, mechanically disrupt with a scalpel, and enzymatically digest on a shaker (180 RPMs, 37° C, 60 minutes) in the presence of a collagenase solution (DMEM-F12 (Gibco, #10565–018), 2 mg/mL collagenase (Sigma, #C2139), 2 mg/mL trypsin (Gibco, #27250–018), 5% FBS (Sigma, #F0926), 5 μg/mL insulin (Sigma, #I9278), and 50 μg/mL gentamycin (Gibco, #15750)). Digested tumors were centrifuged at 400 g for 10 minutes, then treated with 2 U/μl DNase (Sigma, #D4263). This was followed by 4 differential centrifugations (400 g, 3 seconds) to separate the epithelial cell clusters from stromal cells. Smaller cell clusters (100–200 cells each) were then enriched using a differential centrifugation at a lower speed (150 g, 3 seconds). Organoids were embedded at a density of 1.5 organoids/μL into neutralized, fibrillar rat-tail collagen I (Corning, #354236), into 24-well glass bottomed plates, on a 37° C heating block. Collagen gels were allowed to polymerize at 37° C for about an hour, after which organoid media (DMEM-F12 (Gibco, #10565–018), 1% insulin-transferrin-selenium (Gibco, #51500–056), 1% penicillin-streptomycin (Sigma, #P4333), and 2.4 nM FGF2 (Sigma, #F0291)) was added to the wells. Tumor organoids invade into collagen I over a period of 24–48 hours (for further details39).
Organoids were isolated from PDX tumors using similar methods. The collagenase solution contained RPMI (Gibco, #11875–085), 2 mg/mL collagenase (Sigma, C2139), 5% FBS (Sigma, #F0926), 1% penicillin-streptomycin (Sigma, P4333), and HEPES (Gibco, #15630–080). Tumor organoids were cultured in the presence of human organoid growth media (DMEM (Sigma, #D6546), 2 mM GlutaMAX (ThermoFischer, #35050–061), 1% penicillin-streptomycin (Sigma, #P4333), HEPES (Gibco, #15630–080), 0.1% BSA (Sigma, #A9576), 10 ng/mL cholera toxin (Sigma, #C8052), 0.5 μg/ml hydrocortisone (Sigma, #H4001), 5 μg/mL insulin (Sigma, #I9278), 5 μg/mL EGF (Sigma, #E9644)).
Deletion of E-cad in mammary tumor organoids
(1) Adenoviral delivery of Cre recombinase
Prior to embedding in collagen I, freshly isolated MMTV-PyMT organoids were infected with adeno-Cre (Vector BioLabs, 1045) at an MOI of ~107 per 800 organoids. Infection was carried out in suspension, in 50 μL of DMEM-F12 overnight at 37° C. This typically yielded a recombination efficiency of 75–85%. Similar methods were followed for E-cad knockout in C3(1)-Tag tumor organoids. In this case, control organoids were treated with adeno-GFP (Vector BioLabs, 1060) using identical conditions.
(2) Tamoxifen induced Cre expression
Organoids isolated from E-cadfl/fl; CreER; MMTV-PyMT mice were embedded in collagen I, and 50 nM of 4-hydroxytamoxifen (Sigma, H7904) was added to the organoid media for 48 hours. Tamoxifen was washed out by a 10-minute incubation with PBS, and organoids were subsequently cultured with FGF2-containing organoid media.
Protein isolation
Organoids cultured in collagen I were extracted from the gel by a 10 minute incubation on a benchtop shaker at 180 RPM (37° C) with 2 mg/mL collagenase in PBS. This solution was then transferred into an ice-cold Eppendorf tube and centrifuged for 5 minutes at 400 g at 4° C. Excess media from the pellet was washed off 2X using ice-cold PBS. Organoids were then resuspended in <50 ml of ice-cold lysis buffer, vortexed, and left on ice for 30 minutes. Lysis buffer was made fresh, using 142.8 μL of 7X protease inhibitor stock (2 CompleteMini tablets (Sigma, 11836153001), 2 PhosphoSTOP tablets (Sigma, 4906837001), and 2.856 mL dH2O), 100 μL of RIPA buffer (Millipore, 20–188), 50 μL of glycerol (Sigma, G5516), 10 μL of 10% SDS (Sigma, L3771), 697.2 μL of dH2O. The samples were centrifuged for 10 minutes at 18000 g (4° C). The supernatants were then transferred into new, cold Eppendorf tubes and stored at −80° C.
Western Blotting
Whole cell protein lysates were thawed on ice for 30 minutes before use. The amount of protein in each sample was quantified using a standard BCA assay kit (Thermo Fisher Scientific, 23225). Equal protein amounts were loaded, with Laemmli sample buffer (BioRad, 1610747) and β-mercaptoethanol, in 4–15% Mini-PROTEAN pre-cast gels (BioRad, 456–1084). SDS-PAGE was performed at 200 V for 30–40 minutes, or until the dye front had just run off the gel. Gels were transferred onto PVDF membranes (Millipore, IPFL07820) at 100 V for 1 hour at 4° C. Membranes were then blocked with Odyssey blocking buffer (Licor, 92750000) for 1 hour at room temperature. Primary antibodies were diluted at 1:1000 into a 1:1 mixture of blocking antibody and TBS-T (TBS + 0.2% Tween (Millipore, P7949)). Primary antibodies used in the study included rat anti-E-cadherin (Life Technologies, 13–1900), rabbit anti-αE-catenin (Cell Signaling, 3236), rabbit anti-β-catenin (Cell Signaling, 8480), mouse anti-β-actin (Sigma, A5441), rabbit anti-β-actin (Sigma, A2103). Membranes were washed 3 times with 0.1% TBST and then incubated with secondary antibodies, diluted at 1:10,000, for 1 hour at room temperature. Secondary antibodies used included anti-Rat IRDye 800CW (Licor, 925–32219), anti-mouse IRDye 680RD (Licor, 925–68070), anti-rabbit IRDye 800CW (Licor, 925–32211). Membranes were washed 3 times, for 5 minutes each, using 0.1% TBS-T. Membranes were scanned using the Odyssey CLx imaging system. Band intensities were quantified using ImageJ.
Immunofluorescence
Organoids cultured in 3D collagen I were fixed using 4% paraformaldehyde (PFA; Electron Microscopy Sciences, 15714S), while colonies in Matrigel were fixed using 2% PFA for 10 mins. Residual formaldehyde was washed two times in PBS. The gels were permeabilized using 0.5% TritonX-100 (Sigma, X100) for 30 minutes at room temperature. Samples were blocked for 2 hours with 10% FBS/1% BSA/PBS at room temperature, incubated with primary antibodies diluted in 1% FBS/1% BSA/0.2% TritonX/ PBS overnight at 4° C, then washed three times for 10 mins each using PBS. Secondary antibodies were added diluted in 1% FBS/1% BSA/0.2% TritonX/ PBS and incubated for 3 hours at room temperature. Samples were washed three times with PBS and stored at 4° C until imaged.
Primary tumors harvested from transplant experiments were fixed in 4% PFA for 4 hours at 4° C; lungs from transplant or tail vein experiments were fixed in 1% PFA for 4 hours at 4° C. Fixed tumors and lungs were transferred into 25% sucrose/PBS overnight at 4°C, embedded into Optimal Cutting Temperature (OCT) compound, and frozen at −80° C. Sections (50 μm thickness) were cut onto Superfrost Plus Gold Microscope slides (Thermo Fisher Scientific, 15-188-48) at −20° C using a cryostat. The OCT was removed from these slides by incubating in PBS for 1 hour at room temperature. The sections were otherwise processed and stained identical to 3D gel-embedded organoids.
Immunofluorescence for all antibodies was performed for at least 3 independent experiments, each consisting of at least ~15–20 organoids/ metastases/ tumor sections Primary antibodies used in the studies include rabbit anti-E-cadherin (1:100; Cell Signaling, 3195), mouse anti-β-catenin (1:200; Cell Signaling, 2677), rabbit anti-pancytokeratin (1:200; Abcam, ab9377), rabbit anti-phoshohistone-H3 (1:250; Cell Signaling, 9701), rabbit anti-keratin14 (1:250; Biolegend, 905301), SMAD2/3 (1:400; Cell Signaling, 8685), Vimentin (1:250; Cell Signaling, 5741), and DAPI (1:1000; Invitrogen, D571). All secondary antibodies used were AlexaFluor-conjugates (1:200; Invitrogen). The CellROX® Deep Red reagent, 5 μM (Life Technologies, C10422) was used to measure oxidative stress within the cells.
Orthotopic transplantation of mammary tumor organoids
Orthotopic transplantations were performed on 3-week old, female, NOD-SCID gamma mice in a sterile hood. Freshly isolated organoids from E-cad+/+ or E-cadfl/fl MMTV-PyMT tumors were transduced with adeno-Cre overnight and washed twice with DMEM-F12. Organoids were re-suspended in a 50:50 DMEM: Matrigel (Corning, 354230) at a density of 2 organoids/μL. Host mice were anesthetized with 2.5% isofluorane and immobilized on a sterile surface. The incision site was wiped with ethanol. The first incision of ~0.5 cm was made along the mid-line, and the second, about the same size, was made at a 60 angle towards the lower limbs of the mouse. The skin was then retracted to expose the #4 mammary glands. The region of the mammary gland proximal to the lymph node was excised. Approximately ~50 organoids loaded into a microsyringe (Hamilton, 702RN-7636–01, custom made 1-inch needles, 26-gauge) were injected into the residual gland. Approximately 10 μL of 0.25% bupivicane (Sigma, B5274) was applied at this site. The same procedure was repeated for the contralateral mammary gland. The wounds were closed using 9-mm autoclips (BD Biosciences, 427631), and triple antibiotic ointment was applied. Primary tumors and lungs were harvested from these mice 6–8 weeks post-transplantation. Lungs were examined for macro-metastases under the dissection microscope using mT and mG fluorescence. Micro-metastases were counted after the lungs were sectioned and scanned under a confocal microscope at single cell resolution. For C3(1)-Tag experiments, organoids isolated from E-cadfl/fl mice were treated with adeno-GFP (control) or adeno-Cre (E-cad deleted) prior to transplantation. To perform E-cad deletion in situ, we injected 100 μL of 10 mg/mL tamoxifen (Sigma, #T5648) intraperitoneally. Tumor diameters were measured bi-weekly using calipers, and mice were harvested when maximum tumor diameter reached 20 mm.
Tail vein injection: experimental metastasis assay
Adeno-Cre transduced E-cad+/+ or E-cadfl/fl organoids were trypsinized into small cell clusters using ~10–15 minutes incubation with TrypLE (Thermo Fisher, 12604013) at 37° C. Cells were resuspended in DMEM-F12 at a concentration of 106 cells/mL. Host NSG mice for these experiments were 6–8-week-old female mice. The tail veins of these mice were dilated by exposure to a heat lamp for ~4–5 minutes. Using a 26.5-gauge needle, 200 μL of cells were injected via the tail vein of the mouse. Lungs from these mice were collected 4 weeks from the date of injection and examined for macro-metastases.
For C3(1)-Tag experiments, organoids isolated from E-cadfl/fl mice were treated with adeno-GFP (control) or adeno-Cre (E-cad deleted) prior to trypsinization and tail vein injections. For acute tail vein assays, the same procedure was performed, and equal numbers of cells were injected. However, the lungs of mice were harvested 48 hours post-injection and analyzed for the presence of micro-metastases at single-cell resolution. For NAC-mediated rescue experiments (Extended Data Fig. 10g–i), organoids were isolated from MMTV-PyMT; E-cadfl/fl tumors, treated with adeno-GFP or adeno-Cre overnight and then trypsinized into small cell clusters. These cancer cell clusters were incubated with 1 mM NAC for 24 hours in a non-adherent 96-well plate (30,000 clusters per well). Prior to tail vein injections into NSG mice, cancer cell clusters were passed through a 10 μm filter to get rid of larger cell aggregates and resuspended in DMEME-F12 at a concentration of 106 cells/mL. Lungs from these mice were harvested at 48 hours or 1-week post-injection and the number of micro- and macro-metastases counted respectively.
Isolation of circulating tumor cells
Enumeration of circulating tumor cells was performed following orthotopic transplantation of (1) adeno-Cre transduced MMTV-PyMT; E-cad+/+ or E-cadfl/fl organoids, and (2) adeno-GFP or adeno-Cre transduced C3(1)-Tag organoids. In all cases, once the largest tumor diameter was 20 mm, 400–800 μL of blood was collected via cardiac puncture using a 26.5-gauge needle attached to a 1 mL syringe. The blood was collected directly into K2-EDTA tubes (BD Biosciences, #365974). For every 1 mL volume of blood, 176 μL of ACD-A (BD Biosciences, #364606) and 0.5 μg/mL of Tirofiban (Sigma, #30165) was added. The tubes were placed in the dark, on ice, and shipped to the University of Basel, Switzerland for CTC isolation. CTCs extraction was performed 48–72 hours post blood collection. Briefly, after addition of 7.5 μL of 0.5 M EDTA/ml of mouse blood samples were processed through the Parsortix microfluidic device (ANGLE plc) using the Cell Separation Cassettes (ANGLE, #GEN3D6.5). Cassettes were then scanned at 20x magnification in green and red channels. The number of captured mTomato+ or mGFP+ CTCs were reported for each sample (blinded for E-cad+ or E-cad- status). Representative pictures were taken at 40x magnification with Leica DMI4000 fluorescent microscope.
Colony formation assay
We isolated organoids, used tamoxifen to induce mosaic E-cad deletion, and then washed two times using PBS without Ca2+ or Mg2+. The organoids were trypsinized to small cell clusters by incubating with TrypLE for 10–15 minutes at 37° C. Cells were resuspended in PBS (-Ca2+, -Mg2+), filtered through a 40 μm filter, cell number estimated, and resuspended again at a density of 2×10⁶ cells/mL. The cell populations were then analyzed on a Beckman-Coulter MoFlo Cytometer. Cells were sorted for the expression of mT/ mG. Additional gating was performed to sort populations with higher forward and side scatter, corresponding to 2–4 cell clusters. The nozzle size for sorting clusters was 100 μm. Dead cells were excluded in the analysis by gating cells that stained negative for propidium iodide. Cells were sorted into organoid media and were resuspended in Matrigel and cultured in 24-well plates with FGF2-containing organoid media, supplemented with 50 nM of tamoxifen, for 7 days. The number of colonies formed in each well was assessed using a bright-field microscope. Small molecule and protein reagents used in this study included: an apoptosis inhibitor (z-VAD-FMK, SelleckChem S7023), a TGFbR1 inhibitor (SB525334; SelleckChem S1476), N-acetyl cysteine (Sigma, A7250), and soluble TGFβ1 (PeptoTech 100–21).
Lentiviral knockdown of E-cad in PDX-derived organoids
Approximately 1000 tumor organoids isolated from a PDX tumor were resuspended in 200 μL of basal human organoid growth medium and added to a single non-adherent 96-well microplate. Organoids were allowed to settle to the bottom of the plate for 30 mins at 37° C. Lentiviral transduction particles (MISSION pLKO.1-puro (1) Luciferase shRNA (108 TU/ml; SHC007V; Sigma-Aldrich); (2) Cdh1 shRNA #1 (108 TU/ml; TRCN0000042581; Sigma-Aldrich); (3) Cdh1 shRNA #2 (108 TU/ml; TRCN0000042578; Sigma-Aldrich) were thawed on ice. Virus particles at a MOI=10 along with 3 μL of ViroMag R/L (OZ Bioscience, #RL40200) nanoparticles were mixed up to a total volume of 50 μL and incubated at room temperature for 30 mins. In the 96-well microplate, 175 μL of organoid media was carefully removed and replaced with 50 μL of the virus-containing solution. The organoid suspension was carefully mixed, and the plate was placed on a magnetic plate (OZ Biosciences, # MF10000) for 90 minutes at 37° C. The next day, ~70 μL of media was replaced with 150 μL of fresh human organoid media was added. After 48 hours, ~150 μL of media was replaced with 5μg/mL puromycin-containing (Gibco, #A1113803) human organoid media. After selection for 4 days, organoids were collected, and downstream assays were performed as described above.
Luciferase shRNA:
CCGGCGCTGAGTACTTCGAAATGTCCTCGAGGACATTTCGAAGTACTCAGCGTTTTT
Cdh1 shRNA #1:
CCGGCCGAGAGAGTTACCCTACATACTCGAGTATGTAGGGTAACTCTCTCGGTTTTTG
Cdh1 shRNA #2:
CCGGGCTGGAATCTTTGTCCATGTACTCGAGTACATGGACAAAGATTCCAGCTTTTTG
Differential Interference Contrast (DIC) and Confocal Microscopy
DIC imaging was performed using a LD Plan-Neofluar 20x/0.4 Korr Ph2 objective lens, a Zeiss AxioObserver Z1, and an AxioCam MRM camera. DIC time-lapse movies were collected with 20-minute acquisition intervals for ~5 days, maintaining temperature at 37° C and 5% CO2. Confocal imaging was conducted on either a Zeiss 780 laser scanning confocal microscope, or on a spinning disk microscope (Solamere Technology Group Inc.) with a XR/MEGA-10 S30 camera (Stanford Photonics, Inc.). An LD C-Apochromat 40x/1.1 objective was used for time-lapse acquisition and high-resolution imaging. For confocal movies, the nuclei of all cells within the organoids are labeled using Sir-DNA (Cytoskeleton; CY-SC007). Images were collected every 20 minutes for 1–2 days at standard incubation conditions. ImageJ was used to adjust levels and gamma for images to maximize clarity, place scale bars, and export as TIFFs.
High throughput RNA-sequencing and gene-set analysis
For each replicate, adeno-Cre treated E-cad+/+ or E-cadfl/fl organoids were cultured in 3D collagen I for 48 hours. The gels were then snap-frozen, and total RNA was extracted using RNeasy (Qiagen, 74104). The sequencing library was prepared using the TruSeq Stranded mRNA Sample Kit (Illumina, RS-122–2101). Briefly, about 400 ng of total RNA isolated per sample was converted to double-stranded cDNA, end-repaired, A-tailed, and ligated with Illumina indexed adapters. The PCR amplified library was purified using Agencourt RNAClean XP (Beckman Coulter, A63987) magnetic beads and run out on Agilent High Sensitivity DNA Chip for quality check. The library was then sequenced in a paired-end 76bp cycle using NextSeq 500.
We used Ensembl version 89 to obtain the mouse genome in FASTA format (GRCm38) and gene models in gff. Indices for bowtie2 were built from the genome index using bowtie2-build and tophat240,41. The raw RNA-seq paired-end reads were aligned to the genome using the default options (--no-novel-juncs -T -p 8) in the Bowtie2-Tophat2 pipeline41. The resulting bam files for accepted hits generated by tophat2 for each sample were then used to count reads mapping to individual genes using HTseq with standard options42 (-s reverse).
Differential expression was estimated using DESeq243. Because the adeno-Cre treatments generated mosaic organoids with varying fractions of E-cad+ and E-cad- cells, we used a linear model for correlation with E-cad (Cdh1) expression as a quantitative phenotype, as done previously44. Cdh1 counts in reads-per-million were scaled linearly to have mean = 1 in the control samples and mean = 0 in the adeno-Cre treated samples. We then computed significance for a linear model including an intercept term and the scaled Cdh1 value as the design matrix. Note that using the unscaled Cdh1 reads-per-million values provides nearly identical p-values for most genes but introduces numerical error because the intercept term in the design matrix (=1) is much smaller than the unscaled reads-per-million (~100–200). We used standard DESeq2 parameters to exclude genes with no reads and for genes with outlying read counts in individual samples; these genes had p-values set to the nominal value of 1. False-discovery rate calculations excluded these genes, as well as genes with 10 or fewer total reads; the number of tested genes was 22418.
Gene set analysis used sets provided by MSigDB45, and was restricted to the 22418 genes with sufficient data for analysis. Mouse genes were mapped to human orthologs for consistency with MSigDB gene symbols. A z-score was calculated for each gene as abs(qnorm(pval/2)) * sign(log2FoldChange), the z-score for the corresponding p-value of a two-tailed test with a sign consistent with the observed direction. For each set, we then performed a t-test for the one-sided hypothesis that the mean of absolute values of z-scores were larger for genes inside vs. outside the set; this test maintains power when sets contain balanced numbers of activators and repressors.
The scaled counts were log transformed as log(1+x) to avoid undefined values. For each gene and sample, a z-score was estimated by subtracting the mean and dividing by the standard deviation of the log transformed data. Visualizations of subsets of genes, for example canonical EMT genes, use the calculations from the entire data set rather than just the subset depicted.
Statistical analysis
Figure legends describe the statistical test used for each experiment and other parameters associated with the representation of the data. Details of the RNA-seq analyses are located in the Methods section.
Quantification of invasion and dissemination of organoids
Invasion of organoids was quantified using ImageJ to outline the organoid and calculate a shape descriptor termed the form factor, defined as the ratio of the square of the perimeter to 4π times the area. A circle, which has the maximum area for a given perimeter, has a form factor of 1; organoid with multiple invasive strands have much higher form factors. Invasion in Fig. 1d and Extended Data Fig. 4f, 5f, 7g, 10c is quantified as the form factor.
In Fig. 1e and Extended Data Fig. 4g, 5g, 6c, 7h, 10d,f, dissemination events are counted as separate units (single or clusters of cells) using DIC images collected at the end of 5 days of culture in collagen I. In Fig. 1g,h dissemination was quantified as cell units completely disseminated, in at least 30 μm along the z-plane, from the bulk of the organoid.
In Extended Data Fig. 2a–c, migration kinetics were performed on cells (or clusters of cells) that are completely disseminated from the organoid bulk and remain so for at least 100 time-frames (=2000 minutes). The position of the cell is tracked manually for every timepoint until the cell is outside the imaging frame and/ or there is a large shift in x/y due to refocusing of the organoid. Persistence and displacement measurements were estimated using the ImageJ plugin, MTrackJ (https://imagescience.org/meijering/software/mtrackj).
Counting macro- and micro-metastases
Macro-metastases were counted based on expression of mT/ mG fluorophores under the dissection microscope. Based on their size, we estimated these metastases to have >250 cells. Representative images in Fig. 2f and Extended Data Fig. 6j were collected using an iPhone 7. Micro-metastases were counted under a confocal microscope, using a 20X objective, at single cell resolution. Any metastasis that did not fit a single imaging frame at 20X, 1.5x zoom was excluded from micro-metastasis counting to limit double-scoring in the macro- and micro-metastasis categories. Metastases arising from E-cad+/+ donor tissue were always E-cad+. Metastases that arose from E-cadfl/fl donor tissue and consisted exclusively of mT+ cells were scored as E-cad+. Metastases that were all mG+ or that contained even a single mG+ cell were scored as E-cad- for the purposes of quantification. For Figure 2d, we separately analyzed whether micro-metastases were single cell or multicellular, based on mG membrane staining. We observed that 4 of the 266 mG+ control micro-metastases were single cells (1.5%) and 1 of the 28 mG+ E-cad- micro-metastases were single cells (3.6%). Because we were analyzing at 20x, 1.5x zoom in thick cryosections (50–60 μm), we now had a much greater ability to identify multicellular metastases than in 3–10 μm paraffin sections or at 10x, as we had done in previous analyses44.
mT/mG composition of primary tumors
Montages of primary tumors from transplant mice were collected at low magnification using a Zeiss LSM780 confocal microscope. An ImageJ script44 was used to extract the percent of green pixels (%mG) within the image.
Identifying transcripts that regulate apoptosis
All differential transcripts at FWER = 0.05 (p < 1.7 E-6) were searched on Google Scholar for their role in regulating apoptosis in cancer. Transcripts that promoted apoptosis are represented in Extended Data Fig. 8e (red dots). PMIDs of corresponding articles are listed in supplementary Table 1.
Extended Data
Extended Data Fig. 1: E-cad expression is retained during several intermediate stages of metastasis.
a) E-cad expression is determined by immunofluorescence at various stages of metastasis following orthotopic transplantation of MMTV-PyMT; mTmG tumor organoids into NSG host mice. Observations described in this figure were made across at least 3 independent MMTV-PyMT tumors.
b) Tumor organoids embedded in Collagen I express membrane-localized E-cad. Scale bar, 50 μm.
c) Representative tile-scan showing E-cad expression within a tumor section. Scale bar, 500 μm. Three selected regions within the tumor (yellow boxes; scale bar, 20 μm) express high levels of membrane-localized E-cad.
d–g) E-cad is also expressed in invasion strands (d), locally disseminated units (e), intravasated units (f), and distant metastases (g) in vivo. Scale bar, 50 μm. Arrowhead – disseminated unit (e) or intravasated unit (f). Yellow box in panel (f) marked a zoomed inset.
Extended Data Fig. 2: E-cad loss decreases migratory persistence ex vivo and increases invasion in vivo.
a) E-cad+ or E-cad- cells from adeno-Cre treated MMTV-PyMT; E-cad+/+ or E-cadfl/fl organoids respectively were manually tracked as they migrated within collagen I. Cell tracks – blue lines; circles – last tracked position of the cell at that time-point. Scale bar, 50 μm.
b–c) Disseminating E-cad- cancer cells exhibit decreased migratory persistence (b) and displacement (c) relative to E-cad+ cells. Bar – median. ****p <0.0001, *p = 0.027 (Mann-Whitney test, two-sided).
d) Adeno-Cre transduced MMTV-PyMT; E-cad+/+ or E-cadfl/fl organoids were transplanted into cleared mammary fat pads of immunocompromised NSG mice. Tumors sizes were monitored bi-weekly and harvested after ~6 weeks.
e) Tumors arising from E-cadfl/fl organoids were smaller than those arising from control organoids. Mean +/− SEM. ****p <0.0001 (regression analysis).
f) Representative micrographs of primary tumors arising from E-cad+/+ or E-cadfl/fl donor tissue. Scale bar, 500 μm. Control tumors have relatively similar amounts of mT+ and mG+ cancer cells. In contrast, mG+ (Cre+, E-cad-) cancer cells constitute <10% of E-cadfl/fl tumors. Mean +/− SEM. ****p <0.0001 (Kruskal-Wallis test).
g) Left: Representative tile-scan of a primary tumor arising from control organoids. Right: ~94% of the tumor border exhibits a pushing boundary (scale bar, 500 μm), with zoomed insets for the tumor-stroma border (scale bar, 50 μm).
h) Left: Representative tile-scan of a mG+ (E-cad-) region of a primary tumor arising from E-cadfl/fl organoids. Right: Over 80% of the E-cad-negative tumor edge has an invasive morphology (scale bar, 500 μm), with zoomed insets for the tumor-stroma border (scale bar, 50 μm and 20 μm).
Extended Data Fig. 3: E-cad- cancer cells retain epithelial gene expression.
a) Control adeno-Cre transduced MMTV-PyMT; E-cad+/+ tumors are E-cad+, keratin+, vimentin-. mG+ (Cre+) cells in adeno-Cre transduced MMTV-PyMT; E-cadfl/fl tumors are E-cad-, keratin+, and vimentin-. Dotted lines define mT+, E-cad+ regions within E-cadfl/fl tumors. Adjacent host derived stroma serves as a positive control for vimentin expression. Scale bar, 50 μm. Repeated across at least 3 independent E-cad+/+ and E-cadfl/fl tumors.
b) Metastases in control transplant mice are keratin+. mG+ (Cre+) metastases arising in adeno-Cre transduced MMTV-PyMT; E-cadfl/fl transplant mice are keratin+. Scale bar, 50 μm. Repeated across sections from at least 3 independent E-cad+/+ and E-cadfl/fl mice.
c) Lung metastases in control tail-vein mice are E-cad+ and have membrane localized β-catenin. In contrast, mG+ metastases in mice injected with adeno-Cre transduced MMTV-PyMT; E-cadfl/fl clusters are E-cad- and β-catenin-. Scale bar, 50 μm. Repeated across sections from at least 3 independent E-cad+/+ and E-cadfl/fl mice.
d) Left: Representative micrographs of metastases arising in adeno-Cre transduced MMTV-PyMT; E-cad+/+ or E-cadfl/fl transplant mice. Scale bar, 100 μm. Right: Projected surface area of metastases arising in adeno-Cre transduced MMTV-PyMT E-cad+/+ and E-cadfl/fl transplant mice is represented. 5–95 percentile. ****p<0.0001 (Mann-Whitney test, two-sided).
e) Heatmap of canonical EMT transcripts (left) and cadherin family members (right). RNA-seq was performed by comparing transcriptomes of 4 adeno-Cre treated MMTV-PyMT; E-cad+/+ organoids to 5 adeno-Cre treated MMTV-PyMT; E-cadfl/fl organoids. p-values were calculated for the Wald test. Genome-wide significance = 1.7 E-6 (FWER = 0.05).
Extended Data Fig. 4: Alternate controls – E-cad loss increases invasion & dissemination but prevents metastasis across several assays.
a) All metastases arising from adeno-Cre transduced MMTV-PyMT; E-cad+/+ organoids are E-cad+. Only mG+ metastases arising from adeno-Cre transduced MMTV-PyMT; E-cadfl/fl organoids are E-cad-negative.
b) Number of macro-metastases in mice transplanted with adeno-Cre transduced MMTV-PyMT E-cad+/+ or E-cadfl/fl tumor organoids, as sorted by the color of the metastasis (mT, mG, or mT/mG mixed). Bar – median. ****p<0.0001 (Kruskal-Wallis test).
c) Number of macro-metastases per mouse after tail vein injections of adeno-Cre transduced MMTV-PyMT E-cad+/+ or E-cadfl/fl clusters, as sorted by the color of the metastasis (mT, mG, or mT/mG mixed) is represented. Bar – median. ****p<0.0001 (two-way ANOVA).
d) Schematic of 3D invasion assays using organoids from the same MMTV-PyMT; E-cadfl/fl tumor with or without adeno-Cre transduction.
e) Representative DIC images of MMTV-PyMT; E-cadfl/fl organoids with or with adeno-Cre. Arrowheads – dissemination events. Scale bar, 50 μm.
f–g) There is an increase in invasion (f) and dissemination (g) in E-cadfl/fl organoids treated with adeno-Cre, relative to uninfected controls. 5–95 percentile. ****p<0.0001 (Mann-Whitney test, two-sided).
h–i) Schematic of the transplant assay using MMTV-PyMT; E-cadfl/fl organoids with or without adeno-Cre (h). There are no observable E-cad- macro-metastases (i). Bar – median. **p = 0.0022 (Mann-Whitney test, two-sided).
j–k) Schematic of the tail vein assay using MMTV-PyMT; E-cadfl/fl organoids with or without adeno-Cre (j). E-cad- cancer cells are defective at tumor cell seeding (k). Bar - median. **p = 0.0087 (Mann-Whitney test, two-sided).
l) Schematic of orthotopic transplantation of adeno-Cre transduced MMTV-PyMT; E-cad+/+ or E-cadfl/fl MMTV-PyMT tumor organoids into immunocompetent FVB host mice. Lungs from these mice were harvested after ~8 weeks and the number of metastases counted.
m) Number of observed macro-metastases in mice (FVB) transplanted with adeno-Cre transduced MMTV-PyMT; E-cad+/+ or E-cadfl/fl tumor organoids, sorted by the color of the metastasis. Bar – median. **p = 0.0033, *p = 0.024 (two-way ANOVA).
n) Left: All metastases arising in control mice are E-cad+. Only mG+ cell containing metastases in adeno-Cre transduced MMTV-PyMT; E-cadfl/fl transplant mice are E-cad-negative. Right: E-cad- cancer cells do not contribute to observable macro-metastases in adeno-Cre transduced MMTV-PyMT; E-cadfl/fl (FVB) transplant mice. Bar – median. ****p <0.0001 (Mann-Whitney test, two-sided).
Extended Data Fig. 5: Tamoxifen-inducible E-cad deletion increases invasion and decreases metastasis ex vivo and in vivo.
a) Schema for tail vein injections using FACS sorted populations of purely E-cad+ or E-cad- cancer clusters.
b) E-cad- cancer cell clusters form significantly fewer metastatic colonies compared to E-cad+ clusters. ***p = 0.0002 (Mann-Whitney test, two-sided).
c) Schema for invasion assay using tamoxifen-treated MMTV-PyMT; E-cadfl/fl; CreER organoids. Control organoids were also tamoxifen-treated and were isolated from MMTV-PyMT; E-cadfl/fl tumors.
d) Representative Western blot depicting E-cad protein levels (loading control on same gel; 3 replicates of E-cad were quantified for summary graph). Mean +/− SD. *p = 0.029 (Mann-Whitney test, two-sided).
e) Representative DIC micrographs of collagen-embedded, tamoxifen-treated control and CreER expressing organoids. Arrowheads – dissemination events. Scale bar, 50 μm.
f–g) Tamoxifen-treated organoids isolated from CreER expressing tumors are more invasive (f) and disseminative (g) than control organoids. 5–95 percentile. ****p<0.0001 (Mann-Whitney test, two-sided).
h) Schematic of in-situ E-cad deletion. Organoids isolated from MMTV-PyMT; E-cadfl/fl and E-cadfl/fl; CreER tumors were transplanted into immunocompromised NSG mice. Once these mice developed tumors of up to 8–10mm, tamoxifen was injected intraperitoneally, and tumor growth was monitored bi-weekly. Tumors were harvested ~6-weeks post-transplantation.
i) There is a decrease in tumor growth rates after E-cad deletion relative to control tumors. Mean +/− SEM. ****p<0.0001 by regression analysis.
j) Representative tile-scan of a MMTV-PyMT; E-cadfl/fl; CreER primary tumor. Tamoxifen was injected to delete E-cad. mT+ cells did not express Cre and are E-cad+; mG+ cancer cells are E-cad-. Scale bar, 500 μm. Zoomed insets for E-cad+ (yellow box; scale bar, 50 μm) and E-cad- (grey box; scale bar, 50 μm) regions of the tumor boundary.
Extended Data Fig. 6: E-cad loss promotes invasion and suppresses metastasis in a basal model of IDC.
a) Schematic of 3D invasion assay using C3(1)-Tag tumor organoids. E-cad deletion is induced by adeno-Cre. Control organoids are treated with adeno-GFP.
b) Representative Western blot depicting protein levels of E-cad in adeno-GFP and adeno-Cre transduced C3(1)-Tag; E-cadfl/fl organoids (loading control on same gel; 4 replicates of E-cad were quantified for summary graph). Mean +/− SD, *p = 0.029 (Mann-Whitney test, two-sided).
c) Representative timelapse DIC images of adeno-GFP and adeno-Cre transduced C3(1)-Tag; E-cadfl/fl tumor organoids. Scale bar, 50 μm.
d) There is a significant increase in dissemination in adeno-Cre transduced C3(1)-Tag; E-cadfl/fl organoids relative to control organoids. 5–95 percentile; ****p <0.0001 (Mann-Whitney test, two-sided).
e) Adeno-GFP or adeno-Cre transduced C31(1)-Tag; E-cadfl/fl organoids were transplanted into the cleared mammary fat pads of NSG mice. The tumor boundary was examined for invasive morphology.
f) Left: Control C3(1)-Tag tumors typically organize and invade collectively. Right: Loss of E-cad causes an increase in invasion and dissemination at the tumor-stroma interface. Scale bar, 500μm. Zoomed insets of invasive borders. Scale bar, 100 μm.
g) CTCs were isolated via cardiac puncture performed on NSG mice transplanted with adeno-GFP or adeno-Cre transduced C3(1)-Tag E-cadfl/fl organoids. There is a significant decrease in the number CTCs arising from E-cad- cancer cells. Representative images of E-cad+ and E-cad- CTCs. Scale bar, 20 μm. Bar – Median. *p = 0.026 (Mann-Whitney test, two-sided).
h) Schema for transplant and tail vein assays using adeno-GFP or adeno-Cre transduced C3(1)-Tag E-cadfl/fl tumor organoids. All metastases in control mice are E-cad+ while only metastases containing mG+ cancer cells are E-cad-.
i) Left: Representative micrographs of E-cad+ and E-cad- metastases arising in adeno-GFP and adeno-Cre transduced C3(1)-Tag; E-cadfl/fl transplant mice respectively. Scale bar, 50 μm. Right: E-cad- cancer cells rarely contribute to macro-metastases. Bar – median. **p = 0.002 (Mann-Whitney test, two-sided).
j) Left: Whole lung images of metastases arising after tail-vein injections of adeno-GFP or adeno-Cre transduced cancer cell clusters isolated from C3(1)-Tag; E-cadfl/fl tumors (scale bar, 1cm), with zoomed insets for smaller lung areas. Arrowheads - metastases. Right: E-cad- cancer cells rarely contribute to metastases in tail vein assay. Bar – median. ****p<0.0001 (Mann-Whitney test, two-sided).
Extended Data Fig. 7: Loss of E-cad in a TNBC PDX increases invasion and dissemination but decreases colony formation.
a) Gating strategy to isolate tumor cell clusters (2–4 cells each).
b–c) Flow sorting strategy to isolate mT+ (E-cad+) tumor cell clusters from tamoxifen treated MMTV-PyMT; E-cadfl/fl organoids (b) or mG+ (E-cad-) tumor cell clusters from tamoxifen treated MMTV-PyMT; E-cadfl/fl; CreER organoids (c). Scale bar, 10μm.
d) Organoids were isolated from a triple negative PDX tumor and were divided into three groups for treatment with lentiviral shRNA against luciferase or E-cad (two shRNA clones). Puromycin was used to positively select transduced cells. Organoids were embedded in 3D collagen I to assay their invasive phenotype.
e) Representative Western blot depicting decreased levels of E-cad protein when treated with E-cad shRNA (loading control on same gel; 3 replicates of E-cad were quantified for summary graph). Mean +/− SD. *p = 0.02 (Kruskal Wallis test).
f) Representative micrographs of PDX tumor organoids embedded in collagen I. Scale bar, 50 μm.
g–h) Knockdown of E-cad in PDX organoids significantly increases invasion (g) and dissemination (h). Bar – median. ****p<0.0001, ***p = 0.0002 (Kruskal Wallis test).
i) Schema for colony formation assay after E-cad knockdown in a triple-negative PDX model.
j) Representative micrographs of colonies arising from Luc shRNA or E-cad shRNA (two shRNA clones) treated PDX-derived cancer cell clusters. Scale bar, 50 μm.
k) Knockdown of E-cad in PDX-derived cancer cells decreases colony formation. *p = 0.034 (Kruskal Wallis test).
Extended Data Fig. 8: Loss of E-cad causes an increase in apoptosis and TGFβ signaling.
a) Representative Western blot depicting no significant changes in total protein levels of the dormancy maker, COUP-TF1, in adeno-Cre transduced MMTV-PyMT; E-cad+/+ or E-cadfl/fl organoids (loading control on same gel; 3 replicates of NR2F1 were quantified for summary graph). Mean +/− SD. ****p <0.0001 (Mann-Whitney test, two-sided).
b) RNA-seq was used to compare gene expression changes in adeno-Cre transduced MMTV-PyMT E-cad+/+ and E-cadfl/fl organoids.
c) Heatmap of differentially expressed transcripts in adeno-Cre transduced MMTV-PyMT; E-cad+/+ and E-cadfl/fl tumor organoids RNA-seq was performed by comparing transcriptomes of 4 adeno-Cre treated MMTV-PyMT; E-cad+/+ organoids to 5 adeno-Cre treated MMTV-PyMT; E-cadfl/fl organoids. p-values were calculated for the Wald test. Genome-wide significance = 1.7 E-6 (FWER = 0.05).
d) Schema of transcripts known to be involved in metastasis that are upregulated (red boxes) or downregulated (blue boxes) as a consequence of E-cad loss in MMTV-PyMT tumor organoids.
e) Differentially expressed transcripts that have previously been shown to regulate apoptosis are highlighted (red) among all differential transcripts (black). All transcripts are represented in grey. RNA-seq was performed by comparing transcriptomes of 4 adeno-Cre treated MMTV-PyMT; E-cad+/+ organoids to 5 adeno-Cre treated MMTV-PyMT; E-cadfl/fl organoids. Raw p-values are reported without multiple testing correction. Fold change is reported as experimental/control for experimental > control and as -control/experimental for control > experimental. Genome wide significance = 1.7 E-6 (FWER = 0.05). Genome wide significance = 1.7 E-6 (FWER = 0.05).s
f) Proportion of disseminating E-cad+ or E-cad- cancer cells displaying apoptotic morphologies.
g) CC3 is localized to E-cad- disseminating cells in adeno-Cre transduced MMTV-PyMT; E-cadfl/fl tumor organoids (scale bar, 50 μm), with zoomed insets for the organoid bulk and disseminated cell (scale bar, 20 μm). Arrows – disseminated cell.
h) Mean intensity of ROS in E-cad+ or E-cad- disseminated cells relative to the organoid bulk. ****p <0.0001, **p-value = 0.002 (Mann-Whitney test, two-sided).
i) SMAD2/3 is diffusely expressed within E-cad+, MMTV-PyMT cancer cells, while it is nuclear localized after E-cad deletion. Scale bar, 20 μm. Observations were made across at least 3 independent tumors.
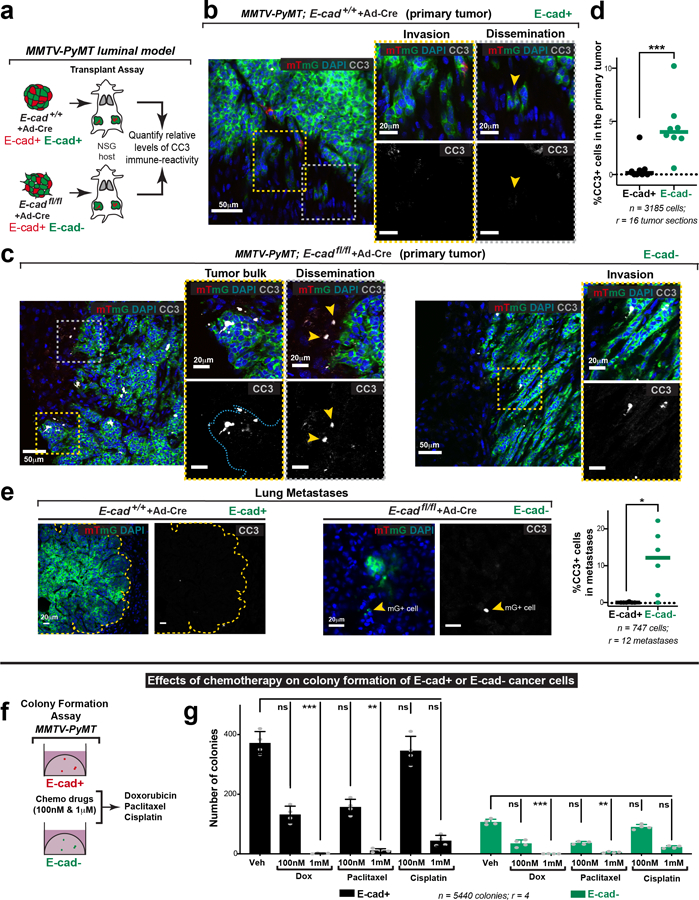
Extended Data Fig. 9: E-cad loss is associated with increased apoptosis at several stages of metastasis in vivo.
a) CC3 immunoreactivity was used to detect the relative abundance of apoptosis in transplanted adeno-Cre transduced MMTV-PyMT; E-cad+/+ or E-cadfl/fl tumors.
b) Representative micrographs of E-cad+ primary tumors depicting the rarity of CC3+ cancer cells within the tumor bulk, invasion, or dissemination events (zoomed insets; scale bar, 20 μm). Scale bar, 50 μm.
c) Representative micrographs of E-cad- primary tumors depicting a significant proportion of CC3+ cancer cells within the tumor bulk, dissemination events, and invasion (zoomed insets; scale bar, 20 μm). Scale bar, 50 μm.
d) The number of CC3+ cancer cells within E-cad- primary tumors increases significantly relative to E-cad+ primary tumors. Bar – median. ***p = 0.0008 (Mann-Whitney test, two-sided).
e) Left: Representative micrographs marking CC3+ cancer cells within E-cad+ or E-cad- metastases. Scale bar, 20 μm. Arrowhead – CC3+, E-cad- metastasis. Right: There is a significant increase in the amount of apoptosis in E-cad- metastases relative to E-cad+ metastases. Bar – median. *p = 0.015 (Mann-Whitney test, two-sided).
f) Schema of colony formation assay using MMTV-PyMT; E-cad+ or E-cad- cancer cells in the presence of 100 nM or 1 μM of doxorubicin, paclitaxel, and cisplatin.
g) E-cad- cancer cells are no more or less sensitive to chemotherapies compared to E-cad+ cancer cells. Mean +/− SD. **p = 0.0065 (E-cad+), 0.0044 (E-cad-) and ***p = 0.0005 (Ecad+), 0.0003 (E-cad-) (Kruskal-Wallis test).
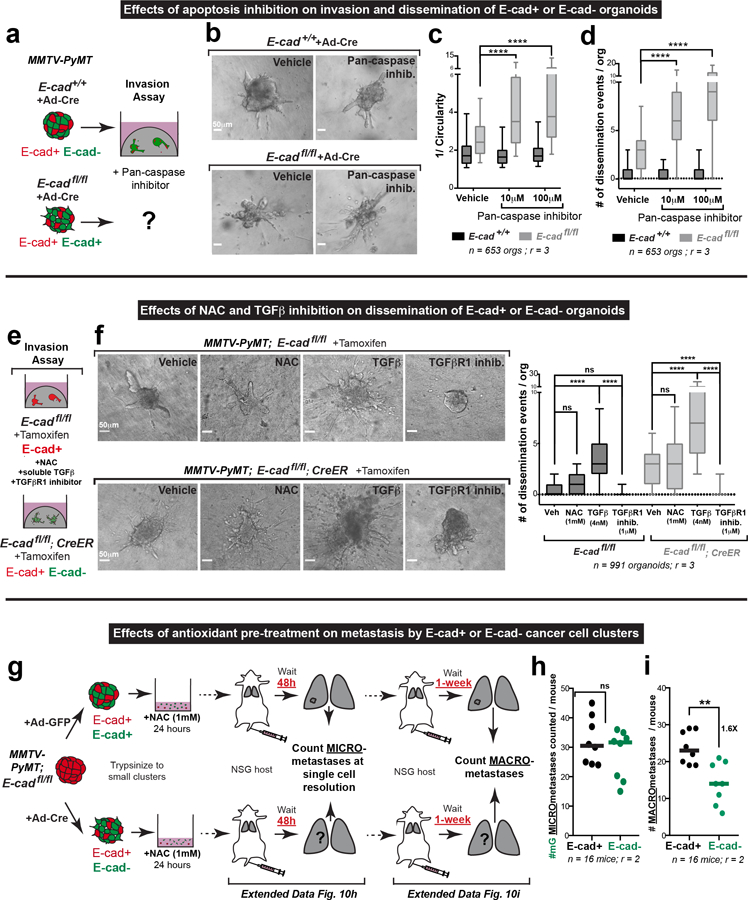
Extended Data Fig. 10: Effects of apoptosis, oxidative stress, and TGFβ inhibition on dissemination of E-cad+ or E-cad- MMTV-PyMT organoids.
a) Schema of invasion assay in the presence of a pan-caspase inhibitor (z-VAD-FMK).
b) Representative micrographs of adeno-Cre transduced MMTV-PyMT; E-cad+/+ or E-cadfl/fl organoids in the presence of z-VAD-FMK. Scale bar, 50 μm.
c–d) There is a dose-dependent increase in invasion (c) and dissemination (d) of E-cadfl/fl organoids relative to control organoids in the presence of z-VAD-FMK. 5–95 percentile. ****p <0.0001 (Kruskal-Wallis test).
e) Schema of invasion assay in the presence of NAC, soluble TGFβ, or TGFβR1 inhibitor.
f) Representative images of tamoxifen treated MMTV-PyMT; E-cadfl/fl or E-cadfl/fl; CreER organoids in the presence of these inhibitors. Treatment with soluble TGFβ increases dissemination of E-cad+ and E-cad- organoids while inhibition of TGFβR1 decreases dissemination. Treatment with NAC does not change dissemination of E-cad+ or E-cad- organoids. Scale bar, 50 μm. 5–95 percentile. ****p<0.0001 (Kruskal-Wallis test).
g) Schema of tail vein assays using NAC pre-treated E-cad+ or E-cad- cancer cell clusters. MMTV-PyMT; E-cadfl/fl organoids were treated with adeno-GFP or adeno-Cre, trypsinized into small clusters, incubated with NAC for 24 hours, and injected via the tail vein of NSG host mice. Lungs from these mice were harvested 48h or 1 week after injection and number of micro- and macro- metastases counted respectively.
h) There is no significant difference in the number of micro-metastases arising from E-cad+ or E-cad- cancer cells after NAC pre-treatment. Bar – median. (Mann-Whitney test, two-sided).
i) NAC pre-treatment partially rescued the ability of E-cad- cancer cells to form macro-metastases relative to E-cad+ cancer cells. Bar – median. **p = (Mann-Whitney test, two-sided).
Supplementary Material
Acknowledgements
We thank all members of the Ewald Lab for critical discussions and Juan Carlos Ramirez for assistance in quantifying the area of metastases and cryo-sectioning. We thank Hao Zhang from the Johns Hopkins School of Public Health Flow Cytometry Core Facility and Haiping Hao from the Microarray and Deep Sequencing Core Facility for technical assistance. A.J.E. received support for this project through grants from: The Breast Cancer Research Foundation/Pink Agenda (BCRF-16-048, BCRF-17-048, BCRF-18-048), the Metastatic Breast Cancer Network, Twisted Pink, Hope Scarves, and the National Institutes of Health / National Cancer Institute (U01CA217846, U54CA2101732, 3P30CA006973). V.P. was supported in part by an Isaac and Lucille Hay Fellowship. J.S.B. received support for this project through a grant from the National Institutes of Health / National Cancer Institute (U01CA217846). Both A.J.E. and J.S.B. received support from the Jayne Koskinas Ted Giovanis Foundation for Health and Policy and the Breast Cancer Research Foundation, private foundations committed to critical funding of cancer research. The opinions, findings, conclusions or recommendations expressed in this material are those of the author(s) and not necessarily those of the Jayne Koskinas Ted Giovanis Foundation for Health and Policy or the Breast Cancer Research Foundation, or their respective directors, officers, or staffs. Research in the Aceto lab is supported by the European Research Council, the Swiss National Science Foundation, the Swiss Cancer League, the Basel Cancer League, the two Cantons of Basel through the ETH Zürich, and the University of Basel.
Footnotes
Supplementary Information is available in the online version of the paper.
Competing Interests (online only) A.J.E. and V.P. are listed as inventors on a patent application related to the use of antibodies as cancer therapeutics. A.J.E. is listed as an inventor on a patent application related to the use of keratin-14 as a prognostic indicator for breast cancer outcomes. A.J.E.’s spouse is an employee of ImmunoCore. J.S.B. is a founder and director of Neochromosome, Inc., and is a member of the scientific advisory board of AI Therapeutics, Inc. I.K., B.M.S. and N.A. are listed as inventors in patent applications related to CTCs and cancer treatment. N.A. is a paid consultant for pharmaceutical and insurance companies with an interest in liquid biopsy.
The authors declare competing financial interests: details are available in the online version of the paper.
Data availability
Next-generation RNA sequencing data has been made available on NCBI GEO (accession number GSE114011). Detailed methods have been provided for each technique used in this study. The numerical data underlying all figure panels has been provided in spreadsheet format to Nature. Additional requests for information or data will be fulfilled by the corresponding author, Andrew J. Ewald, upon request.
Code availability
Semi-custom code developed for RNA-seq analysis and has been made available on GitHub at the following address: https://github.com/baderzone/ecad_2019.
REFERENCES
- 1.Bogenrieder T & Herlyn M Axis of evil: molecular mechanisms of cancer metastasis. Oncogene 22, 6524–6536, (2003). [DOI] [PubMed] [Google Scholar]
- 2.Berx G et al. E-cadherin is a tumour/invasion suppressor gene mutated in human lobular breast cancers. The EMBO journal 14, 6107–6115, (1995). [DOI] [PMC free article] [PubMed] [Google Scholar]
- 3.Frixen UH et al. E-cadherin-mediated cell-cell adhesion prevents invasiveness of human carcinoma cells. J Cell Biol 113, 173–185, (1991). [DOI] [PMC free article] [PubMed] [Google Scholar]
- 4.Li CI, Anderson BO, Daling JR & Moe RE Trends in incidence rates of invasive lobular and ductal breast carcinoma. JAMA 289, 1421–1424, (2003). [DOI] [PubMed] [Google Scholar]
- 5.Nguyen-Ngoc KV et al. ECM microenvironment regulates collective migration and local dissemination in normal and malignant mammary epithelium. Proc Natl Acad Sci U S A 109, E2595–2604, (2012). [DOI] [PMC free article] [PubMed] [Google Scholar]
- 6.Cheung KJ, Gabrielson E, Werb Z & Ewald AJ Collective invasion in breast cancer requires a conserved basal epithelial program. Cell 155, 1639–1651, (2013). [DOI] [PMC free article] [PubMed] [Google Scholar]
- 7.Christofori G & Semb H The role of the cell-adhesion molecule E-cadherin as a tumour-suppressor gene. Trends Biochem Sci 24, 73–76, (1999). [DOI] [PubMed] [Google Scholar]
- 8.Chambers AF, Groom AC & MacDonald IC Metastasis: Dissemination and growth of cancer cells in metastatic sites. Nature Reviews Cancer 2, 563–572, (2002). [DOI] [PubMed] [Google Scholar]
- 9.Sosa MS et al. NR2F1 controls tumour cell dormancy via SOX9- and RARbeta-driven quiescence programmes. Nat Commun 6, 6170, (2015). [DOI] [PMC free article] [PubMed] [Google Scholar]
- 10.Wheelock MJ, Shintani Y, Maeda M, Fukumoto Y & Johnson KR Cadherin switching. J Cell Sci 121, 727–735, (2008). [DOI] [PubMed] [Google Scholar]
- 11.Davies SR, Watkins G, Douglas-Jones A, Mansel RE & Jiang WG Bone morphogenetic proteins 1 to 7 in human breast cancer, expression pattern and clinical/prognostic relevance. J Exp Ther Oncol 7, 327–338, (2008). [PubMed] [Google Scholar]
- 12.Demircan B et al. Comparative epigenomics of human and mouse mammary tumors. Genes Chromosomes Cancer 48, 83–97, (2009). [DOI] [PMC free article] [PubMed] [Google Scholar]
- 13.Xue W et al. A cluster of cooperating tumor-suppressor gene candidates in chromosomal deletions. Proc Natl Acad Sci U S A 109, 8212–8217, (2012). [DOI] [PMC free article] [PubMed] [Google Scholar]
- 14.Jovanovic IP et al. Interleukin-33/ST2 axis promotes breast cancer growth and metastases by facilitating intratumoral accumulation of immunosuppressive and innate lymphoid cells. Int J Cancer 134, 1669–1682, (2014). [DOI] [PubMed] [Google Scholar]
- 15.Gao D et al. Myeloid progenitor cells in the premetastatic lung promote metastases by inducing mesenchymal to epithelial transition. Cancer Res 72, 1384–1394, (2012). [DOI] [PMC free article] [PubMed] [Google Scholar]
- 16.Day ML et al. E-cadherin mediates aggregation-dependent survival of prostate and mammary epithelial cells through the retinoblastoma cell cycle control pathway. J Biol Chem 274, 9656–9664, (1999). [DOI] [PubMed] [Google Scholar]
- 17.Adamson GM & Billings RE Tumor necrosis factor induced oxidative stress in isolated mouse hepatocytes. Arch Biochem Biophys 294, 223–229, (1992). [DOI] [PubMed] [Google Scholar]
- 18.Liu RM & Desai LP Reciprocal regulation of TGF-beta and reactive oxygen species: A perverse cycle for fibrosis. Redox Biol 6, 565–577, (2015). [DOI] [PMC free article] [PubMed] [Google Scholar]
- 19.Johnson TM, Yu ZX, Ferrans VJ, Lowenstein RA & Finkel T Reactive oxygen species are downstream mediators of p53-dependent apoptosis. Proc Natl Acad Sci U S A 93, 11848–11852, (1996). [DOI] [PMC free article] [PubMed] [Google Scholar]
- 20.LeBleu VS et al. PGC-1alpha mediates mitochondrial biogenesis and oxidative phosphorylation in cancer cells to promote metastasis. Nat Cell Biol 16, 992–1003, 1001–1015, (2014). [DOI] [PMC free article] [PubMed] [Google Scholar]
- 21.Kerksick C & Willoughby D The antioxidant role of glutathione and N-acetyl-cysteine supplements and exercise-induced oxidative stress. J Int Soc Sports Nutr 2, 38–44, (2005). [DOI] [PMC free article] [PubMed] [Google Scholar]
- 22.Herrera B et al. Reactive oxygen species (ROS) mediates the mitochondrial-dependent apoptosis induced by transforming growth factor (beta) in fetal hepatocytes. FASEB J 15, 741–751, (2001). [DOI] [PubMed] [Google Scholar]
- 23.Massague J TGFbeta in Cancer. Cell 134, 215–230, (2008). [DOI] [PMC free article] [PubMed] [Google Scholar]
- 24.Kleer CG, van Golen KL, Braun T & Merajver SD Persistent E-cadherin expression in inflammatory breast cancer. Mod Pathol 14, 458–464, (2001). [DOI] [PubMed] [Google Scholar]
- 25.Rodriguez FJ, Lewis-Tuffin LJ & Anastasiadis PZ E-cadherin’s dark side: possible role in tumor progression. Biochim Biophys Acta 1826, 23–31, (2012). [DOI] [PMC free article] [PubMed] [Google Scholar]
- 26.Sundfeldt K et al. E-cadherin expression in human epithelial ovarian cancer and normal ovary. Int J Cancer 74, 275–280, (1997). [DOI] [PubMed] [Google Scholar]
- 27.Kim SA et al. Loss of CDH1 (E-cadherin) expression is associated with infiltrative tumour growth and lymph node metastasis. Br J Cancer 114, 199–206, (2016). [DOI] [PMC free article] [PubMed] [Google Scholar]
- 28.McCart Reed AE et al. An epithelial to mesenchymal transition programme does not usually drive the phenotype of invasive lobular carcinomas. J Pathol 238, 489–494, (2016). [DOI] [PubMed] [Google Scholar]
- 29.Xu Y et al. Breast tumor cell-specific knockout of Twist1 inhibits cancer cell plasticity, dissemination, and lung metastasis in mice. Proc Natl Acad Sci U S A 114, 11494–11499, (2017). [DOI] [PMC free article] [PubMed] [Google Scholar]
- 30.Beerling E et al. Plasticity between Epithelial and Mesenchymal States Unlinks EMT from Metastasis-Enhancing Stem Cell Capacity. Cell Rep 14, 2281–2288, (2016). [DOI] [PMC free article] [PubMed] [Google Scholar]
- 31.Lambert AW, Pattabiraman DR & Weinberg RA Emerging Biological Principles of Metastasis. Cell 168, 670–691, (2017). [DOI] [PMC free article] [PubMed] [Google Scholar]
- 32.Yates CC, Shepard CR, Stolz DB & Wells A Co-culturing human prostate carcinoma cells with hepatocytes leads to increased expression of E-cadherin. Br J Cancer 96, 1246–1252, (2007). [DOI] [PMC free article] [PubMed] [Google Scholar]
- 33.Brabletz T To differentiate or not--routes towards metastasis. Nat Rev Cancer 12, 425–436, (2012). [DOI] [PubMed] [Google Scholar]
REFERENCES (METHODS):
- 34.Guy CT, Cardiff RD & Muller WJ Induction of mammary tumors by expression of polyomavirus middle T oncogene: a transgenic mouse model for metastatic disease. Mol Cell Biol 12, 954–961, (1992). [DOI] [PMC free article] [PubMed] [Google Scholar]
- 35.Maroulakou IG, Anver M, Garrett L & Green JE Prostate and mammary adenocarcinoma in transgenic mice carrying a rat C3(1) simian virus 40 large tumor antigen fusion gene. Proc Natl Acad Sci U S A 91, 11236–11240, (1994). [DOI] [PMC free article] [PubMed] [Google Scholar]
- 36.Muzumdar MD, Tasic B, Miyamichi K, Li L & Luo L A global double-fluorescent Cre reporter mouse. Genesis 45, 593–605, (2007). [DOI] [PubMed] [Google Scholar]
- 37.Boussadia O, Kutsch S, Hierholzer A, Delmas V & Kemler R E-cadherin is a survival factor for the lactating mouse mammary gland. Mech Dev 115, 53–62, (2002). [DOI] [PubMed] [Google Scholar]
- 38.Badea TC, Wang Y & Nathans J A noninvasive genetic/pharmacologic strategy for visualizing cell morphology and clonal relationships in the mouse. J Neurosci 23, 2314–2322, (2003). [DOI] [PMC free article] [PubMed] [Google Scholar]
- 39.Nguyen-Ngoc KV et al. 3D culture assays of murine mammary branching morphogenesis and epithelial invasion. Methods Mol Biol 1189, 135–162, (2015). [DOI] [PMC free article] [PubMed] [Google Scholar]
- 40.Langmead B, Trapnell C, Pop M & Salzberg SL Ultrafast and memory-efficient alignment of short DNA sequences to the human genome. Genome Biol 10, R25, (2009). [DOI] [PMC free article] [PubMed] [Google Scholar]
- 41.Kim D et al. TopHat2: accurate alignment of transcriptomes in the presence of insertions, deletions and gene fusions. Genome Biol 14, R36, (2013). [DOI] [PMC free article] [PubMed] [Google Scholar]
- 42.Anders S, Pyl PT & Huber W HTSeq--a Python framework to work with high-throughput sequencing data. Bioinformatics 31, 166–169, (2015). [DOI] [PMC free article] [PubMed] [Google Scholar]
- 43.Love MI, Huber W & Anders S Moderated estimation of fold change and dispersion for RNA-seq data with DESeq2. Genome Biol 15, 550, (2014). [DOI] [PMC free article] [PubMed] [Google Scholar]
- 44.Cheung KJ et al. Polyclonal breast cancer metastases arise from collective dissemination of keratin 14-expressing tumor cell clusters. Proc Natl Acad Sci U S A 113, E854–863, (2016). [DOI] [PMC free article] [PubMed] [Google Scholar]
- 45.Liberzon A et al. Molecular signatures database (MSigDB) 3.0. Bioinformatics 27, 1739–1740, (2011). [DOI] [PMC free article] [PubMed] [Google Scholar]
Associated Data
This section collects any data citations, data availability statements, or supplementary materials included in this article.


