Abstract
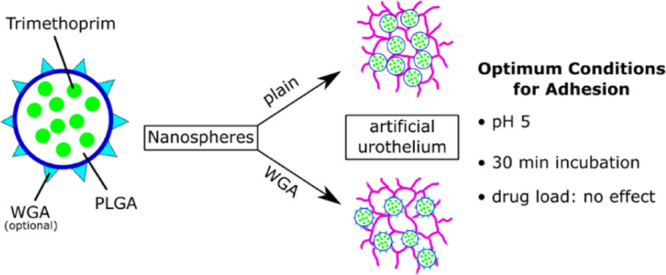
Intravesical therapy, already used to treat bladder cancer, is a potential treatment option for urinary tract infections. However, short dwelling time and washout proved to be challenging obstacles. To circumvent these issues, PLGA 503H and PLGA 2300 nanoparticles were prepared and surface modified with wheat germ agglutinin (WGA). Nanoparticles of both poly(d,l-lactic-co-glycolic acid) (PLGA) types exhibited high inherent adhesion to human uroepithelial cells. Although surface-bound WGA could be easily increased, adhesion did not. Loading the nanoparticles with trimethoprim did not counteract cell adhesion. Varying the medium for instillation revealed highest adhesion in sodium bicarbonate buffer (pH 5). To evaluate dwelling time, nanoparticles were incubated with the cell monolayer for increasing time intervals. A contact time of 15 min seems to be too short for adhesion to the cells as less than 50% particles remained bound after washing. However, after 30 min 70% of the particles added were bound, and afterward, no further increase was observed. WGA only slightly increased the adhesion of the PLGA nanoparticles, but this approach might not be economically viable. However, PLGA nanoparticles displayed a high inherent adhesion to cells that might substantially foster intravesical therapy.
1. Introduction
Cystitis and pyelonephritis, summarized as urinary tract infections (UTI), are among the two most common infectious diseases in the US.1 Mostly prevalent in women, risk factors include age, sexual activity, and pregnancy, as well as diabetes.2 Common symptoms of cystitis are dysuria and pollakisuria, while the more serious pyelonephritis is associated with flank pain, nausea, and fever.3 The most frequent pathogen is uropathogenic Escherichia coli (UPEC).4,5 UPEC has the ability to adhere to facet cells via type 1 pili, more specifically to the mannose-specific adhesin FimH located on the tips.6 After cell invasion, UPEC forms intracellular bacterial communities (IBC). It is reported that UPEC redistributes from the IBC back into the bladder lumen and can cause recurring infections by invading neighboring cells.7,8
Therapy usually comprises antibiotic treatment, for example, fosfomycin-trometamol, nitrofurantoin, pivmecillinam, and trimethoprim (TMP), or TMP combined with sulphamethoxazole.9 However, increasing bacterial resistances to the commonly used antibiotics complicate therapy and reduce treatment options.10 A safe and effective procedure is intravesical administration via catheter,11 which is already used to treat bladder cancer.12 An antibiotic solution or suspension is directly applied into the bladder, inducing a high local drug concentration while reducing or avoiding systemic side effects.13 However, instillation time is limited due to the increasing desire to urinate causing patient discomfort. Furthermore, urination leads to washout of drugs, and the low permeability of the urothelium might prevent diffusion of the antibiotic during the small time frame.14
An innovative attempt to confer targeting and adhesion capabilities to drug carriers is to mimic the interaction of FimH of UPEC with the urothelial cells.15 For that purpose, wheat germ agglutinin (WGA) seems to be a viable option. The carbohydrate-binding protein adheres to urothelial cells similar to FimH16 and can be covalently linked to poly(d,l-lactic-co-glycolic acid) (PLGA)-based formulations loaded with various active pharmaceutical ingredients.17 PLGA is an US FDA-approved biodegradable and biocompatible polymer often used to prepare nano- and microspheres and offers a wide variety of types to cater to specific needs.18,19 Drug release profiles are dependent on molecular weight and the lactic acid to glycolic acid ratio, whereby a 50:50 ratio provides the fastest liberation.20 PLGA nanoparticles can protect drugs from degradation and allow for drug delivery of various drugs or proteins to specific targets.18 Nanospheres with increased adhesion capabilities might alleviate short dwelling times and washout processes during intravesical therapy by remaining longer in the bladder and therefore increasing patient compliance.
In this study, we evaluate the cell adhesion capabilities of nanoparticles prepared from widely used PLGA 503H and the lower molecular weight PLGA 2300. Nanospheres were loaded with TMP, an antibiotic used in the treatment of UTI. Furthermore, the particle surface was modified with WGA to potentially increase the dwelling time in the bladder. With high adhesion, nanoparticles loaded with an antibiotic could attach to the bladder wall and remain even after urination, prolonging the therapeutic effect and reducing diffusion pathways. Cell adhesion of the particles was studied using monolayers of immortalized human uroepithelial cells (SV-HUCs) as artificial urothelium and factors such as incubation time (simulating instillation time), pH (determining parameters of the instillation medium), and effect of the TMP load on adhesion.
2. Results and Discussion
2.1. Modification of PLGA Nanospheres with WGA
As an artificial urothelium for in vitro analysis of particle adhesion, healthy HUCs with no tumorigenic characteristics, SV-HUCs, were used. With higher adhesion capabilities, the residence time inside the bladder could be improved, therefore shortening the period of instillation and patient discomfort. For this purpose, the nanosphere surface was modified with WGA and evaluated in detail. WGA has proven to increase cell adhesion of PLGA particles to the tumorigenic bladder cell line 5637 in previous studies.17
To evaluate the amount of WGA on the nanoparticles and amount needed to potentially increase adhesion to cells, WGA added for surface modification varied (Table 1). Starting with 0.25 mg WGA, an amount used previously to enhance binding affinity,17 resulted in 1.8 μg surface-bound WGA per mg PLGA 503H particles and 1.1 μg per mg PLGA 2300. When quadrupling the WGA amount, a 2.9-fold (PLGA 503H) and a 3.4-fold (PLGA 2300) increase was observed. The highest amount of WGA added further increased the immobilized amount of lectin 1.7-fold and 2.5-fold (PLGA 503H and 2300, respectively), culminating in an almost similar amount per mass with no significant difference (p ≥ 0.05) between the two PLGA types.
Table 1. Nanoparticle Batches Used for WGA Optimizationa.
| batch | WGA [mg] | z-avg [nm] | PDI | surface-bound WGA[μg/mgparticles] |
|---|---|---|---|---|
| 503H no WGA | 0 | 240.2 ± 3.1 | 0.152 ± 0.01 | |
| 503H 0.25 WGA | 0.25 | 240.2 ± 3.1 | 0.152 ± 0.01 | 1.826 ±0.04 |
| 503H 1.0 WGA | 1.00 | 240.2 ± 3.1 | 0.152 ± 0.01 | 5.230 ±0.23 |
| 503H 1.25 WGA | 1.25 | 240.2 ± 3.1 | 0.152 ± 0.01 | 8.878 ±0.22 |
| 2300 no WGA | 0 | 286.1 ± 3.6 | 0.200 ± 0.01 | |
| 2300 0.25 WGA | 0.25 | 286.1 ± 3.6 | 0.200 ± 0.01 | 1.066 ±0.01 |
| 2300 1.0 WGA | 1.00 | 286.1 ± 3.6 | 0.200 ± 0.01 | 3.603 ±0.04 |
| 2300 1.25 WGA | 1.25 | 286.1 ± 3.6 | 0.200 ± 0.01 | 8.918 ±0.17 |
“No WGA” batches were used for modification with different amounts of WGA. All measurements were carried out in triplicates. All pairwise comparison (Holm–Sidak method) resulted in statistically significant differences (p ≤ 0.001) for the size and WGA on the surface for all batches except for WGA on the surface of 503H 8.9 WGA and 2300 8.9 WGA, which showed no significant differences (p ≥ 0.05).
While the surface-bound WGA could be increased by a decent amount, cell interaction did not. In the case of PLGA 503H (Figure 1A), no significant increase in cell adhesion between plain (no WGA) and WGA-grafted nanoparticles was observed; on the contrary, even a slight decrease was detected. Because each washing step-mimicking urination was analyzed in three separate wells, where particles were exposed to hydrodynamic forces of the washing solution, variations in the remaining particles between each single washing step and in standard deviations were expected, as indicated by the higher values for the six washing step bars of 503H 1.0 and 1.25. In the case of PLGA 2300 (Figure 1B), the adhesion increased with higher WGA-density of the nanoparticles. After four washing steps, there was a slight difference between 0.25 WGA and 1.0 WGA, but the difference became substantial after six washing steps. In the case of 1.25 WGA, more nanoparticles were still bound after two washing steps, the binding rate after four and six washing steps was very similar to that of 1.0 WGA. However, plain PLGA 2300 particles interacted less with the artificial tissue than their 503H counterparts, resulting in only 55% remaining PLGA 2300 particles after two washing steps in comparison to 80% PLGA 503H. Microscopic images of particles on cells using an oil-immersion objective are depicted in Figure 2. Both nuclei (blue) and membrane (red) were stained to provide a better visualization of the nanoparticles (green). The clusters of particles are clearly visible, however, because of the size, some single ones might not be distinguishable. While a similar amount of PLGA503H particles with and without WGA remained on the cells during the procedure, there was a visible difference with PLGA 2300. However, because those images are just a fraction of the used monolayer, conclusions based solely on the images cannot be drawn. Zeta-potential was in the range of −55 to −58 for all particles with no clear differentiation between WGA-grafted and nongrafted particles.
Figure 1.
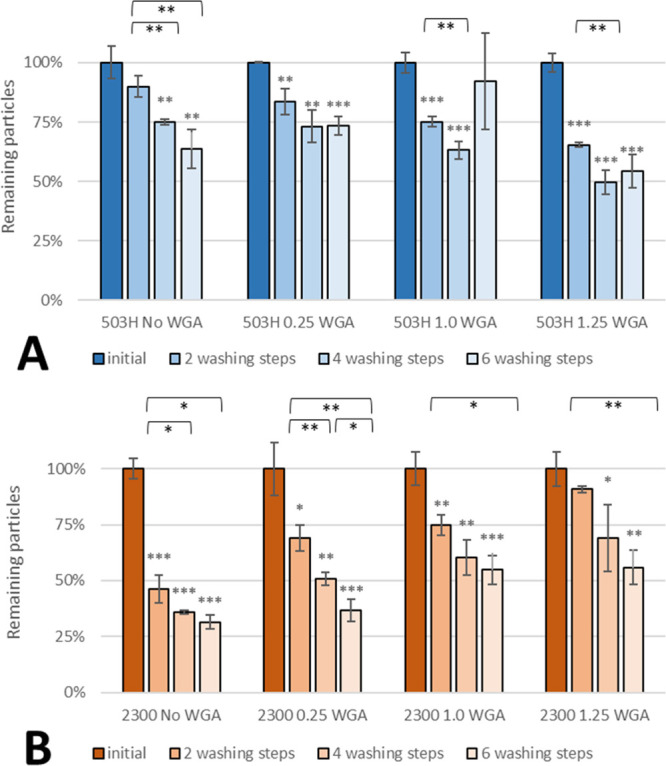
Effect of different WGA amounts on adhesion of PLGA-503H-TMP (A) and PLGA-2300-TMP (B) nanoparticles. Asterisks above bars show significant p-values vs the initial particle load and brackets show statistically significant differences between washing steps (***p ≤ 0.001, **p ≤ 0.01, *p ≤ 0.05, and ns p ≥ 0.05).
Figure 2.
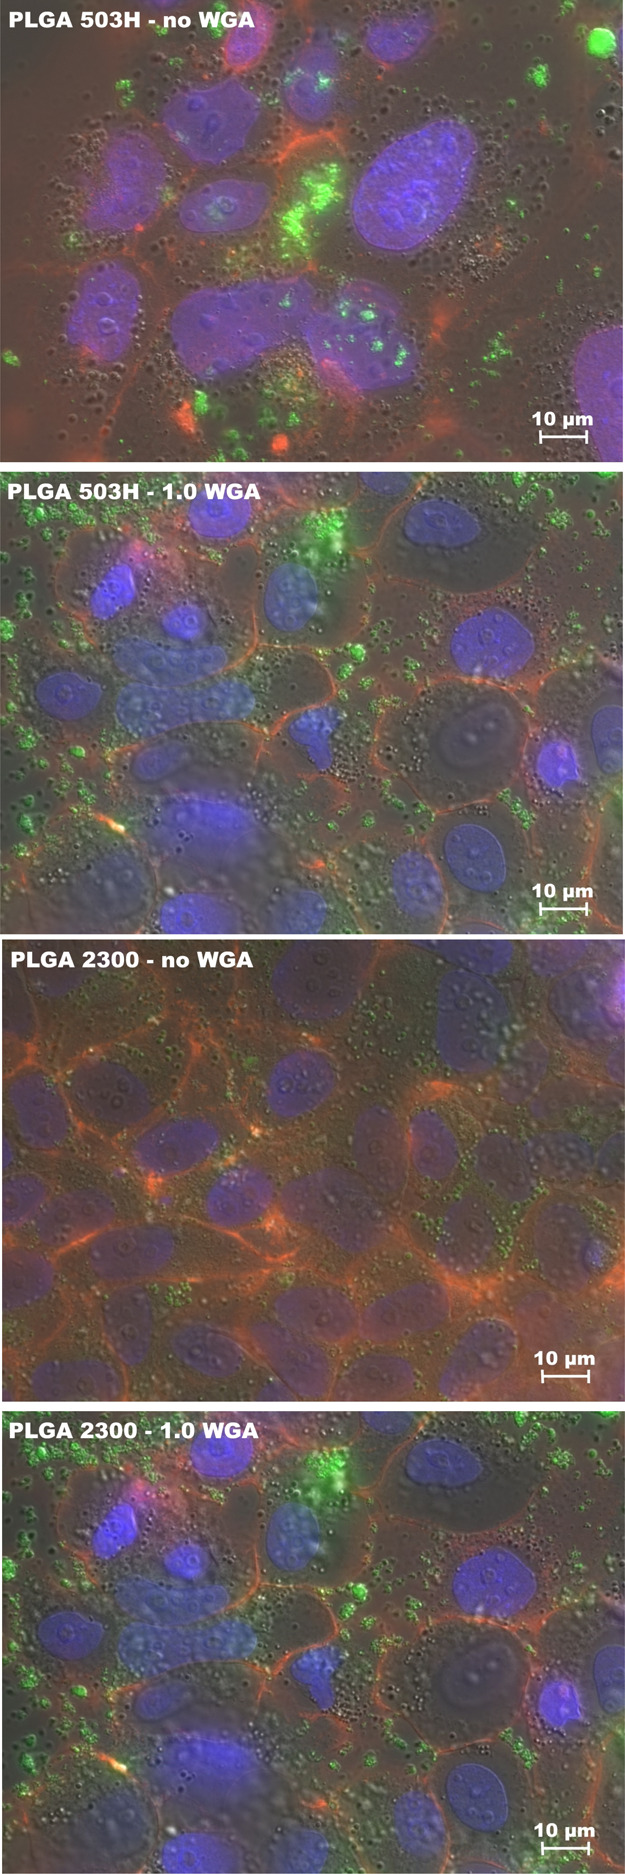
Fluorescent microscopic images of PLGA 503H and 2300 nanoparticles (green) with and without WGA. For visualization, cell membrane (red) and nucleus (blue) have been marked with fluorescent dyes.
Although the nanoparticles could be surface modified with increased amounts of WGA, the effect on cell adhesion was modest. Only PLGA 2300 yielded slightly improved adhesion because of its lectin content. Nonetheless, particles without WGA revealed good adhesion qualities, probably due to the small diameter and thus low susceptibility to hydrodynamic forces upon washing and facilitated hydrophobic interactions with the cell surface. Because of the economic factors and the innate adhesion capabilities, 1.25 mg WGA was deemed not feasible, and 0.25 mg WGA had no notable impact on adhesion. With that in mind, the following studies were carried out using 1.0 mg WGA to modify nanoparticles.
2.2. Effect of Drug Loading on the Adhesion of WGA Nanoparticles on SV-HUCs
2.2.1. Characterization of TMP-Loaded Nanoparticles
The characteristics of drug-loaded and WGA-grafted nanoparticles in use for adhesion studies are given in Table 2. Because the particle yield was not sufficient for the adhesion studies, multiple batches were mixed, as indicated by differences in size.
Table 2. Nanoparticle Batches of PLGA 503H and PLGA 2300 Loaded with TMP Used for Adhesion Studiesa.
| batch | z-avg [nm] | PDI | TMP load [%] | surface-bound WGA [μg/mgparticles] |
|---|---|---|---|---|
| 503H no TMP | 215.3 ± 0.6 | 0.089 ± 0.01 | 7.480 ± 0.05 | |
| 503H 1.5% TMP | 240.2 ± 3.1 | 0.152 ± 0.01 | 1.52 ± 0.01 | 5.230 ± 0.23 |
| 503H 19.5% TMP | 191.9 ± 1.4 | 0.154 ± 0.02 | 19.48 ± 0.01 | 5.210 ± 0.06 |
| 2300 no TMP | 390.6 ± 4.1 | 0.208 ± 0.01 | 3.348 ± 0.05 | |
| 2300 4.3% TMP | 326.7 ± 2.9 | 0.180 ± 0.01 | 4.26 ± 0.19 | 3.906 ± 0.05 |
| 2300 7.5% TMP | 286.7 ± 1.1 | 0.173 ± 0.02 | 7.50 ± 0.55 | 3.805 ± 0.10 |
Particle modification had no effect on the size and TMP load. All measurements were carried out in triplicates. All pairwise comparison (Holm–Sidak method) resulted in statistical significant differences (p ≤ 0.001) for the size, TMP load, and WGA on the surface for all batches except for WGA on the surface of 2300 4.3% TMP and 2300 7.5% TMP, which showed no significant differences (p ≥ 0.05).
PLGA 503H particles were in the size range of 190–240 nm. A loading of 1.52 and 19.48% TMP was accomplished. The smaller size of the 503H 19.5% TMP batch is due to the increased amount of dimethyl sulfoxide (DMSO) necessary for dissolution of TMP. Surface-bound WGA was comparable between the TMP batches and are similar to the results presented in Table 1. However, PLGA 503H no TMP had a 50% higher WGA amount per mass in comparison to PLGA 503H 1.5 and 19.5%.
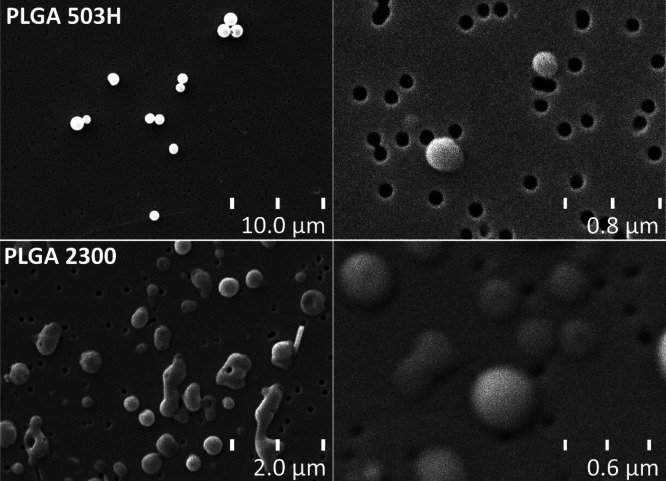
PLGA 2300 nanoparticles were generally bigger in size than the 503H spheres, and the TMP load was initially higher, while the maximum load was less than half compared with PLGA 503H. Scanning electron images showed a spherical form (Figure 3), albeit PLGA 2300 nanoparticles were damaged/melted in the process because of exposure to the electron beam. A maximum drug loading of PLGA 2300 was found to be inconsistent in our study group; therefore, we opted to use an average batch for further testing. Surface-bound WGA was consistent across the three batches.
Figure 3.
Scanning electron images of PLGA 503H and PLGA 2300 nanoparticles. PLGA 2300 nanoparticles were damaged/melted when viewed through the electron beam.
2.2.2. Adhesion Study
To evaluate the effect of TMP on cell adhesion, nanoparticles with two different amounts of TMP were compared with plain nanoparticles without any active pharmaceutical ingredient. The particles were dispersed in artificial urine and incubated with the monolayer for 60 min.
PLGA 503H nanospheres without WGA-corona (Figure 4A) displayed the highest adhesion rate when loaded with 1.5% TMP. An increase in the TMP content to 19.5% TMP resulted in no noticeable change in adhesion after four and six washing steps. On the contrary, the adhesion of WGA-grafted spheres (Figure 4B) decreased upon drug loading of the particles after two washing steps but became equal after subsequent washing steps between drug-free and drug-loaded nanoparticles (19.5% TMP).
Figure 4.
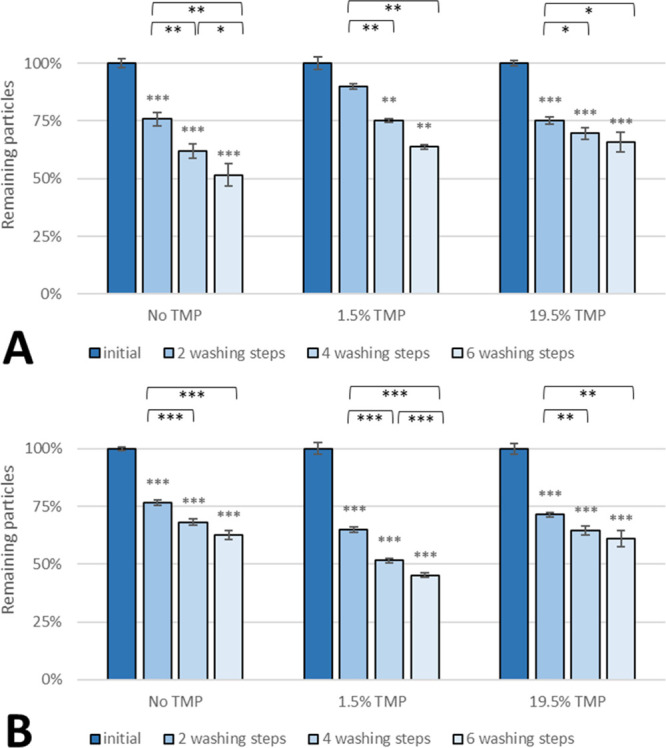
Effect of the TMP load on adhesion of (A) non-WGA and (B) WGA PLGA 503H nanoparticles on SV-HUCs. Asterisks above bars show significant p-values vs the initial particle load and brackets show statistically significant differences between washing steps [***p ≤ 0.001, **p ≤ 0.01, *p ≤ 0.05, and ns p ≥ 0.05 (n = 3)].
In general, the number of remaining PLGA 2300 non-WGA particles (Figure 5A) was comparable between drug-free nanoparticles and those loaded with 7.5% TMP after four and six washing steps. The adhesion of nanoparticles with 4.3% TMP loading was 40% lower than that of drug-free nanoparticles. Nanospheres with surface-bound WGA (Figure 5B) showed almost no difference in the adhesion rate upon loading with TMP.
Figure 5.
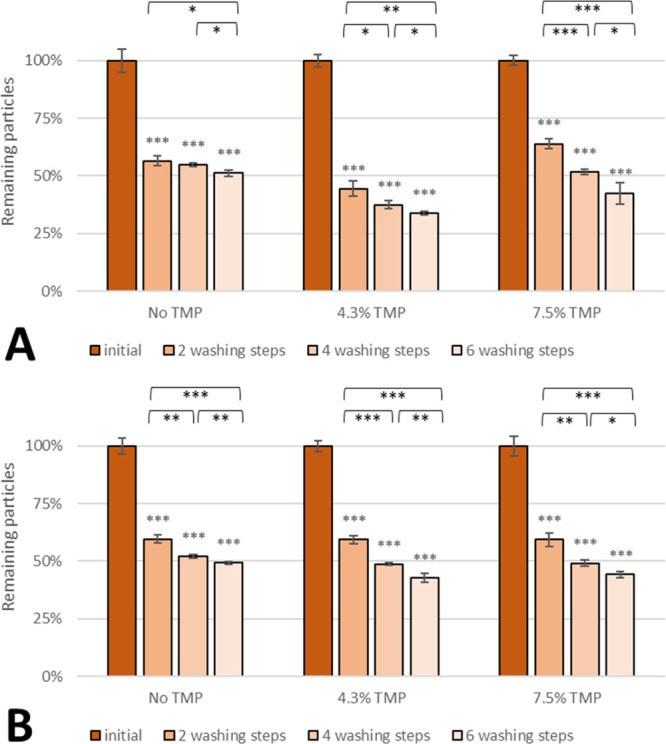
Effect of the TMP load on adhesion of (A) non-WGA and (B) WGA PLGA 2300 nanoparticles on SV-HUCs. Asterisks above bars show significant p-values vs the initial particle load and brackets show statistically significant differences between washing steps [***p ≤ 0.001, **p ≤ 0.01, *p ≤ 0.05, and ns p ≥ 0.05 (n = 3)].
Although the adhesion rates fluctuated between particles with different TMP contents, a trend was not visible. On one hand, a drug load of 1.5% might be too low as to expect a significant influence on adhesion. On the other hand, the adhesion rate of nanoparticles did not decrease upon loading with almost 20% TMP so that TMP exerts no influence on cell adhesion when incorporated in both matrices, PLGA 503H and PLGA 2300.
2.3. Effect of pH on the Adhesion of WGA Nanoparticles on SV-HUCs
To evaluate the potential suspension media, the influence of buffers with different pH levels on cell adhesion was investigated. For that purpose, standard glycine (pH 3 and 9) and sodium bicarbonate (pH 5 and 7) buffers were prepared and PLGA 503H (1.5% TMP) as well as PLGA 2300 (4.3% TMP) nanoparticles, either with or without WGA modification, were incubated with artificial urothelium for 60 min and evaluated.
At an acidic environment of pH 3, more than 80% of both non-WGA- and WGA-grafted PLGA 503H nanoparticles remained still bound on the monolayer after two washing steps as opposed to only 40–52% in the case of PLGA 2300 nanoparticles (Figure 6); however, beginning detachment of SV-HUCs was observed at this pH level. At a slightly acidic pH 5, the highest adhesion rate of all nanoparticle types amounting to 80–90% was achieved after washing twice. Raising the pH to pH 7 or to pH 9 resulted in a drop of the adhesion rate to 40–50% for all nanoparticle types.
Figure 6.
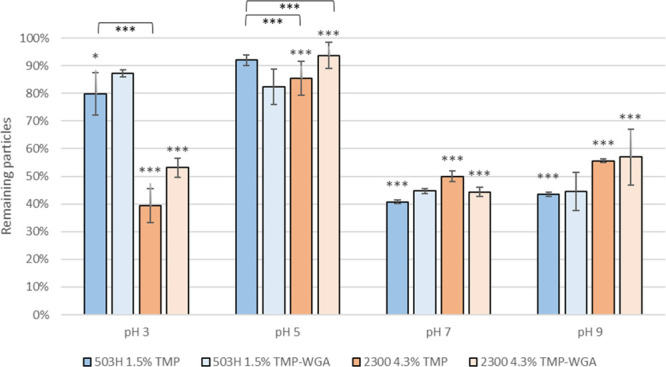
Effect of different pH levels on adhesion of TMP and WGA-TMP-nanoparticles on SV-HUCs. Remaining particles after two washing steps are depicted in graph. Asterisks above bars show significant p-values vs the initial particle load and brackets show statistically significant differences between groups (***p ≤ 0.001, **p ≤ 0.01, *p ≤ 0.05, and ns p ≥ 0.05).
Independent from the type of PLGA and surface modification, the number of adhering nanoparticles decreased by 50% at pH > 5. As WGA is generally stable over a wide pH range,21 and the dimer remains unaltered between pH 5 and 7,22 the effectiveness of WGA should not be affected. However, the adhesion rate of WGA-grafted nanoparticles was not higher than that of lectin-free ones except for PLGA 2300 at pH 3. This indicates for a higher nonspecific binding at a slightly acidic pH.
2.4. Effect of Incubation Time on the Adhesion of WGA Nanoparticles on SV-HUCs
Patients receiving intravesical treatment are usually asked to attempt retaining the treatment for 1–2 h, including repositioning quarter-hourly.23 To reduce patient discomfort, the dwelling time of TMP nanoparticles necessary to remain inside the bladder was evaluated in vitro using SV-HUC monolayers. To determine the most effective incubation time, nanoparticles were incubated with the cells for 15–60 min, and the adhering particles quantified. The suspension media was artificial urine to simulate the conditions in the bladder.
After 15 min of incubation, 40–50% of PLGA 503H particles (Figure 7A) and 30–40% PLGA 503H WGA particles (Figure 7B) adhered on the monolayer. Because of this short time frame, a large proportion of nanospheres remained in the supernatant, and only the lowest layer adhered to the cells. Prolonging the contact time to 30 min resulted in a considerable increase of adherent particles to >70% (Figure 7A,B) after two washing steps and still 50–60% after four and six washing steps. However, a further increase in the incubation time had a marginal effect. After 45 min, WGA-grafted nanospheres seemed to withstand four and six washing steps slightly better than after 30 min and 60 min of incubation without any significant advantage. Non-WGA particles showed no improvement upon longer incubation than 30 min.
Figure 7.
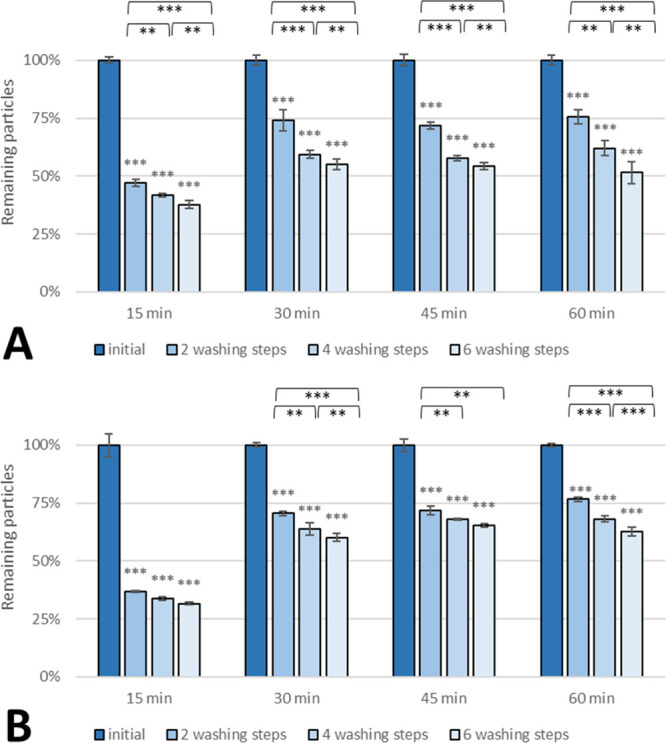
Effect of incubation time on adhesion of (A) non-WGA and (B) WGA PLGA 503H nanoparticles on SV-HUCs. Asterisks above bars show significant p-values vs the initial particle load and brackets show statistically significant differences between washing steps (***p ≤ 0.001, **p ≤ 0.01, *p ≤ 0.05, and ns p ≥ 0.05).
PLGA 2300 nanospheres showed a similar trend (Figure 8). In a similar way, 30–40% of both non-WGA (Figure 8A) and WGA nanoparticles (Figure 8B) were bound to the cell monolayer after incubation for 15 min. This amount of adhering nanoparticles was almost doubled when the incubation time was prolonged to 30 min. A further prolonged exposure did not promote adhesion but rather a slight decrease was observed. This observation might be due to diffusion of TMP and/or the fluorescent dye from the spheres into the medium. Interestingly, WGA exerted a little impact at the 30 min point increasing the remaining particles by about 10%.
Figure 8.
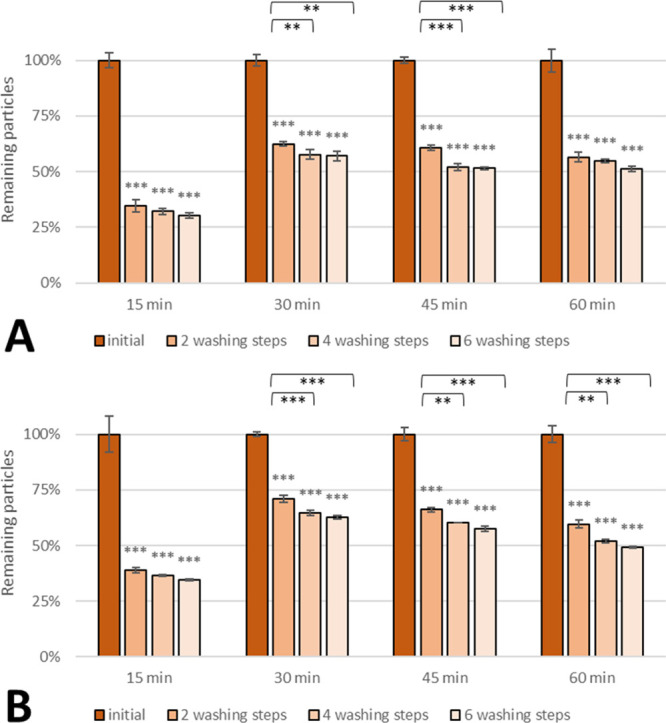
Effect of incubation time on the adhesion rate of (A) non-WGA and (B) WGA PLGA 2300 nanoparticles on SV-HUCs. Asterisks above bars show significant p-values vs the initial particle load and brackets show statistically significant differences between washing steps (***p ≤ 0.001, **p ≤ 0.01, *p ≤ 0.05, and ns p ≥ 0.05).
Nanoparticles prepared from both PLGA types showed a similar sweet spot at 30 min where about 70% of the particles added were still bound to the artificial urothelium. Surface modification of PLGA 2300 nanospheres with bioadhesive WGA modification slightly increased cell adhesion but offered no advantage in the case of PLGA 503H. Even though a patient is asked to change positions, washing steps applied in this study were more vigorous than the expected turbulence in the bladder. Therefore, this study suggests that 30 min dwelling time might be sufficient. However, in vivo testing is absolutely necessary to confirm these findings.
3. Conclusions
Both PLGA types proved to possess an inherent adhesion capability to the cell surface of SV-HUC monolayers. Because nonspecific-binding mechanisms seem to be sufficient, the utility of an additional bioadhesive ligand such as WGA is highly questionable. Considering the slight to negligible increase in adhesion and the complex as well costly surface modification, the utility of WGA for this use is economically unviable. Because the amount of the active pharmaceutical ingredient inside the nanospheres had no effect on adhesion capability, the maximum drug-loading capacity should be striven for. According to binding assays with human artificial urothelium, the nanoparticles should be administered in a suspension medium of pH 5, and a dwelling time of 30 min is sufficient when instilled into the bladder. Nevertheless, these findings need to be confirmed in vivo.
4. Materials and Methods
4.1. Materials
Uric acid was supplied by AppliChem GmbH (Darmstadt, Germany). Ethyl acetate (≥99.5%), N-(2-hydroxyethyl)piperazine-N′-ethanesulfonic acid (HEPES) (Pufferan, ≥99.5%), MES (Pufferan ≥ 99%), sodium chloride (≥99%), calcium chloride dihydrate (≥99%), 1-ethyl-3-(3-dimethylaminopropyl)carbodiimide-hydrochloride (EDAC), N-hydroxysuccinimide ≥ 99% (NHS), and disodium oxalate (≥99%) were obtained from Carl Roth GmbH + Co. KG (Karlsruhe, Germany). PLGA 503H (Resomer RG 503H) and PLGA 2300 (Resomer Sample CR Type RG 50:50 Mn 2300) were provided by Evonik Nutrition & Care GmbH (Essen, Germany). Ammonium chloride, magnesium sulfate heptahydrate, sodium bicarbonate, and monosodium phosphate monohydrate were purchased from Merck KGaA (Darmstadt, Germany). Potassium chloride (max. 0.0001% Al) was obtained from Riedel-de Haën AG (Seelze, Germany). Poloxamer 188 (Kolliphor P 188), TMP (crystallized, ≥ 99.0%; TMP), sucrose (>99.5%), urea (>99.5%), creatinine hydrochloride, trisodium citrate, sodium sulfate (≥99.0%), 0.25% (w/v) trypsin/ethylenediaminetetraacetic acid (EDTA) solution (trypsin/EDTA), disodium phosphate (98.5–101.0%), sodium chloride, and potassium phosphate monobasic were provided by Sigma-Aldrich Corporation (St. Louis, Missouri, USA). BODIPY 493/503, formic acid (98% pure), Gibco F12K nutrient mixture (1×) [+]l-glutamine, Gibco Penicillin Streptomycin (Pen/Strep), fetal calf serum (FCS), and the Micro BCA protein assay kit were purchased from Thermo Fisher Scientific (Waltham, Massachusetts, USA). HOECHST 3342 was obtained from Invitrogen (Paisley, UK). WGA was purchased from Vector Laboratories (Burlingame, CA, USA), and Alexa Fluor 594/647 conjugate of WGA was purchased from Life Technologies (Carlsbad, CA, USA). DMSO (anhydrous, max. 0.005% water) and acetonitrile (water < 30 ppm) were acquired from VWR International (Radnor, Pennsylvania, USA).
4.2. Preparation of TMP-Loaded PLGA Nanospheres
PLGA nanospheres loaded with TMP were prepared by the o/w emulsion technique applying a solvent evaporation protocol. Briefly, 60–250 mg of TMP were completely dissolved in 500–1500 μL DMSO and mixed with a solution of 400 mg PLGA in 2.48 mL ethyl acetate. To enable fluorimetric detection, 1 μg BodiPy (BP) was added. For emulsification, the PLGA–TMP–BP solution was quickly poured into 8 mL of a 2% (w/v) aqueous poloxamer-188 solution. In the case of PLGA 2300, an Ultra-Turrax T8 homogenizer (IKA-Werke GmbH & Co. KG, Staufen, Germany) set to 25,000 rpm was used to homogenize the emulsion for 5 min. For PLGA 503H, an ultrasonic homogenizer (Sonoplus HD 2070, BANDELIN Electronic GmbH & Co. KG, Berlin, Germany) set at a 70% amplitude was employed for 1 min. To facilitate solvent evaporation, the emulsion was first poured into 150 mL of a 3% (w/v) aqueous poloxamer-188 solution and stirred for 1 h using an OMNI 5000 homogenizer (Omni International, Georgia, USA). The residual solvent was removed on a rotary evaporator (Hei-VAP Core, Heidolph Instruments GmbH & Co. KG, Schwabach, Germany). Differing molecular weights required adjustment of the parameters: PLGA 2300 nanospheres were kept at 300 mbar (30 min), followed by 230 mbar (20 min) and 20 mbar (15 min). When using PLGA 503H, pressures of 130 mbar (30 min) and 20 mbar (30 min) were applied. Prior to storage or lyophilization, the nanoparticles were washed twice by repeating centrifugation (PLGA2300: 5220g, RT, 2 min and PLGA 503H 10,620g, RT, 3 min) and resuspension in either 20 mM HEPES/NaOH (pH 7.4) containing 0.1% (w/v) poloxamer-188 for storage in the suspension at 4 °C or in distilled water for lyophilization.
4.3. Surface Modification of PLGA Nanospheres with WGA
WGA was covalently bound to the free surface-oriented carboxyl groups of PLGA nanoparticles by the carbodiimide method. For that purpose, a mixture of 500 μL nanoparticle suspension (20 mg/mL), 250 μL EDAC (16 mg/mL), and 250 μL NHS (24 mg/mL) in 0.1 M MES/0.5 M NaCl (pH 6) (MES6) each was stirred for 15 min at room temperature. After centrifugation (20,816g, 4 °C, 3 min), the supernatant was discarded, and the particles resuspended in 2 mL MES6. This step was repeated twice, and the nanoparticles dispersed in 500 μL 20 mM HEPES/NaOH (pH 8) (HEPES8). After the addition of 500 μL of either distilled water (negative control) or WGA solution (0.5–8.48 mg/mL), the suspension was stirred for another 2.5 h. To remove excessive coupling reagents, the suspension was centrifuged (20,816g, 4 °C, 3 min) and washed with 2 mL HEPES8. Finally, the particles were suspended in an aqueous solution of 0.1% (w/v) poloxamer-188/2.0% (w/v) sucrose, frozen, and lyophilized.
4.4. Characterization of Nanospheres
4.4.1. Size Distribution
The Z-average and polydispersity index of nanospheres were evaluated by dynamic light scattering using a Zetasizer Nano ZS (Malvern Instruments, Malvern, UK). Nanospheres were suspended in distilled water (1 mg/mL), and 600 μL were used for analysis.
4.4.2. Scanning Electron Microscope
One drop of a nanoparticle suspension in 20 mM HEPES/NaOH (pH 7.4) with 0.1% (w/v) poloxamer-188 was placed on a 0.1 μm polycarbonate membrane filter and dried in vacuo. The samples were sputter coated with gold and examined in a FlexSEM 1000 (Hitachi High-Technologies Corporation, Tokyo, Japan) scanning electron microscope at 20 kV (accelerating voltage).
4.4.3. Quantification of the TMP Content
4.4.3.1. Sample Preparation
Lyophilized nanospheres (2.5–8.0 mg) were dissolved in 2 mL ethyl acetate. TMP was extracted by thoroughly mixing the solution with 1 mL 0.1% (v/v) aqueous formic acid. After collection of the aqueous phase, this step was repeated twice. The collected aqueous layers were lyophilized, and the lyophilisate was dissolved in 0.1 mL 0.1% (v/v) aqueous formic acid solution for analysis.
4.4.3.2. High-Performance Liquid Chromatography Analysis
High-performance liquid chromatography (HPLC) analysis was carried out using a Nexera XR (Shimadzu Corp., Kyoto, Japan) system with diode array detection of TMP set to 280 nm. A flow rate of 0.5 mL/min was used to pump 5 μL of the sample through an RP18e analytical column (Acclaim 120, Thermo Scientific, Waltham, MA, USA) at 30 °C. A linear gradient consisting of 0.1% (v/v) aqueous formic acid solution and 0.1% (v/v) formic acid in acetonitrile was applied, starting at 1 + 99 and shifting to 95 + 5 within 10 min. A calibration curve of TMP (1000–1.25 μg/mL) was prepared. According to the International Conference on Harmonisation (ICH) guidelines, limit of detection (LOD) (0.85 μg/mL) and limit of quantification (LOQ) (2.57 μg/mL) were calculated based on the standard deviation of the regression line.
4.5. Quantification of WGA
WGA was quantified by the Micro BCA protein assay kit (Thermo Scientific, Waltham, Massachusetts, USA). A solution of 50% micro BCA reagent, 48% micro BCA reagent MB, and 2% micro BCA reagent MC was used as a working reagent. Nanoparticles (3.00 mg) were completely dissolved in 500 μL 1 M NaOH and neutralized with 500 μL 1 M HCl. In a 96-well microplate, 150 μL of dissolved particles were mixed with 150 μL of the working reagent and sealed. After 30 s of radial shaking and 2 h incubation at 37 °C, the absorption was determined in a microplate reader (Infinite M200 Pro, TECAN, Männedorf, Switzerland) at 562 nm. For quantification, a calibration curve of WGA was prepared (20–0.1 μg/mL), and the LOD (0.31 μg/mL) and LOQ (0.92 μg/mL) were calculated, according to the ICH guidelines.
4.6. Cell Culture
4.6.1. Cultivation of SV-HUCs
SV-HUCs were obtained from American Type Culture Collection (Rockville, USA) and used between passages 30 and 50. The media used for cultivation of the SV-HUC cell line was Gibco Ham’s F-12K with 146 mg l-glutamine, 10 mL Pen/Strep, and 100 mL FCS. Cells were cultivated at 37 °C in a 5% CO2/95% air atmosphere and 95% relative humidity. The cells were subcultivated with trypsin/EDTA at 80–90% confluency and seeded (3,260,000 cells/mL) into 75 cm2 cell culture flasks.
4.6.2. Cultivating SV-HUC Monolayers
SV-HUC monolayers were seeded into 96-well microplates at a density of 17,000 cells/well. Cells were cultivated for 7–8 days until 100% confluency was reached and then used for binding assays.
4.7. Microscopic Analysis
For microscopic analysis of nanoparticles on an SV-HUC monolayer, cell media was removed, and the cell layer was washed with 100 μL of phosphate-buffered saline (PBS) (pH 7.4). A 2 mg/mL particle suspension (50 μL) in PBS (pH 7.4) and, for better visualization, 1 μL of HOECHST 33342 (1 mg/mL) to stain nuclei was added and incubated for 30 min at 4 °C. The cell membrane was stained using 5 μL of Alexa Fluor 594/647-labeled WGA with 30 min of incubation. After two washing steps with 100 μL PBS, the cells were fixed for 10 min at 4 °C with paraformaldehyde in PBS. To inactivate nonreacted paraformaldehyde, the cells were incubated for 10 min at 4 °C after the addition of 50 mM ammonium chloride. After two final washing steps with PBS, microscopic analysis was carried out using a Zeiss Axio Observer.Z1 microscopy system (Carl Zeiss, Oberkochen, Germany).
4.8. Binding Assay of Nanospheres to SV-HUC Monolayers
To evaluate the cell adhesion of WGA-modified particles, binding studies were performed on 100% confluent SV-HUC monolayers, which was verified microscopically. First, the cell media was removed and replaced by adding 100 μL of artificial urine (pH 7), 0.1 M glycine/HCl (pH 3), 66.67 mM Na2HPO4/KH2PO4 (pH 5 or 7), or 0.1 M glycine/NaOH (pH 9). After 5 min of incubation at 37 °C under agitation in a microplate reader (Infinite M200 Pro, TECAN, Männedorf, Switzerland), this step was repeated. The relative fluorescence intensity of the blank was determined at 485 nm/525 nm (exc/em). After removal of the supernatant, 100 μL nanoparticle suspension (2 mg/mL WGA-modified and nonmodified as a negative control) in the respective buffer was added to a set of three wells for each measuring point (0, 2, 4, and 6 washing steps). The particle suspension was incubated for 15–60 min at 37 °C. The first measurement was taken directly after incubation to determine the maximum particle amount on the cells (100% remaining). Further measurements were taken after 2–6 washing steps with the respective buffer. The results are displayed as percent remaining in comparison to the maximum amount determined earlier.
4.9. Statistical Analysis
Statistical analysis was carried out with SigmaPlot 13 (Systat Software Inc., San Jose, Ca, USA). All data are presented as mean ± standard deviation and were acquired in triplicates. Groups were compared using the t-test and one-way ANOVA. P values ≤0.05 were considered statistically significant.
Acknowledgments
Authors would like to thank Evonik Nutrition & Care GmbH (Dr. K. Manhardt, Germany) for providing gift samples of polymers. We acknowledge the support of this study by the infrastructure provided by the Core Facility Campus Krems, with special thanks to Dr. Stephan Harm and Dr. Jens Hartmann for the support with the SEM. Open access funding was provided by the University of Vienna. This research did not receive any other specific grant from funding agencies in the public, commercial, or not-for-profit sectors.
Glossary
Abbreviations
- UTI
urinary tract infection
- IBC
intracellular bacterial community
- WGA
wheat germ agglutinin
- PLGA
poly(d,l-lactic-co-glycolic acid)
- TMP
trimethoprim
- BP
BodiPy
The authors declare no competing financial interest.
References
- Kennedy J. L.; Haberling D. L.; Huang C. C.; Lessa F. C.; Lucero D. E.; Daskalakis D. C.; Vora N. M. Infectious Disease Hospitalizations: United States, 2001 to 2014. Chest 2019, 156, 255–268. 10.1016/j.chest.2019.04.013. [DOI] [PMC free article] [PubMed] [Google Scholar]
- Foxman B. Urinary Tract Infection Syndromes. Occurrence, Recurrence, Bacteriology, Risk Factors, and Disease Burden. Infect. Dis. Clin. 2014, 28, 1–13. 10.1016/j.idc.2013.09.003. [DOI] [PubMed] [Google Scholar]
- Gupta K.; Grigoryan L.; Trautner B. Urinary Tract Infection. Ann. Intern. Med. 2017, 167, ITC49. 10.7326/aitc201710030. [DOI] [PubMed] [Google Scholar]
- Naber K. G.; Schito G.; Botto H.; Palou J.; Mazzei T. Surveillance Study in Europe and Brazil on Clinical Aspects and Antimicrobial Resistance Epidemiology in Females with Cystitis (ARESC): Implications for Empiric Therapy. Eur. Urol. 2008, 54, 1164–1178. 10.1016/j.eururo.2008.05.010. [DOI] [PubMed] [Google Scholar]
- Grabe M.; Bishop M.; Bjerklund-Johansen T.; Botto H.; Çek M.; Lobel B.; Naber K.; Palou J.; Tenke P.. The Management of Urinary and Male Genital Tract Infections; European Association of Urology, 2008. [DOI] [PubMed] [Google Scholar]
- Krogfelt K. A.; Bergmans H.; Klemm P. Direct Evidence That the FimH Protein Is the Mannose-Specific Adhesion of Escherichia Coli Type 1 Fimbriae. Infect. Immun. 1990, 58, 1995–1998. 10.1128/iai.58.6.1995-1998.1990. [DOI] [PMC free article] [PubMed] [Google Scholar]
- Mulvey M. A.; Schilling J. D.; Hultgren S. J. Establishment of a Persistent Escherichia Coli Reservoir during the Acute Phase of a Bladder Infection. Infect. Immun. 2001, 69, 4572–4579. 10.1128/iai.69.7.4572-4579.2001. [DOI] [PMC free article] [PubMed] [Google Scholar]
- Anderson G.; Dodson K.; Hooton T.; Hultgren S. Intracellular Bacterial Communities of Uropathogenic Escherichia Coli in Urinary Tract Pathogenesis. Trends Microbiol. 2004, 12, 424–430. 10.1016/j.tim.2004.07.005. [DOI] [PubMed] [Google Scholar]
- Hooton T. M. Uncomplicated Urinary Tract Infection. N. Engl. J. Med. 2012, 366, 1028–1037. 10.1056/nejmcp1104429. [DOI] [PubMed] [Google Scholar]
- Waller T. A.; Pantin S. A. L.; Yenior A. L.; Pujalte G. G. A. Urinary Tract Infection Antibiotic Resistance in the United States. Prim. Care Clin. Off. Pract. 2018, 45, 455–466. 10.1016/j.pop.2018.05.005. [DOI] [PubMed] [Google Scholar]
- Pietropaolo A.; Jones P.; Moors M.; Birch B.; Somani B. K. Use and Effectiveness of Antimicrobial Intravesical Treatment for Prophylaxis and Treatment of Recurrent Urinary Tract Infections (UTIs): A Systematic Review. Curr. Urol. Rep. 2018, 19, 78. 10.1007/s11934-018-0834-8. [DOI] [PMC free article] [PubMed] [Google Scholar]
- Chou R.; Selph S.; Buckley D. I.; Fu R.; Griffin J. C.; Grusing S.; Gore J. L. Intravesical Therapy for the Treatment of Nonmuscle Invasive Bladder Cancer: A Systematic Review and Meta-Analysis. J. Urol. 2017, 197, 1189–1199. 10.1016/j.juro.2016.12.090. [DOI] [PubMed] [Google Scholar]
- Nirmal J.; Chuang Y.-C.; Tyagi P.; Chancellor M. B. Intravesical Therapy for Lower Urinary Tract Symptoms. Urol. Sci. 2012, 23, 70–77. 10.1016/j.urols.2012.07.005. [DOI] [Google Scholar]
- Zacchè M. M.; Srikrishna S.; Cardozo L. Novel Targeted Bladder Drug-Delivery Systems: A Review. Res. Rep. Urol. 2015, 7, 169–178. 10.2147/rru.s56168. [DOI] [PMC free article] [PubMed] [Google Scholar]
- Pichl C. M.; Dunkl B.; Brauner B.; Gabor F.; Wirth M.; Neutsch L.. Biomimickry of UPEC Cytoinvasion: A Novel Concept for Improved Drug Delivery in UTI. 2016,5 .16. 10.3390/pathogens5010016. [DOI] [PMC free article] [PubMed] [Google Scholar]
- Neutsch L.; Plattner V. E.; Polster-Wildhofen S.; Zidar A.; Chott A.; Borchard G.; Zechner O.; Gabor F.; Wirth M. Lectin-Mediated Biorecognition as a Novel Strategy for Targeted Delivery to Bladder Cancer. J. Urol. 2011, 186, 1481–1488. 10.1016/j.juro.2011.05.040. [DOI] [PubMed] [Google Scholar]
- Neutsch L.; Wambacher M.; Wirth E.-M.; Spijker S.; Kählig H.; Wirth M.; Gabor F. UPEC Biomimickry at the Urothelial Barrier: Lectin-Functionalized PLGA Microparticles for Improved Intravesical Chemotherapy. Int. J. Pharm. 2013, 450, 163–176. 10.1016/j.ijpharm.2013.04.058. [DOI] [PubMed] [Google Scholar]
- Danhier F.; Ansorena E.; Silva J. M.; Coco R.; Le Breton A.; Préat V. PLGA-Based Nanoparticles: An Overview of Biomedical Applications. J. Controlled Release 2012, 161, 505–522. 10.1016/j.jconrel.2012.01.043. [DOI] [PubMed] [Google Scholar]
- Prajapati V. D.; Jani G. K.; Kapadia J. R.; Scholar M. Current Knowledge on Biodegradable Microspheres in Drug Delivery. Expet Opin. Drug Deliv. 2015, 12, 1283–1299. 10.1517/17425247.2015.1015985. [DOI] [PubMed] [Google Scholar]
- Makadia H. K.; Siegel S. J. Poly Lactic-Co-Glycolic Acid (PLGA) as Biodegradable Controlled Drug Delivery Carrier. Polymers 2011, 3, 1377–1397. 10.3390/polym3031377. [DOI] [PMC free article] [PubMed] [Google Scholar]
- Nagata Y.; Burger M. M. Wheat Germ Agglutinin. Molecular Characteristics and Specificity for Sugar Binding. J. Biol. Chem. 1974, 249, 3116–3122. [PubMed] [Google Scholar]
- Portillo-Téllez M. d. C.; Bello M.; Salcedo G.; Gutiérrez G.; Gómez-Vidales V.; García-Hernández E. Folding and Homodimerization of Wheat Germ Agglutinin. Biophys. J. 2011, 101, 1423–1431. 10.1016/j.bpj.2011.07.037. [DOI] [PMC free article] [PubMed] [Google Scholar]
- American Urological Association . Intravesical Administration of Therapeutic Medication, https://www.auanet.org/guidelines/intravesical-administration-of-therapeutic-medication (accessed Apr 10, 2020).


