

Abstract
Aims
Amyotrophic lateral sclerosis (ALS) is a chronic neurodegenerative disease characterized by progressive loss of motor neurons, muscle weakness, spasticity, paralysis and death usually within 2–5 years of onset. Neuroinflammation is a hallmark of ALS pathology characterized by activation of glial cells, which respond by upregulating small heat shock proteins (HSPBs), but the exact underlying pathological mechanisms are still largely unknown. Here, we investigated the association between ALS disease duration, lower motor neuron loss, TARDNA‐binding protein 43 (TDP‐43) pathology, neuroinflammation and HSPB expression.
Methods
With immunohistochemistry, we examined HSPB1, HSPB5, HSPB6, HSPB8 and HSP16.2 expression in cervical, thoracic and sacral spinal cord regions in 12 ALS cases, seven with short disease duration (SDD), five with moderate disease duration (MDD), and ten age‐matched controls. Expression was quantified using ImageJ to examine HSP expression, motor neuron numbers, microglial and astrocyte density and phosphorylated TDP‐43 (pTDP‐43+) inclusions.
Results
SDD was associated with elevated HSPB5 and 8 expression in lateral tract astrocytes, while HSP16.2 expression was increased in astrocytes in MDD cases. SDD cases had higher numbers of motor neurons and microglial activation than MDD cases, but similar levels of motor neurons with pTDP‐43+ inclusions.
Conclusions
Increased expression of several HSPBs in lateral column astrocytes suggests that astrocytes play a role in the pathogenesis of ALS. SDD is associated with increased microgliosis, HSPB5 and 8 expression in astrocytes, and only minor changes in motor neuron loss. This suggests that the interaction between motor neurons, microglia and astrocytes determines neuronal fate and functional decline in ALS.
Keywords: amyotrophic lateral sclerosis, astrocytes, HSPB, inflammation, small heat shock proteins, TDP‐43 pathology
Introduction
Amyotrophic lateral sclerosis (ALS) is a progressive neurological disorder in which motor neurons in the motor cortex, brainstem and spinal cord degenerate, leading to spasticity, muscle weakness and atrophy 1. The onset of ALS is primarily diagnosed between 55 and 75 years of age 2 and characterized by focal motor deficits that rapidly accumulate, often resulting in paralysis and death due to respiratory failure within 2–5 years 3.
The majority of ALS cases are sporadic, although genetic mutations are associated with familial forms of the disease in 5–10% of cases 1. Virtually all these mutations affect genes involved in protein homoeostasis (proteostasis) 4. Although the exact cause of ALS is unknown, defects in proteostasis may play an important role in disease pathogenesis leading to the formation of toxic aggregates 5.
In response to increased or dysfunctional proteostasis, cells upregulate heat shock proteins (HSPs) to protect against cellular damage that accumulates during pathological conditions 6. HSPs are also upregulated after cellular stress, including heat, hypoxia, inflammation and oxidative stress 7. Given the strong association between protein aggregation, glial activation and neurodegeneration, the expression and role of HSPs in the central nervous system (CNS) is attracting attention in many neurodegenerative disorders 8, especially as studies show that HSPs can potentially act as neuroprotective agents 9. HSPs are classified into several families, including the large HSPA (HSP70) and HSPD1 (HSP60) and the small heat shock proteins (HSPBs) 10. Several HSPs are constitutively expressed in the CNS while others are only observed in pathological conditions such as in Alzheimer's disease, Parkinson's disease, Alexander's disease, multiple sclerosis and X‐linked adrenoleucodystrophy 11, 12, 13, 14, 15.
HSPBs are a family of 11 highly conserved proteins that act as molecular chaperones and cytoskeleton stabilizers, exerting protective effects by reducing protein misfolding and promoting degradation of misfolded proteins 16. The role of HSPBs in neurodegenerative disorders is supported by studies showing that mutations in HSPB1, 3, 5 and 8 are associated with distal hereditary motor neuropathies and myofibrillar myopathies characterized by protein inclusions 17. In vitro, HSPB1, 5 and 8 prevent superoxide dismutase (SOD1) and TARDNA‐binding protein 43 (TDP‐43) aggregation by promoting degradation and solubility 18, 19. In vivo, experimental induction of an HSPB5/8 homologue partially rescues TDP‐43 aggregation and increases life span in drosophila 20. In support of a protective role of HSPB in animal models of ALS, slow‐progressing SOD1G93A mice have fivefold higher expression of HSPB5 when compared to fast‐progressing SOD1G93A mice 21.
Apart from their roles as molecular chaperones, small HSPs also inhibit apoptosis and play key roles in immune regulatory pathways 22, 23. For example, HSPB5 induces an anti‐inflammatory phenotype in microglia and macrophages in vitro that switches to a pro‐inflammatory response in the presence of IFN‐γ 24.
Initial results of a recent clinical trial suggest that arimoclomol, an inducer of the heat shock response, might slow progression and respiratory decline in ALS patients 4. While many studies hint at the protective effects of HSPBs in neuroinflammatory diseases including ALS, little is known about HSPB expression, and how such expression is associated with motor neuron damage and glial activation in ALS.
In this study, we compared HSPB1, 5, 6, 8 and orphan small heat shock protein HSP16.2 25 expression in spinal cords of non‐neurological controls and ALS patients with short disease duration (SDD) and moderate disease duration (MDD). We show that HSPB expression by motor neurons and astrocytes is altered in ALS and that HSPB expression is associated with ALS disease duration.
Materials and methods
Spinal cord samples
Formalin‐fixed, paraffin‐embedded spinal cord tissue from 12 ALS cases (mean age = 65.8 years), 7 SDD (<18 months survival; mean survival = 11.1 ± 3.4 months) and 5 MDD (>24 months survival; mean survival = 62.8 ± 33.8 months) and 10 non‐neurological controls (mean age = 64.9 years) was collected at post mortem in the pathology department of the Academic Medical Center (University of Amsterdam), with the approval of the AMC Medical Ethical Committee and according to local legal and ethical regulations. Patients or relatives gave informed consent for autopsy and use of spinal cord tissue for research purposes. Tissue samples from cervical levels (1 sample per case), thoracic (two samples per case – except for cases 5 and 18 where one sample was available) and lumbar (one sample per case) were examined. Patient characteristics are listed in Table 1. Genetic analysis for 235 common mutations implicated in ALS revealed one case with a valosin‐containing protein mutation (case 8); and a C9ORF72 repeat expansion was detected in one case (case 12).
Table 1.
Patient characteristics
| Sex | Age | ALS form or NNC details | Primary onset | ALS DD (months) | Cause of death | PMD (h) | |
|---|---|---|---|---|---|---|---|
| ALS | |||||||
| 1 | F | 70 | sALS | Leg | 6 (SDD) | Respiratory failure | 3:05 |
| 2 | M | 63 | sALS | Leg | 7 (SDD) | Respiratory failure | <12 |
| 3 | F | 61 | sALS | Arm | 12 (SDD) | Euthanasia | <12 |
| 4 | M | 60 | sALS | Arm | 12 (SDD) | Euthanasia | <12 |
| 5 | M | 81 | sALS | Respiratory | 12 (SDD) | Respiratory failure | <12 |
| 6 | F | 84 | sALS | Bulbar | 13 (SDD) | Euthanasia | <12 |
| 7 | F | 56 | sALS | Leg | 16 (SDD) | Euthanasia | <12 |
| 8 | F | 61 | sALS (VCP mutation) | Arm | 27 (MDD) | Euthanasia | <12 |
| 9 | M | 43 | sALS | Arm | 36 (MDD) | Unknown | <12 |
| 10 | F | 64 | fALS | Leg | 57 (MDD) | Pneumonia | <12 |
| 11 | M | 68 | sALS | Arm | 87 (MDD) | Euthanasia | <12 |
| 12 | M | 79 | sALS (C9orf72 repeat expansion) | Unknown | 107 (MDD) | Pneumonia | <12 |
| Controls | |||||||
| 13 | M | 60 | BRICKER bladder | n.a. | n.a. | Lung embolism | <24 |
| 14 | M | 63 | Renal carcinoma | n.a. | n.a. | Lung embolism | <24 |
| 15 | F | 81 | Cardiac ischemia | n.a. | n.a. | Endocarditis | <24 |
| 16 | F | 63 | Adenocarcinoma | n.a. | n.a. | Paralytic ileus | <24 |
| 17 | M | 69 | Oesophageal carcinoma | n.a. | n.a. | Multi organ failure | <24 |
| 18 | F | 78 | Cholangiocarcinoma | n.a. | n.a. | Multi organ failure | <48 |
| 19 | M | 75 | COPD, pneumonia | n.a. | n.a. | Respiratory failure | <24 |
| 20 | F | 59 | Pleuritis carcinomatosa | n.a. | n.a. | Respiratory failure | <24 |
| 21 | F | 47 | Pancreatic carcinoma | n.a. | n.a. | Abdominal bleeding | <12 |
| 22 | F | 54 | Carcinoma of the gallbladder | n.a. | n.a. | Acute heart failure | <24 |
COPD, chronic obstructive pulmonary disease; ALS, amyotrophic lateral sclerosis; fALS, familial ALS; n.a., not applicable; NNC, non‐neurological controls; PMD, post mortem delay; MDD, moderate disease duration; sALS, sporadic ALS; SDD, short disease duration; VCP, valosin‐containing protein.
Immunohistochemistry
Paraffin sections were deparaffinized with xylene, rehydrated in graded ethanol solutions and washed in water. Endogenous peroxidase was blocked by incubating the slides in phosphate‐buffered saline (PBS) containing 0.3% (v/v) hydrogen peroxide for 30 min. After washing in PBS, heat‐mediated antigen retrieval was performed using either 0.01 M citrate buffer (pH 6) or ethylene diamine tetra‐acetic acid buffer (pH 9). After cooling and washing in PBS, slides were incubated for 1 h or overnight with primary antibodies (Table S1) directed to phosphorylated TDP‐43 (pTDP‐43), human leucocyte antigen receptor D related (HLA‐DR), glial fibrillary acid protein (GFAP), aldehyde dehydrogenase 1 (ALDH1), vimentin, HSPB1, HSPB5, HSPB6, HSPB8 and HSP16.2 (Table S1) diluted in normal antibody diluent (Immunologic), at room temperature. Sections were washed and incubated with the secondary antibody (Table S1): goat‐anti‐mouse horseradish peroxidase (HRP) Envision (Dako, Glostrup, Denmark) for HSPB5 and goat‐anti‐rabbit HRP Envision (Dako) for other HSPBs. After washing with PBS, the staining was developed with 3,3′‐diaminobenzidine (DAB; Dako) at a 1:50 concentration for 10 min. Slides were washed in tap water, the nuclei counterstained with haematoxylin and sections dehydrated in ascending alcohol concentrations and xylene, and mounted with Quick‐D (Klinipath, Olen, Belgium). Prior to the study, all the antibodies and relevant isotype controls 14 were used to check background and cross reactivity. Isotype controls did not reveal background staining.
pTDP‐43 and cresyl‐violet staining
To identify motor neurons expressing pTDP‐43 aggregates spinal cord sections were stained with an antibody directed to pTDP‐43 (Table S1) as described above. After development with DAB, sections were incubated overnight with 1% cresyl‐violet solution, washed and dehydrated in ascending alcohol concentrations and xylene, then mounted with Quick‐D (Klinipath).
Double labelling
To identify cells expressing HSPBs, double labelling was performed for HLA‐DR (microglia), oligodendrocyte transcription factor 2 (olig2) (oligodendrocytes) or vimentin (astrocytes). Sections were stained with HSPs as described above and after developing with DAB, the slides were washed and incubated with the second primary antibody for 1 h or overnight (Table S1). When primary antibodies were from the same species, the antibody directed to the first antigen of choice was detached by heating in citrate buffer for 15 min. After washing, the appropriate secondary antibody, goat‐anti‐mouse alkaline phosphatase (AP) or goat‐anti‐rabbit AP (Table S1), was applied for 1 h. After washing twice with PBS and once with tris‐buffered saline, slides were developed with liquid permanent red (LPR; Dako; 1:100) for 10 min. Slides were washed in tap water and nuclei were counterstained with haematoxylin, washed in water and mounted with Aquatex (Merck Millipore, Darmstadt, Germany). Following omission of primary antibodies, no staining was observed.
Quantitative and statistical analysis
Motor neuron and pTDP‐43 pathology quantification
Spinal cord sections, immunostained for pTDP‐43 and Harris’ haematoxylin, were digitalized using the Mirax slide scanner system equipped with a 20× objective with a numerical aperture of 0.75 (3DHISTECH, Budapest, Hungary) and Sony DFW‐X710 Fire Wire 1/3″ type progressive SCAN IT CCD (pixel size: 4.65 × 4.65 μm2). The scan resolution of all images at 20× was 0.23 μm. After scanning, representative areas were annotated manually by a blinded observer (RPG) using pannoramic viewer software (3DHISTECH) and subsequently exported in the TIFF image format. To determine the numbers of motor neurons and motor neurons containing TDP‐43 pathology, a second blinded observer (JS) manually counted the defined areas using ImageJ (Fiji; {HYPERLINK ‘https://fiji.sc’}) 26.
HLA‐DR, GFAP, ALDH1, vimentin and HSP expression quantification
The extent of HLA‐DR, GFAP, ALDH1, vimentin and HSP expression in the lateral tracts and ventral horns was assessed using ImageJ. Three pictures of the left and right ventral horns and lateral corticospinal tracts at each spinal cord level (cervical, thoracic [2×], lumbar) were taken by a blinded observer (RPG) at 400× magnification using an Olympus BX41 microscope equipped with a Leica MC170 HD camera (Leica Microsystems, Heidelberg, Germany). Pictures were analysed using imagej software to calculate the percentage of DAB+ pixels per image. Arbitrary thresholds were set to eliminate background expression. Next, brown DAB staining was separated from blue haematoxylin staining and the percentage of DAB+ area was determined using the macro supplied (Appendix S1). Mean values were calculated from three images per sample. Vimentin and ALDH1 expression was mostly seen in astrocytes, but also to a lesser extent in cells that morphologically resembled foamy macrophages. To only quantify astrocyte reactivity, ImageJ was used to manually remove these cells based on morphology prior to quantification.
Statistical analysis
Using graphpad prism 6 (GraphPad Software, La Jolla, CA, USA; https://www.graphpad.com/scientific-software/prism/), motor neuron numbers, ventral horn surface area, absolute numbers of TDP‐43+ motor neurons, fraction of motor neurons which are TDP‐43+ as well as HLA‐DR, GFAP, ALDH1, vimentin and HSP expression in the lateral tracts and ventral horns was examined. The expression levels of the separate spinal cord levels (one cervical, one to two thoracic, one lumbar) were averaged resulting in mean values for each case. Data were checked for normal distribution and parametric or non‐parametric tests were used accordingly. Differences between ALS patients and controls were evaluated using Student's t‐test or Mann‐Whitney U‐test. Differences between the subgroups with SDD and MDD and controls were determined using analysis of variance or Kruskal–Wallis H test. When P < 0.05 post hoc analysis was performed using Tukey's test or Dunn's multiple comparisons test.
Results
Short ALS disease duration is associated with pTDP‐43 pathology and activated microglia but not motor neuron loss
Spinal cords of ALS patients (SDD and MDD) and non‐neurological controls were characterized based on motor neuron counts (Figure 1 A), ventral horn surface area (Figure 1 B), TDP‐43 pathology (Figure 1 C,D) and HLA‐DR reactivity (Figure 1 L,P). Compared to non‐neurological controls, ALS spinal cords contained fewer motor neurons (−26.4%; P = 0.0172; Figure 1 A), but more pTDP‐43 pathology (+2406%; P < 0.0001; Figure 1 C,D). In patients with SDD, ventral horn motor neuron numbers were not significantly lower (−14.4%; P = 0.1906; Figure 1 A), and a significant number of neurons were pTDP‐43+ (+3001%; P = 0.0001; Figure 1 C). In the pTDP‐43+ motor neurons, the inclusions were observed as round balls or smaller string‐like aggregates (Figure 1 E,F). Motor neuron numbers (−43.1%; P = 0.0052; Figure 1 A) and ventral horn surface area (−38.4%; P = 0.0067; Figure 1 B) were significantly decreased in patients with MDD. Ventral horn surface area was significantly lower in MDD compared to SDD (P = 0.0314; Figure 1 B). The few remaining motor neurons in MDD cases appeared dystrophic and often contained extensive pTDP‐43 inclusions (Figure 1 G,H). In both SDD and MDD cases, approximately 25% of motor neurons were pTDP‐43+ (Figure 1 D).
Figure 1.
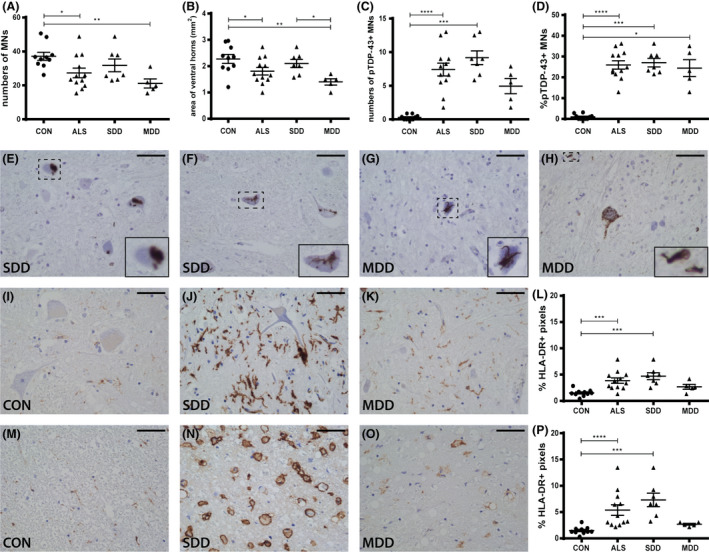
Motor neurons, pTDP‐43 inclusions and microglial activation in ALS spinal cord. Quantification of (A) motor neuron counts, (B) ventral horn surface, (C) number of pTDP‐43+ inclusions and (D) percentage of pTDP‐43+ inclusion containing motor neurons in controls and ALS patients (subgroups: SDD and MDD). pTDP‐43+ motor neurons in ALS patients with (E,F) SDD and (G,H) MDD. HLA‐DR expression in (I–K) ventral horns and (M–O) lateral tracts of controls and SDD and MDD patients. Quantification of HLA‐DR+ pixels in (L) ventral horns and (P) lateral tracts of controls and ALS patients (subgroups: SDD and MDD). Data points represent the mean value for each patient. Data are shown as mean ± SEM. Significance was analysed between ALS patients (n = 12) and controls (n = 10) with Student's t‐test or Mann–Whitney U‐test. ALS patients SDD (n = 7) and MDD (n = 5) were compared to controls (n = 10) using anova and Tukey's post‐test or Kruskal–Wallis H test and Dunn's post hoc multiple comparisons test. Significant data are presented (****P = <0.0001, ***P = <0.001, **<0.01, *P = <0.05). Scale bar in all pictures = 50 μm. Inserts are digitally enlarged. SDD, short disease duration; MDD, moderate disease duration; ALS, amyotrophic lateral sclerosis; HLA‐DR, human leucocyte antigen‐D related; TDP, TARDNA‐binding protein; pTDP‐43, phosphorylated TDP.
HLA‐DR expression as a marker of microglia and macrophage activity (Figure 1 L–P) revealed significantly higher expression in the ventral horns (+212%; P < 0.0001; Figure 1 L) and lateral tracts (+392%; P = 0.0009; Figure 1 P) in SDD cases, but not in MDD cases. Sparse HLA‐DR+ cells were present and the surrounding tissue appeared fibrotic (Figure 1 O). HLA‐DR+ foamy cells were only observed in white matter and predominantly in patients with SDD (Figure 1 N).
Increased astrocyte reactivity in ventral horns in ALS
To assess astrocyte reactivity, the expression of astrocyte markers vimentin, GFAP and ALDH1 was compared between ALS cases (SDD and MDD) and controls (Figure 2). The expression of vimentin was significantly increased in ALS cases in the ventral horns (Figure 2 A–D; ALS P = 0.0009; SDD P = 0.0251; MDD P = 0.0042) and lateral columns (Figure 2 E–H; ALS P = 0.0003; SDD P = 0.0144; MDD P = 0.0177) compared to controls. An increased density of GFAP in the ventral horns in ALS cases (P = 0.0272) and specifically in those cases with moderate (P = 0.0218) but not SDD (P = 0.2648) was observed (Figure 2 I–L), but no differences in expression were found in the lateral tracts (Figure 2 M–P). Similarly, the density of ALDH1 was also increased in ALS cases (P = 0.0105) and in cases with MDD (P = 0.0021) but not SDD (P = 0.3026) in the ventral horns (Figure 2 Q–T), but not in the lateral columns (Figure 2 U–X).
Figure 2.
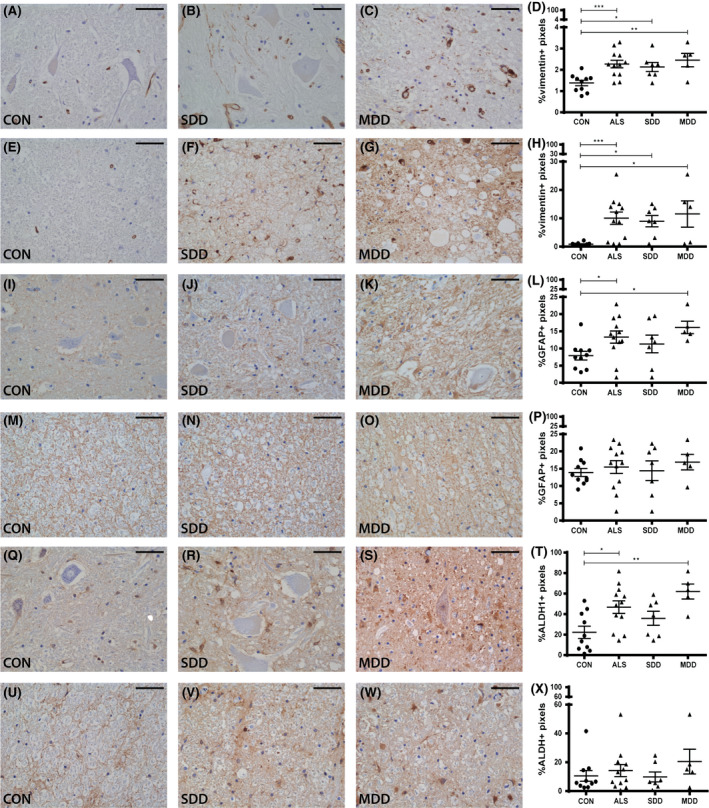
Astrocyte reactivity in ALS spinal cord. Expression (A–C) and quantification (D) of vimentin+ pixels in ventral horns of controls and ALS patients (subgroups: SDD and MDD). Expression (E–G) and quantification (H) of vimentin+ pixels in lateral columns of controls and ALS patients (subgroups: SDD and MDD). Expression (I–K) and quantification (L) of GFAP+ pixels in ventral horns of controls and ALS patients (subgroups: SDD and MDD). Expression (M–O) and quantification (P) of GFAP+ pixels in lateral columns of controls and ALS patients (subgroups: SDD and MDD). Expression (Q–S) and quantification (T) of ALDH1+ pixels in ventral horns of controls and ALS patients (subgroups: SDD and MDD). Expression (U–W) and quantification (X) of ALDH1+ pixels in lateral columns of controls and ALS patients (subgroups: SDD and MDD). Data points represent the mean value for each patient. Data are shown as mean ± SEM. Significance was analysed between ALS patients (n = 12) and controls (n = 10) with Student's t‐test or Mann–Whitney U‐test. ALS patients with short disease duration (SDD; n = 7) and moderate disease duration (MDD; n = 5) were compared to controls (n = 10) using anova and Tukey's post‐test or Kruskal–Wallis H test and Dunn's post hoc multiple comparisons test. Significant data are presented (****P = <0.0001, ***P = <0.001, **<0.01, *P = <0.05). Scale bar in all pictures = 50 μm. SDD, short disease duration; MDD, moderate disease duration; ALS, amyotrophic lateral sclerosis; GFAP, glial fibrillary acid protein; ALDH1, aldehyde dehydrogenase 1.
HSPB1 expression is lower in ventral horns of ALS spinal cord
In controls, HSPB1 was present in cell bodies, axons and processes, but not in nuclei of motor neurons throughout the ventral and dorsal horns (Figure 3 A,B). In accordance with the motor neuron loss in ALS, fewer HSPB1+ motor neurons were observed in the ventral horns (data not shown) contributing to the decreased HSPB1 expression in ALS (P = 0.0384; Figure 3 C) although differences could not be attributed to disease duration that is SDD (P = 0.2261) or MDD (P = 0.1640). In one SDD case, HSPB1+ inclusions were seen in the neuronal bodies (Figure 3 F).
Figure 3.
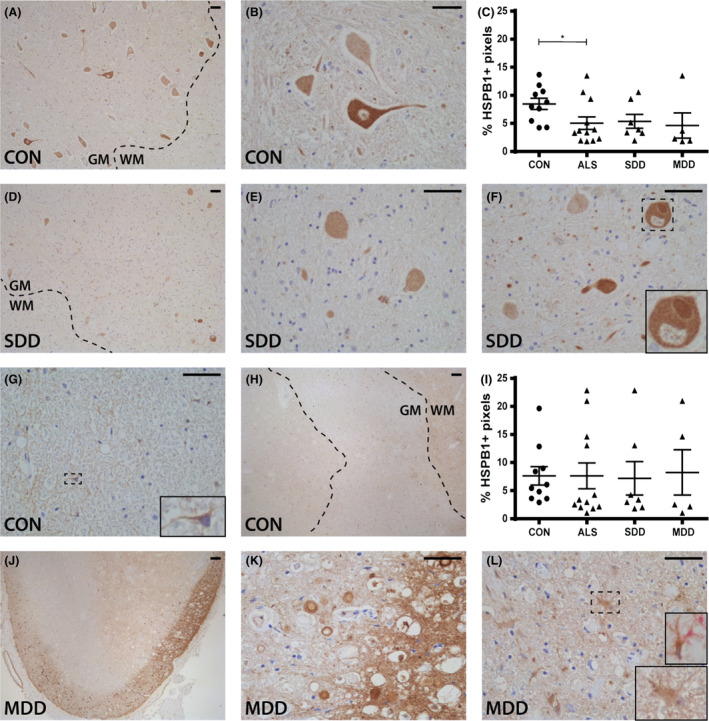
HSPB1 expression in ALS spinal cord. HSPB1 expression in (A,B,D–F) ventral horns and (G,H,J–L) lateral tracts of controls and ALS patients (subgroups: SDD and MDD) with (L) an insert of a vimentin+ (pink) and HSPB1+ (brown) astrocyte. Grey matter is delineated with a dotted line. Quantification of HSPB1+ pixels in (C) ventral horns and (I) lateral columns of controls and ALS patients (subgroups: SDD and MDD). Data points represent the mean value for each patient. Data are shown as mean ± SEM. Significance was analysed between ALS patients (n = 12) and controls (n = 10) with Student's t‐test or Mann–Whitney U‐test. ALS patients with SDD (n = 7) and MDD (n = 5) were compared to controls (n = 10) using anova and Tukey's post‐test or Kruskal–Wallis H test and Dunn's post hoc multiple comparisons test. Significant data are presented (****P = <0.0001, ***P = <0.001, **<0.01, *P = <0.05). Scale bar in all pictures = 50 μm. Inserts are digitally enlarged. SDD, short disease duration; MDD, moderate disease duration; ALS, amyotrophic lateral sclerosis; HSPB, heat shock protein B.
In control spinal cord, cells with an astrocyte‐like morphology constitutively expressed HSPB1 throughout the white matter (Figure 3 G) and grey matter in close proximity to the central canal (Figure 3 H). In most ALS patients, HSPB1 expression was similar to controls and colocalized with vimentin, but not olig2. Overall, HSPB1 expression in the lateral tracts of ALS spinal cord was similar to controls (Figure 3 I), however, in a small subset of ALS patients, many HSPB1+ astrocytes were observed (Figure 2 J) and occasionally HSPB1 was highly expressed in the subpial region (Figure 3 K,L).
ncreased HSPB5 and HSPB8 expression in astrocytes in ALS cases with SDD
HSPB5, was not observed in the motor neurons in the ventral horns of controls (Figure 4 A–C) nor ALS cases (Figure 4 C–F). Rather, expression in the ventral horns was almost exclusively present in the cytoplasm of olig2+ cells (Figure 4 E). In three ALS SDD cases, HSPB5 was diffusely expressed in the ventral horn in regions close to the lateral tracts that contained HSPB5+ astrocytes, and from which the processes extended into the grey matter (Figure 4 D,E). In contrast to the ventral horns, HSPB5 was expressed in astrocyte‐like cells throughout the white matter (Figure 4 G) and around the central canal (Figure 4 H) in controls. In comparison, HSPB5 was highly expressed in ALS cases (P = 0.0006; Figure 4 I), especially in SDD cases (P = 0.0055; Figure 4 I,J,K). Such expression was localized to nuclei, cell bodies and astrocytes, as confirmed by double staining with vimentin (Figure 4 L, insert).
Figure 4.
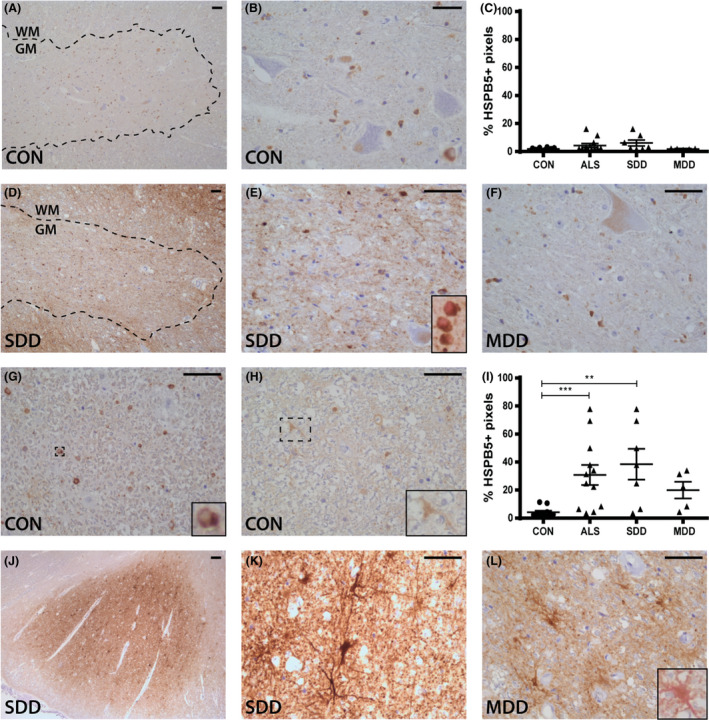
HSPB5 expression in ALS spinal cord. HSPB5 expression in (A,B,D–F) ventral horns and (G,H,J–L) lateral tracts of controls and ALS patients (subgroups: SDD and MDD) with inserts of (E) oligodendrocyte transcription factor 2 (olig2+) (pink) and HSPB5+ (brown) oligodendrocytes and (L) a vimentin+ (pink) and HSPB5+ (brown) astrocyte. Grey matter is delineated with a dotted line. Quantification of HSPB5+ pixels in (C) ventral horns and (I) lateral columns of controls and ALS patients (subgroups: SDD and MDD). Data points represent the mean value for each patient. Data are shown as mean ± SEM. Significance was analysed between ALS patients (n = 12) and controls (n = 10) with Student's t‐test or Mann–Whitney U‐test. ALS patients with SDD (n = 7) and MDD (n = 5) were compared to controls (n = 10) using anova and Tukey's post‐test or Kruskal–Wallis H test and Dunn's post hoc multiple comparisons test. Significant data are presented (****P = <0.0001, ***P = <0.001, **<0.01, *P = <0.05). Scale bar in all pictures = 50 μm. Inserts are digitally enlarged. SDD, short disease duration; MDD, moderate disease duration; ALS, amyotrophic lateral sclerosis; HSPB, heat shock protein B.
Different from HSPB5, HSPB8 was strongly expressed in cell bodies and axons of ventral horn neurons in both controls and ALS (Figure 5 A,B,D–F). Rarely, HSPB8+ inclusions were observed (Figure 5 F). HSPB8 was also expressed in occasional grey matter astrocytes in controls and in two ALS patients with SDD. Overall, ventral horn HSPB8 expression showed no difference between groups (P > 0.9999; Figure 5 L). In controls, HSPB8 expression was occasionally observed in nuclei of cells with an astrocyte‐like morphology (Figure 5 G) throughout the lateral tracts and the central canal (Figure 5 H). In ALS, the number of HSPB8+ vimentin+ astrocytes was higher in lateral tracts, and where expression extended into astrocyte cell bodies and processes (Figure 5 J–L).
Figure 5.
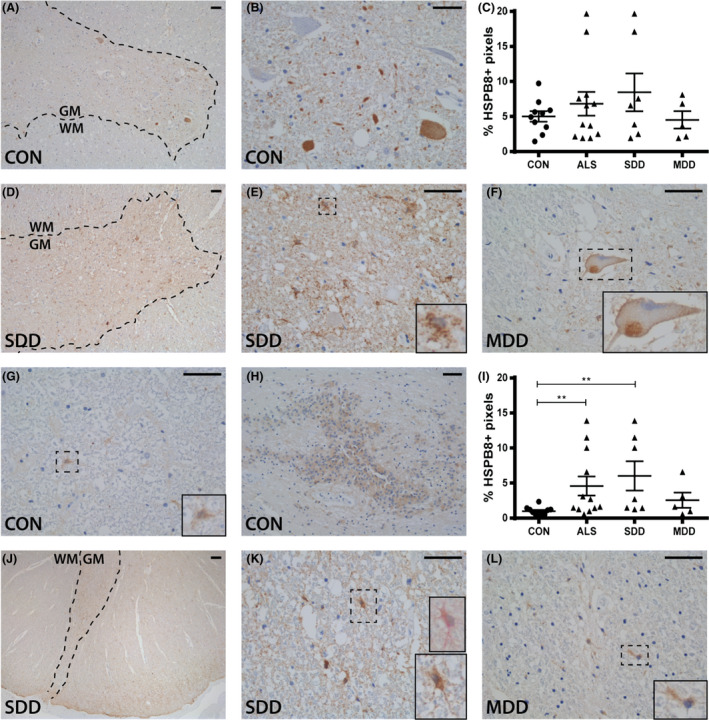
HSPB8 expression in ALS spinal cord. HSPB8 expression in (A,B,D–F) ventral horns and (G,H,J–L) lateral tracts of controls and ALS patients (subgroups: SDD and MDD) with (K) an insert of a vimentin+ (pink) and HSPB8+ (brown) astrocyte. Grey matter is delineated with a dotted line. Quantification of HSPB8+ pixels in (C) ventral horns and (I) lateral columns of controls and ALS patients (subgroups: SDD and MDD). Data points represent the mean value for each patient. Data are shown as mean ± SEM. Significance was analysed between ALS patients (n = 12) and controls (n = 10) with Student's t‐test or Mann–Whitney U‐test. ALS patients with SDD (n = 7) and MDD (n = 5) were compared to controls (n = 10) using anova and Tukey's post‐test or Kruskal–Wallis H test and Dunn's post hoc multiple comparisons test. Significant data are presented (****P = <0.0001, ***P = <0.001, **<0.01, *P = <0.05). Scale bar in all pictures = 50 μm. Inserts are digitally enlarged. SDD, short disease duration; MDD, moderate disease duration; ALS, amyotrophic lateral sclerosis; HSPB, heat shock protein B.
HSPB6 expression is constitutively expressed in the spinal cord
Low expression of HSPB6 was observed in neuronal cell bodies, axons and occasional grey matter astrocytes in control (Figure 6 A,B) and ALS cases (Figure 6 D–F), although no differences in HSPB6 expression were detected (Figure 6 C). HSPB6+ inclusions were not observed.
Figure 6.
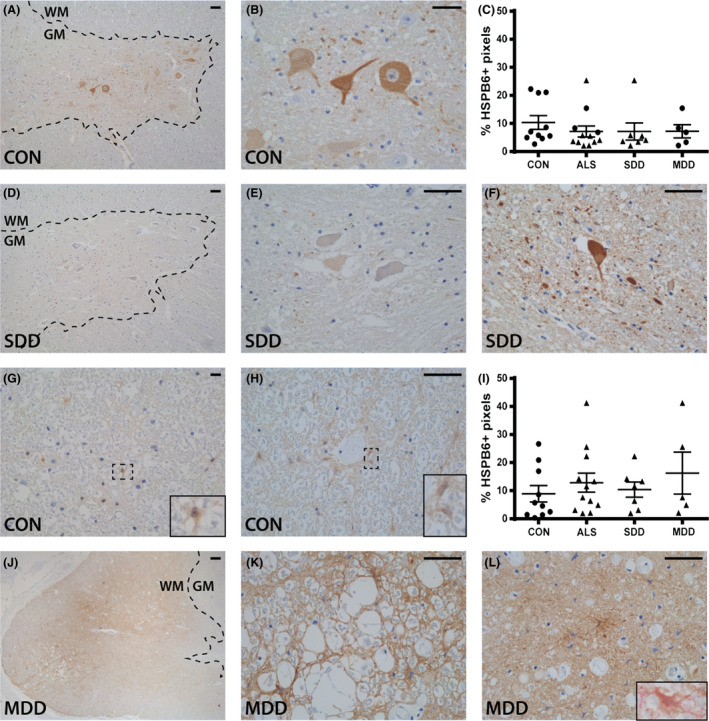
HSPB6 expression in ALS spinal cord. HSPB6 expression in (A,B,D–F) ventral horns and (G,H,J–L) lateral tracts of controls and ALS patients (subgroups: SDD and MDD) with (L) an insert of a vimentin+ (pink) and HSPB6+ (brown) astrocyte. Grey matter is delineated with a dotted line. Quantification of HSPB6+ pixels in (C) ventral horns and (I) lateral columns of controls and ALS patients (subgroups: SDD and MDD). Data points represent the mean value for each patient. Data are shown as mean ± SEM. Significance was analysed between ALS patients (n = 12) and controls (n = 10) with Student's t‐test or Mann–Whitney U‐test. ALS patients with SDD (n = 7) and MDD (n = 5) were compared to controls (n = 10) using anova and Tukey's post‐test or Kruskal–Wallis H test and Dunn's post hoc multiple comparisons test. Scale bar in all pictures = 50 μm. Inserts are digitally enlarged. SDD, short disease duration; MDD, moderate disease duration; ALS, amyotrophic lateral sclerosis; HSPB, heat shock protein B.
In the lateral tracts of control cases, HSPB6 expression was observed in cells resembling astrocytes (Figure 6 G), which was more pronounced adjacent to blood vessels (Figure 6 H). No differences in expression between ALS and control cases were detected (Figure 6 I); however, three ALS patients revealed relatively high expression of HSPB6 in the lateral tracts (Figure 6 J–L). Here, HSPB6 staining was both diffuse and localized to astrocytes in areas of tissue damage (Figure 6 J–L).
HSP16.2 expression is increased in lateral columns in ALS with long disease duration
Extensive HSP16.2 expression was observed on the cell membrane of neurons and axons throughout the grey matter of controls (Figure 7 A–C). Similar expression was observed in ALS cases (Figure 7 D–F) in the grey matter but not in the ventral horns where staining was less intense (non‐significant; Figure 7 C). The numbers of sharply delineated HSP16.2+ motor neurons were decreased (Figure 7 E) and expression associated with tissues with a fibrotic appearance (Figure 7 F). No HSP16.2+ inclusions were observed.
Figure 7.
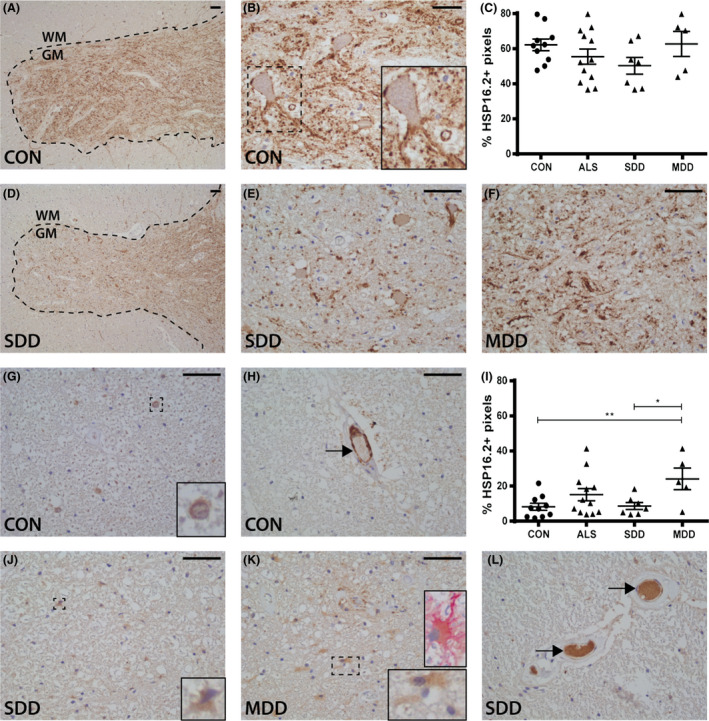
HSP16.2 expression in ALS spinal cord. HSP16.2 expression in (A,B,D–F) ventral horns and (G,H,J–L) lateral tracts of controls and ALS patients (subgroups: SDD and MDD) with (K) an insert of a vimentin+ (pink) and HSP16.2+ (brown) astrocyte. HSP16.2+ blood vessels are indicated with arrows (H,L). Grey matter is delineated with a dotted line. Quantification of HSP16.2+ pixels in (C) ventral horns and (I) lateral columns of controls and ALS patients (subgroups: SDD and MDD). Data points represent the mean value for each patient. Data are shown as mean ± SEM. Significance was analysed between ALS patients (n = 12) and controls (n = 10) with Student's t‐test or Mann–Whitney U‐test. ALS patients with SDD (n = 7) and MDD (n = 5) were compared to controls (n = 10) using anova and Tukey's post‐test or Kruskal–Wallis H test and Dunn's post hoc multiple comparisons test. Significant data are presented (****P = <0.0001, ***P = <0.001, **<0.01, *P = <0.05). Scale bar in all pictures = 50 μm. Inserts are digitally enlarged. SDD, short disease duration; MDD, moderate disease duration; ALS, amyotrophic lateral sclerosis; HSP heat shock protein.
In controls, HSP16.2 expression was observed occasionally in nuclei of astrocyte‐like cells throughout the lateral tracts (Figure 7 G), surrounding the central canal (data not shown) and occasionally in endothelial cells (Figure 7 H). HSP16.2 expression was significantly higher in MDD cases compared to controls (P = 0.0059; Figure 7 I,K) and SDD cases (P = 0.9931; Figure 7 J). In some ALS cases and controls, HSP16.2 was also observed in the lumen of blood vessels (Figure 7 L).
Discussion
Although motor neurons degenerate in ALS, the exact pathological mechanisms underlying functional decline and disease progression are unknown 27. Here, we investigated the association between ALS disease duration, motor neuron damage and expression of the stress‐inducible HSPBs as markers of glial activation and inflammation in ALS spinal cord. We show that although the motor neurons in ALS spinal cord do not upregulate basal expression of HSPB1, 6, 8 and HSP16.2, expression of several HSPBs is markedly increased in astrocytes in the lateral columns throughout the spinal cord. This suggests these cells play a role in the pathogenesis of ALS. Moreover, we show that SDD is associated with less motor neuron loss, more microglial activity and increased HSPB5 and 8 expression. This possibly indicates a relationship in ALS between stressors, such as increased proteostasis and oxidative stress and astrocyte reactivity, microglial activation and survival.
HSPBs, including HSPB1, 5 and 8 may aid motor neuron survival by preventing protein aggregation 18, 19, 20. Although HSPB1 and 8 mRNA levels have previously been found to be increased in ALS ventral horns 28, our study shows that only very few neurons contained HSPB1+ or HSPB8+ inclusions. Moreover, we did not observe increased expression of HSPBs in ventral horns during ALS, but rather a decrease in expression of HSPB1. This could be due to loss of motor neurons or decreased expression by residual motor neurons, similar to decreased HSPB1 protein expression in SOD1G93A mice, which precedes motor neuron degeneration 29. Generally, the lack of HSPB upregulation in ALS motor neurons is consistent with the concept that motor neurons have a high threshold before upregulating HSPs in response to heat shock or protein inclusions 30, 31.
In contrast to expression of HSPB in the motor neurons, a marked expression of HSPB5, 8 and HSP16.2 was observed in astrocytes in the lateral tracts. HSPB upregulation in astrocytes is prominent in many neurological diseases, for example multiple sclerosis, Alzheimer's disease, Parkinson's disease and X‐linked adrenoleucodystrophy and is associated with astrocyte reactivity 11, 13, 14, 15. In ALS, upregulation of HSPBs in astrocytes in response to for example oxidative stress, inflammation, neurotoxic protein aggregation or neuronal damage may thus confer protection by exerting anti‐apoptotic and anti‐protein aggregating effects 32. Simultaneously, HSPBs might facilitate astrocyte activation as their molecular chaperoning functions are important in cytoskeletal maintenance and reorganization 33. HSPB5 associates with astrocytic cytoskeletal proteins such as GFAP 34, and expression and phosphorylation of HSPB5 have recently been implicated in astrogliosis 35, which is prominent in ALS 36, 37. The increase in HSPB was not due to an increase in astrocyte numbers per se as GFAP and ALDH1 levels did not differ from controls. Astrocytes in ALS contain inclusions and exhibit an altered phenotype, likely contributing to motor neuron death 8, 38, 39, 40, 41, 42. As astrogliosis may be a physiological response necessary for tissue repair as well as playing a pathogenic role, the actual role that HSPBs play in astrocytes during ALS remains to be determined. Of note, not all HSPBs are consistently upregulated in ALS spinal cord (that is HSPB1 and 6), while HSPB5 and 8 are upregulated in patients with SDD, HSP16.2 is increased in ALS cases with MDD, underscoring the functional diversity of the different HSPB family members 16.
In our study, SDD is associated with increased HSPB5 and 8 expression in astrocytes, increased activation of microglia and/or macrophages, and relatively little motor neuron loss. That SDD cases have similar levels of pTDP‐43 pathology compared with MDD patients, implying that neuronal pathology alone does not explain disease progression in ALS. The limited motor neuron pathology in SDD ALS could indicate that in these particular cases, death was due to neuromuscular junction pathology, Wallerian degeneration or respiratory failure, prior to extensive motor neuron cell body loss in the spinal cord. In serum of ALS patients, HSP70 and HSP90 levels are reported to be high in early disease, but gradually decline with disease progression 43. Moreover, in animal models and human cell lines, prolonged stress depletes cellular levels of HSPs leading to maladaptation of the protein quality control system 32, 44. Thus, reduced HSPB expression and microglial activation in patients with MDD may reflect an exhausted immune and stress response resulting in a transition from acute to chronic inflammation. Further studies are needed to further characterize the inflammatory profile of glial cells in ALS with SDD and MDD.
Examination of post mortem tissue limits the separation of causative factors from reactive responses. For example, the heightened inflammatory response in patients with SDD may be a feature of early ALS, or alternatively a causative factor in disease progression. As SDD is associated with relative preservation of neurons and only moderate levels of pTDP‐43 inclusions, spinal cord neuronal pathology itself does not explain the rapid clinical decline of these patients. In ALS brain, the density of TDP‐43 inclusions does not correlate with disease duration or with rate of progression 45. Rather, glial responses to motor neuron degeneration may determine disease severity. Indeed, several studies in humans seeking factors contributing to disease progression have found an increased presence of pro‐inflammatory markers in CSF 46 and blood 47, 48 of patients with rapidly progressive ALS. Moreover, a recent data‐driven approach evaluating the ALS transcriptome, neuropathology and genome wide associations, underscored the link between microglia activation and disease progression in ALS 49. Furthermore, reduction of microglial proliferation in SOD1 G93A mice is associated with less motor neuron death, reduced disease progression and prolonged survival 50. Nevertheless, a recent study established that in a TDP‐43rNLS8 mouse model of ALS the microglial response is subtle and neuroprotective 51. The same study observed robust microglial activity in patients with SOD1 mutations in contrast to variable microglial reactivity in sporadic ALS (sALS) patients. The authors hypothesized that this observation is due to the diverse nature of the toxic aggregates in sALS patients, which may be due to unidentified mutations and/or environmental factors. Given the current lack of knowledge regarding the nature of the aggregates in sALS cases it is difficult to test this hypothesis. Our studies indicate that rather than the nature of the aggregates, the level of microglial activation in sALS patients is strongly associated with disease duration.
Conclusions
Our findings show that HSPBs are upregulated predominantly in astrocytes in ALS. These findings support the hypothesis that the interaction between motor neurons, microglia and astrocytes determines neuronal fate and thus functional decline in ALS. Modulating the pathogenic response and harnessing the protective response of innate immunity in the CNS may favourably impact the disease course in ALS.
Author contributions
RPG, JS, EN, JCJ and M‐CJ performed the experiments. JA, CM and EA provided clinical material and data regarding patient characteristics. JB and WB provided technical support for the analysis. RPG, JS, EN, HvN and SA wrote the paper. All authors contributed and agreed to the final version of the paper.
Supporting information
Table S1. Antibodies for IHC.
Appendix S1. Macro used for determining DAB+ area.
Acknowledgements
We acknowledge the Netherlands ALS Foundation (‘The Dutch ALS Tissue Bank’; EA, CM). We thank the team who helped in the collection of the ALS tissue samples (Prof. dr. D. Troost, Prof. dr. M. de Visser, Dr. A.J. van der Kooi and Dr. J. Raaphorst).
Gorter R. P., Stephenson J., Nutma E., Anink J., de Jonge J. C., Baron W., Jahreiβ M.‐C., Belien J. A. M., van Noort J. M., Mijnsbergen C., Aronica E., Amor S. (2019) Neuropathology and Applied Neurobiology 45, 459–475 Rapidly progressive amyotrophic lateral sclerosis is associated with microglial reactivity and small heat shock protein expression in reactive astrocytes
References
- 1. van Es MA, Hardiman O, Chio A, Al‐Chalabi A, Pasterkamp RJ, Veldink JH, et al Amyotrophic lateral sclerosis. Lancet 2017; 390: 2084–98 [DOI] [PubMed] [Google Scholar]
- 2. Hoppitt T, Pall H, Calvert M, Gill P, Yao G, Ramsay J, et al A systematic review of the incidence and prevalence of long‐term neurological conditions in the UK. Neuroepidemiology 2011; 36: 19–28 [DOI] [PMC free article] [PubMed] [Google Scholar]
- 3. Berlowitz DJ, Howard ME, Fiore JFJ, Vander Hoorn S, O'Donoghue FJ, Westlake J, et al Identifying who will benefit from non‐invasive ventilation in amyotrophic lateral sclerosis/motor neurone disease in a clinical cohort. J Neurol Neurosurg Psychiatry 2016; 87: 280–6 [DOI] [PubMed] [Google Scholar]
- 4. Kalmar B, Greensmith L. Cellular chaperones as therapeutic targets in ALS to restore protein homeostasis and improve cellular function. Front Mol Neurosci 2017; 10: 251 [DOI] [PMC free article] [PubMed] [Google Scholar]
- 5. Webster CP, Smith EF, Shaw PJ, De Vos KJ. Protein homeostasis in amyotrophic lateral sclerosis: therapeutic opportunities? Front Mol Neurosci 2017; 10: 123 [DOI] [PMC free article] [PubMed] [Google Scholar]
- 6. Bakthisaran R, Tangirala R, Rao CM. Small heat shock proteins: role in cellular functions and pathology. Biochim Biophys Acta – Proteins Proteom 2015; 1854: 291–319. Available at: http://www.sciencedirect.com/science/article/pii/S1570963914003355 [DOI] [PubMed] [Google Scholar]
- 7. Feder ME, Hofmann GE. Heat‐shock proteins, molecular chaperones, and the stress response: evolutionary and ecological physiology. Annu Rev Physiol 1999; 61: 243–82. Available at: http://www.ncbi.nlm.nih.gov/pubmed/10099689 (last accessed 2 May 2018) [DOI] [PubMed] [Google Scholar]
- 8. San Gil R, Ooi L, Yerbury JJ, Ecroyd H. The heat shock response in neurons and astroglia and its role in neurodegenerative diseases. Mol Neurodegener 2017; 12: 65 [DOI] [PMC free article] [PubMed] [Google Scholar]
- 9. Kampinga HH, Bergink S. Heat shock proteins as potential targets for protective strategies in neurodegeneration. Lancet Neurol 2016; 15: 748–59. Available at: http://www.sciencedirect.com/science/article/pii/S1474442216000995 [DOI] [PubMed] [Google Scholar]
- 10. Kampinga HH, Hageman J, Vos MJ, Kubota H, Tanguay RM, Bruford EA, et al Guidelines for the nomenclature of the human heat shock proteins. Cell Stress Chaperones 2009; 14: 105–11 [DOI] [PMC free article] [PubMed] [Google Scholar]
- 11. Renkawek K, Bosman GJ, de Jong WW. Expression of small heat‐shock protein hsp 27 in reactive gliosis in Alzheimer disease and other types of dementia. Acta Neuropathol 1994; 87: 511–19. Available at: http://www.ncbi.nlm.nih.gov/pubmed/8059604 (last accessed 29 September 2017) [DOI] [PubMed] [Google Scholar]
- 12. Shinohara H, Inaguma Y, Goto S, Inagaki T, Kato K. Alpha B crystallin and HSP28 are enhanced in the cerebral cortex of patients with Alzheimer's disease. J Neurol Sci 1993; 119: 203–8. Available at: http://www.ncbi.nlm.nih.gov/pubmed/8277336 (last accessed 2017 September 29) [DOI] [PubMed] [Google Scholar]
- 13. Renkawek K, Stege GJ, Bosman GJ. Dementia, gliosis and expression of the small heat shock proteins hsp27 and alpha B‐crystallin in Parkinson's disease. NeuroReport 1999; 10: 2273–6. Available at: http://www.ncbi.nlm.nih.gov/pubmed/10439447 (last accessed 29 September 2017) [DOI] [PubMed] [Google Scholar]
- 14. Peferoen LAN, Gerritsen WH, Breur M, Ummenthum KMD, Peferoen‐Baert RMB, van der Valk P, et al Small heat shock proteins are induced during multiple sclerosis lesion development in white but not grey matter. Acta Neuropathol Commun 2015; 3: 87 Available at: http://www.ncbi.nlm.nih.gov/pmc/articles/PMC4688967/ [DOI] [PMC free article] [PubMed] [Google Scholar]
- 15. Görtz AL, Peferoen LAN, Gerritsen WH, van Noort JM, Bugiani M, Amor S. Heat shock protein expression in cerebral X‐linked adrenoleukodystrophy reveals astrocyte stress prior to myelin loss. Neuropathol Appl Neurobiol 2018; 44: 363–76. Available at: http://www.ncbi.nlm.nih.gov/pubmed/28319253 (last accessed 29 September 2017) [DOI] [PubMed] [Google Scholar]
- 16. Kampinga HH, Garrido C. HSPBs: small proteins with big implications in human disease. Int J Biochem Cell Biol 2012; 44: 1706–10 [DOI] [PubMed] [Google Scholar]
- 17. Dohrn MF, Glöckle N, Mulahasanovic L, Heller C, Mohr J, Bauer C, et al Frequent genes in rare diseases: panel‐based next generation sequencing to disclose causal mutations in hereditary neuropathies. J Neurochem 2017; 143: 507–22. Available at: http://www.ncbi.nlm.nih.gov/pubmed/28902413 (last accessed 29 September 2017) [DOI] [PubMed] [Google Scholar]
- 18. Yerbury JJ, Gower D, Vanags L, Roberts K, Lee JA, Ecroyd H. The small heat shock proteins alphaB‐crystallin and Hsp27 suppress SOD1 aggregation in vitro. Cell Stress Chaperones 2013; 18: 251–7 [DOI] [PMC free article] [PubMed] [Google Scholar]
- 19. Crippa V, Sau D, Rusmini P, Boncoraglio A, Onesto E, Bolzoni E, et al The small heat shock protein B8 (HspB8) promotes autophagic removal of misfolded proteins involved in amyotrophic lateral sclerosis (ALS). Hum Mol Genet 2010; 19: 3440–56 [DOI] [PubMed] [Google Scholar]
- 20. Gregory JM, Barros TP, Meehan S, Dobson CM, Luheshi LM. The aggregation and neurotoxicity of TDP‐43 and its ALS‐associated 25 kDa fragment are differentially affected by molecular chaperones in drosophila. PLoS ONE 2012; 7: e31899 Available at: http://www.ncbi.nlm.nih.gov/pubmed/22384095 (last accessed 29 September 2017) [DOI] [PMC free article] [PubMed] [Google Scholar]
- 21. Filareti M, Luotti S, Pasetto L, Pignataro M, Paolella K, Messina P, et al Decreased levels of foldase and chaperone proteins are associated with an early‐onset amyotrophic lateral sclerosis. Front Mol Neurosci 2017; 10: 99 [DOI] [PMC free article] [PubMed] [Google Scholar]
- 22. Van Noort J. Stress proteins in CNS inflammation. J Pathol 2008; 214: 267–75. Available at: https://onlinelibrary.wiley.com/doi/pdf/10.1002/path.2273 (last accessed 2 May 2018) [DOI] [PubMed] [Google Scholar]
- 23. Bruinsma IB, de Jager M, Carrano A, Versleijen AAM, Veerhuis R, Boelens W, et al Small heat shock proteins induce a cerebral inflammatory reaction. J Neurosci 2011; 31: 11992–2000. Available at: http://www.ncbi.nlm.nih.gov/pubmed/21849559 (last accessed 2 May 2018) [DOI] [PMC free article] [PubMed] [Google Scholar]
- 24. Bsibsi M, Peferoen LAN, Holtman IR, Nacken PJ, Gerritsen WH, Witte ME, et al Demyelination during multiple sclerosis is associated with combined activation of microglia/macrophages by IFN‐gamma and alpha B‐crystallin. Acta Neuropathol 2014; 128: 215–29 [DOI] [PubMed] [Google Scholar]
- 25. Kappé G, Boelens WC, De Jong WW. Why proteins without an a‐crystallin domain should not be included in the human small heat shock protein family HSPB. Cell Stress Chaperones 2010; 15: 457–61. Available at: https://www.ncbi.nlm.nih.gov/pmc/articles/PMC3082639/pdf/12192_2009_Article_155.pdf (last accessed 21 May 2018) [DOI] [PMC free article] [PubMed] [Google Scholar]
- 26. Schindelin J, Arganda‐Carreras I, Frise E, Kaynig V, Longair M, Pietzsch T, et al Fiji: an open‐source platform for biological‐image analysis. Nat Methods 2012; 9: 676–82. Available at: http://www.nature.com/articles/nmeth.2019 (last accessed 19 April 2018) [DOI] [PMC free article] [PubMed] [Google Scholar]
- 27. Kiernan MC, Vucic S, Cheah BC, Turner MR, Eisen A, Hardiman O, et al Amyotrophic lateral sclerosis. Lancet 2011; 377: 942–55. Available at: http://www.ncbi.nlm.nih.gov/pubmed/21296405 (last accessed 9 April 2018) [DOI] [PubMed] [Google Scholar]
- 28. Anagnostou G, Akbar MT, Paul P, Angelinetta C, Steiner TJ, de Belleroche J. Vesicle associated membrane protein B (VAPB) is decreased in ALS spinal cord. Neurobiol Aging 2010; 31: 969–85 [DOI] [PubMed] [Google Scholar]
- 29. Maatkamp A, Vlug A, Haasdijk E, Troost D, French PJ, Jaarsma D. Decrease of Hsp25 protein expression precedes degeneration of motoneurons in ALS‐SOD1 mice. Eur J Neurosci 2004; 20: 14–28 [DOI] [PubMed] [Google Scholar]
- 30. Batulan Z, Shinder GA, Minotti S, He BP, Doroudchi MM, Nalbantoglu J, et al High threshold for induction of the stress response in motor neurons is associated with failure to activate HSF1. J Neurosci 2003; 23: 5789–98. Available at: http://www.ncbi.nlm.nih.gov/pubmed/12843283 (last accessed 30 September 2017) [DOI] [PMC free article] [PubMed] [Google Scholar]
- 31. Seminary ER, Sison SL, Ebert AD. Modeling protein aggregation and the heat shock response in ALS iPSC‐derived motor neurons. Front Neurosci 2018; 12: 86 Available at: http://journal.frontiersin.org/article/10.3389/fnins.2018.00086/full (last accessed 9 April 2018) [DOI] [PMC free article] [PubMed] [Google Scholar]
- 32. Oliveira AO, Osmand A, Outeiro TF, Muchowski PJ, Finkbeiner S. αB‐Crystallin overexpression in astrocytes modulates the phenotype of the BACHD mouse model of Huntington's disease. Hum Mol Genet 2016; 25: 1677–89. Available at: http://www.ncbi.nlm.nih.gov/pubmed/26920069 (last accessed 20 April 2018) [DOI] [PMC free article] [PubMed] [Google Scholar]
- 33. Wettstein G, Bellaye PS, Micheau O, Bonniaud P. Small heat shock proteins and the cytoskeleton: an essential interplay for cell integrity? Int J Biochem Cell Biol 2012; 44: 1680–6. Available at: http://www.ncbi.nlm.nih.gov/pubmed/22683760 (last accessed 30 September 2017) [DOI] [PubMed] [Google Scholar]
- 34. Hagemann TL, Boelens WC, Wawrousek EF, Messing A. Suppression of GFAP toxicity by αB‐crystallin in mouse models of Alexander disease. Hum Mol Genet 2009; 18: 1190–9. Available at: http://www.ncbi.nlm.nih.gov/pubmed/19129171 (last accessed 30 September 2017) [DOI] [PMC free article] [PubMed] [Google Scholar]
- 35. Kuipers HF, Yoon J, van Horssen J, Han MH, Bollyky PL, Palmer TD, et al Phosphorylation of alphaB‐crystallin supports reactive astrogliosis in demyelination. Proc Natl Acad Sci U S A 2017; 114: E1745–54 [DOI] [PMC free article] [PubMed] [Google Scholar]
- 36. Schiffer D, Cordera S, Cavalla P, Migheli A. Reactive astrogliosis of the spinal cord in amyotrophic lateral sclerosis. J Neurol Sci 1996; 139: 27–33. Available at: https://www.sciencedirect.com/science/article/pii/0022510X96000731 (last accessed 29 April 2018) [DOI] [PubMed] [Google Scholar]
- 37. Kushner PD, Stephenson DT, Wright S. Reactive astrogliosis is widespread in the subcortical white matter of amyotrophic lateral sclerosis brain. J Neuropathol Exp Neurol 1991; 50: 263–77. Available at: http://www.ncbi.nlm.nih.gov/pubmed/2022968 (last accessed 29 April 2018) [DOI] [PubMed] [Google Scholar]
- 38. Staats KA, Van Den Bosch L. Astrocytes in amyotrophic lateral sclerosis: direct effects on motor neuron survival. J Biol Phys 2009; 35: 337–46. Available at: http://link.springer.com/10.1007/s10867-009-9141-4 (last accessed 30 September 2017) [DOI] [PMC free article] [PubMed] [Google Scholar]
- 39. Wallis N, Lau CL, Farg MA, Atkin JD, Beart PM, O'Shea RD. SOD1 mutations causing familial amyotrophic lateral sclerosis induce toxicity in astrocytes: evidence for bystander effects in a continuum of astrogliosis. Neurochem Res 2018; 43: 157–70. Available at: http://link.springer.com/10.1007/s11064-017-2385-7 (last accessed 30 September 2017) [DOI] [PubMed] [Google Scholar]
- 40. Hensley K, Abdel‐Moaty H, Hunter J, Mhatre M, Mou S, Nguyen K, et al Primary glia expressing the G93A‐SOD1 mutation present a neuroinflammatory phenotype and provide a cellular system for studies of glial inflammation. J Neuroinflammation 2006; 3: 2 Available at: http://jneuroinflammation.biomedcentral.com/articles/10.1186/1742-2094-3-2 (last accessed 30 September 2017) [DOI] [PMC free article] [PubMed] [Google Scholar]
- 41. Tong J, Huang C, Bi F, Wu Q, Huang B, Liu X, et al Expression of ALS‐linked TDP‐43 mutant in astrocytes causes non‐cell‐autonomous motor neuron death in rats. EMBO J 2013; 32: 1917–26. Available at: http://www.ncbi.nlm.nih.gov/pubmed/23714777 (last accessed 17 April 2018) [DOI] [PMC free article] [PubMed] [Google Scholar]
- 42. Qian K, Huang H, Peterson A, Hu B, Maragakis NJ, Ming G, et al Sporadic ALS astrocytes induce neuronal degeneration in vivo. Stem Cell Reports 2017; 8: 843–55. Available at: http://linkinghub.elsevier.com/retrieve/pii/S2213671117300917 (last accessed 30 September 2017) [DOI] [PMC free article] [PubMed] [Google Scholar]
- 43. Miyazaki D, Nakamura A, Hineno A, Kobayashi C, Kinoshita T, Yoshida K, et al Elevation of serum heat‐shock protein levels in amyotrophic lateral sclerosis. Neurol Sci 2016; 37: 1277–81 [DOI] [PubMed] [Google Scholar]
- 44. Roth DM, Hutt DM, Tong J, Bouchecareilh M, Wang N, Seeley T, et al Modulation of the maladaptive stress response to manage diseases of protein folding. PLoS Biol 2014; 12: e1001998 Available at: https://www.ncbi.nlm.nih.gov/pmc/articles/PMC4236052/pdf/pbio.1001998.pdf (last accessed 20 April 2018) [DOI] [PMC free article] [PubMed] [Google Scholar]
- 45. Cykowski MD, Powell SZ, Peterson LE, Appel JW, Rivera AL, Takei H, et al Clinical significance of TDP‐43 neuropathology in amyotrophic lateral sclerosis. J Neuropathol Exp Neurol 2017; 76: 402–13. Available at: http://www.ncbi.nlm.nih.gov/pubmed/28521037 (last accessed 18 April 2018) [DOI] [PMC free article] [PubMed] [Google Scholar]
- 46. Brettschneider J, Lehmensiek V, Mogel H, Pfeifle M, Dorst J, Hendrich C, et al Proteome analysis reveals candidate markers of disease progression in amyotrophic lateral sclerosis (ALS). Neurosci Lett 2010; 468: 23–7. Available at: http://www.ncbi.nlm.nih.gov/pubmed/19853641 (last accessed 18 April 2018) [DOI] [PubMed] [Google Scholar]
- 47. Murdock BJ, Zhou T, Kashlan SR, Little RJ, Goutman SA, Feldman EL. Correlation of peripheral immunity with rapid amyotrophic lateral sclerosis progression. JAMA Neurol 2017; 74: 1446–54. Available at: http://archneur.jamanetwork.com/article.aspx?doi=10.1001/jamaneurol.2017.2255 (last accessed 18 April 2018) [DOI] [PMC free article] [PubMed] [Google Scholar]
- 48. Zhao W, Beers DR, Hooten KG, Sieglaff DH, Zhang A, Kalyana‐Sundaram S, et al Characterization of gene expression phenotype in amyotrophic lateral sclerosis monocytes. JAMA Neurol 2017; 74: 677–85. Available at: http://archneur.jamanetwork.com/article.aspx?doi=10.1001/jamaneurol.2017.0357 (last accessed 18 April 2018) [DOI] [PMC free article] [PubMed] [Google Scholar]
- 49. Cooper‐Knock J, Green C, Altschuler G, Wei W, Bury JJ, Heath PR, et al A data‐driven approach links microglia to pathology and prognosis in amyotrophic lateral sclerosis. Acta Neuropathol Commun 2017; 5: 23 Available at: http://actaneurocomms.biomedcentral.com/articles/10.1186/s40478-017-0424-x (last accessed 18 April 2018) [DOI] [PMC free article] [PubMed] [Google Scholar]
- 50. Martínez‐Muriana A, Mancuso R, Francos‐Quijorna I, Olmos‐Alonso A, Osta R, Perry VH, et al CSF1R blockade slows the progression of amyotrophic lateral sclerosis by reducing microgliosis and invasion of macrophages into peripheral nerves. Sci Rep 2016; 6: 25663 Available at: http://www.nature.com/articles/srep25663 (last accessed 18 April 2018) [DOI] [PMC free article] [PubMed] [Google Scholar]
- 51. Spiller KJ, Restrepo CR, Khan T, Dominique MA, Fang TC, Canter RG, et al Microglia‐mediated recovery from ALS‐relevant motor neuron degeneration in a mouse model of TDP‐43 proteinopathy. Nat Neurosci 2018; 21: 329–40. Available at: http://www.nature.com/articles/s41593-018-0083-7 (last accessed 7 April 2018) [DOI] [PMC free article] [PubMed] [Google Scholar]
Associated Data
This section collects any data citations, data availability statements, or supplementary materials included in this article.
Supplementary Materials
Table S1. Antibodies for IHC.
Appendix S1. Macro used for determining DAB+ area.