

Abstract
Dietary habits and vascular risk factors promote both Alzheimer’s disease and cognitive impairment caused by vascular factors1–3. Furthermore, accumulation of hyperphosphorylated tau, a microtubule associated protein and a hallmark of Alzheimer’s pathology4, is also linked to vascular cognitive impairment5,6. In mice, a salt-rich diet leads to cognitive dysfunction associated with a nitric oxide deficit in cerebral endothelial cells and cerebral hypoperfusion7. Here we report that dietary salt induces tau hyperphosphorylation followed by cognitive dysfunction, effects prevented by restoring endothelial nitric oxide production. The nitric oxide deficiency reduces neuronal calpain nitrosylation resulting in enzyme activation, which, in turn, leads to tau phosphorylation by activating cyclin dependent kinase-5. Salt-induced cognitive impairment is not observed in tau-null mice or in mice treated with anti-tau antibodies, despite persistent cerebral hypoperfusion and neurovascular dysfunction. These findings unveil a causal link between dietary salt, endothelial dysfunction and tau pathology, independent of hemodynamic insufficiency. Avoiding excessive salt intake and maintaining vascular health may help stave off vascular and neurodegenerative pathologies underlying late-life dementia.
Vascular risk factors including excessive salt consumption have long been associated with cerebrovascular diseases and cognitive impairment1–3. A diet rich in salt is an independent risk factor for stroke and dementia3,8–10 and has been linked to the cerebral small vessel disease underlying vascular cognitive impairment11, a condition associated with endothelial dysfunction and reduced cerebral blood (CBF)12. In mice, a high salt diet (HSD) induces cognitive dysfunction by targeting the cerebral microvasculature through a gut-initiated adaptive immune response mediated by Th17 lymphocytes7. The resulting increase in circulating IL17 leads to inhibition of endothelial nitric oxide (NO) synthase (eNOS) and reduced vascular NO production, which, in turn, impairs endothelial vasoactivity and lowers cerebral blood flow (CBF) by ≈25%7. However, it remains unclear how hypoperfusion, in HSD or other vascular risk factors, leads to impaired cognition. The prevailing view is that hypoperfusion compromises the delivery of oxygen and glucose to energy-demanding brain regions involved in cognition12,13. But the relatively small CBF reduction associated with HSD in mice7 and vascular cognitive impairment in humans14 may not be sufficient to impair cognitive function15, implicating vascular factors beyond cerebral perfusion.
Excessive phosphorylation of the microtubule associated protein tau promotes the formation of insoluble tau aggregates, thought to mediate neuronal dysfunction and cognitive impairment in AD and other tauopathies16. However, tau accumulation has increasingly been detected also in cerebrovascular pathologies associated with endothelial dysfunction and cognitive impairment5,6. Therefore, we investigated whether tau accumulation rather than cerebral hypoperfusion contributes to the cognitive dysfunction induced by HSD. First, we established if HSD induces tau phosphorylation. Male C56Bl/6 mice were placed on a normal diet (ND) or HSD (4 or 8% NaCl), a commonly used model of excessive dietary salt corresponding to a 8–16 fold increase in the salt content in the regular mouse chow7,17. Phosphorylation of tau epitopes promoting tau aggregation and neuronal dysfunction16 were assessed over time by Western blotting. HSD (8%) induced a sustained increase in p-tau (AT8, RZ3) in neocortex and hippocampus without increasing total tau (Tau 46) (Fig. 1a). In the hippocampus, an increase in PHF13 and pSer199Ser202 was also observed (Extended Data Fig. 1a). The tau phosphorylation (AT8) was abolished by lambda protein phosphatase (Extended Data Fig. 1b). AT8 and RZ3 were also increased in neocortex of female mice fed a HSD (Extended Data Fig. 1c). HSD did not increase tau acetylation (K280), a post translational modification implicated in tau pathology18 (Extended Data Fig. 1a). AT8 and MC1 immunoreactivities were detected in the pyriform cortex, but neurofibrillary tangles were not observed (Fig. 1b, Extended Data Fig. 1d, e). No neuronal or white matter damage was observed, nor significant changes in astrocytes, microglia/macrophages, or pericytes (Extended Data Fig. 2a–c). Increased AT8 was also observed in neocortex with lower amounts of dietary salt (4%) (Extended Data Fig. 1f).
Fig. 1: HSD increases tau phosphorylation and insoluble tau.
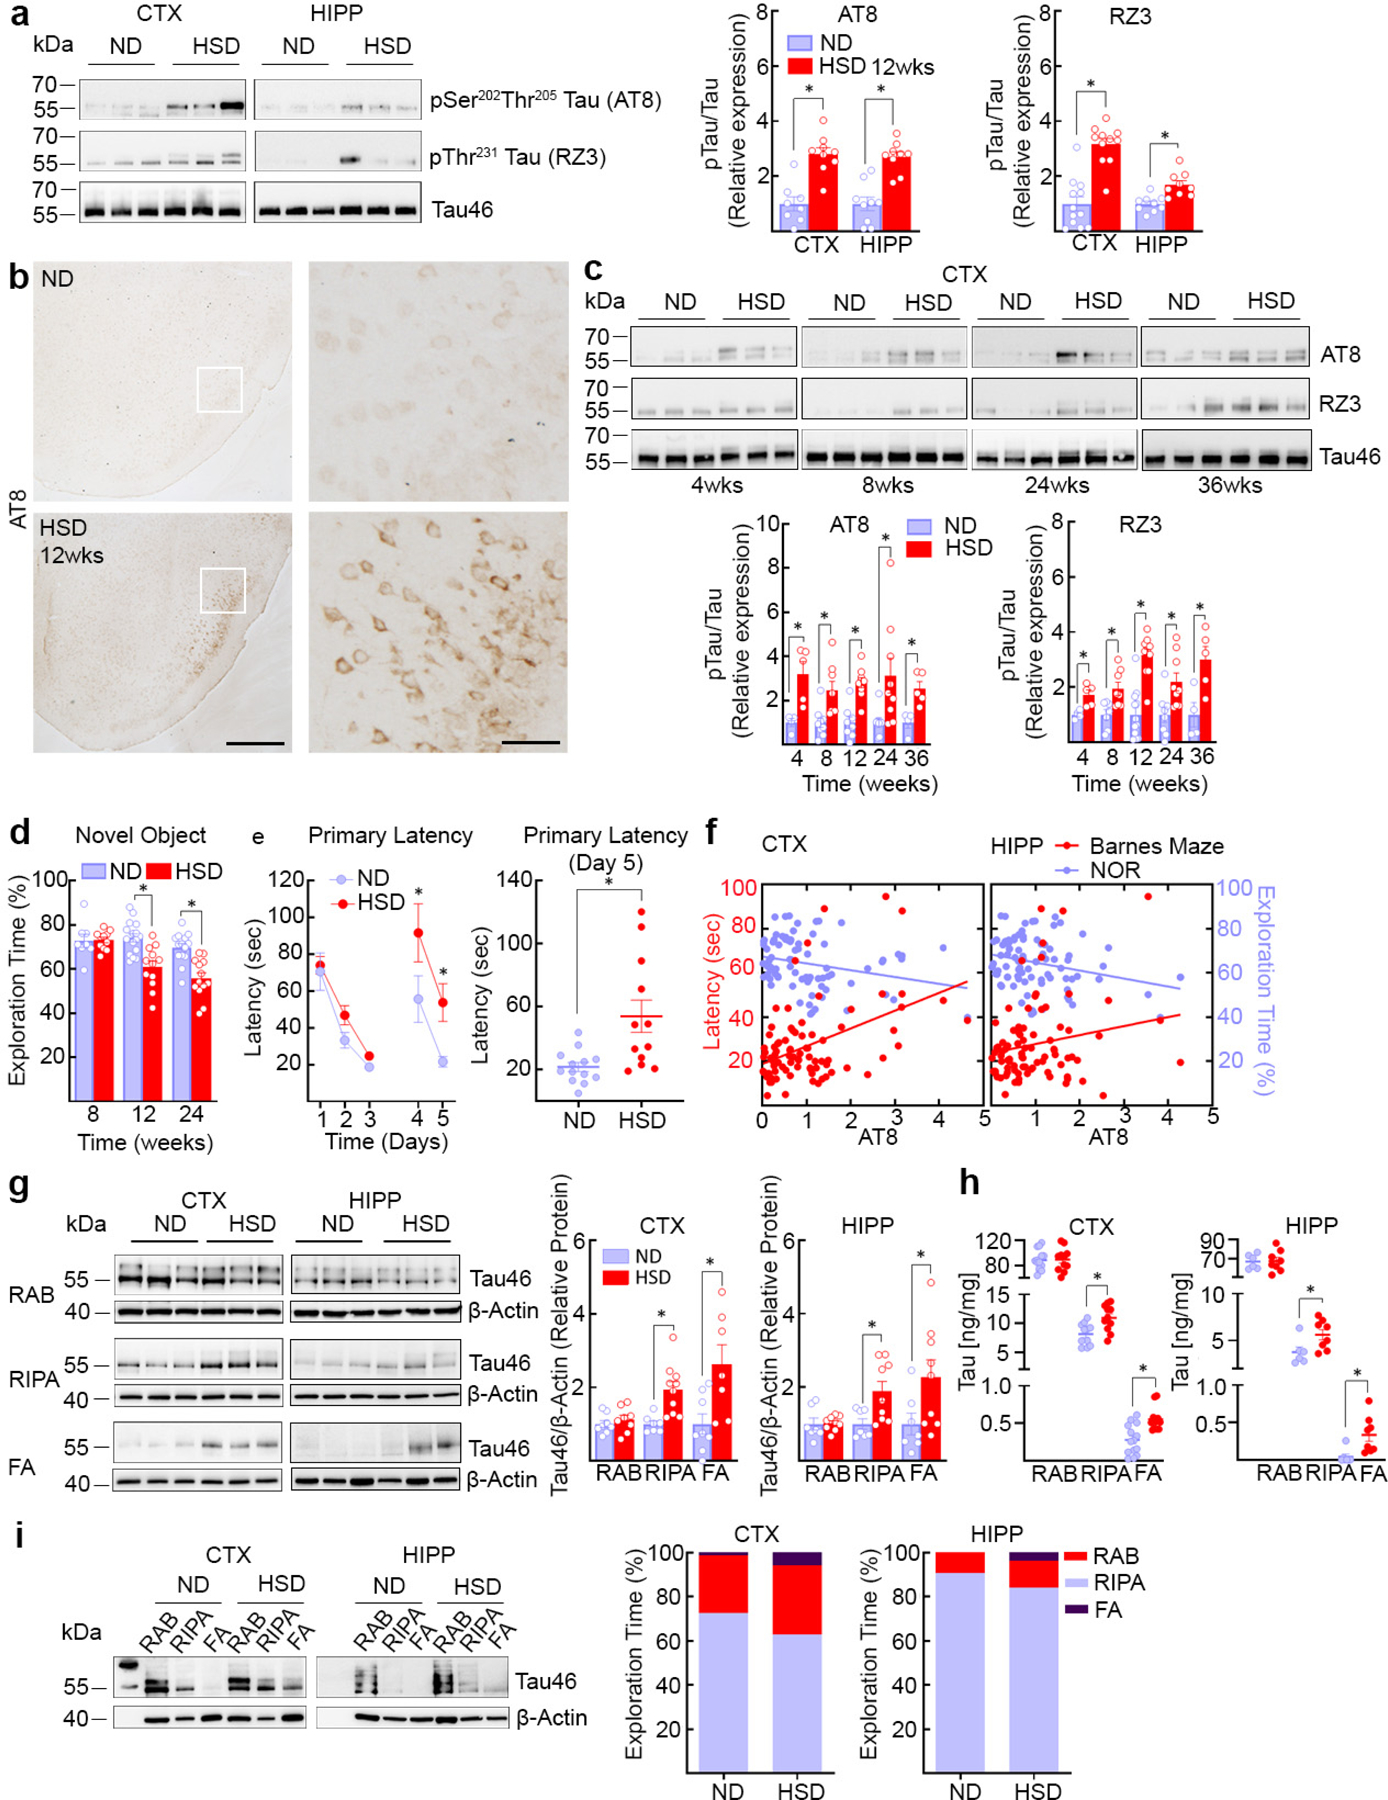
a, HSD increases AT8 and RZ3 levels. (CTX: AT8, ND/HSD n=8/9, *p<0.0001 vs ND; RZ3, ND/HSD n=12/11, *p<0.0001 vs ND; HIPP: AT8, ND/HSD n=9/9, *p<0.0001 vs ND; RZ3, ND/HSD n=9/9, *p=0.0011 vs ND, two-tailed unpaired t-test). b, HSD increases neuronal AT8 immunoreactivity in the piriform cortex (size bar=500 μm; 100 μm in inset). Representative images from ND and HSD mice (n=5/group). c, Time course of the neocortical increase in AT8 and RZ3 (AT8, 4 weeks: ND/HSD n=4/5, *p=0.0116 vs ND; 8 weeks: ND/HSD n=9/8, *p=0.0066 vs ND; 24 weeks: ND/HSD n=8/9, *p=0.0152 vs ND; 36 weeks: ND/HSD n=4/5, *p=0.0087 vs ND; RZ3, 4 weeks: ND/HSD n=4/5, *p=0.0097 vs ND; RZ3, 8 weeks: ND/HSD n=7/8, *p=0.0084 vs ND; 24 weeks: ND/HSD n=8/9, *p=0.0135 vs ND; 36 weeks: ND/HSD n=4/5, *p=0.0204 vs ND, two-tailed unpaired t-test). d, HSD induces deficits in recognition memory (Diet: *p<0.0001, Time: *p=0.0002; 8 weeks: ND/HSD n=8/11; 12 weeks: ND/HSD n=16/12; 24 weeks: ND/HSD n=14/13 mice/group, two-way ANOVA and Tukey’s test). e, HSD induces deficits in spatial memory (Diet: *p=0.0048, Time: *p<0.0001; ND/HSD n=13/12, two-way RM ANOVA and Bonferroni’s test; Primary Latency Day 5, ND/HSD n=13/12, *p=0.0031 vs ND, two-tailed unpaired t-test). f, Neocortical and hippocampal levels of AT8 correlate with spatial learning impairment (AT8 CTX: BM r=0.4491, *p<0.0001, n=84; NOR r=−0.2621, *p=0.0188, n=80; AT8 HIPP: BM r=0.2073, *p=0.0462, n=93; NOR r=−0.2915, *p=0.0053, n=90, Pearson’s correlation coefficient). g, HSD increases levels of insoluble tau (Western blotting) extracted in RIPA and FA after 12 weeks of treatment (CTX: RIPA, ND/HSD n=7/10, *p=0.0032 vs ND; FA, ND/HSD n=8/7, *p=0.0146 vs ND; HIPP: RIPA, ND/HSD n=7/9, *p=0.0418 vs ND; FA, ND/HSD n=7/9, *p=0.0494 vs ND, two-tailed unpaired t-test). h, HSD increases levels of insoluble tau (electrochemiluminescence method) (CTX: RIPA, ND/HSD n=11, *p=0.0050 vs ND; FA, ND/HSD n=14/11, *p=0.0028 vs ND; HIPP: RIPA, ND/HSD n=6/8, *p=0.0380 vs ND; FA, ND/HSD n=7/8, *p=0.0037 vs ND, two-tailed unpaired t-test). I: HSD shifts tau from the RAB fraction to the less soluble RIPA and FA fractions (CTX: ND/HSD n=9/8, RAB, p=0.4234 vs ND, RIPA, p=0.5414 vs ND, FA, *p=0.0325 vs ND; HIPP: ND/HSD n=5/6, RAB, p=0.2468 vs ND, RIPA, p=0.3290 vs ND, FA, *p=0.0152 vs ND, two-tailed unpaired t-test). For gel source data see supplementary figure 1. Data are expressed as mean±SEM.
In neocortex, AT8 increased at 4 weeks and RZ3 at 8 weeks of HSD and remained elevated up to 36 weeks, whereas in hippocampus AT8 peaked at 12 and 36 weeks (Fig. 1c, Extended Data Fig. 1g). Starting at 12 weeks of HSD, mice exhibited difficulties in recognizing novel objects and developed a deficit in spatial memory at the Barnes maze (Fig.1d, e, Extended Data Fig. 3a). Cognitive dysfunction was also observed in female mice fed a HSD (Extended Data Fig. 1c). The magnitude of AT8 and RZ3 phosphorylation was correlated with the Barnes maze performance (Fig. 1f) and novel object recognition (Extended Data Fig. 3b). HSD did not increase neocortical Aβ38, Aβ40 or Aβ42 (Extended Data Fig. 3c). Increase p-tau was also observed in arterial hypertension induced by angiotensin-II administration (Extended Data Fig. 3d,e) or in a model of Aβ accumulation (Tg2576 mice) (Extended Data Fig. 3f), conditions associated with endothelial dysfunction and cognitive impairment19,20.
To determine whether HSD alters tau solubility, a critical determinant of its harmful effects16, tau levels were examined after sequential biochemical extraction in RAB (salt buffer), RIPA (detergent buffer) or 70% formic acid (FA), containing, respectively, soluble, less soluble and highly insoluble tau. After 12 weeks of HSD the tau in RIPA and FA fractions was increased, reflecting an increase in insoluble tau (Fig. 1g–i). Hypothermia, which does not cause cognitive impairment, also increased p-tau21, but, at variance with HSD, did not lead to more insoluble species (Extended Data Fig. 3g,h). These observations indicate that HSD not only promotes tau hyperphosphorylation but also aggregation.
Since the NO precursor L-arginine counteracts the endothelial NO deficit in HSD7, mice were given L-arginine in the drinking water (10gr/L) during the last 4 weeks of the HSD 12 week-treatment. L-arginine suppressed p-tau accumulation and prevented the cognitive dysfunction (Fig. 2a–e, Extended Data Fig. 4a), without affecting the increase in circulating IL-17 induced by HSD (Extended Data Fig. 4b). Consistent with a key role of endothelial NO deficiency on p-tau accumulation, p-tau was elevated in eNOS-null mice fed a ND and was not increased further by HSD (Extended data Fig. 4c–d).
Fig. 2: The NO precursor L-arginine prevents the increase in p-tau induced by HSD.
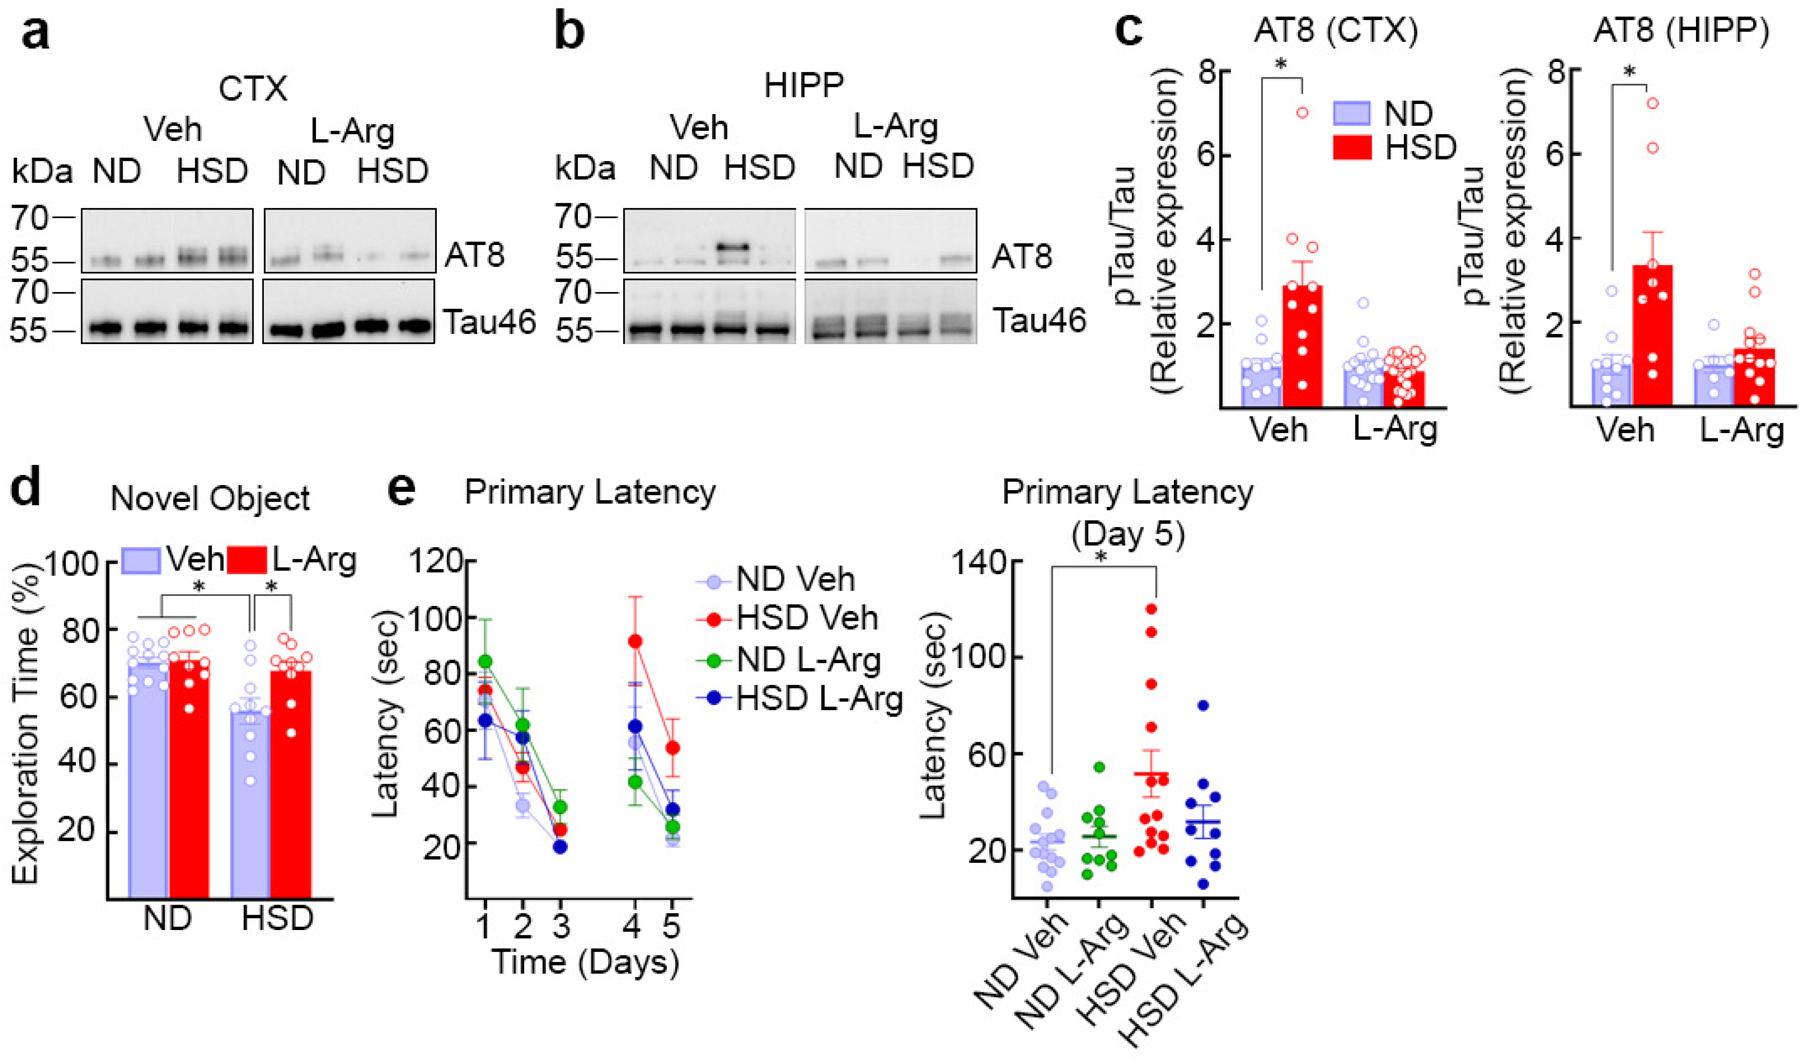
a–c, Administration of L-arginine (10 g/L in drinking water), starting at week 8 of HSD and continued through week 12, suppresses AT8 accumulation in neocortex and hippocampus (CTX: Veh, ND/HSD n=10/10; L-Arg – ND/HSD n=16/21, *p=0.0045 vs ND; HIPP: Veh, ND/HSD n=10/8; L-Arg – ND/HSD n=7/12, *p=0.0067 vs ND, two-tailed unpaired t-test). d,e, L-arginine treatment improves the cognitive deficits induced by HSD in both the novel object recognition test (Veh – ND/HSD n=12/10, L-Arg – ND/HSD n=6/11; Diet: *p=0.0156, Treatment: *p=0.0406, two-way ANOVA and Tukey’s test) and the Barnes Maze (Primary Latency, Diet: *p=0.0182, Time: *p<0.0001, two-way RM ANOVA plus Tukey’s test; Primary Latency, Day 5, *p=0.0439, Kruskal-Wallis test). For gel source data see supplementary figure 1. Data are expressed as mean±SEM.
Cdk5, a kinase responsible for tau hyperphosphorylation16, is tightly regulated by its binding partner p3522,23. Calpains cleave p35 bound to Cdk5 into p25 resulting in dysregulated activation of Cdk5 and tau hyperphosphorylation22,23. Since reduced endothelial NO may lead to tau phosphorylation by activating Cdk5 via p2524, we examined if HSD influences calpain and Cdk5 activity. Calpain 2 is more abundant than calpain 1 in neocortex (Fig. 3a) and is colocalized with Cdk5 in neurons (Extended Data Fig. 4e, f). HSD increased calpain activity leading to an increase in the p25/p35 ratio and Cdk5 activation (Fig. 3a–c). Cdk5 substrates besides tau, such as DARPP-3225, were not phosphorylated (Extended Data Fig. 4g). Administration of the Cdk5 peptide inhibitor TFP5 (40mg/kg, twice/week; i.p.)26 attenuated p-tau and prevented cognitive dysfunction (Fig. 3d–e), without blunting the increase in circulating IL-17 induced by HSD (Extended Data Fig. 4h). L-arginine prevented the calpain and Cdk5 activation induced by HSD (Fig. 3f) but did not alter calpain levels (Extended Data Fig. 4i). HSD did not increase the activity of GSK3β, an enzyme implicated in tau phosphorylation16, or the expression of the prolyl cis/trans isomerase Pin-1, a regulator of tau dephosphorylation27 (Extended Data Fig. 5a, b).
Fig. 3: HSD induces activation of calpain and Cdk5, an effect associated with calpain denitrosylation.
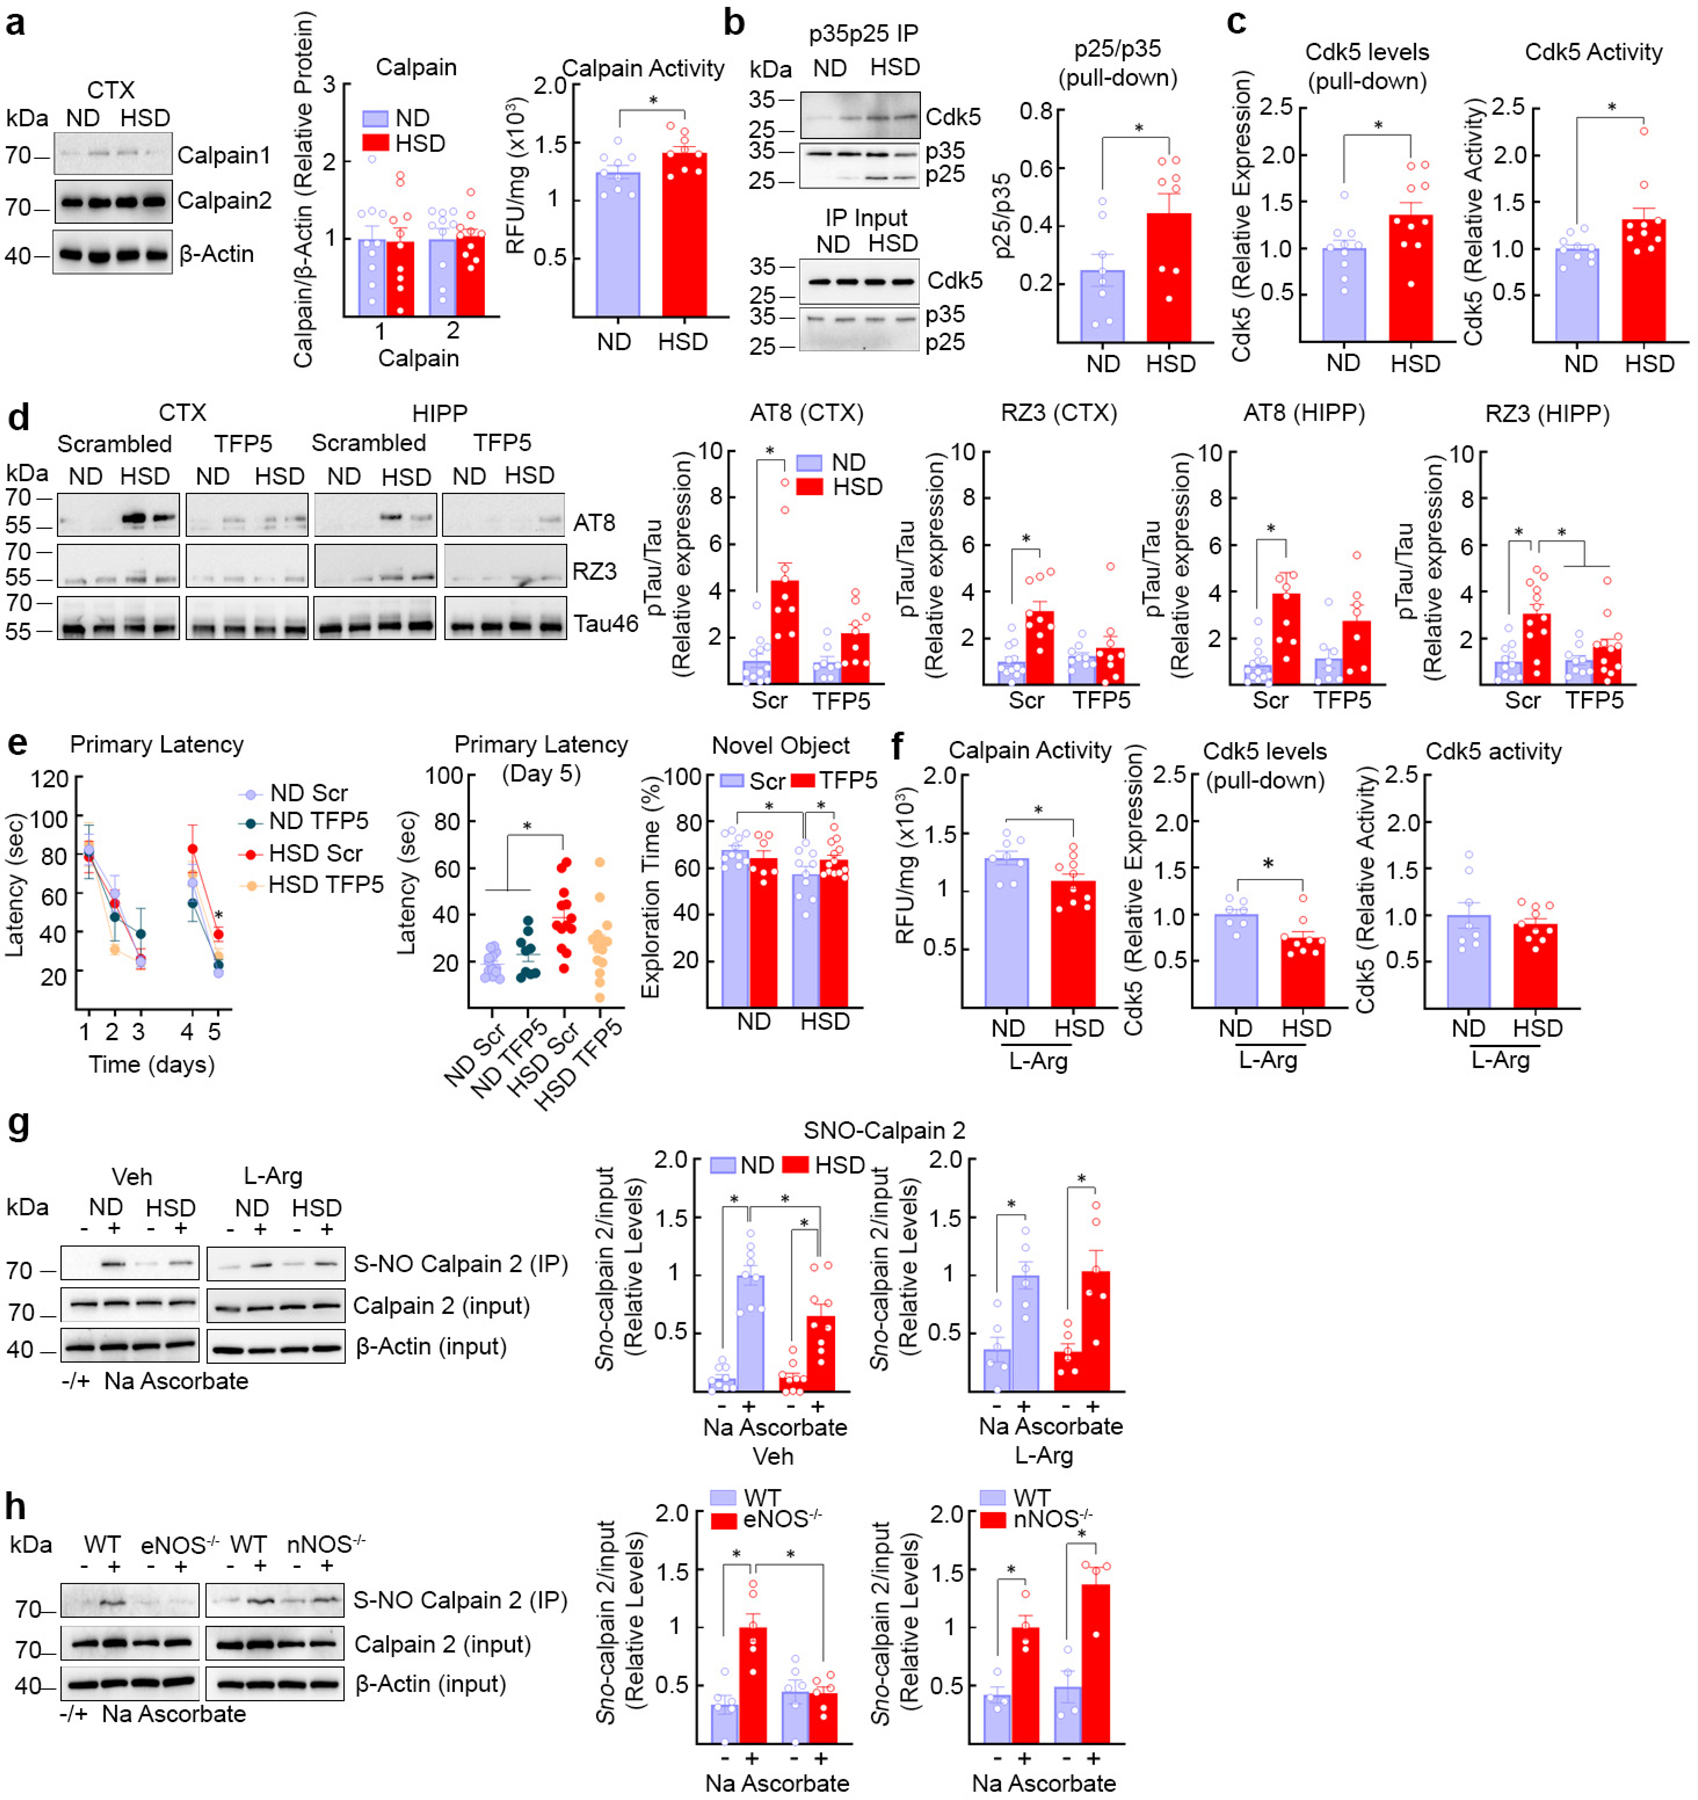
a, HSD did not alter calpain 1 or 2 expression (ND/HSD, n=10), but increased enzyme activity (ND/HSD n=9/9, *p=0.0404 vs ND, two-tailed unpaired t-test). b, HSD increases the cleavage of p35 into p25 (ND/HSD n=8/8, *p=0.0426 vs ND, two-tailed unpaired t-test). c, HSD increases Cdk5 bound to p35p25 (ND/HSD n=10/10, *p=0.0347 vs ND, two-tailed unpaired t-test) and Cdk5 activity (ND/HSD n=10/10, *p=0.0274 vs ND, two-tailed unpaired t-test). d, The Cdk5 peptide inhibitor TFP5 counteracts the HSD-induced increase of AT8 and RZ3 (AT8, CTX: ND/HSD Scrambled n=10/9, ND/HSD TFP5 n=9/9, Diet: *p<0.0001, Treatment: *p=0.0164; AT8, HIPP: ND/HSD Scrambled n=11/10, ND/HSD TFP5 n=10/7, Diet: *p=0.0004, Treatment: *p=0.0360; RZ3, CTX: ND/HSD Scrambled n=10/10, ND/HSD TFP5 n=10/11, Diet: *p<0.0001, Treatment: *p=0.0814; RZ3, HIPP: ND/HSD Scrambled n=12/11, ND/HSD TFP5 n=10/12, Diet: *p<0.0001, Treatment: *p=0.0066, two-way ANOVA plus Tukey’s test). e, TFP5 rescues the spatial memory deficits induced by HSD (Primary Latency, Diet: p=0.6415, Time: *p<0.0001, two-way RM ANOVA plus Tukey’s test; Primary Latency, Day 5, Diet: *p=0.0016, Treatment: p=0.5797, two-way ANOVA plus Tukey’s test). TFP5 also improves cognitive performance of HSD mice at the novel object recognition test (NOR) (Diet: *p=0.0383, Treatment: p=0.1488, two-way ANOVA plus Tukey’s test). f, L-arginine counteracts the increase in calpain (ND/HSD n=8/10, *p=0.0335 vs ND, two-tailed unpaired t-test) and Cdk5 activity induced by HSD and reduces Cdk5 bound to p35p25 (ND/HSD n=7/9, *p=0.0137 vs ND, two-tailed unpaired t-test). g, Calpain 2 nitrosylation is reduced by HSD (ND/HSD n=9/9, Diet: *p=0.0189; Ascorbate: *p<0.0001, two-way ANOVA and Tukey’s test), an effect rescued by L-Arginine (ND/HSD n=6/6, Diet: p=0.9487, Ascorbate: *p<0.0001, two-way ANOVA and Tukey’s test). h, Nitrosylation is suppressed in eNOS−/− (ND/HSD n=6/6, Genotype: *p=0.0223, Ascorbate: *p=0.0021, two-way ANOVA and Tukey’s test), but not in nNOS−/− mice (ND/HSD n=4/4, Genotype: p=0.0843, Ascorbate: p<0.0001; two-way ANOVA and Tukey’s test). For gel source data see supplementary figure 1. Data are expressed as mean±SEM.
Calpain, once activated by Ca2+, is regulated mainly by its endogenous inhibitor calpastatin and by nitrosylation by NO28, which suppress its activity29. Since HSD did not reduce calpastatin expression (Extended Data Fig. 5c), we used the biotin switch assay to investigate the effect of HSD on calpain nitrosylation. We found that HSD reduces calpain nitrosylation, an effect reversed by L-arginine (Fig. 3g). Nitrosylation was markedly suppresses in eNOS-null mice, but not in nNOS-null mice, attesting to the key role of eNOS-derived NO in regulating calpain nitrosylation and activity (Fig. 3h). Since HSD reduced Cdk5 nitrosylation (Extended Data Fig. 5d), it is unlikely that this modification, which activates the enzyme30, is involved.
Finally, we used tau-null mice and anti-tau antibodies to examine the relative contribution of p-tau and neurovascular dysfunction to the cognitive deficits induced by HSD. Tau-null mice on HSD for 12 weeks did not exhibit cognitive impairment, but still exhibited a marked attenuation of the CBF rise evoked by neocortical application of acetylcholine (Fig. 4a–d), a response mediated by eNOS-derived NO31. Similarly, WT mice treated with anti-tau antibodies (HJ8.8)32 or control IgG (50 mg/kg/week; i.p.) for the last 4 weeks of the 12-week HSD regimen, exhibited improved cognitive function (Fig. 4g), despite reduced resting CBF and attenuated CBF response to acetylcholine (Fig. 4e–f). HJ8.8 lowered p-tau in hippocampus (AT8) (Extended Data Fig. 5e) but did not blunt the increase in circulating IL-17 induced by HSD (Extended Data Fig. 5f). HSD did not affect the increases in CBF induced by neural activity both in tau-null mice or in mice treated with HJ8.8 (Extended Data Fig. 5g)
Fig. 4: HSD-induced cognitive dysfunction is not observed in tau−/− mice and is prevented by tau antibodies despite cerebrovascular insufficiency.
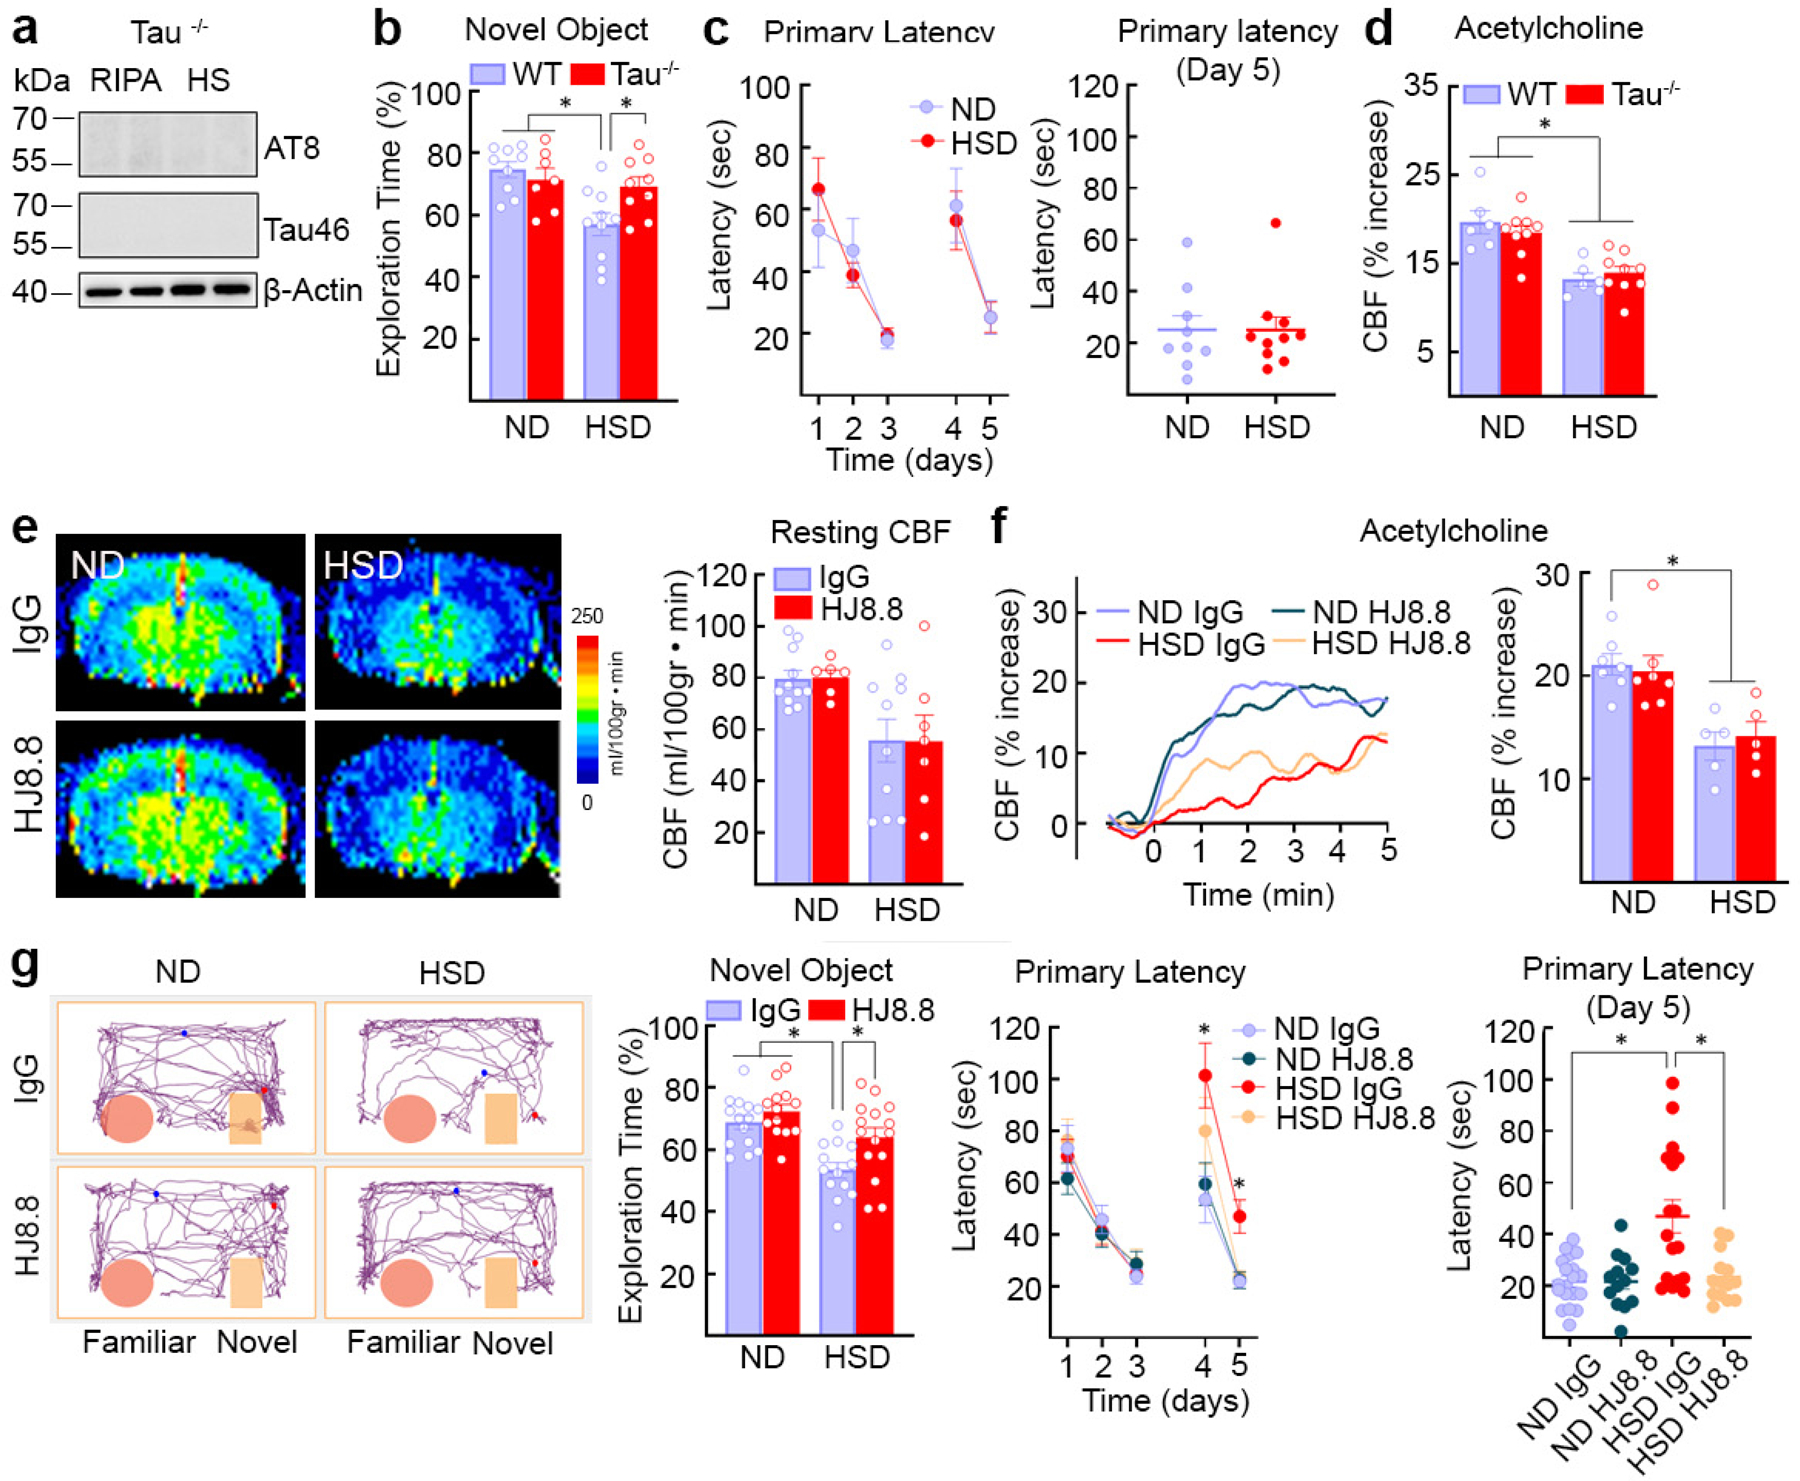
a, AT8 and Tau46 are absent in tau−/− mice in RIPA and heat-stable RIPA fractions. Representative blots from n=5 ND Tau−/− mice. b, c, HSD does not alter cognition in tau−/− mice at the NOR (WT: ND/HSD n=9/10; Tau−/−: ND/HSD n=7/9; Diet: *p=0.0055, Genotype: p=0.1827, two-way ANOVA and Tukey’s test) or the Barnes maze (ND/HSD n=9/10, Diet: p=0.9348, Time: *p<0001, two-way ANOVA and Tukey’s test). d, The CBF increase produced by neocortical application of acetylcholine is reduced in tau−/− mice (ND/HSD WT, n=6/6, Tau−/−, n=9/9; Diet: *p<0.0001, Genotype: p=0.7920, two-way ANOVA and Tukey’s test). e, Anti-tau antibodies (HJ8.8, 50mg/Kg/week, i.p.) do not rescue the reduction in resting CBF induced by HSD (IgG: ND/HSD n=11/9; HJ8.8: ND/HSD n=6/5; Diet: *p=0.0061, Treatment: p=0.9367, two-way ANOVA and Tukey’s test). f, HJ8.8 does not rescue the CBF response to acetylcholine (IgG: ND/HSD n=5/5; HJ8.8: ND/HSD n=5/5; Diet: *p=0.0005, Treatment: p=0.8516, two-way ANOVA and Tukey’s test). g, HJ8.8 ameliorates the cognitive dysfunction induced by HSD both at the NOR (IgG: ND/HSD n=15/13; HJ8.8: ND/HSD n=13/15; Diet: *p=0.0001, Treatment: *p=0.0054, two-way ANOVA and Tukey’s test) and the Barnes maze test (Primary Latency - IgG: ND/HSD n=19/15; HJ8.8: ND/HSD n=13/14; Time: *p<0.0001, Diet: *p=0.0358, two-way RM ANOVA and Tukey’s test; Primary Latency - Day 5 - IgG: ND/HSD n=19/16; HJ8.8: ND/HSD n=13/14; *p=0.0202, Kruskal-Wallis and Dunn’s test). For gel source data see supplementary figure 1. Data are expressed as mean±SEM.
These observations indicate that the cognitive dysfunction associated with HSD is mediated by a deficit in endothelial NO resulting in calpain denitrosylation, which, in turn leads to activation of Cdk5 and tau phosphorylation in neurons (Extended Data Fig. 5h). Remarkably, the hypoperfusion and neurovascular dysfunction, also resulting from the endothelial NO deficit, do not mediate the cognitive impairment. Rather, other aspects of endothelial function are at play, namely endothelial NO maintaining calpain homeostasis and preventing Cdk5 dysregulation and tau hyperphosphorylation.
Although animal models of HSD, in which the salt content is 8–16 folds higher than in the normal mouse chow7,17, may exceed the highest reported levels of human salt consumption (12.5–20 g/day or 3–6 times the recommended level of 4 g/day)33, our data provide a previously-unrecognized link between dietary habits, vascular dysfunction and tau pathology, independently of cerebral hypoperfusion. Such relationships may play a role in the frequent coexistence of vascular and neurogenerative pathologies underlying dementia, such as AD and frontotemporal dementia12,13. Whereas avoiding excessive salt consumption may help prevent tau pathology, therapeutic efforts to counteract cerebrovascular dysfunction need to go beyond rescuing cerebral perfusion, and target vascular mediators governing neurovascular interactions critical for cognitive health.
METHODS
Most of the methods used in this study are well established in the laboratory and have been described in detail in previous publications7,20,34. Here we provide only a brief description.
Mice
All procedures are approved by the institutional animal care and use committee of Weill Cornell Medicine (Animal protocol number: 0807–777A). Studies were conducted, according to the ARRIVE guidelines (https://www.nc3rs.org.uk/arrive-guidelines), in the following lines of mice: C57BL/6 (JAX), B6.129X1-Mapttm1Hnd (Tau−/−, JAX, Stock #007251), B6.129P2-Nos3tm1Unc/J (eNOS−/−, JAX, Stock #002684), B6.129S4-Nos1tm1Plh/J (nNOS−/−, JAX, Stock #002986), 129S6.Cg-Tg(APPSWE)2576Kha N20+? (Taconic, Stock #279), and Tg(Camk2a-tTA)1Mmay Fgf14Tg(tetO-MAPT*P301L)4510Kha/J (rTg4510, JAX, Stock#024854). Unless otherwise indicated, 8 week-old male mice were used.
High Salt Diet
Male or female mice (8 weeks old) received normal chow (0.5% NaCl) and tap water ad libitum (normal diet) or sodium-rich chow (4–8% NaCl) and tap water containing 1% NaCl ad libitum (HSD) for 4 to 36 weeks according to the experiment7.
In vivo treatments
The nitric oxide precursor, L-arginine (10gr/L; Sigma) was administered in the drinking water starting at 8 weeks of HSD and continuing until 12 weeks. ND and HSD mice were treated (i.p., weekly) with 50mg/kg of anti-Tau (HJ8.8), mouse IgG1 isotype control (Clone MOPC-21; bioXcell) antibodies for the last 4 weeks of the HSD treatment period (12 weeks) prior to behavioral and cerebrovascular studies. HJ8.8 is a high affinity antibody generated against human tau but able to recognize both human and mouse tau (KD=0.926 nM to mouse tau). In other experiments, ND and HSD mice were treated (i.p. twice/week) with 40mg/Kg of TPF5 (KEAFWDRCLSVINLMSSKMLQINAYARAARRAARR) or scrambled peptide (GGGFWDRCLSGKGKMSSKGGGINAYARAARRAARR) (Peptide 2.0)35 for the last 4 weeks of the HSD treatment period (12 weeks) prior to behavioral and molecular studies.
General surgical procedures for CBF studies
Mice were anesthetized with isoflurane (induction, 5%; maintenance, 2%). The trachea was intubated and mice were artificially ventilated with a mixture of N2 and O2. One of the femoral arteries was cannulated for recording mean arterial pressure (MAP) and collecting blood samples for blood gas analysis36. Rectal temperature was maintained at 37°C. End tidal CO2, monitored by a CO2 analyzer (Capstar-100, CWE Inc.), was maintained at 2.6–2.7% to provide a pCO2 of 30–40 mmHg and a pH of 7.3–7.437. After surgery, isoflurane was discontinued and anesthesia was maintained with urethane (750 mg/kg, i.p.) and chloralose (50 mg/kg, i.p.). Throughout the experiment the level of anesthesia was monitored by testing motor responses to tail pinch.
Monitoring cerebral blood flow
A small craniotomy (2×2mm) was performed to expose the parietal cortex, the dura was removed, and the site was superfused with Ringer’s solution (37°C; pH 7.3–7.4)20. CBF was continuously monitored at the site of superfusion with a laser-Doppler probe (Perimed) positioned stereotaxically ≈0.5mm above the cortical surface and connected to a data acquisition system (PowerLab). CBF values are expressed as percentage increases relative to the resting level.
Protocol for CBF experiments
After MAP and blood gases stabilized, CBF responses were recorded7. The whisker-barrel cortex was activated for 60 seconds by stroking the contralateral vibrissae, and the evoked changes in CBF were recorded. The endothelium-dependent vasodilator acetylcholine (ACh; 100μM; Sigma), was superfused on the exposed neocortex for 5 minutes and the associated CBF changes were recorded by laser-Doppler flowmetry. CBF and MAP data were collected by using Chart 5 Pro (v5.5.6).
Measurement of resting CBF by ASL-MRI
CBF was assessed quantitatively using arterial spin labeling magnetic resonance imaging (ASL-MRI), performed on a 7.0 Tesla 70/30 Bruker Biospec small-animal MRI system with 450 mT/m gradient amplitude and a 4500 T · m−1 · s−1 slew rate. A volume coil was used for transmission and a surface coil for reception. Anatomical localizer images were acquired to find the transversal slice approximately corresponding to bregma 0.5 mm. This position was used for subsequent ASL-MRI, which was based on a flow-sensitive alternating inversion recovery rapid acquisition with relaxation enhancement (FAIR-RARE) pulse sequence labeling the inflowing blood by global inversion of the equilibrium magnetization. One axial slice was acquired with a field of view of 15 × 15 mm, spatial resolution of 0.117 × 0.117 × 1 mm, TE of 5.368 ms, effective TE of 48.32 ms, recovery time of 10 s, and a RARE factor of 72. Twenty-two turbo inversion recovery values ranging from 30 to 2300 ms were used, and the inversion slab thickness was 4 mm. For computation of resting CBF (rCBF), the Bruker ASL perfusion processing macro was used. It uses the model of Kober et al.37 and includes steps to mask out the background. The masked rCBF images were exported to Analyze format on the MRI console. The ASL images were analyzed by ImageJ and the average CBF value is reported as mL per 100g of tissue per minute7.
Osmotic minipumps implantation for delivery of angiotensin-II
Osmotic minipumps containing vehicle (saline) or angiotensin-II (600 ng·kg−1·min−1) were implanted subcutaneously under isoflurane anesthesia. Systolic blood pressure was monitored in awake mice using tail-cuff plethysmography20. Forty-two days later, mice were anesthetized and their brains were collected for assessment of tau phosphorylation.
Hypothermia
C57BL/6 mice (12 weeks old) were anesthetized by injection of ketamine/xylazine (100/10 mg/kg). Rectal temperature was continuously monitored and kept at 37°C (normothermia) or 30°C (hypothermia) using a thermostatically-controlled heating pad. Mice were sacrificed 30 minutes after anesthesia and their brains were collected and frozen on dry ice. Tissues were kept at −80°C until processing for immunoblot analysis.
Immunoblot analysis
Cortex (≈80–90mg) and hippocampus (≈15mg) isolated from ND and HSD mice were sonicated in 800 and 500μl of RIPA buffer (50mM Tris-HCl pH 8.0, 150mM NaCl, 0.5% Deoxycholic Acid, 0.1% SDS, 1mM EDTA pH 8.0, 1% IGEPAL CA-630, 1mM Na3VO4, 20mM NaF and one tablet/10mL of cOmplete™, EDTA-free Protease Inhibitor Cocktail, Millipore Sigma) and equal volumes were mixed with SDS sample buffer, boiled, and analyzed on 10% or 10–20% Novex™ WedgeWell™ gels (Thermo Fisher Scientific). Proteins were transferred to PVDF membranes (Millipore), blocked at room temperature (RT) for 1 hour with 5% milk in TBS, and incubated, overnight at 4°C, with primary antibodies (see Reporting Summary) in 5% BSA in TBS/0.1% Tween-20 (TBST). Membranes were washed in TBST, incubated with goat anti-mouse or rabbit secondary antibodies conjugated to horseradish peroxidase (Santa Cruz Biotechnology) for 1 hour at RT and protein bands were visualized with Clarity Western ECL Substrate (Bio Rad) on a Bio Rad ChemiDoc MP Imaging System. Quantification was performed using Image Lab v6.0 (Bio Rad).
Preparation of heat-stable RIPA fractions for tau enrichment
After homogenization in cold RIPA buffer and centrifugation, 150μl of the supernatant containing the proteins was boiled at 100°C for 10 minutes. Samples were cooled on ice for 20 minutes and then centrifuged at 20,000 g at 4°C for 15 minutes. The supernatant corresponding to the heat stable (HS) fraction was then harvested. This method is used to isolate proteins resistant to heat including tau and other microtubule-associated proteins. Thus, endogenous immunoglobulins are precipitated during the boiling process and eliminated from the supernatant. The proteins were then mixed with equal volumes of SDS sample buffer, boiled, and analyzed on 10% Novex™ WedgeWell™ gels (Thermo Fisher Scientific). Although tau protein is partially lost during the boiling process, the HS samples are enriched with tau (Extended Data Fig. 5h). Furthermore, boiling significantly improves specificity of certain antibodies such as AT8, RZ3 or MC138.
Tau dephosphorylation
After overnight dialysis to remove phosphatase inhibitors, protein samples (40μl) were incubated with 5μL of 10X NEBuffer for Protein MetalloPhosphatases (PMP), 5μL of 10mM MnCl2 and 1μl of Lambda Protein Phosphatase (Lambda PP, New England Biolabs) at 30°C for 3 hours. Reactions were stopped by addition of SDS sample buffer and boiling for 5 minutes at 100 °C.
Brain tissue protein extraction
Extraction was performed as described previously32. The cortex (≈80–90mg) and the hippocampus (≈15mg) of each brain were homogenized by sonication in 800 and 300μl of RAB buffer [100mM MES, 1mM EDTA, 0.5mM MgSO4, 750mM NaCl, 20mM NaF, 1mM Na3VO4, supplemented by EDTA-free Protease Inhibitor Cocktail, Millipore Sigma], respectively. In brief, the samples were centrifuged at 50,000g for 20 minutes at 4°C using an Optima MAX-TLA 120.2 Ultracentrifuge (Beckman). The supernatants were collected as RAB soluble fractions and pellets were resuspended in identical volumes of RIPA buffer [150mM NaCl, 50mM Tris, 0.5% deoxycholic acid, 1% Triton X-100, 0.5% SDS, 25mM EDTA, pH 8.0, 20mM NaF, 1mM Na3VO4 supplemented by EDTA-free Protease Inhibitor Cocktail, Millipore Sigma], and centrifuged at 50,000 g for 20 minutes at 4°C. The supernatants were collected as RIPA soluble fractions. The pellets were sonicated in 70% formic acid (300μl for the cortex and 125μl for the hippocampus), and centrifuged at 50,000g for 20 minutes at 4°C. The supernatants were collected as 70% formic acid fractions. All fractions were stored in −80°C until analyzed. For western blotting, an aliquot of 100μl of the formic acid fractions was evaporated in a Savant SpeedVac concentrator at 45°C for 1 hour. The samples were resuspended in 100μl of SDS sample buffer with the addition of 1μl of 10N NaOH, sonicated and then boiled for 5 minutes.
Tau, Aβ and IL-17 Measurement
Tau, Aβ and IL-17 were measured using an electrochemiluminescence-based multi-array method through the Quickplex SQ 120 system (Meso Scale Diagnostics LLC). Tau and Aβ peptides levels (Aβ38, Aβ40 and Aβ42) were measured in RAB, RIPA and FA fractions of both cortex and hippocampus using the MSD Mouse Total Tau (K151DSD) and the MSD V-PLEX Aβ Peptide Panel 1 (4G8) (K15199) kits according to the manufacturer’s protocol. IL-17A was measured in the serum of ND and HSD mice using the MSD V-PLEX Mouse IL-17A Kit (K152RFD) according to the manufacturer’s protocol.
Immunohistochemistry
After 12 weeks of ND/HSD, mice were anesthetized with intraperitoneal pentobarbital (200 mg/kg), and then perfused transcardiacally with cold PBS, followed by cold 4% paraformaldehyde (PFA) in PBS. The brains were removed and immersed first in 4% PFA overnight and then in 70% ethanol for 3 days. Brains were then embedded in paraffin and cut into 6μm sections using a microtome. After rehydration and antigen retrieval in preheated citrate buffer (10μM) for 30 minutes, brain sections were immersed in 3% H2O2 and then blocked with 100% Sniper (Biocare Medical) for 1 hour. After blocking, sections were incubated for 2.5 days at 4°C with the AT8, MC1 (1:250, 1:100 in 1:50 Sniper in PBS, respectively) and thereafter processed for 1 hour with the biotinylated secondary antibody in 1% normal donkey serum PBS (anti-mouse IgG1, Jackson ImmunoResearch). Reactions were visualized with the ABC-complex (Vectorlabs) and 3,3-diaminobenzidine. A Nikon light microscope was used to visualize the signal associated with each antibody.
Immunofluorescence
After 12 weeks of ND/HSD, mice were anesthetized with intraperitoneal pentobarbital (200 mg/kg), and then perfused transcardiacally with cold PBS, followed by cold 4% paraformaldehyde (PFA) in PBS. The brains were removed and immersed first in 4% PFA overnight. Sections (thickness: 40 μm) were cut through the whole brain using a vibratome. After blocking with 5% normal donkey serum in 0.5% Triton-X/PBS, sections were incubated over the weekend at 4°C with NeuN (1:200, Mouse, Millipore Sigma, MAB377) GFAP (1:200, Mouse, Millipore Sigma, G3893), Iba1 (1:200, Rabbit, Wako, 019–19741), CD13 (1:200, Goat, R&D Systems, AF2335), Calpain 2 (1:100, Rabbit, Santa Cruz, sc-373966) or Cdk5 (1:100, Rabbit, Santa Cruz, sc-6247) antibodies in 0.5% Triton-X in PBS and thereafter processed for 2 hours with FITC, Cy3 or Cy5 secondary antibodies in 0.5% Triton-X in PBS. An epifluorescence microscope (IX83 Inverted Microscope, Olympus) or a confocal microscope (Leica TCS SP5) were used to visualize the signal associated with each antibody.
Fluoro Jade B Staining
After rehydration, brain sections (6μm) were immersed in 1% sodium hydroxide in 80% alcohol for 5 min, followed by 2 min in 70% alcohol and 2 min in distilled water. The slides were transferred to a solution of 0.06% potassium permanganate for 10 min on a shaker. After rinsing for 2 min in distilled water, the slides were immersed in the staining solution (0.0004% Fluro Jade B, Millipore Sigma, in 0.1% acetic acid) for 20 min in the dark. Finally, the slides were rinsed three times for one min in distilled water and then placed on a slide warmer, set at approximately 50°C, until they were fully dry. The dry slides were cleared by immersion in xylene for at least a min before cover-slipping with DPX (Sigma).
TUNEL Staining
After rehydration and antigen retrieval according to the manufacturer’s protocol (In Situ Cell Death Detection Kit, Fluorescein, Roche, #11 684 795 910), brain sections were blocked for 30 min in Tris-HCl, 0.1 M pH 7.5, containing 3% BSA and 20% normal donkey serum and then incubated with the TUNEL reaction mixture for 60 min at 37°C in a humidified atmosphere in the dark. After washing, slides were evaluated by an epifluorescence microscope (IX83 Inverted Microscope, Olympus). A positive control was obtained by pre-incubating brain slices with DNase I recombinant (3000 U/ml in 50 mM Tris-HCl, pH 7.5, 1 mg/ml BSA), for 10 min at room temperature, to induce DNA strand breaks.
Kluver-Barrera white matter staining
The Klüver-Barrera stain was performed using the Luxol Fast Blue Stain Kit (ScyTek Laboratory Inc.). Brains were harvested after transcardiac perfusion with PBS and 4% PFA, sectioned with a vibratome (thickness 40 μm), and the positive (blue stained) area in the corpus callosum was quantified by ImageJ.
Thioflavin S Staining
After mounting on slides and post-fixation with 4% PFA in PBS for 10 minutes, coronal brain sections (40μm) were washed and labeled with 0.05% (wt/vol) thioflavine-S in 50% (vol/vol) ethanol for 10 minutes as previously described39. An epifluorescence microscope (IX83 Inverted Microscope, Olympus) was used to visualize the FITC signal associated with thioflavine-S.
Calpain activity
Calpain activity was measured by using a Calpain Activity Assay Kit from AbCam40,41. Briefly, fresh cortex and hippocampus were homogenized in the extraction buffer provided with the kit, which specifically extracts cytosolic proteins without contaminations of cell membrane and lysosome proteases and prevents auto-activation of calpain during the extraction procedure. The fluorometric assay is based on the detection of cleavage of calpain substrate Ac-LLY-AFC. Ac-LLY-AFC emits blue light (ʎmax = 400nm); upon cleavage of the substrate by calpain, free AFC emits a yellow-green fluorescence (ʎmax = 505nm), which can be quantified using a fluorometer or a fluorescence plate reader. Specificity of the signal was confirmed by using the calpain inhibitor Z-LLY-FMK (100–200μM). The activity is expressed as Relative Fluorescent Unit (RFU) per milligram of protein for each sample.
p35/p25 and GSK3β immunoprecipitation
Immunoprecipitation was performed with anti-p35p25 (Cell Signaling), anti-GSK3β (Cell Signaling) or anti-rabbit monoclonal IgG1 isotype control antibody (Santa Cruz Biotechnology). Samples were incubated overnight with the primary antibodies and then with protein-A sepharose (p35p25) (GE Healthcare Life Sciences) or protein-G Dynabeads (GSK3β) (Thermo Fisher Scientific) for 2 hours at 4° C. Precipitates were used for Cdk5 or GSK3β activity measurements. Immunoprecipitation was confirmed by loading the samples on 10% Tris-glycine SDS polyacrylamide gels and western blot as described above.
Detection of S-nitrosylation with the biotin-switch technique
Detection of S-nitrosylated calpain 2 was performed using the biotin-switch technique, as previously described42. Briefly, samples were sonicated in 800μl of RIPA buffer containing 0.1mM of neocuproine and, after centrifugation, protein concentrations were measured. Cysteine thiol groups in 1mg of proteins were blocked with 10% S-methylmethane thiosulfonate (MMTS) (Sigma). After protein-precipitation with 100% acetone, sodium ascorbate was added to the sample to convert each S-nitrothiols (SNO) to a free thiol via a transnitrosation reaction to generate O-nitrosoascorbate. Next, each nascent free thiol (previously an SNO site) was biotinylated with biotin–HPDP (Pierce). Biotinylated proteins were then pull-down by using avidin beads and analyzed on 10% Novex™ WedgeWell™ gels (Thermo Fisher Scientific). Before avidin pulldown, a small fraction of each sample was collected to determine protein “input.” The degree of pulldown correlates with protein S-nitrosylation of calpain 2 or Cdk5 which was detected with an antibody against the two proteins (see Extended Data Suppl. Table 1). Nitrosylation of calpain 2 or Cdk5 is expressed as the ratio between the pull-down signal and the input corrected for the β-actin levels.
Cdk5 and GSK3β activity
Cdk5 activity in brain lysates was determined after pulldown with p25/p35 antibody (Cell Signaling) from 500μg total protein using a synthetic histone H1 peptide substrate (PKTPKKAKKL, Enzo Life Sciences). GSK3β activity was determined after pulldown with GSK3β antibody (Cell Signaling) from 100μg total protein using phospho-glycogen synthase peptide-2a as substrate (Tocris). Phosphorylation reactions were initiated by mixing bead-coupled Cdk5 with 40μl reaction buffer containing the following: 50mM HEPES.KOH (pH 7.4), 5mM MgCl2, 0.05% BSA, 50μM substrate, 50μM cold ATP, 1mM dithiothreitol, 1x complete protease inhibitors without EDTA (Roche Applied Biosciences) and 5 Ci/mmole γ32P-ATP. Companion reactions for every sample were executed in the presence of the Cdk5 inhibitor ((R)-CR8, Tocris) (10μM) or the GSK3β inhibitor (CHIR 99021, Tocris) (10μM) to correct for non-specific activity. Reactions were incubated at 30°C for 30 minutes, after which they were terminated by spotting on P81 phosphocellulose cation exchange chromatography paper. Filters were washed 4 times for 2 minutes in 0.5% phosphoric acid, and the remaining radioactivity was quantified in a scintillation counter by the Cherenkov method.
Novel Object Recognition Test
The novel object recognition test (NOR) task was conducted under dim light in a plastic box. Stimuli consisted of plastic objects that varied in color and shape but had similar size43,44. A video camera mounted on the wall directly above the box was used to record the testing session for offline analysis. Mice were acclimated to the testing room and chamber for one day prior to testing. Twenty-four hours after habituation, mice were placed in the same box in the presence of two identical sample objects and were allowed to explore for 5 minutes. After an intersession interval of 24 hours, mice were placed in the same box but one of the two objects was replaced by a novel object. Mice were allowed to explore for 5 minutes. Exploratory behavior was later assessed manually by an experimenter blinded to the treatment group. Exploration of an object was defined as the mouse sniffing the object or touching the object while looking at it. Placing the forepaws on the objects was considered as exploratory behavior but climbing on the objects was not. A minimal exploration time for both objects (total exploration time) during the test phase (~5 seconds) was used. The amount of time taken to explore the novel object was expressed as percentage of the total exploration time and provides an index of recognition memory43,44. Any Maze v5.3 was used for collection and analysis of the behavioral data.
The Barnes Maze test
The Barnes maze consisted of a circular open surface (90cm in diameter) elevated to 90cm by four wooden legs45. There were 20 circular holes (5cm in diameter) equally spaced around the perimeter, and positioned 2.5cm from the edge of the maze. No wall and no intra-maze visual cues were placed around the edge. A wooden plastic escape box (11×6×5cm) was positioned beneath one of the holes. Two neon lamps and a buzzer were used as aversive stimuli. The Any-Maze tracking system (Stoelting) was used to record the movement of mice on the maze. Extra-maze visual cues consisted of objects within the room (table, computer, sink, door, etc.) and the experimenter. Mice were tested in groups of seven to ten, and between trials they were placed into cages, which were placed in a dark room adjacent to the test room for the inter-trial interval (20–30 minutes). No habituation trial was performed. The acquisition phase consisted of 3 consecutive training days with three trials per day with the escape hole located at the same location across trials and days. On each trial a mouse was placed into a start tube located in the center of the maze, the start tube was raised, and the buzzer was turned on until the mouse entered the escape hole. After each trial, mice remained in the escape box for 60 seconds before being returned to their cage. Between trials the maze floor was cleaned with 10% ethanol in water to minimize olfactory cues. For each trial mice were given 3 minutes to locate the escape hole, after which they were guided to the escape hole or placed directly into the escape box if they failed to enter the escape hole. Four parameters of learning performance were recorded: (1) the latency to locate (primary latency) and (2) enter the escape hole (total latency), (3) the number of errors made and (4) the distance traveled before locating the escape hole45. When a mouse dipped its head into a hole that did not provide escape was considered an error. On days 4 and 5, the location of the escape hole was moved 180° from its previous location (reverse learning) and two trials per day were performed. Any Maze v5.3 was used for collection and analysis of the behavioral data.
Statistics
Sample size was determined according to power analysis based on previously published work by our lab on the effects of dietary salt on CBF regulation and cognitive function7. On these bases, 10–15 mice/group were required in studies involving assessment of cognitive function and cerebrovascular function7,20. Mouse randomization for the different experimental conditions and treatments was performed based on the random number generator function (RANDBETWEEN) in Microsoft Excel software. Analysis of the data was performed in a blinded fashion using the GraphPad Prism (v. 7.0) software. All data was tested for normal distribution by using the Shapiro-Wilk test. Intergroup differences were analyzed by two-tailed unpaired t-test for single comparison or by one or two-way analysis of variance (Tukey’s or Bonferroni’s post-hoc analysis) for multiple comparisons. Non-normally distributed data was tested with the Mann-Whitney U test for single comparison or the Kruskal-Wallis test for multiple comparisons. Data are expressed as mean±SEM and differences are considered statistically significant for p<0.05.
Extended Data
Extended Data Fig. 1: HSD (4 and 8%) induced tau phosphorylation: brain localization, sex differences, and time course.
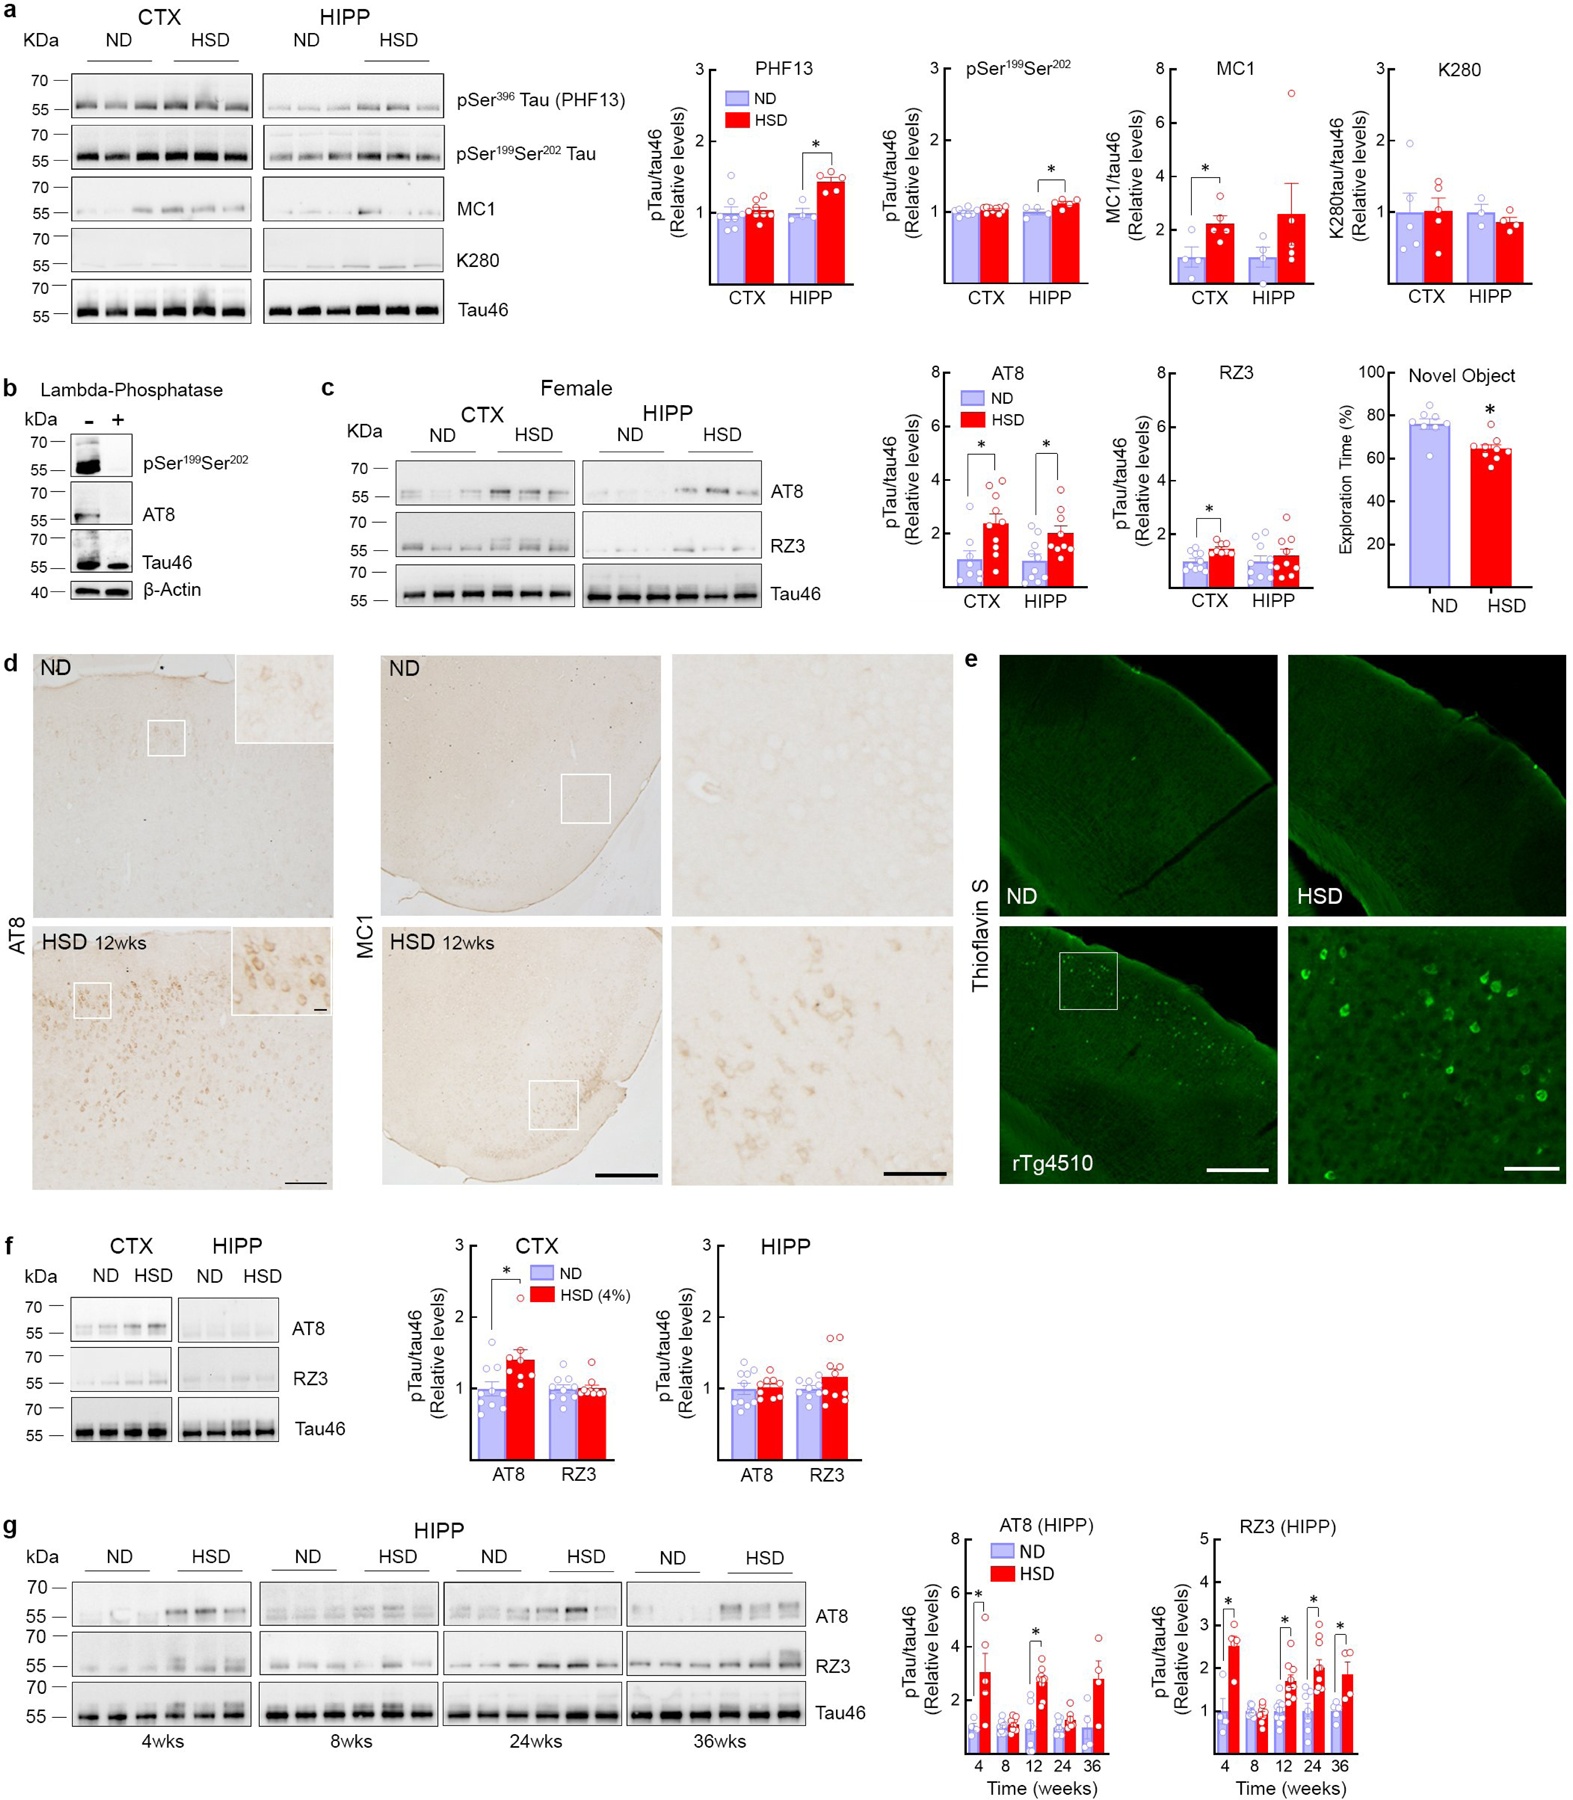
a, HSD (NaCl 8%) increases tau phosphorylation on Ser396 (PHF13) and on Ser199Ser202 in the hippocampus but not in the neocortex (HIPP: PHF13, ND/HSD n=4/5, *p=0.0016 vs ND, Ser199Ser202, ND/HSD n=4/5, *p=0.0337, two-tailed unpaired t-test), whereas acetylation of Tau on Lys280 (K280) is not affected. MC1 levels increase in both neocortex and hippocampus but reaching statistical significance only in neocortex (CTX: MC1, ND/HSD n=4/5, *p=0.0321 vs ND, two-tailed unpaired t-test). b, Tau phosphorylation on Ser199Ser202 and Ser202Thr205 is abolished after treatment of brain samples with lambda phosphatase. c, HSD increases AT8 in neocortex and in hippocampus of female mice, whereas RZ3 only increases in neocortex (AT8, CTX: ND/HSD n=8/10, *p=0.0159 vs ND; HIPP: ND/HSD n=10/9, *p=0.0151 vs ND; RZ3, CTX: ND/HSD n=10/8, *p=0.0117 vs ND, two-tailed unpaired t-test). HSD induces a deficit in novel object recognition in female mice (ND/HSD n=8/9, *p=0.0017 vs ND, two-tailed unpaired t-test). d, HSD increases AT8 immunoreactivity in neuronal cell bodies of the somatosensory cortex (size bar=100 μm; 10μm in inset) and MC1 immunoreactivity in neuronal bodies of the pyriform cortex (size bar=500 μm; 100 μm in inset). Representative images from ND and HSD mice (n=5/group). e, Thioflavin S staining is not present in mice fed a HSD indicating absence of neurofibrillary tangles, which can be observed in rTg4510 mice (size bar=500μm; 100 μm in inset). Representative images from n=5/each ND and HSD mice and n=3 rTg4510 mice. f, HSD (4%) increases AT8 levels in neocortex but not in hippocampus (AT8, CTX: ND/HSD n=5/5, *p=0.0148 vs ND, two-tailed unpaired t-test). RZ3 was not increased in both regions. g, Time course of the increase in AT8 and RZ3 induced by HSD in the hippocampus. AT8 levels are increased at 4 and 12 weeks of HSD. RZ3 levels are increased at 4, 12, 24 and 36 weeks of HSD (AT8, 4 weeks: ND/HSD n=4/5, *p=0.0386 vs ND; 12 weeks: ND/HSD n=9/9, *p<0.0001 vs ND; RZ3, 4 weeks: ND/HSD n=4/5, *p=0.0041 vs ND; RZ3, 12 weeks: ND/HSD n=9/9, *p=0.0011 vs ND; 24 weeks: ND/HSD n=7/10, *p=0.0017 vs ND; 36 weeks: ND/HSD n=5/4, *p=0.0188 vs ND, two-tailed unpaired t-test). For gel source data see supplementary figure 1. Data are expressed as mean±SEM.
Extended Data Fig. 2: Effect of HSD on neurons, astrocytes, microglia/macrophages, pericytes, and white matter integrity.
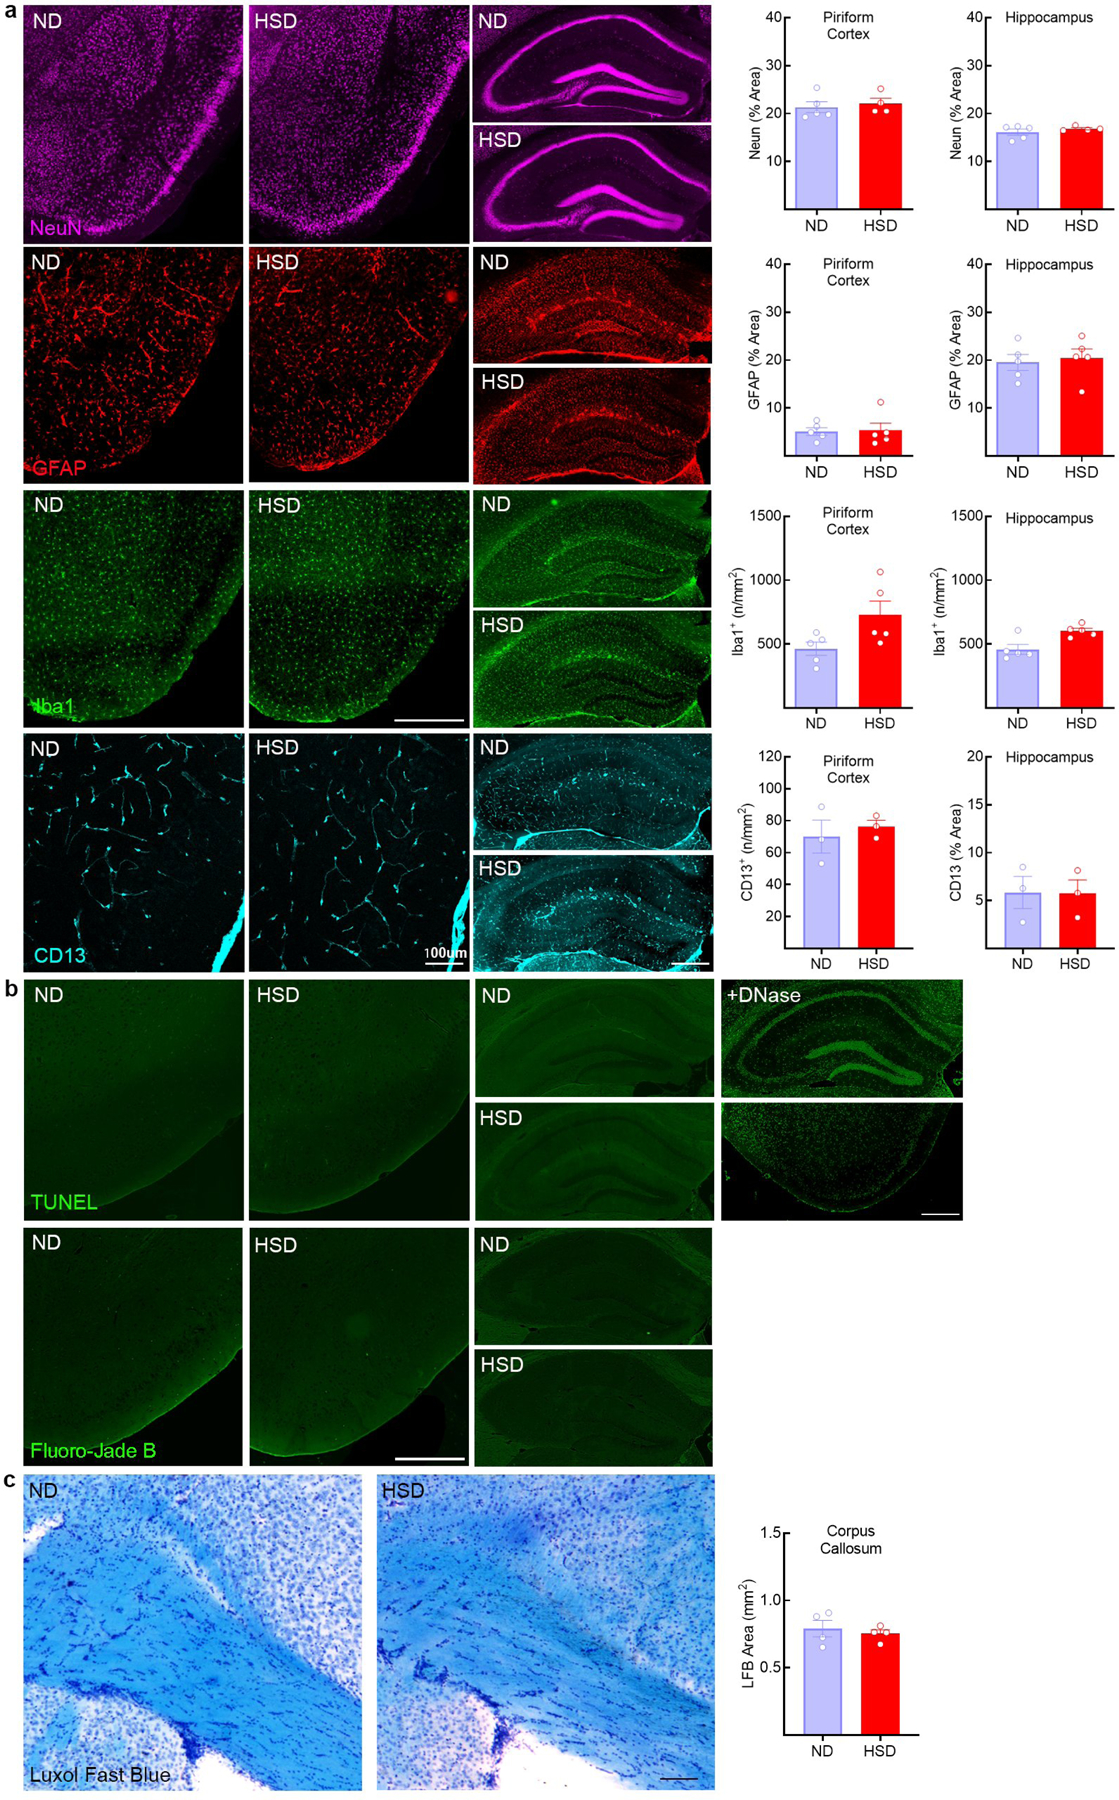
a, HSD (NaCl 8%) does not affect neurons (Neun), astrocytes (GFAP), microglia/macrophages (Iba-1, CTX: ND/HSD n=5/5, p=0.0570 vs ND; HIPP: ND/HSD n=5/5, p=0.0556 vs ND, two-tailed unpaired t-test) and pericytes (CD13) in both the pyriform cortex and the hippocampus (size bar=500 μm). b, No evidence of neuronal cell death is observed in HSD mice by using Fluoro-Jade B or TUNEL stainings (size bar=500 μm). +DNase indicates positive control for TUNEL staining. Representative images from ND and HSD mice (n=5/group). c, Kluver-Barrera stain shows no white matter damage in the corpus callosum of HSD mice. Representative images from ND and HSD mice (n=4/group). Data are expressed as mean±SEM.
Extended Data Fig. 3: Aβ levels in HSD and correlation of behavioral deficits with p-tau, as well as p-tau in hypertension, HSD-treated tg2576 mice and hypothermia,
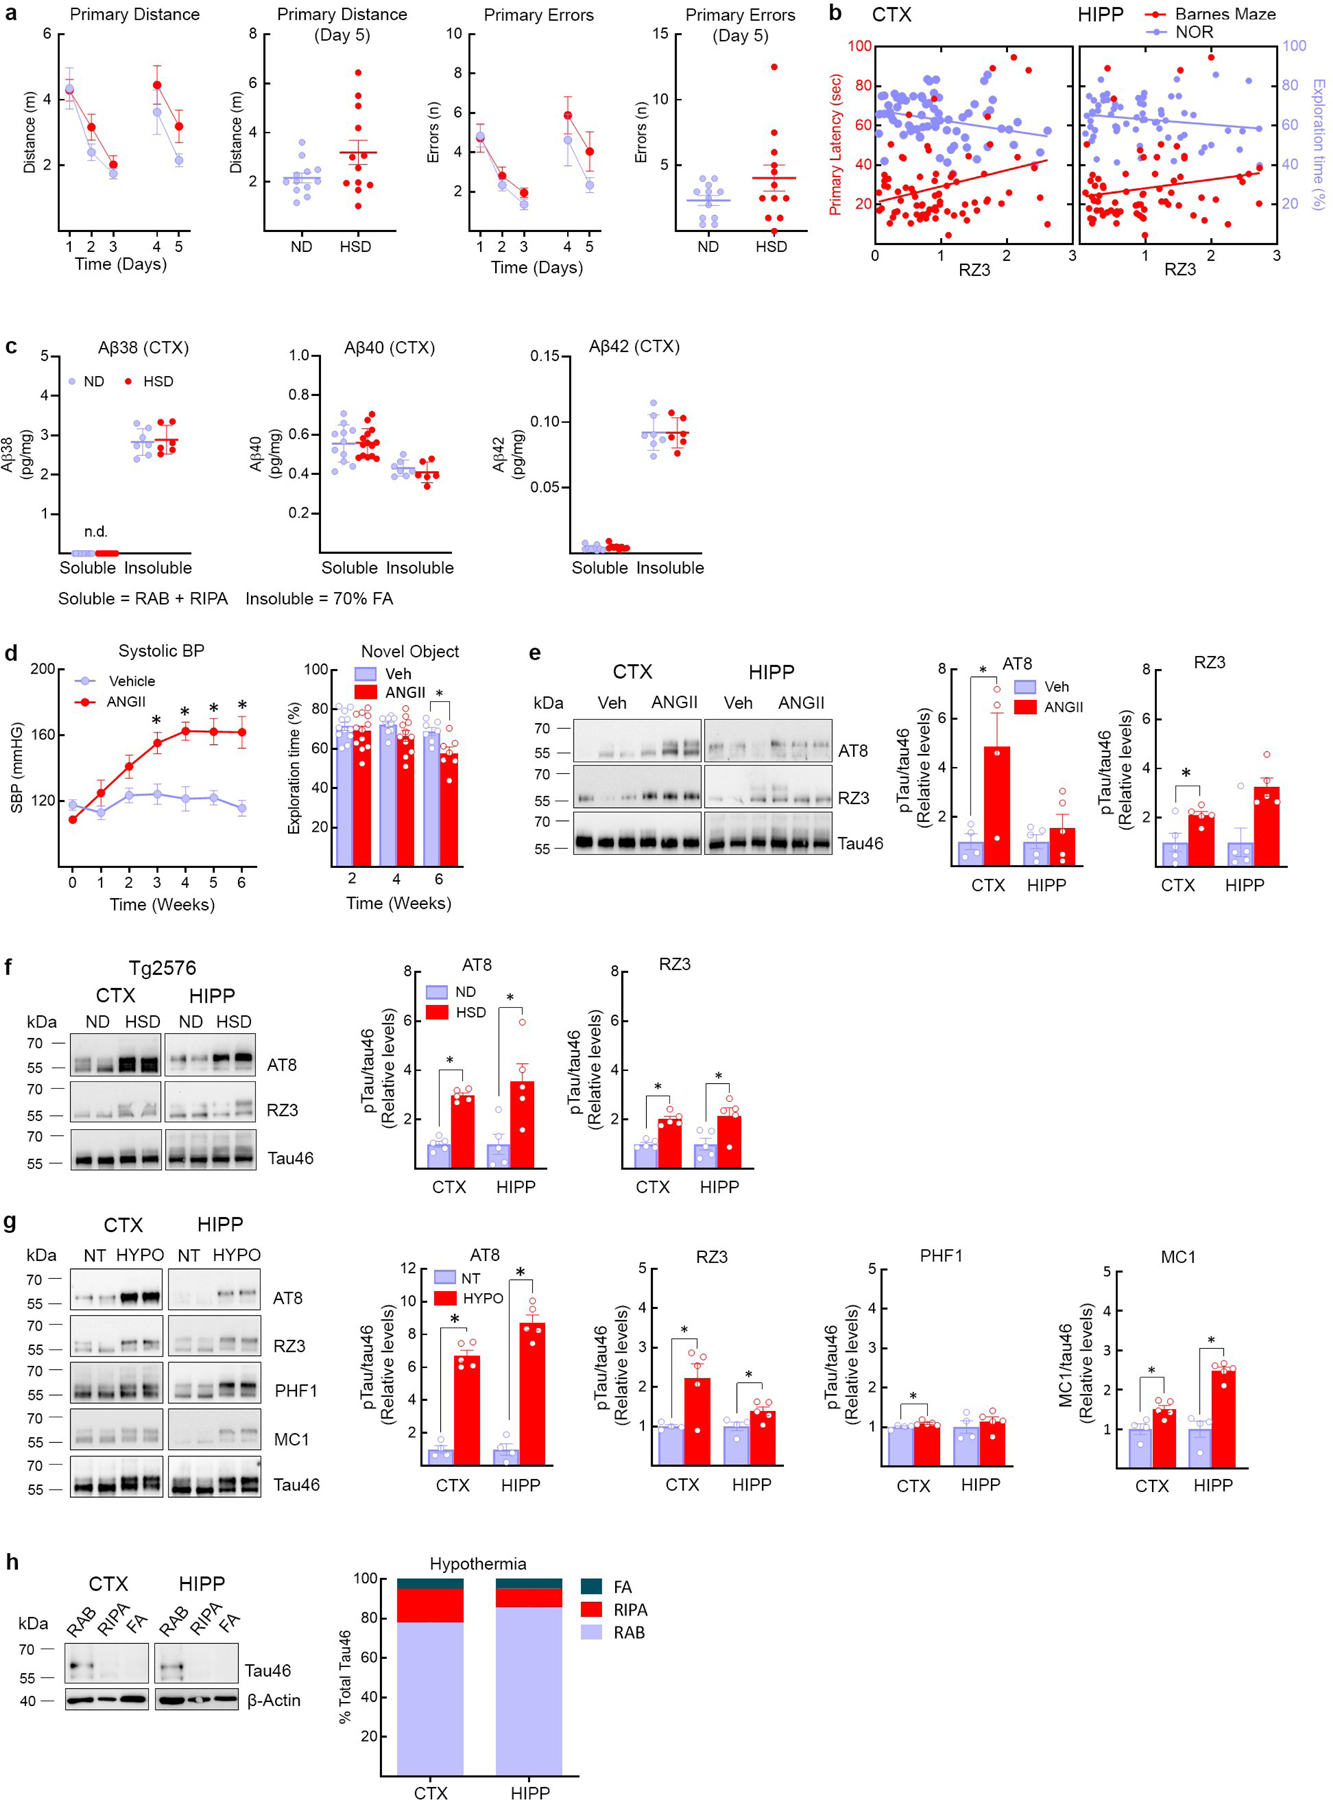
a,HSD (NaCl 8%) does not alter the distance travelled before finding the escape hole (Primary Distance, ND/HSD n=13/13, Diet: *p=0.0462, Time: *p<0.0001, two-way RM ANOVA plus Bonferroni’s test; Primary Distance Day 5: ND/HSD n=13/13, p=0.0670 vs ND, two-tailed unpaired t-test) or the number of errors made (Primary Errors, ND/HSD n=13/13, Diet: p=0.110, Time: *p=0.0004, two-way RM ANOVA plus Bonferroni’s test; Primary Errors, Day 5: p=0.1226 vs ND, two-tailed unpaired t-test). b, RZ3 levels in the cortex correlate with the cognitive performance at the novel object recognition test. No correlation was found between hippocampal RZ3 levels and cognitive performance at both the Barnes Maze and the novel object recognition test (RZ3 CTX: BM r=0.2828, *p=0.0133, n=76; NOR r=−0.2806, *p=0.0170, n=72; RZ3 HIPP: BM r=0.1739, p=0.1470, n=71; NOR r=−0.1746, p=0.1577, n=67, Pearson’s correlation coefficient). c: HSD did not increase soluble or insoluble Aβ38, Aβ40 or Aβ42 in neocortex (Aβ38, Soluble ND/HSD n=11/9, Insoluble ND/HSD n=7/6; Aβ40, Soluble ND/HSD n=11/14, Insoluble ND/HSD n=7/6; Aβ42, Soluble ND/HSD n=9/9, Insoluble ND/HSD n=7/6). d, Delivery of ANGII (600ng/kg·min, s.c.) with osmotic minipumps over 6 weeks increases systolic blood pressure and induces cognitive deficits (SBP – Veh/ANGII n=10/10, Treatment: *p<0.0001, Time: *p<0.0001, repeated two-way ANOVA and Bonferroni’s test; NOR – 2 weeks Veh/ANGII n=12/12, 4 weeks Veh/ANGII n=10/11, 6 weeks Veh/ANGII n=7/7, Treatment: *p<0.0021, Time: *p=0.0208, two-way ANOVA and Bonferroni’s test), e, ANGII administration increases AT8 and RZ3 in neocortex but not hippocampus (CTX, AT8 6 weeks: Veh/ANGII n=4/4, *p=0.0324 vs Veh; RZ3 6 weeks: Veh/ANGII n=5/5, *p=0.0262 vs Veh; HIPP, AT8 6 weeks: Veh/ANGII n=5/5, p=0.4056; HIPP, RZ3 6 weeks: Veh/ANGII n=5/5, p=0.0556, two-tailed unpaired t-test). f, HSD increases AT8 and RZ3 levels in both the neocortex and the hippocampus of 6 months-old Tg2576 mice (CTX, AT8: *p<0.0001 vs ND; HIPP, AT8: *p=0.0153 vs ND; CTX, RZ3: *p<0.0001 vs ND; HIPP, RZ3: *p=0.0239 vs ND, two-tailed unpaired t-test). g, Hypothermia induces massive AT8 phosphorylation (CTX: AT8 n=4/5, *p=0.0159 vs NT; HIPP: AT8 n=4/5, *p=0.0159 vs NT, unpaired two-tailed t-test). MC1 (CTX: MC1 n=4/5, *p=0.0317 vs NT; HIPP: MC1 n=4/5, *p=0.0159 vs NT, unpaired two-tailed t-test). RZ3 levels are also increased (CTX: RZ3 n=4/5, *p=0.0201 vs NT; HIPP: RZ3 n=4/5, *p=0.0453 vs NT, two-tailed unpaired t-test). h, At variance with HSD (Fig. 1G), hypothermia does not shift tau from soluble to more insoluble fractions. For gel source data see supplementary figure 1. Data are expressed as mean±SEM.
Extended Data Fig. 4: Effect of L-arginine on p-tau and calpain expression, as well as p-tau in eNOS−/− mice, calpain and Cdk5 localization, pDARPP-32 with HSD, and IL17 levels.
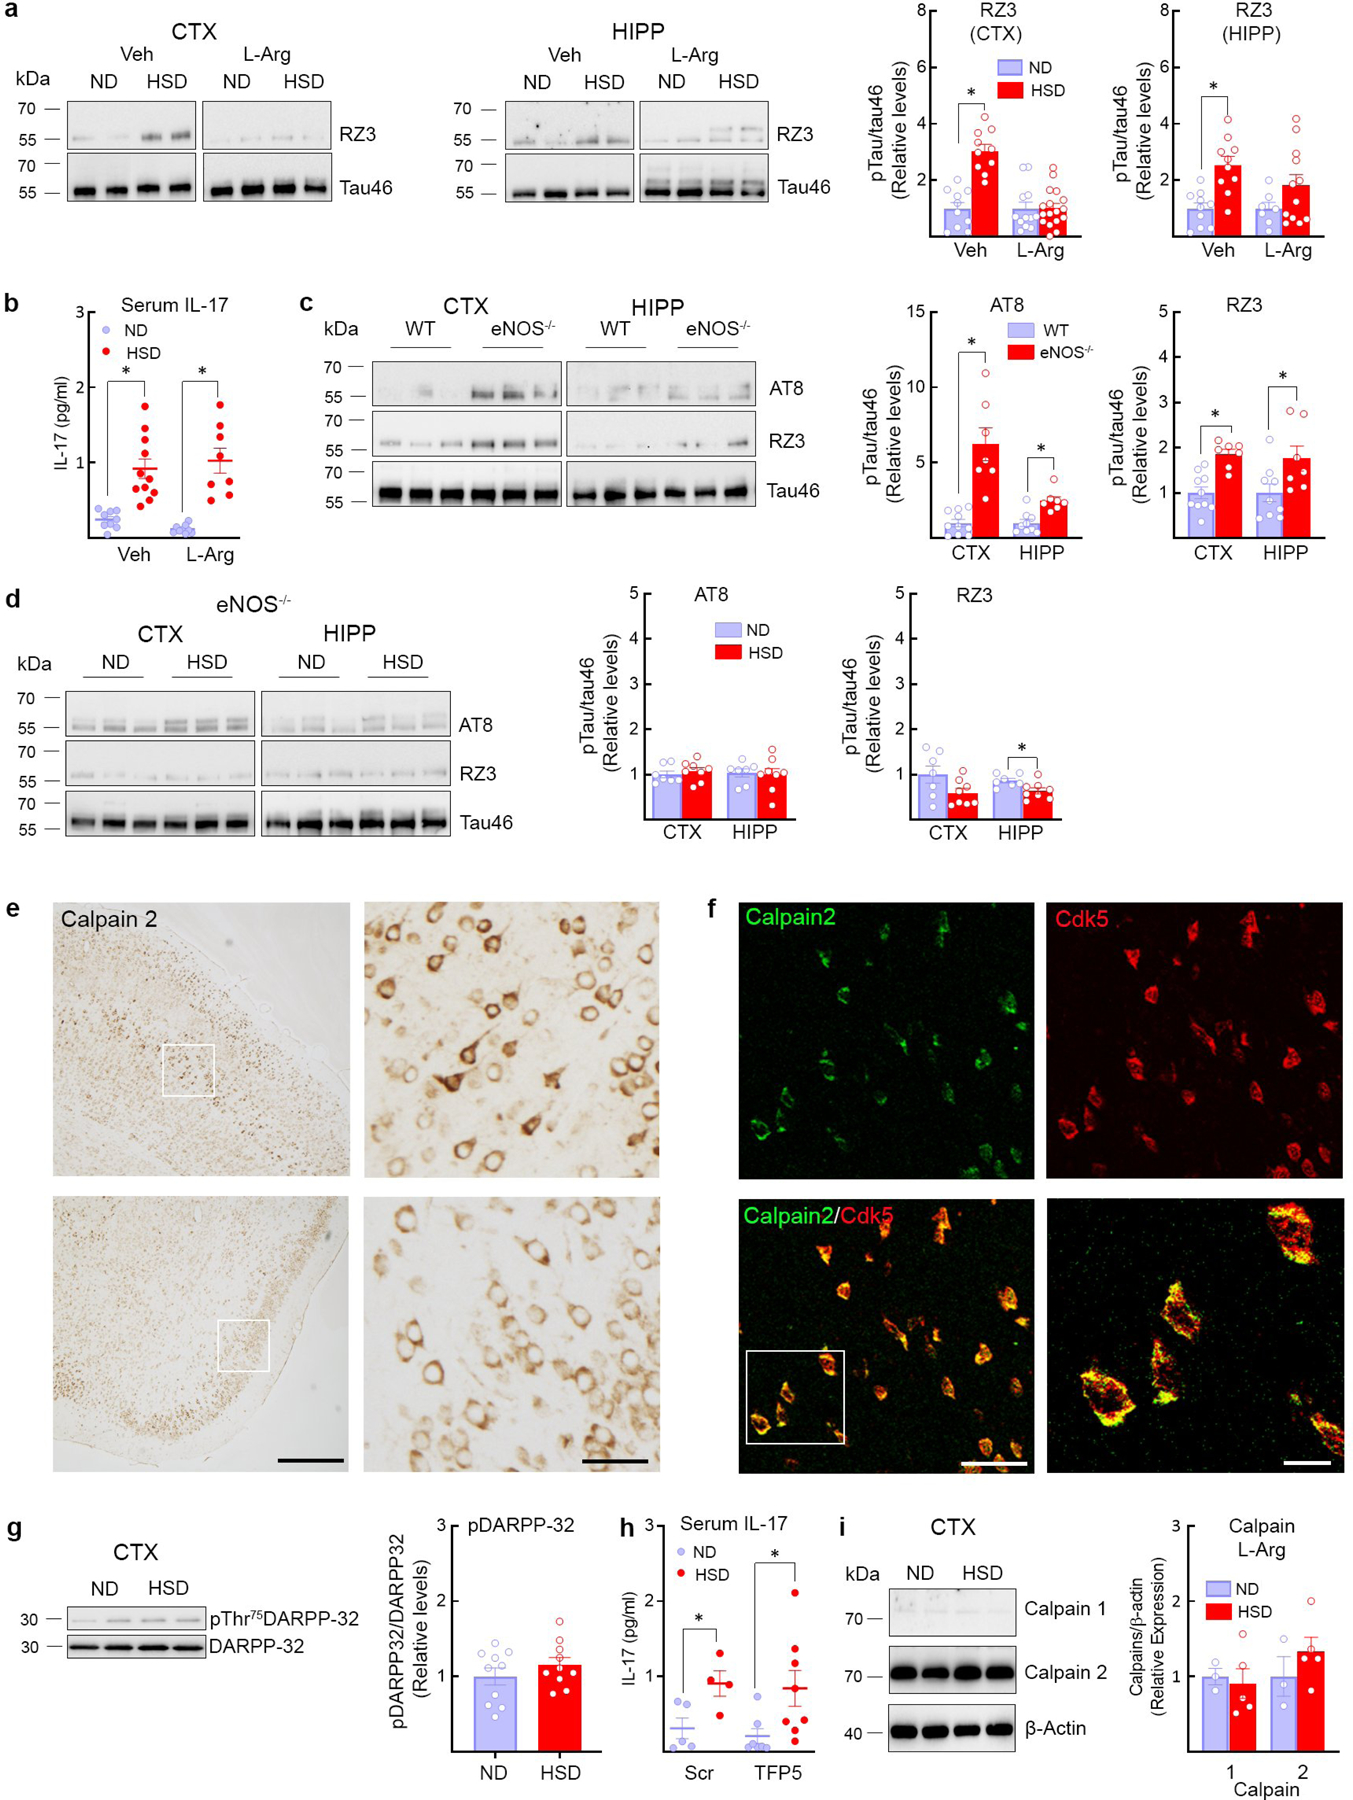
a, Administration of L-arginine (10 g/L in drinking water), starting at week 8 of HSD and continued through week 12, suppresses RZ3 levels in neocortex but not in hippocampus (CTX: RZ3, ND/HSD n=10/10, *p<0.0001 vs ND Veh; HIPP: RZ3, ND/HSD n=10/10, *p=0.0005 vs ND Veh, two-tailed unpaired t-test). b, L-arginine does not affect the increase in serum IL-17 induced by HSD (Veh, ND/HSD n=9/11, *p=0.0002 vs ND Veh; L-Arg, ND/HSD n=9/8, *p<0.0001 vs ND L-Arg, two-tailed unpaired t-test). c, AT8 and RZ3 levels are elevated in the neocortex and the hippocampus of eNOS−/− mice on ND (AT8: CTX, ND/HSD n=5/4, *p=0.0029 vs WT; HIPP, ND/HSD n=5/4, *p=0.0078 vs WT; RZ3: CTX, ND/HSD n=5/4, *p=0.0003 vs WT; HIPP, ND/HSD n=5/4, *p=0.0128 vs WT, two-tailed unpaired t-test). d, HSD does not increase tau phosphorylation in eNOS−/− mice (RZ3: HIPP, ND/HSD n=7/8, *p=0.0224 vs ND, two-tailed unpaired t-test). e, Calpain 2 immunoreactivity is present in neuronal cell bodies of the somatosensory and the piriform cortex (size bar=500 μm; 100μm in inset). Representative images from n=3 mice. f, Colocalization of Calpain 2 and Cdk5 in neuronal cell bodies of the piriform cortex (size bar=50 μm; 10 μm in inset). Representative images from n=3 mice. g, HSD has no effect on the phosphorylation of the Cdk5 substrate DARPP-32 in neocortex, ND/HSD n=10/10. h, Administration of the Cdk5 peptide inhibitor TFP5 has no effect on the increase of IL-17 serum levels induced by HSD (Scrambled: ND/HSD n=5/4, *p=0.0002 vs ND Scrambled; TFP5: ND/HSD n=7/8, *p<0.359 vs ND TFP5, two-tailed unpaired t-test). i: L-arginine administration does not alter the levels of calpain 1 and 2 in neocortex and hippocampus, ND/HSD n=3/5. For gel source data see supplementary figure 1. Data are expressed as mean±SEM.
Extended Data Fig. 5: GSK3β, Pin-1, calpastatin and Cdk5 nitrosylation in HSD, as well as neurovascular coupling, effect of HJ8.8 on p-tau, serum IL-17, and summary diagram.
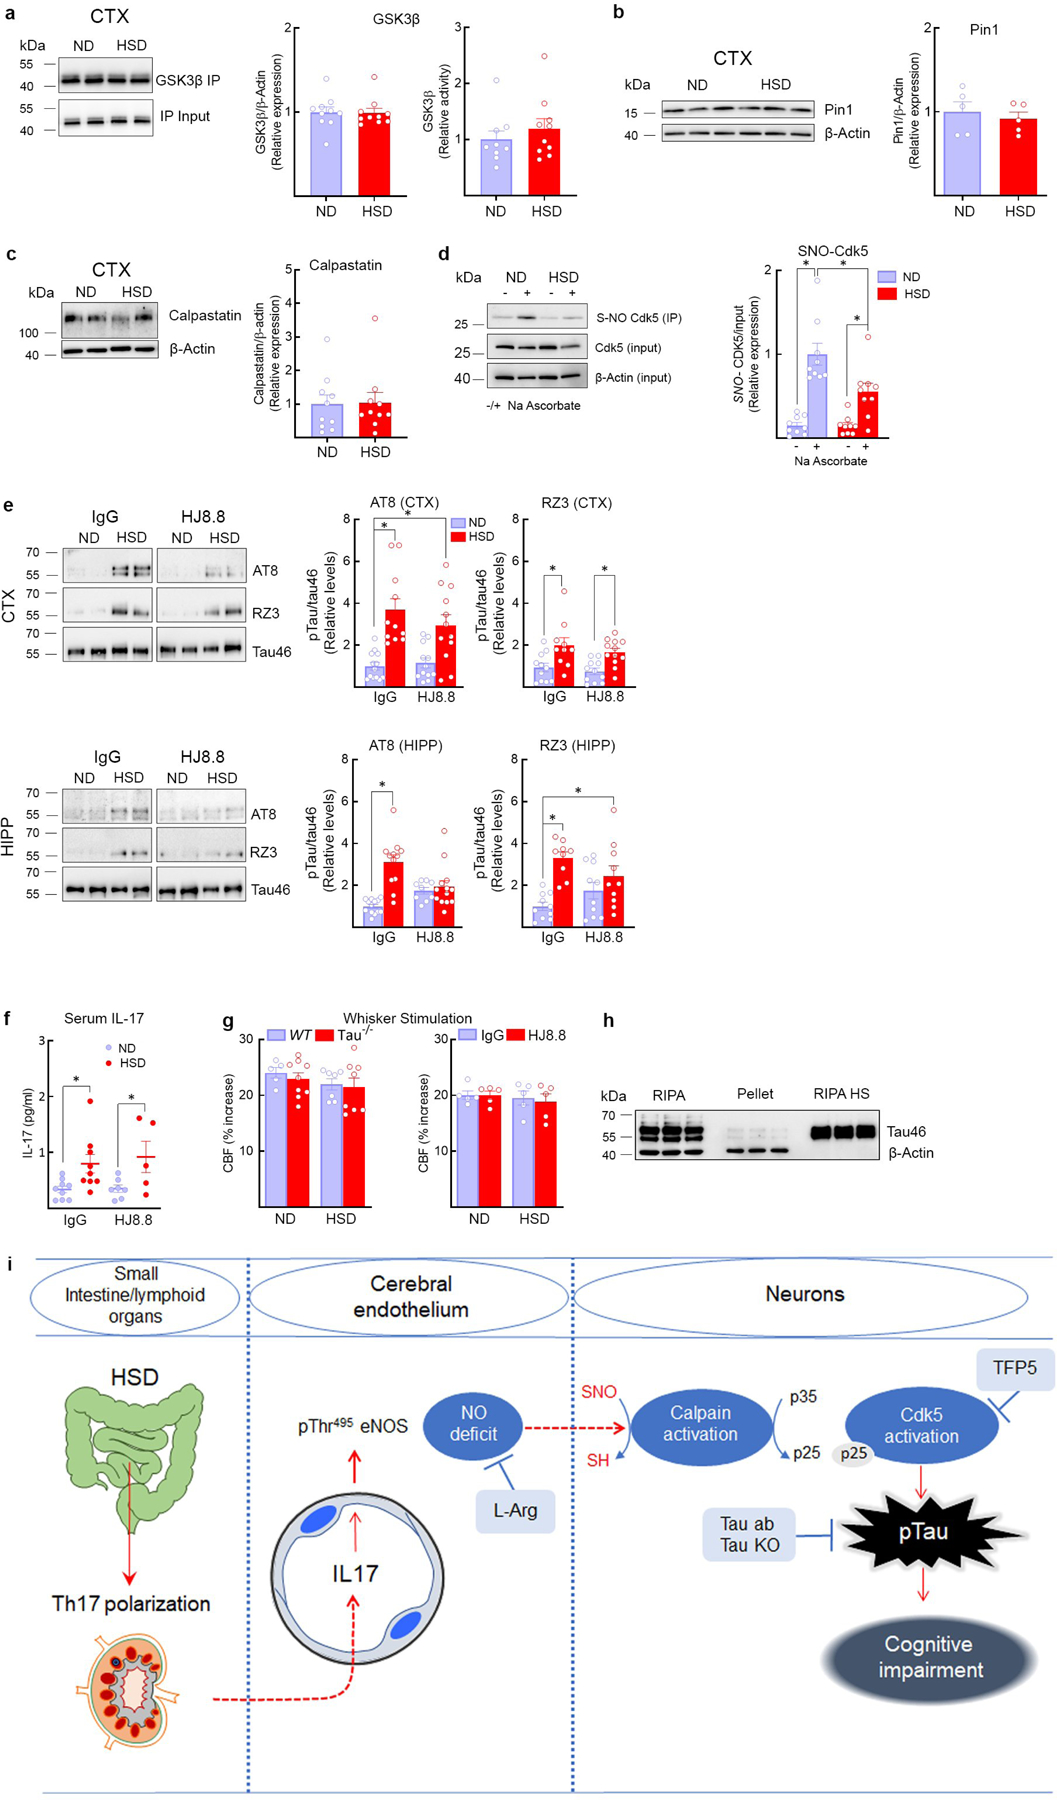
a, HSD has no effect on the expression and the activity of GSK3β in neocortex, ND/HSD n=10/10. b, HSD did not alter the expression of the prolyl cis/trans isomerase Pin-1, a regulator of tau dephosphorylation, ND/HSD n=5/5. c, The expression of calpastatin, an endogenous inhibitor of calpain activity, is not reduced by HSD, ND/HSD n=10/10. d, Nitrosylation of Cdk5 is reduced in the neocortex of HSD mice (ND/HSD n=9/9, Diet: *p=0.0143; Ascorbate: *p<0.0001, two-way ANOVA and Tukey’s test). e, HJ8.8 reduces AT8 levels in the hippocampus (AT8 – HIPP - IgG: ND/HSD n=13/12; HJ8.8: ND/HSD n=9/13; *p<0.0001, Kruskal-Wallis test and Dunn’s test). RZ3 levels are not altered by HJ8.8. f, Administration of HJ8.8 antibody does alter the increase of IL-17 serum levels induced by HSD (IgG: ND/HSD n=9/9, *p=0.0192 vs ND IgG; HJ8.8: ND/HSD n=7/5, *p=0.0421 vs ND HJ8.8, two-tailed unpaired t-test). g, The CBF increase in somatosensory cortex induced by neural activity evoked by mechanical stimulation of the whiskers is not reduced by HSD in WT, tau−/− and mice treated with the anti-tau antibody HJ8.8, WT ND/HSD n=5/7, Tau−/− ND/HSD n=9/8; IgG ND/HSD n=5/5, HJ8.8 ND/HSD n=5/5. h, Western blotting showing enrichment of tau in boiled RIPA neocortical samples (heat stable fraction, HS). Notice that β-actin is lost during the boiling process. Representative images from n=3 experiments. i, Cartoon depicting the mechanisms by which HSD leads to tau phosphorylation and cognitive impairment. HSD elicits a Th17 response in the small intestine, which leads to an increase in circulating IL17. IL17, in turn suppresses endothelial NO production by inducing inhibitory phosphorylation of eNOS at Thr495. The NO deficit results in reduced calpain nitrosylation in neurons, increased calpain activity, p35 to p25 cleavage, activation of Cdk5, and tau phosphorylation, which is ultimately responsible for cognitive dysfunction. In support of this chain of events, rescuing the endothelial NO deficit with L-arginine (L-Arg), lack of tau in tau-null mice, treatment with Cdk5 peptide inhibitor TFP5 or antibodies directed against tau (Tau Ab) prevent the cognitive dysfunction. For gel source data see supplementary figure 1. Data are expressed as mean±SEM.
Supplementary Material
ACKNOWLEDGEMENTS
We thank Prof. Peter Davies for providing the RZ3, MC1 and PHF1 antibodies and Prof. Yueming Li for sharing the Quickplex SQ 120 system (Meso Scale Diagnostics LLC). This study was supported by National Institutes of Health grants R37-NS089323 (CI) and 1R01-NS095441 (CI), by a grant from the Cure Alzheimer’s Fund (GF and CI), and by a Scientist Development Grant from the American Heart Association (GF). The support from the Feil Family Foundation is gratefully acknowledged.
Footnotes
DATA AVAILABILITY
Source data include final quantifications from in vivo animal work.
Competing Interests
D.M.H. is listed as an inventor on a patent licensed by Washington University to C2N Diagnostics and subsequently AbbVie on the therapeutic use of anti-tau antibodies. D.M.H. co-founded and is on the scientific advisory board of C2N Diagnostics. D.M.H. is on the scientific advisory board of Denali, Genentech, and Proclara. C.I. is on the scientific advisory board of Broadview Ventures.
REFERENCES
- 1.Scarmeas N, Anastasiou CA & Yannakoulia M Nutrition and prevention of cognitive impairment. Lancet Neurol, 10.1016/S1474-4422(18)30338-7 (2018). [DOI] [PubMed]
- 2.van de Rest O, Berendsen AA, Haveman-Nies A & de Groot LC Dietary patterns, cognitive decline, and dementia: a systematic review. Adv Nutr 6, 154–168, 10.3945/an.114.007617 (2015). [DOI] [PMC free article] [PubMed] [Google Scholar]
- 3.Kendig MD & Morris MJ Reviewing the effects of dietary salt on cognition: mechanisms and future directions. Asia Pac J Clin Nutr 28, 6–14, 10.6133/apjcn.201903_28(1).0002 (2019). [DOI] [PubMed] [Google Scholar]
- 4.De Strooper B & Karran E The Cellular Phase of Alzheimer’s Disease. Cell 164, 603–615, 10.1016/j.cell.2015.12.056 (2016). [DOI] [PubMed] [Google Scholar]
- 5.Nation DA et al. Pulse pressure in relation to tau-mediated neurodegeneration, cerebral amyloidosis, and progression to dementia in very old adults. JAMA Neurol 72, 546–553, 10.1001/jamaneurol.2014.4477 (2015). [DOI] [PMC free article] [PubMed] [Google Scholar]
- 6.Kim HJ et al. Assessment of Extent and Role of Tau in Subcortical Vascular Cognitive Impairment Using 18F-AV1451 Positron Emission Tomography Imaging. JAMA Neurol 75, 999–1007, 10.1001/jamaneurol.2018.0975 (2018). [DOI] [PMC free article] [PubMed] [Google Scholar]
- 7.Faraco G et al. Dietary salt promotes neurovascular and cognitive dysfunction through a gut-initiated TH17 response. Nat Neurosci 21, 240–249, 10.1038/s41593-017-0059-z (2018). [DOI] [PMC free article] [PubMed] [Google Scholar]
- 8.Fiocco AJ et al. Sodium intake and physical activity impact cognitive maintenance in older adults: the NuAge Study. Neurobiol Aging 33, 829 e821–828, 10.1016/j.neurobiolaging.2011.07.004 (2012). [DOI] [PubMed] [Google Scholar]
- 9.Gardener H, Rundek T, Wright CB, Elkind MS & Sacco RL Dietary sodium and risk of stroke in the Northern Manhattan study. Stroke 43, 1200–1205, 10.1161/STROKEAHA.111.641043 (2012). [DOI] [PMC free article] [PubMed] [Google Scholar]
- 10.Blumenthal JA et al. Lifestyle and neurocognition in older adults with cognitive impairments: A randomized trial. Neurology 92, e212–e223, 10.1212/WNL.0000000000006784 (2019). [DOI] [PMC free article] [PubMed] [Google Scholar]
- 11.Heye AK et al. Blood pressure and sodium: Association with MRI markers in cerebral small vessel disease. J Cereb Blood Flow Metab 36, 264–274, 10.1038/jcbfm.2015.64 (2016). [DOI] [PMC free article] [PubMed] [Google Scholar]
- 12.Iadecola C The pathobiology of vascular dementia. Neuron 80, 844–866, 10.1016/j.neuron.2013.10.008 (2013). [DOI] [PMC free article] [PubMed] [Google Scholar]
- 13.Sweeney MD et al. Vascular dysfunction-The disregarded partner of Alzheimer’s disease. Alzheimers Dement 15, 158–167, 10.1016/j.jalz.2018.07.222 (2019). [DOI] [PMC free article] [PubMed] [Google Scholar]
- 14.Shi Y et al. Cerebral blood flow in small vessel disease: A systematic review and meta-analysis. J Cereb Blood Flow Metab 36, 1653–1667, 10.1177/0271678X16662891 (2016). [DOI] [PMC free article] [PubMed] [Google Scholar]
- 15.Marshall RS et al. Recovery of brain function during induced cerebral hypoperfusion. Brain 124, 1208–1217 (2001). [DOI] [PubMed] [Google Scholar]
- 16.Wang Y & Mandelkow E Tau in physiology and pathology. Nat Rev Neurosci 17, 5–21, 10.1038/nrn.2015.1 (2016). [DOI] [PubMed] [Google Scholar]
- 17.Zhao Y et al. Sodium Intake Regulates Glucose Homeostasis through the PPARdelta/Adiponectin-Mediated SGLT2 Pathway. Cell Metab 23, 699–711, 10.1016/j.cmet.2016.02.019 (2016). [DOI] [PubMed] [Google Scholar]
- 18.Min SW et al. Critical role of acetylation in tau-mediated neurodegeneration and cognitive deficits. Nat Med 21, 1154–1162, 10.1038/nm.3951 (2015). [DOI] [PMC free article] [PubMed] [Google Scholar]
- 19.Iadecola C et al. SOD1 rescues cerebral endothelial dysfunction in mice overexpressing amyloid precursor protein. Nat Neurosci 2, 157–161, 10.1038/5715 (1999). [DOI] [PubMed] [Google Scholar]
- 20.Faraco G et al. Perivascular macrophages mediate the neurovascular and cognitive dysfunction associated with hypertension. J Clin Invest 126, 4674–4689, 10.1172/JCI86950 (2016). [DOI] [PMC free article] [PubMed] [Google Scholar]
- 21.Arendt T, Stieler JT & Holzer M Tau and tauopathies. Brain Res Bull 126, 238–292, 10.1016/j.brainresbull.2016.08.018 (2016). [DOI] [PubMed] [Google Scholar]
- 22.Lee MS et al. Neurotoxicity induces cleavage of p35 to p25 by calpain. Nature 405, 360–364, 10.1038/35012636 (2000). [DOI] [PubMed] [Google Scholar]
- 23.Patrick GN et al. Conversion of p35 to p25 deregulates Cdk5 activity and promotes neurodegeneration. Nature 402, 615–622, 10.1038/45159 (1999). [DOI] [PubMed] [Google Scholar]
- 24.Austin SA & Katusic ZS Loss of Endothelial Nitric Oxide Synthase Promotes p25 Generation and Tau Phosphorylation in a Murine Model of Alzheimer’s Disease. Circ Res 119, 1128–1134, 10.1161/CIRCRESAHA.116.309686 (2016). [DOI] [PMC free article] [PubMed] [Google Scholar]
- 25.Bibb JA et al. Phosphorylation of DARPP-32 by Cdk5 modulates dopamine signalling in neurons. Nature 402, 669–671, 10.1038/45251 (1999). [DOI] [PubMed] [Google Scholar]
- 26.Shukla V et al. A truncated peptide from p35, a Cdk5 activator, prevents Alzheimer’s disease phenotypes in model mice. FASEB J 27, 174–186, 10.1096/fj.12-217497 (2013). [DOI] [PMC free article] [PubMed] [Google Scholar]
- 27.Kimura T et al. Isomerase Pin1 stimulates dephosphorylation of tau protein at cyclin-dependent kinase (Cdk5)-dependent Alzheimer phosphorylation sites. J Biol Chem 288, 7968–7977, 10.1074/jbc.M112.433326 (2013). [DOI] [PMC free article] [PubMed] [Google Scholar]
- 28.Ono Y, Saido TC & Sorimachi H Calpain research for drug discovery: challenges and potential. Nat Rev Drug Discov 15, 854–876, 10.1038/nrd.2016.212 (2016). [DOI] [PubMed] [Google Scholar]
- 29.Etwebi Z, Landesberg G, Preston K, Eguchi S & Scalia R Mechanistic Role of the Calcium-Dependent Protease Calpain in the Endothelial Dysfunction Induced by MPO (Myeloperoxidase). Hypertension 71, 761–770, 10.1161/HYPERTENSIONAHA.117.10305 (2018). [DOI] [PMC free article] [PubMed] [Google Scholar]
- 30.Qu J et al. S-Nitrosylation activates Cdk5 and contributes to synaptic spine loss induced by beta-amyloid peptide. Proc Natl Acad Sci U S A 108, 14330–14335, 10.1073/pnas.1105172108 (2011). [DOI] [PMC free article] [PubMed] [Google Scholar]
- 31.Iadecola C The Neurovascular Unit Coming of Age: A Journey through Neurovascular Coupling in Health and Disease. Neuron 96, 17–42, 10.1016/j.neuron.2017.07.030 (2017). [DOI] [PMC free article] [PubMed] [Google Scholar]
- 32.Yanamandra K et al. Anti-tau antibodies that block tau aggregate seeding in vitro markedly decrease pathology and improve cognition in vivo. Neuron 80, 402–414, 10.1016/j.neuron.2013.07.046 (2013). [DOI] [PMC free article] [PubMed] [Google Scholar]
- 33.Powles J et al. Global, regional and national sodium intakes in 1990 and 2010: a systematic analysis of 24 h urinary sodium excretion and dietary surveys worldwide. BMJ Open 3, e003733, 10.1136/bmjopen-2013-003733 (2013). [DOI] [PMC free article] [PubMed] [Google Scholar]
REFERENCES (METHODS ONLY)
- 34.Hochrainer K et al. The ubiquitin ligase HERC3 attenuates NF-kappaB-dependent transcription independently of its enzymatic activity by delivering the RelA subunit for degradation. Nucleic Acids Res 43, 9889–9904, 10.1093/nar/gkv1064 (2015). [DOI] [PMC free article] [PubMed] [Google Scholar]
- 35.Shukla V et al. TFP5, a Peptide Inhibitor of Aberrant and Hyperactive Cdk5/p25, Attenuates Pathological Phenotypes and Restores Synaptic Function in CK-p25Tg Mice. J Alzheimers Dis 56, 335–349, 10.3233/JAD-160916 (2017). [DOI] [PMC free article] [PubMed] [Google Scholar]
- 36.Faraco G et al. Circulating endothelin-1 alters critical mechanisms regulating cerebral microcirculation. Hypertension 62, 759–766, 10.1161/HYPERTENSIONAHA.113.01761 (2013). [DOI] [PMC free article] [PubMed] [Google Scholar]
- 37.Kober F et al. High-resolution myocardial perfusion mapping in small animals in vivo by spin-labeling gradient-echo imaging. Magn Reson Med 51, 62–67, 10.1002/mrm.10676 (2004). [DOI] [PubMed] [Google Scholar]
- 38.Petry FR et al. Specificity of anti-tau antibodies when analyzing mice models of Alzheimer’s disease: problems and solutions. PLoS One 9, e94251, 10.1371/journal.pone.0094251 (2014). [DOI] [PMC free article] [PubMed] [Google Scholar]
- 39.Faraco G et al. Hypertension enhances Abeta-induced neurovascular dysfunction, promotes beta-secretase activity, and leads to amyloidogenic processing of APP. J Cereb Blood Flow Metab 36, 241–252, 10.1038/jcbfm.2015.79 (2016). [DOI] [PMC free article] [PubMed] [Google Scholar]
- 40.Voit A et al. Reducing sarcolipin expression mitigates Duchenne muscular dystrophy and associated cardiomyopathy in mice. Nat Commun 8, 1068, 10.1038/s41467-017-01146-7 (2017). [DOI] [PMC free article] [PubMed] [Google Scholar]
- 41.Liu W et al. Metabolic stress-induced cardiomyopathy is caused by mitochondrial dysfunction due to attenuated Erk5 signaling. Nat Commun 8, 494, 10.1038/s41467-017-00664-8 (2017). [DOI] [PMC free article] [PubMed] [Google Scholar]
- 42.Forrester MT, Foster MW, Benhar M & Stamler JS Detection of protein S-nitrosylation with the biotin-switch technique. Free Radic Biol Med 46, 119–126, 10.1016/j.freeradbiomed.2008.09.034 (2009). [DOI] [PMC free article] [PubMed] [Google Scholar]
- 43.Cohen SJ & Stackman RW Jr. Assessing rodent hippocampal involvement in the novel object recognition task. A review. Behav Brain Res 285, 105–117, 10.1016/j.bbr.2014.08.002 (2015). [DOI] [PMC free article] [PubMed] [Google Scholar]
- 44.Grayson B et al. Assessment of disease-related cognitive impairments using the novel object recognition (NOR) task in rodents. Behav Brain Res 285, 176–193, 10.1016/j.bbr.2014.10.025 (2015). [DOI] [PubMed] [Google Scholar]
- 45.O’Leary TP & Brown RE Optimization of apparatus design and behavioral measures for the assessment of visuo-spatial learning and memory of mice on the Barnes maze. Learn Mem 20, 85–96, 10.1101/lm.028076.112 (2013). [DOI] [PubMed] [Google Scholar]
Associated Data
This section collects any data citations, data availability statements, or supplementary materials included in this article.