

Summary
While base editors are widely used to install targeted point mutations, the factors that determine base editing outcomes are not well understood. We characterized sequence-activity relationships of 11 cytosine and adenine base editors (CBEs and ABEs) on 38,538 genomically-integrated targets in mammalian cells and used the resulting outcomes to train BE-Hive, a machine learning model that accurately predicts base editing genotypic outcomes (R≈0.9) and efficiency (R≈0.7). We corrected 3,388 disease-associated SNVs with ≥90% precision, including 675 alleles with bystander nucleotides that BE-Hive correctly predicted would not be edited. We discovered determinants of previously unpredictable C-to-G, or C-to-A editing, and used these discoveries to correct coding sequence of 174 pathogenic transversion SNVs with >90% precision. Finally, we used insights from BE-Hive to engineer novel CBE variants that modulate editing outcomes. These discoveries illuminate base editing, enable editing at previously intractable targets, and provide new base editors with improved editing capabilities.
In brief
A comprehensive look at CRISPR base editing efficiencies and outcomes across target sequences, cell lines, and base editing effectors yields a statistical model and web-based tool for users to predict the editing efficiency, off-targets, and the best base editor to use for a sequence of interest
Graphical Abstract

Introduction
Editing of targeted nucleotides in genomic DNA is a key capability for both research and therapeutic applications (Adli, 2018; Anzalone et al., 2019; Doench et al., 2016; Doudna and Knott, 2018; Pérez-Palma et al., 2019; Rees and Liu, 2018; Shen et al., 2018). Single-nucleotide variants (SNVs) represent approximately half of known pathogenic alleles (Landrum et al., 2016; Stenson et al., 2014), and thus targeted installation of point mutations can facilitate the study or potential treatment of genetic disorders. Previously, we and others developed cytosine base editors (CBEs) and adenine base editors (ABEs) (Rees and Liu, 2018), that together enable the targeted installation of all four transition point mutations (C→T, T→C, A→G, and G→A) with high ratios of desired substitutions to undesired insertions and deletions (indels) (Lin et al., 2014; Paquet et al., 2016).
The utility of base editing has inspired the development of base editor variants with distinct properties (Adli, 2018; Molla and Yang, 2019; Rees and Liu, 2018). To date, these properties have been gleaned by analyzing editing outcomes at a modest number of genomic sites, often chosen to align with previous genome editing studies (Gehrke et al., 2018; Huang et al., 2019; Tan et al., 2019; Thuronyi et al., 2019; Villiger et al., 2018). The interplay between base editor and target sequence, however, influences editing outcomes in complex and occasionally unintuitive ways. As a result, obtaining a desired genotype with desired efficiencies often requires empirical optimization of base editor and single guide RNA (sgRNA) choice for each target. Some viable targets that do not fit canonical guidelines for base editing use may be overlooked since simple guidelines for target selection do not fully capture the scope of base editing. A systematic and comprehensive analysis of sequence and deaminase determinants of base editing would enhance our understanding of base editors, facilitate their use in precision editing applications, and guide the development of new base editors.
In this study, we developed libraries of 38,538 total pairs of sgRNAs and target sequences and integrated them into the genomes of three mammalian cell types to comprehensively characterize base editing outcomes and sequence–activity relationships for eight popular CBEs and ABEs. We analyzed the roles of deaminases, sequence context, and cell type in determining genotypes that result from base editing, and developed a machine learning model that accurately predicts base editing outcomes, including many previously unpredictable features, at any target site of interest. Using the resulting information, we applied a variety of base editors, including newly engineered variants, to precisely correct 3,388 genotypes and 2,399 coding sequences of disease-associated SNVs to wild-type with ≥90% precision, including by non-canonical base editing outcomes. These findings substantially extend our understanding of base editing and reveal new capabilities of both new and previously described base editors.
Results
Development of a Genome-Integrated Target Site Library Assay for Base Editors
To refine our understanding of sequence features that govern base editing outcomes, we sought to develop a comprehensive and unbiased approach to characterizing base editors. We designed libraries of 4,000 or 12,000 oligonucleotides, each up to 176 nt long, encoding unique 20-nt sgRNA spacers paired with target sequences (Shen et al., 2018), that contain an NGG or NG protospacer adjacent motif (PAM) to direct Streptococcus pyogenes Cas9 (SpCas9) (Cong et al., 2013; Jinek et al., 2013; Mali et al., 2013) or Cas9-NG, an engineered variant with broadened PAM compatibility (Nishimasu et al., 2018), to the center of each target site (Figure 1A, Supplemental Information, STAR Methods). We stably integrated ≥38,538 unique library cassettes into the genomes of mouse embryonic stem cells (mESCs), human HEK293T cells, and human U2OS cells using Tol2 transposons (Arbab et al., 2015; Barkal et al., 2016; Shen et al., 2018; Sherwood et al., 2014; Urasaki et al., 2006), and subsequently transfected these cells with a base editor expression plasmid. To detect editing outcomes with high sensitivity, we maintained an average coverage of ≥300x per library cassette and performed high-throughput sequencing (HTS) of the target sites at an average sequencing depth of ≥4,000x per target.
Figure 1. Systematic Characterization of Base Editing Activity at Thousands of Target Sites.

(A) Overview of genome-integrated target library assay. Pairs of thousands of sgRNAs and corresponding target sites are integrated into mammalian cells and treated with base editors. Edited cells are enriched by antibiotic selection, and library cassettes are amplified for high-throughput sequencing. (B) Base editor activity profiles. Values reflect editing efficiencies of the outcomes specified at the bottom of each heat map, normalized to a maximum of 100, at the protospacer positions shown at each row. Red indicates canonical base editing activity (C to T for CBEs and A to G for ABEs), blue indicates other mutation activity at the canonical substrate nucleotide (C for CBEs and A for ABEs), and gray indicates other rare mutations. Positions with values ≥50% of maximum are outlined and ≥30% of maximum are shaded purple.
Using this approach, we studied six commonly used CBEs in the NLS- and codon-optimized BE4max architecture (bpNLS–deaminase–Cas9 D10A–2x uracil glycosylase inhibitor (UGI)–bpNLS) (Koblan et al., 2018): BE4max (referred to hereafter as BE4), circularly permuted CP1028-CBEmax (BE4-CP), evoAPOBEC1-BE4max (evoA-BE4), AID (AID-BE4), CDA1-BE4max (CDA-BE4), and engineered APOBEC3A (eA3A-BE4) (Gehrke et al., 2018; Huang et al., 2019; Komor et al., 2017; Thuronyi et al., 2019). We also studied two ABEs: ABEmax (bpNLS–wt TadA–evolved TadA*–Cas9 D10A–bpNLS, referred to hereafter as ABE) and circularly permuted CP1041-ABEmax (ABE-CP) (Gaudelli et al., 2017; Huang et al., 2019), for a total of eight previously reported base editors spanning a diverse range of editing window sizes and sequence preferences, and observed average editing efficiencies (frequency of target-modified outcomes among total sequenced reads) ranging from 2.9% to 58% (Figure S1 Genome-integrated library assay is replicable and consistent with endogenous data, related to Figure 1).
Between biological replicates, the frequency of base editing outcomes among edited reads at library targets was consistent (median Pearson’s R = 0.87 across 33 conditions, Figure S1B) across editors, libraries, and cell types. Editing outcomes at library control sequences taken from the human genome were also consistent with editing outcomes at endogenous loci across five base editors with both narrow and broad editing windows (interquartile range (IQR) of R = 0.79-0.98, Figure S1C). Together, these observations suggest the data are comprehensive, consistent with endogenous editing, and at a scale not previously assessed in base editing.
Systematic Characterization of Base Editing Activity
Analysis of base editing characteristics from outcomes at a modest number of endogenous sites is constrained by limited variability among factors that could affect outcomes, including target sequence composition, target sequence context, and locus-dependent differences in DNA-binding proteins and transcriptional state. To assess sequence–activity relationships of ABEs and CBEs in a more comprehensive manner, we investigated base editing outcomes in a genome-integrated library assay with highly diverse sequence compositions.
We designed a library to enable the detection of virtually any local editing events at the target site. This library included 8,142 base editor target sequences with all possible 6-mers surrounding a substrate A or C nucleotide at protospacer position 6, and 2,496 sgRNA–target pairs that collectively contain all possible 5-mers included across positions −1 to 13 (counting the position immediately upstream of the protospacer as position 0). We refer to this collection of 10,638 library members as the “comprehensive context library”.
We quantified reads containing indels and quantified base editing outcomes among the remaining reads from the observed frequencies of all possible nucleotide substitutions from protospacer positions −10 to 35 at individual sequences. Mutations statistically likely to be from DNA sequencing errors were filtered. We applied robust-rank aggregation to identify editor-specific mutation events that consistently occurred above background frequencies across replicates. These analyses handled all mutation events in an identical manner to minimize bias in the resulting editing profiles (Figure 1B, S1D, and Figure S2 Base editor activity profiles, related to Figure 1; STAR Methods).
These profiles revealed variation in editing window positions, distributions of base editing activity, and positional preferences among the eight different base editors tested. BE4 and evoA-BE4 edit at 50% or greater of their maximum frequency at positions 4–8 and 3–8 respectively, consistent with previous reports (Komor et al., 2017; Thuronyi et al., 2019). We observed a unique bimodal editing profile for eA3A-BE4, with an additional peak in activity at protospacer position 13 to up to 18% relative to the maximum editing frequency, that had not previously been reported (Gehrke et al., 2018). The remaining editing windows detected in our assay are in general agreement with, but refine, previous reports (Supplemental Information).
In this study, we define the editing window using a lowered threshold of >30% maximum editing frequency to include more positions that can undergo substantial base editing in our analyses. We classify editors with windows of nine or more nucleotides as wide-window editors, including ABE-CP, BE4-CP, AID-BE4, and CDA-BE4, and eight or fewer nucleotides as narrow-window editors, including ABE, BE4, evoA-BE4, and eA3A-BE4 (Figure 1B and S1D and S2A–B).
Sequence–activity Relationships for Common Base Editing Outcomes
While deaminase-specific sequence preferences have been reported to affect nucleotide conversion efficiencies of some base editors (Beale et al., 2004; Komor et al., 2016a; Liu et al., 2018), sequence–activity relationships of base editors have not been characterized in depth. We generated sequence motifs for various base editing activities, such as editing efficiency, by using logistic regression to predict activity from target sequence context, and depicted the learned weights as sequence logos (Figure 2A–D and Figure S3 Base editing efficiency sequence motifs, related to Figure 2; Supplemental Information). We note that motifs described in this manner consider each position independently and are intended for data visualization.
Figure 2. Sequence Motifs for Base Editing Outcomes and Characterization of Indels.

(A-D) Sequence motifs for various base editing activities from logistic regression models. The sign of each learned weight indicates a contribution above (positive sign) or below (negative sign) the mean activity. Logo opacity is proportional to the motif’s Pearson’s R or AUC on held-out sequence contexts. (E) Heat map of indel frequencies among edited reads by position and length. Frequencies are normalized (divided) by indel length. (F) Heat map of insertion frequencies among all insertions by insert length and number of repeats. (G) Base editing:indel ratio distributions. The table lists geometric mean and interquartile range (IQR).
We first calculated sequence motifs for the efficiency of canonical base editing activity in which CBEs convert C•G to T•A and ABEs convert A•T to G•C. We obtained motifs for each editor at ≥7,091 unique substrate nucleotides in their editing windows at ≥5,292 target sequences (Figure 2B), that were consistent across cell types and biological replicates (Figure S3B). These findings identify sequence context as an important determinant of editing activity across all editors with the exception of CDA-BE4, for which only 5.3% of the variance in editing efficiency is explained by target motifs in held-out sequences (variance explained = R2) compared to 15–32% on average across all other base editors.
Interestingly, we observed that evoA-BE4, which emerged from laboratory evolution to gain activity at GC motifs, acquired a relative aversion to AC targets. This newly acquired anti-preference was previously undetected from analyses at a smaller number of endogenous loci (Thuronyi et al., 2019). Similarly, we find that ABE maintains some preference against AA despite its laboratory evolution that increased activity at sites with adjacent As (Gaudelli et al., 2017). These findings demonstrate that characterization of editing outcomes at many diverse sequences can reveal CBE and ABE sequence preferences with much greater sensitivity than before.
Non-Canonical Nucleotide Conversions by Base Editors
Our analysis revealed several non-canonical editing outcomes. We observed G•C-to-A•T editing activity by the wide-window editors BE4-CP and AID-BE4 at PAM-distal positions 0 to −5 with mean frequencies of 1.0% and 1.8% among edited reads, respectively (Figure 1B), in contrast to the narrow-window editors evoA-BE4 and BE4 at 0.32% and 0.43% among edited reads, respectively. These rare outcomes had sequence motifs strongly resembling the reverse complement of each editor’s primary cytosine editing activity (for example GA instead of TC, for BE4 and BE4-CP), suggesting that they occur via opposite-strand cytosine deamination (AUC = 0.65–0.77, P < 5.9×10⁻³, Mann-Whitney U; Figure 2B). These G•C-to-A•T edits are likely inhibited by sgRNA:DNA interactions at protospacer positions 1–20, which may explain their lower overall observed frequency in narrow-window CBEs that do not readily access PAM-distal positions. CDA-BE4 was the notable exception among wide-window editors, which actively edited C•G-to-T•A at positions −1 to 9 but induced little to no observable G•C-to-A•T editing.
Cytosine transversion mutations (C to G, or C to A) have previously been observed as a rare CBE outcome (Komor et al., 2016a, 2017; Nishida et al., 2016). We observed a strong dependence of transversion edits on local sequence context that was consistent by editor across cell types and biological replicates (Figure S4 Characterization of rare base editing outcomes, related to Figure 2). A preferred motif of RCTA explained 17–37% of the variance among held-out sequences across all CBEs (Figure 2C). We observed particularly high transversion frequencies from the narrow-window editor eA3A-BE4 (Figure 1B), which averaged 12% transversions relative to the maximum C•G-to-T•A editing frequency, and a skewed ratio of C-to-G over C-to-A transversion outcomes (~3:1 for eA3A, compared to ~3:2 for the remaining CBEs). Together, these results reveal that local sequence context and deaminase choice can influence the frequency and specific outcome of rare CBE transversion editing events.
We also identified rare editing outcomes from ABEs (Figure 1B). We observed unexpected conversion of C to G, or C to T at protospacer position 6 averaging 0.34% and 0.62% of edited reads for ABE-CP and ABE, respectively. These rare outcomes were accurately predicted by the TCY sequence motif, achieving AUC = 0.75–0.78 on held-out target sequences (P < 6.7×10⁻²³, Mann-Whitney U; Figure 2D), that matches the preferred motif for canonical ABE adenine-to-guanine conversion activity (TAY), but is instead centered on a C. The similarity between these motifs, as well as the accompanying rare C•G-to-G•C and C•G-to-T•A events, suggests that these rare events occur from direct cytosine deamination by the TadA* active site. These observations are consistent with, and extend, a recent report of cytosine editing by ABEs (Kim et al., 2019).
Collectively, these results illuminate sequence- and deaminase determinants of non-canonical ABE and CBE editing outcomes, suggest potential mechanisms of opposite-strand CBE editing, and deepen our understanding of ABE editing of cytosines.
Characterization of Indels Resulting from Base Editors
The factors that determine indel outcomes in base editing experiments have not been well characterized. Consistent with prior reports, we observed generally high ratios of desired base edits to undesired indels in our library data, averaging 39:1 for the six CBEs and 64:1 for the ABEs (geometric means, Figure S4B). We observe 1-bp sequence changes across library targets relative to our library design in many base editor-treated as well as untreated library experiments, with no clear positional pattern (Figure S4C), at an average absolute frequency of 0.18-0.28% of sequenced reads across all base editors. These results suggest that many observed 1-bp indels are from oligonucleotide synthesis and PCR-cloning steps prior to genomic integration and did not arise as indels from base editing (Supplemental Information). Following conservative correction of library-specific indel noise we observe a characteristic positional profile of insertions and deletions related to base editing activity (Supplemental Information, STAR Methods) with deletions centered around either the PAM-proximal HNH domain’s nick location preceding protospacer position 18, or the PAM-distal deamination peak position for the CBE (often position 6), or spanning these two sites resulting in a peak in outcome frequency at ~12 bp deletions (Figure 2E and Figure S5 Characterization of base editing indels and modeling of editing outcomes, related to Figures 2 and 3). Insertions arising from base editing predominantly consisted of single or multiple nucleotide duplications preceding position 18, at the location of the HNH-nick (Figure 2F and S5B).
Figure 3. BE-Hive: Machine Learning Models of Base Editing Efficiency and Outcomes.
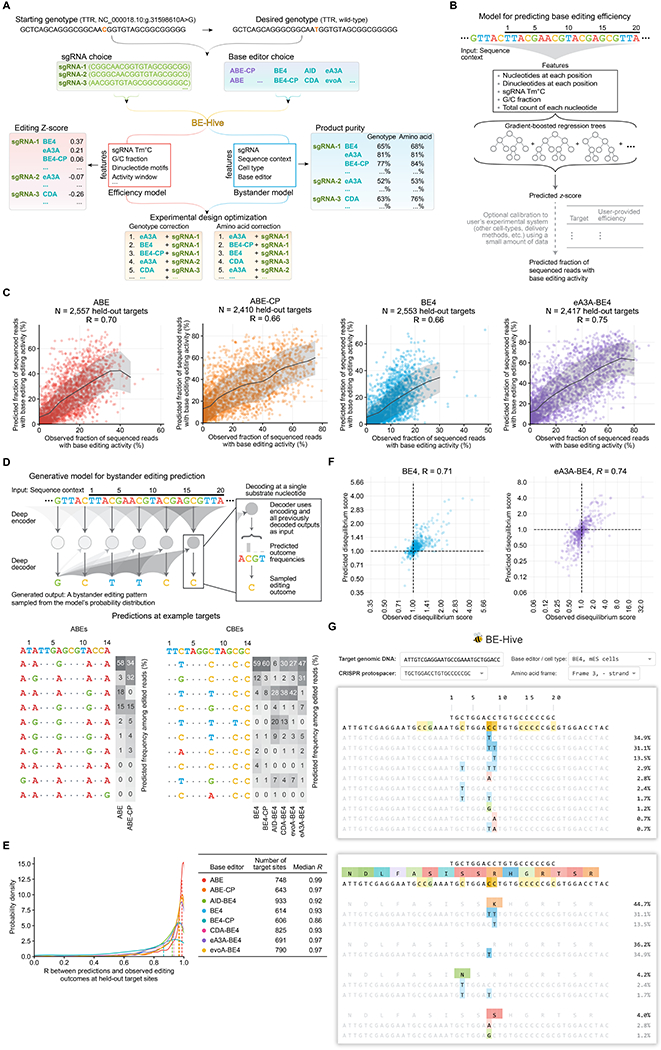
(A) Decision tree for base editing experiment design. See also Table S1. (B) Model design for predicting base editing efficiency z-scores which are approximately normally distributed. (C) Comparison of predicted versus observed base editing efficiency at held-out target sites. (D) Design of a deep conditional autoregressive model, a general approach for learning bystander base editing patterns from experimental data. Given a target sequence, sgRNA, base editor, and cell-type, the model can be queried with any possible editing outcome to predict its frequency among edited reads. Tables show predicted outcomes at an example target site across eight different base editors. (E) Bystander editing model performance at N ≥614 held-out target sites. (F) Comparison of predicted versus observed disequilibrium scores, which reflect the tendency of substrate nucleotide pairs to be edited together or separately. (G) The web application for BE-Hive, which predicts the frequency of bystander editing patterns in the DNA sequence (top) or translated amino acid sequence (bottom). The web application also predicts base editing efficiency (not shown).
After correction, BE:indel ratios are in agreement with previous reports (Gaudelli et al., 2017; Gehrke et al., 2018; Huang et al., 2019; Komor et al., 2016a; Thuronyi et al., 2019), averaging 40:1 for the six CBEs and 148:1 for the ABEs (geometric means), although BE:indel ratios varied substantially by target; IQRs for CBEs were 12:1 to 176:1 (Figure 2G and S4B–D; Supplemental Information). Wide-window editors generally induced indels at lower relative frequencies than narrow-window editors. Indel frequencies are largely unaffected by cell type and sequence context (Figure S5C). We did not observe strong sequence determinants of indels resulting from base editing; sequence motifs only explain 0.5–8.4% of variation in held-out sequences (P < 7.0×10⁻³¹; Figure S5D–E).
Collectively, these analyses provide the first comprehensive characterization of indels that result from base editing. We confirmed the relative rarity of indels resulting from base editing, observed a modest dependence on cell type and target sequence, and determined a unique positional profile of indel outcomes that is distinct from that of Cas9 nuclease (Shen et al., 2018).
Editing Efficiency Model
Base editing efficiency at endogenous genomic loci depends on a number of factors. Local sequence context determines deaminase sequence-dependent activity, and PAM compatibility affects the accessibility of the target nucleotide to the deaminase. In addition, cell type-specific factors including replication rate, DNA repair proteins, chromatin accessibility, and transcriptional activity may affect sgRNA binding and repair of deaminated nucleotides. Since sequence composition is not cell type-dependent, revealing how sequence features affect base editing efficiency has the potential to benefit experimental design across all cell types. While previous reports have assessed how local sequence context at a given target site impacts deaminase efficiency (Gaudelli et al., 2017; Gehrke et al., 2018; Komor et al., 2016a), empirical optimization of editor and sgRNA choice is often necessary due to the lack of simple relationships between target sequence context and base editing outcomes (Huang et al., 2019; Tan et al., 2019; Thuronyi et al., 2019; Villiger et al., 2018).
We sought to develop a model to inform the design of base editing experiments including all possible choices of base editors, sgRNAs, and targets to enable a desired phenotype (Figure 3A; Supplemental Information). We investigated the relationship between sequence and base editing efficiency using the comprehensive context library across two biological replicates in each of three cell types. We trained sequence motif models and found that the learned motifs (Figure S5F) resemble a combination of each editor’s single-nucleotide sequence motif and activity window combined with previously identified sgRNA-related sequence determinants of SpCas9 editing efficiency (Supplemental Information). To consider higher-order interactions and additional features, we applied gradient-boosted regression trees (Figure 3B) (Friedman, 2001). These models improved on the performance of logistic regression motifs (R = 0.50–0.57) and achieved R = 0.69–0.80 for ABEs and R = 0.53–0.74 for CBEs in held-out sequences (Figure 3C and S5G–H) in mES cells. In HEK293T cells, the models achieved R up to 0.60 for ABEs and eA3A-BE4. The tree models found that features including sgRNA predicted melting temperature, G/C fraction, and dinucleotide motifs were useful in predicting base editing efficiency (Table S1).
Bystander Editing Model
“Bystander editing” of non-target C or A nucleotides located near the target nucleotide represents a significant challenge for precision base editing, as ~70% (1-0.754) of targets have two or more C or A nucleotides within a five-nucleotide window. In many base editing applications, bystander edits that result in silent coding mutations may be innocuous, thus broadening the potential number of desirable editing outcomes (Rees and Liu, 2018). Thus far, design guidelines for avoiding bystander edits have relied on heuristics derived from data at modest numbers of sites.
To predict bystander base editing patterns, we designed a deep conditional autoregressive machine learning model (Van Den Oord et al., 2016) that uses an input target sequence surrounding a protospacer and PAM to output predicted frequencies for bystander base editing patterns (Figure 3D; Supplemental Information). Importantly, the model’s design can readily learn editing patterns of novel or future base editors from data. We randomly partitioned data from up to 10,638 sgRNA-target pairs in the comprehensive context library into training, validation, and test data sets in an 8:1:1 ratio to train and test the model. We performed architecture search, ablation analysis, and comparisons to baseline methods and concluded that the autoregressive design and use of a high-capacity decoder were important for predictive performance (STAR methods). Across the six CBEs and two ABEs tested here, the bystander model performed strongly at predicting the frequencies of bystander editing patterns, achieving a median R = 0.86–0.99 on ≥606 held-out target sequences in mES cells (Figure 3E and S5I–J), and retained strong performance even at target sites with many substrate nucleotides (Figure S6 Bystander editing model performance, related to Figure 3). We characterized base editing processivity and validated that the models accurately recovered higher-order interactions driving conditional editing probabilities (Figure 3F and S6C–D, Supplemental Information). We also evaluated the bystander editing model trained on SpCas9 base editor data on its ability to predict non-SpCas9 base editing activity for SaCas9 and Cas12a variants. We observed strong performance when controlling for editing window shifts, indicating that the model has learned deaminase-specific activity determinants independent of Cas protein (Figure S6E–F, Supplemental Information).
We collectively named the editing efficiency and bystander editing models “BE-Hive”, freely accessible at https://crisprbehive.design. Using target sequence as input alone, BE-Hive estimates base editing efficiency and genotypic outcomes at both the single-nucleotide and protein-coding level. BE-Hive represents the first tool for designing base editing experiments that comprehensively considers editing efficiency, preferences for various editing outcomes, and the likelihood of bystander edits to distinguish targets that are amenable to high-precision single-nucleotide editing and coding-sequence correction (Figure 3G).
Model-Guided Precise Correction of Pathogenic Alleles
A deeper understanding of base editor sequence–activity relationships would facilitate the selection of optimal base editor and sgRNA combinations that maximize editing efficiency and precise editing of only the intended target nucleotide(s) at a given locus. We examined the ability of the bystander editing model to predict correction of disease-relevant alleles. We designed a library of 12,000 sgRNA–target pairs for 7,444 unique disease-associated variants from ClinVar and HGMD (Landrum et al., 2016; Stenson et al., 2014) that are correctable by precise C•G-to-T•A conversion, which we refer to as the “CBE precision editing SNV library”. Analogously, we designed the “ABE precision editing SNV library”, which assesses precise A•T-to-G•C editing of ABEs with 12,000 sgRNA–target pairs for 11,585 unique SNV variants. To assess our model’s performance, we intentionally designed the library to include SNVs in suboptimal protospacer positions and with both high and low correction precision and efficiency as predicted by a preliminary version of BE-Hive.
BE-Hive accurately predicted correction precision (the fraction of edited reads that contain an exact single-nucleotide edit that corrects the SNV to the wild-type allele), achieving median R = 0.89 for ABEs and 0.86 for CBEs in mES and HEK293T cells (Figure 4A, S6G, and Figure S7 Editing outcomes on the transversion-enriched SNV library, related to Figures 5–7). We observed >90% precise single-nucleotide correction to the wild-type allele at 3,036 SNVs by ABEs and 364 by CBEs. We report the processed outcome data including bystander correction precisions in Table S2–3.
Figure 4. Precise Base Editing Correction of Pathogenic Alleles.

(A) Comparison of predicted versus observed correction precision of disease-related SNVs in mES cells. Trend lines and shading show the rolling mean and standard deviation. (B-H) Observed frequency of correcting disease-related SNVs to wild-type among edited reads. See also Table S2–3. (B) Disease-related SNVs with at least two substrate nucleotides, or any number of substrate nucleotides, in the editing window of each base editor. Error bars depict standard error of the mean. Distribution plot depicts the protospacer positions of SNVs. (C) Disease-related SNVs with bystander nucleotides in the editing window of each base editor. (D) Disease-related SNVs positioned at C6 with no other bystander nucleotides in the editing window and edited by BE4 in mES cells. (E and F) Disease-related SNVs edited by BE4 (E) and ABE (F). Scatter plots compare predicted to observed correction precisions. B = C, G, or T; and D = A, G, or T. (G and H) Disease-related SNVs corrected by various base editors. Scatter plots compare observed to predicted correction precisions. D = A, G, or T.
Figure 5. Sequence Determinants of CBE-Mediated Transversions.
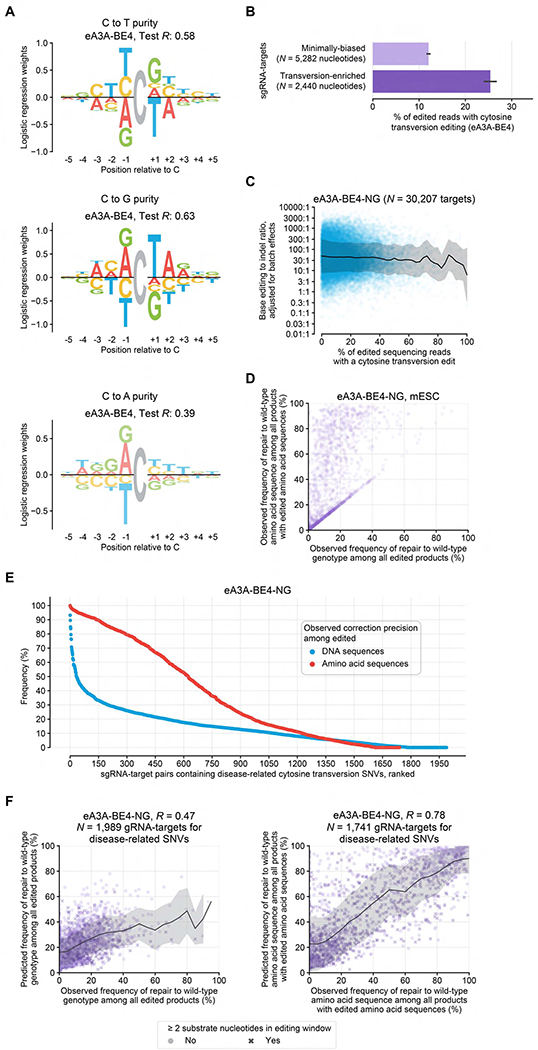
(A) Sequence motifs for the purity of C editing to A, G, and T. Logo opacity is proportional to the motif’s Pearson’s R or AUC on held-out sequence contexts. (B) Comparison of average cytosine transversion product purity in mES cells at minimally biased targets versus targets predicted by BE-Hive to be enriched for transversion edits. Error bars depict the standard error of the mean. (C) Relationship between BE:indel ratio and cytosine transversion purity in mES cells. (D) Relationship between correction precision among edited genotypes and edited amino acid sequences in mES cells. (E) Observed correction precision of disease-related transversion SNVs among edited DNA (blue) or edited amino acid sequences (red) in mES cells. See also Table S4. (F) Comparison of predicted versus observed correction precision of disease-related transversion mutations by cytosine base editing among edited DNA (left) or edited amino acid sequences (right) in mES cells. In C and F, trend lines and shading show the rolling mean and standard deviation, respectively.
Figure 7. Mutations to Conserved APOBEC Residues Increase CBE Product Purity.

(A-H) Characterization of EA-BE4 compared to BE4 (A-D) and eA3A-BE5 compared to eA3A-BE4 (EH). (A and E) Comparison of transversion frequency by base editor variants with mutations at conserved deaminase residues in BE4 and eA3A-BE4. Error bars depict standard error of the mean. In (A), * P < 0.02; ** P = 2.0×10⁻⁶, N = 3,636 and 1,208 substrate nucleotides. 95% CI: 18-35% reduction. In (E), * P < 0.07; ** P = 2.5×10⁻⁵, Welch’s T-test, N = 1,837 and 685 substrate nucleotides. 95% CI: 17-36% reduction. (B and F) Base editor mutation activity profiles in HEK293T cells, depicted as in Figure 1. (C and G) Sequence motif for base editing efficiency in HEK293T cells. (D and h) Comparison of base editing efficiency between BE4 and EA-BE4, and between eA3A-BE4 and eA3A-BE5. Error bars depict the standard error of the mean. (I) Pareto frontier showing the tradeoff between cytosine transversion purity and editing window size by base editor. Scatter plot densities show bootstrap samples of the mean. Single-nucleotide base editing precision was simulated by choosing the substrate nucleotide closest to the position with maximum base editing efficiency as the target substrate. The distribution plot shows the position of target nucleotides used in the simulated precision task.
Precise single-nucleotide correction is less frequent when multiple substrate nucleotides are present in the window, ranging from 2.9% to 16% on average for CBEs and 26% to 34% for ABEs (Figure 4B). However, we observed 675 unique disease-associated SNVs that underwent >90% single-nucleotide correction precision (524 by editing with ABEs and 151 with CBEs), despite containing bystander A or C nucleotides within their activity windows (Figure 4C). These unusually precisely edited SNVs would not be previously identified as likely candidates for high-precision single-nucleotide correction due to the presence of bystander nucleotides, but were nonetheless predicted by BE-Hive with high accuracy in mES and HEK293T cells (R = 0.78 to 0.92).
When only a single C or A nucleotide is present in the editing window, prediction of single-nucleotide base editing precision may seem trivial. However, we observed substantial variation in editing outcomes by CBEs and ABEs even among these substrates (Figure 4D, Supplemental Information), demonstrating that at some target sequences unexpected editing outside of the activity window can occur. BE-Hive accurately predicted outcomes at target sites with a single editable nucleotide in the window, with R ranging from 0.92 to 0.94 for CBEs and 0.79 to 0.93 for ABEs. Similarly, editing outcomes varied substantially when exactly two editable C or A nucleotides were present at fixed protospacer positions (Figure 4E–F). These data demonstrate that base editing precision is not dependent on position and number of editable nucleotides alone. For both classes of target sequences, BE-Hive accurately predicted correction precision with R = 0.94 for BE4 and 0.71 for ABE.
These results reveal that single-nucleotide base editing relies on a complex relationship between the position of target and bystander nucleotides and base editor sequence preferences that cannot be deduced from activity window and dinucleotide preference alone (Supplemental Information), but can be accurately captured and predicted by machine learning. For example, some SNVs at protospacer positions 5 and 7 achieved the highest correction precision using the wide-window editor BE4-CP (Figure 4G), even with additional cytosines present in its window. Overall, BE-Hive performed very strongly across CBEs at predicting correction precision at targets with at least one bystander C in each editor’s activity window (Figure 4G–H; R = 0.91 and 0.96).
Taken together, the above results establish BE-Hive as an experimentally validated method to optimize base editing outcomes—including those that cannot be predicted by inspection—with high accuracy, and to identify sites amenable to precise editing that would not formerly be considered candidates for precision base editing.
Target Sequence Features Partially Determine Rare CBE Outcomes
The occurrence of rare base editing outcomes varies by base editor, cell type, and target site, and is dependent on many factors (Supplemental Information, Figure S7B). While cytosine transversion byproducts and indels that result from CBEs are thought to arise from abasic lesions produced by UNG-mediated removal of uracil (Komor et al., 2016a), native motifs of UNG-mediated cytosine transition and transversions (WACT and WGCT, respectively) are weak predictors of CBE-editing outcomes (Figure 2A and C, S4A; Supplemental Information) (Pérez-Durán et al., 2012). We assessed the contribution of sequence context in determining CBE-mediated cytosine conversion to G and A, its potential utility in editing disease-relevant SNVs, and the ability of BE-Hive to accurately predict these events.
We investigated whether sequence contexts predicted by BE-Hive to support CBE-mediated transversion are frequent in disease-relevant contexts. We focused our search on targets editable by eA3A-BE4, which displayed the highest frequency of cytosine transversion byproducts in the comprehensive context library (Figure 1B). Among 18,523 disease-associated cytosine transversion variants, BE-Hive identified 2,090 unique alleles predicted to be predisposed to C•G-to-G•C conversion, and 289 alleles predisposed to C•G-to-A•T conversion by eA3A-BE4 and eA3A-BE4-NG editing. While an RCTA motif (test R = 0.63) is predictive of C•G-to-G•C conversion, a looser and weaker RC motif (test R = 0.39) is predicted to predispose sites to C•G-to-A•T outcomes (Figure 5A). These findings suggest that sequence features not only affect the ratio of CBE-mediated cytosine transition versus transversion outcomes but may also determine the specific transversion product.
We experimentally assessed these sequence features using a library of 3,400 sgRNA-target pairs predicted to induce 8.5%–78% precise single-nucleotide C•G-to-G•C conversion and 400 sgRNA-target pairs to induce 5.9%–30% C•G-to-A•T conversion among edited outcomes by eA3A-BE4 and eA3A-BE4-NG editing, which we collectively named the “transversion-enriched SNV library” (Table S4). We observed higher cytosine transversion purity in mES cells in this library, averaging 25% by eA3A-BE4-NG, compared to 12% by eA3A-BE4 in the comprehensive context library (P = 2.7×10−93, Welch’s T-test, N = 2,440 versus 5,282 substrate nucleotides; Figure 5B, S7C) and compared to 3.4% on average across all other CBEs tested (Figure 1B). These results indicate that BE-Hive learned sequence features that determine cytosine transversion outcomes of cytosine base editing.
Among cytosine transversion outcomes, C•G rarely converts to an A•T (Imai et al., 2003). To investigate whether some contexts could support C•G-to-A•T conversion as the main product, we used BE-Hive to design 20 synthetic sequences optimized for this goal and observed a 4-fold elevated mean C•G-to-A•T editing purity of 16% among edited products, with a maximum of 53% (Figure S7D), compared to the baseline average purity of 4.0% of edited outcomes across the comprehensive context library by eA3A-BE4 (P = 0.0195, Welch’s T-test, N = 13,627 versus 12 substrate cytosines in 12 target sequences). These data suggest that BE-Hive has learned sequence features that influence both types of cytosine transversion outcome at a given site.
We explored whether CBE-mediated cytosine transversions co-segregate with indels and observed no meaningful relationship between cytosine transversion purity and BE:indel ratio by eA3A-BE4-NG editing (R = −0.02, P = 0.2, N = 4,320 target sites; Figure 5C). These data suggest that the disease-associated sequence contexts predicted to yield higher transversion product purities enrich for specific resolution of abasic intermediates towards transversion edits, rather than merely increasing abasic site formation by promoting base excision that would increase the frequency of both indel and transversion outcomes.
CBE-Mediated Correction of Transversion SNVs
Many SNVs in protein coding regions are known to cause human disease (Landrum et al., 2016; Stenson et al., 2014). For missense or nonsense variants, correction to the wild-type or a synonymous coding sequence can be sufficient to restore protein function. We achieved correction of 121 disease-associated transversion SNVs in the transversion-enriched SNV library with ≥90% precision among edited amino acid sequences (≥90% amino acid precision) for C•G-to-G•C at 118 SNVs and for C•G-to-A•T at 3 SNVs (Figure 5D–E, Table S4). Importantly, BE-Hive accurately predicted amino acid precisions by eA3A-BE4-NG at these sites (R = 0.78; Figure 5F), enabling the correction of an entirely new class of point mutants not previously considered candidates for correction by CBEs.
BE-Hive predicted the precise single-nucleotide correction of cytosine transversion SNVs with moderate accuracy of R = 0.47 (Figure 5F), indicating that the learned RCTA motif is an important but incomplete determinant of cytosine transversion purity. We observed 33 unique disease-associated SNVs in which exact single-nucleotide correction by conversion of C•G to either G•C or A•T was the dominant editing outcome in >50% of edited reads. The highest C•G-to-G•C correction precision achieved was 93% at a pathogenic mutation in the dystrophin gene (DMD), while the highest C•G-to-A•T correction precision was 28% for a pathogenic mutation in MutL homolog 1 (MLH1).
These findings experimentally confirm BE-Hive predictive accuracy in identifying sequence determinants of CBE-mediated transversion outcomes, enabling the identification and correction of a previously unrecognized class of disease-relevant SNVs by cytosine transversion base editing.
Mutations to Conserved APOBEC Residues Increase Rare Cytosine Transversions
To dissect the role of CBEs in promoting rare editing outcomes, we investigated how fused cytosine deaminases affect U•G mismatch repair (Supplemental Information). With the exception of AID, interactions between cytosine deaminases used here as components of CBEs and mammalian DNA-repair proteins have not extensively been studied (Adolph et al., 2017; Chaudhuri and Behan, 2004). In somatic hypermutation and immunoglobulin class-switching, phosphorylated residues S38 and T27 in AID are thought to play a role in determining repair outcomes of U•G mismatches (Basu et al., 2005; McBride et al., 2008; Pham et al., 2008; Yamane et al., 2011). These phosphorylation sites are widely conserved among mammalian APOBEC family members but not the evolutionarily distant CDA1, which in the context of base editing yields transversion and indel products at lower frequencies than other CBEs (Figure 6A–B, Supplemental Information) (Blom et al., 2004; Theobald and Steindel, 2012). We speculated that these sites may play a role in influencing edited products of some CBEs.
Figure 6. Mutations to Conserved APOBEC Residues Increase Cytosine Transversion Purity.

(A) Evolutionary tree of adenine and cytosine deaminase families. (B) Structural alignment of AID, A3A and homology model of the APOBEC1 deaminase domains (Theseus). Arrows show amino acids homologous to T27 or S38 in AID. (C) Comparison of average transversion purity by eA3A-BE4 and mutant variants and target sequence groups. Error bars show the standard error of the mean. (D) Comparison of average editing efficiency between eA3A-BE4 and mutant variants. Error bars depict standard error of the mean. (E) Correction precision of disease-related transversion SNVs among edited DNA (blue) or edited amino acid sequences (red) in mES cells. See also Table S4. (F) Comparison of predicted versus observed correction precision of disease-related transversion mutations by cytosine base editing among edited DNA (left) or edited amino acid sequences (right) in mES cells. Trend lines and shading show the rolling mean and standard deviation.
We asked whether conserved residues in APOBEC family members affect partitioning of U•G mismatch repair outcomes. We mutated T31 in eA3A-BE4-NG, homologous to T27 in AID, to alanine (A), and observed an increase in transversion outcomes in the transversion-enriched SNV library to 31%, compared to 25% by eA3A-BE4-NG (N = 2,440 versus 1,741 substrate nucleotides, P = 1.9×10⁻⁵, Welch’s T-test; Figure 6C, Table S4), and compared to 3.4% on average across all other CBEs on the comprehensive context library (Figure 1B). The T31A mutation did not alter cytosine transversion motifs (Figure S4A and S7E) or BE:indel ratios (46:1 compared to 45:1) relative to eA3A-BE4, although we observed a 3.5-fold reduction in mean editing efficiency (Figure 6D), consistent with reports on the T27A mutation in AID (Basu et al., 2005). Alanine mutation of T44, equivalent to S38 in AID did not significantly affect editing outcomes (Figure 6C). These results suggest that mutation of some conserved phosphorylated residues in CBE-fused APOBEC family members can affect the distribution of cytosine base editing outcomes.
The increase in transversion purity by eA3A-BE4-NG(T31A) was site-dependent. While the mean transversion frequency in the comprehensive context library in mES cells was unchanged relative to eA3A-BE4, we observed a 2.9-fold increase in the fraction of alleles corrected with ≥90% amino acid precision by C•G-to-G•C or C•G-to-A•T editing of the transversion-enriched SNV library to 20% of assayed targets (Figure 5E and 6E). These precise corrections included two pathogenic G•C-to-C•G alleles of the low-density lipoprotein receptor gene (LDLR) that cause familial hypercholesterolemia; each was corrected back to wild-type with 99–100% precision among edited amino acid sequences (Table S4). These data demonstrate that eA3A-BE4-NG(T31A) can increase cytosine transversion purity at disease-associated SNVs that support transversion outcomes. Collectively, our findings suggest that deaminases strongly affect the partitioning of U•G mismatch repair outcomes that arise from abasic lesions, establishing a new role for CBE deaminases beyond deamination activity alone.
Importantly, BE-Hive predictions of cytosine transversion outcomes were accurate, with R = 0.84 for amino acid precision and R = 0.55 for predicting genotype precision (Figure 6F). Among SNVs identified by BE-Hive, we corrected 66 unique G•C-to-C•G coding mutations in 25 of the 59 genes identified as medically actionable by the American College of Medical Genetics (Kalia et al., 2016) by editing with eA3A-BE4 variants, achieving >78% average amino acid precision (BE-Hive predicted average 74%; Table S4). These findings demonstrate the utility of BE-Hive in designing base editing experiments for precision non-canonical editing of clinically relevant targets that were not previously appreciated as likely candidates for CBE-mediated correction.
Mutations to Conserved APOBEC Residues Improve Cytosine Transition Purity
Given our observation that mutation of conserved residues in eA3A-BE4 can affect CBE outcomes, we next investigated whether deaminase variants can improve C•G-to-TÂ product purities. Residue S38 in AID is a known PKA target (Basu et al., 2005), and computational analysis revealed this phosphorylation site is conserved (Blom et al., 2004). We examined phosphomimetic amino acid substitution to either aspartate (D) or glutamate (E) of APOBEC1 residue H47, equivalent to AID S38, in BE4 (Figure 6B). We measured cytosine transversion outcomes on the comprehensive context library in HEK293T cells and indeed observed a reduction in transversion byproducts from 5.1% average by BE4 editing, to 4.7% by H47D (P = 0.41) and 4.2% by H47E variants (P = 1.3×10⁻⁴, Welch’s T-test; Figure 7A).
Mutation of the adjacent conserved residue S48 to alanine further reduced transversion byproducts resulting from these variants, down to 3.7% for BE4 H47E+S48A (Figure 7A). This variant (EA-BE4) reduced transversion product purity by 27% on average compared to BE4 (95% CI: 18–35% reduction, P = 1.5×10⁻⁸, Welch’s T-test, N = 3,636 and 1,208 substrate nucleotides), while maintaining a similar editing window, editing sequence preference, and disequilibrium score (Figure 7B–C), but with a small loss in editing efficiency (averaging 16%, compared to 18% in BE4 in the same batch; Figure 7D) and a slight shift in BE:indel ratio (32:1 with IQR = 12:1 to 85:1, compared to 36:1 with IQR = 12:1 to 100:1 for BE4; Figure S7F).
Next, we introduced the same changes to equivalent residues in eA3A-BE4 to investigate whether the effect of these mutations is generalizable among APOBEC family members. In HEK293T cells, D and E substitution of T44, equivalent to S38 in AID, reduced undesired transversion edits from 9.8%, to 8.8% (P = 0.06) and 7.9% (P = 4.2×10⁻⁷), respectively (Figure 7E). Alanine substitution of the adjacent conserved S45 residue alone did not have a significant effect, but the combination of T44D+S45A further lowered transversion purity to mean 7.1%, reduced by 27% compared to canonical eA3A-BE4 editing (95% CI: 17–36% reduction; P = 1.0×10⁻⁶, Welch’s T-test, N = 1,837 and 685 substrate nucleotides). We observed identical editing efficiency in the same experimental batch by the T44D+S45A variant and eA3A-BE4 and a mildly elevated geometric mean BE:indel ratio (46:1 compared to 43:1, respectively) with no effect on editing window, sequence preference, or disequilibrium score (Figure 7F–H and S7G). Single-nucleotide editing bystander precision was improved by 15% (38% in T44D+S45A variant, relative to 33% in eA3A-BE4, Figure 7I), achieving the highest single-nucleotide editing precision among all CBEs tested here. We did not observe any apparent downsides to using eA3A-BE4 T44D+S45A relative to eA3A-BE4 among the many CBE characteristics examined across thousands of target sites in this study. Therefore, we name this eA3A base editor variant eA3A-BE5.
Collectively, these data demonstrate that mutation of conserved phosphorylation targets in APOBEC family deaminases can affect cytosine transversion byproducts of multiple cytosine base editors. While CDA-BE4 and evoA-BE4 demonstrate higher C•G-to-TÂ purity than the EA-BE4 or eA3A-BE5, CDA-BE4 and evoA-BE4 have substantially larger editing windows and therefore offer low bystander precision, often making them less suited for precision editing applications (Figure 7I). The optimal base editor choice for precision editing lies on a Pareto frontier that balances the relative risk of bystander versus transversion edits. EA-BE4 (BE4 H47E+S48A) and eA3A-BE5 (eA3A-BE4 T44D+S45A) represent novel optimized CBEs that lay beyond the Pareto frontier defined by previously reported base editors and provide narrow-window base editing with minimal cytosine transversion editing activity.
Discussion
High-throughput base editing approaches to install disease-relevant SNVs or tiled mutagenesis of gene regions hold promise for high-resolution functional genomics. Large-scale parallel base editing could enable genome-wide assays without the complications of inducing mixtures of indels to study disease-relevant sequence variations by installation of SNVs found in genome-wide association studies (GWAS), investigate the functional role of cancer point mutations (Bailey et al., 2018; Brown et al., 2019; Pardiñas et al., 2018; Stahl et al., 2019), or characterize genetic variants of unknown significance. Genome-wide perturbation by base editing has been shown to be less deleterious to cells than similar SpCas9-based screens (Després et al., 2020; Hart et al., 2015; Koike-Yusa et al., 2013; Kuscu et al., 2017; Li et al., 2018; Rajagopal et al., 2016; Shalem et al., 2014; Wang et al., 2014). Genome-wide CRISPR screens typically rely on read-out of the sgRNA to infer genotypic changes, and thus the unpredictability of edited outcomes at some loci has complicated the use of base editors for screening applications (Kuscu et al., 2017; Kweon et al., 2019; Li et al., 2018).
The suite of machine learning models developed in this work, freely accessible at https://crisprbehive.design, predict genotypes resulting from base editing and editing efficiency with high accuracy (R ≈ 0.89 for genotypes and R ≈ 0.71 for efficiency across all base editors tested), and should facilitate high-throughput base editing screens that rely on read-out of the input sgRNA by minimizing unanticipated editing outcomes and allow users to adjust for variation in efficiency across sgRNAs when analyzing enrichment or depletion. We used BE-Hive to design sgRNA libraries for Cas9-NG fused BE4, eA3A-BE4, and ABE to install variants of unknown significance from Clinvar (Supplemental Information, Supplemental Tables 5–7) and predict improved installation frequencies at up to 28% of sgRNAs compared to a baseline library (Figure S7H–K). Thus, we anticipate that BE-Hive will facilitate the design and analysis of genome-wide base editing screens.
Using the unprecedented wealth of base editing data generated in this study, we elucidated similarities and differences among different CBEs and ABEs, simplifying selection of the optimal tool for precision editing at a locus of interest, and gaining insight into the processes that determine editing outcomes. Collectively, these findings suggest a complex but predictable interaction of base editor components, DNA repair proteins, and local sequence context together determine base editing outcomes. These determinants can be accurately modeled by machine learning and manipulated by protein engineering to create base editors with novel editing properties. This work provides both refined and novel insights into base editor functionality, advancing the targeting scope, biological understanding, precision, and overall effectiveness of base editing.
STAR Methods
RESOURCE AVAILABILITY
Lead contact
Please direct requests for resources and reagents to Lead Contact: David R. Liu (drliu@fas.harvard.edu).
Materials availability
Plasmids generated in this study have been deposited to Addgene.
Data and code availability
The sequencing data generated during this study are available at the NCBI Sequence Read Archive database under PRJNA591007. Processed data have been deposited under the following DOIs: 10.6084/m9.figshare.10673816 and 10.6084/m9.figshare.10678097. The code used for data processing and analysis are available at https://github.com/maxwshen/lib-dataprocessing and https://github.com/maxwshen/lib-analysis.
EXPERIMENTAL MODEL AND SUBJECT DETAILS
Library Construction
The cloning process is as reported in Shen et al. 2018, with minor changes. In brief, the process involves ordering a library of 2,000 to 12,000 oligonucleotides pairing an sgRNA protospacer with its 35-nt, 56-nt or 61-nt target site, centered on an ‘NGG’ or ‘NG’ PAM, as specified. Targets included randomly selected wild-type human genomic sequences that flanked partially synthetic base editor target sequences with highly variable sequence compositions, or disease-associated (pathogenic and likely-pathogenic) human genomic sequences selected from the NCBI ClinVar database (July, 2018) and the Human Gene Mutation Database (HGMD, v.2017_4 SNVs) (Landrum et al., 20l6; Stenson et al., 2014). sgRNA spacers were cloned upstream of SpCas9 F+E-modified hairpins with improved stability and folding properties (Chen et al., 2013), and a G was added to the 5’ end of spacers that did not natively start with G to ensure efficient transcription from the U6 promoter (Ma et al., 2014). Pools were amplified with NEBNext Ultra II Q5 Master Mix (New England Biolabs) with initial denaturation and extension times extended to 2 min per cycle for all PCR reactions to prevent skewing towards GC-rich sequences. To insert the sgRNA hairpin between the sgRNA protospacer and the target site, the library undergoes an intermediate Gibson Assembly circularization step, restriction enzyme linearization with SspI-HF and Gibson Assembly into a plasmid backbone containing a U6 promoter to facilitate sgRNA expression, a hygromycin resistance cassette and flanking Tol2 transposase sites to facilitate integration into the genome. Purified plasmids were transformed into NEB10beta (New England Biolabs) electrocompetent cells. Following recovery, a small dilution series was plated to assess transformation efficiency and the remainder was grown in liquid culture in DRM medium overnight at 37 °C with 100ug/mL ampicillin. The plasmid library was isolated by Midiprep plasmid purification (Qiagen). Library integrity was verified by restriction digest with SapI (New England Biolabs) for 1 h at 37 °C, and sequence diversity was validated by deep sequencing as described below.
Cloning
Base editor plasmids were constructed by inserting a blasticidin resistance expression cassette from a p2T-CAG-SpCas9-BlastR plasmid (Addgene 107190) (Arbab et al., 2015) downstream of the bGH-polyA terminator into a BE4 plasmid (Addgene 100802) (Komor et al., 2017). Tol2-transposase sites from p2T-CAG-SpCas9-BlastR were cloned to flank the base editor and antibiotic selection cassettes. All editors described in this paper were cloned between the N-terminal and C-terminal NLS sequences flanking BE4. The full sequence of the p2T-CMV-BE4max-BlastR plasmid and editor sequences for all editors used in this paper is appended in the ‘Sequences’ section. The REV1 overexpression plasmid was cloned by insertion of REV1 ORF between the BamHI and NheI restriction sites of p2T-CAG-MCS-P2A-GFP-PuroR (Addgene 107186) (Shen et al., 2018). Individual SpCas9 sgRNAs were cloned as a pool into a Tol2 transposase-flanked gRNA expression plasmid (Addgene 71485) using BbsI plasmid digest and Gibson Assembly (New England Biolabs). Protospacer sequences and gene specific primers used for amplification followed by HTS are listed in the Primers Table. Cloning of individual constructs was performed using NEB Turbo chemically competent E. coli (New England Biolabs) grown on LB agar plates and liquid cultures were grown in LB broth overnight at 37 °C with 100ug/mL ampicillin.
Library Cell Culture
Undifferentiated 129P2/OlaHsd mESCs (male) lines used have been described and authenticated previously (Sherwood et al., 2014). Briefly, mESCs were maintained on gelatin-coated plates in mESC medium composed of Knockout DMEM (Life Technologies) supplemented with 15% defined FBS (HyClone), 0.1 mM nonessential amino acids (Life Technologies), 1% Glutamax (Life Technologies), 0.55 mM 2-mercaptoethanol (Sigma) and 1× ESGRO LIF (Millipore), 5 nM GSK-3 inhibitor XV, and 500 nM UO126. HEK293T (female) were purchased from ATCC and maintained in DMEM (Life Technologies) Supplemented with 10% FBS (Life Technologies). U2OS (female) cells were purchased from ATCC and maintained in McCoy’s 5A (Life Technologies) Supplemented with 10% FBS (Life Technologies). Both cell lines were authenticated by the suppliers and tested negative for mycoplasma. All lines were kept at 37°C with 95% relative humidity and 5% CO2.
For stable Tol2 transposon-mediated library integration, cells were transfected using Lipofectamine 3000 (Thermo Fisher) following standard protocols with equimolar amounts of Tol2 transposase plasmid (a gift from K. Kawakami) and transposon-containing plasmid. For library applications, 15-cm plates with >107 initial cells were used. To generate library cell lines with stable Tol2-mediated genomic integration, cells were selected with hygromycin starting the day after transfection at an empirically defined concentration and continued for >2 weeks. In cases where sequential plasmid integration was performed such as integrating library and then base editor, cells were transfected with Tol2 transposase plasmid using Lipofectamine 3000 and selected with blasticidin starting the day after transfection for 4 days before harvesting. We maintained an average coverage of ≥300x per library cassette throughout.
Genome editing of endogenous loci
SpCas9 nuclease targeting of endogenous loci was performed using self-cloning sgRNAs by co-transfection of PCR-extended sgRNA oligonucleotides to target genomic sites with the palindromic p2T-U6-sgPal7-HygR plasmid (Addgene 71484) as previously described (Arbab et al., 2015), followed by stable selection with hygromycin starting the day after transfection at an empirically defined concentration and continued for >2 weeks. To generate stable REV1 overexpressing cells by Tol2 transposon-mediated genomic integration, cells were selected with puromycin starting the day after transfection at an empirically defined concentration and continued for >2 weeks, followed by flow cytometric sorting for GFP-expression. For base editing at single endogenous loci 48-well plates with >105 initial cells were used and cells were harvested after three days for high throughput sequencing.
METHOD DETAILS
Development of a Genome-Integrated Target Site Library Assay for Base Editors
To refine our understanding of sequence features that govern base editing outcomes, we sought to develop a comprehensive and unbiased approach to characterizing base editors. We designed libraries of 4,000 or 12,000 oligonucleotides each up to 176 nt in length encoding unique 20-nt sgRNA spacers paired with target sequences (35, 56, or 61 bp in length) that contain an ‘NGG’ or ‘NG’ protospacer adjacent motif (PAM) to direct Streptococcus pyogenes Cas9 (SpCas9) (Cong et al., 2013; Jinek et al., 2013; Mali et al., 2013) or Cas9-NG, an engineered variant with broadened PAM compatibility (Nishimasu et al., 2018), to the center of each target site (Figure 1A, STAR Methods) (Shen et al., 2018). Targets included randomly selected wild-type human genomic sequences that flanked partially synthetic base editor target sequences with highly variable sequence compositions, or disease-associated (pathogenic and likely-pathogenic) human genomic sequences selected from the NCBI ClinVar database (July, 2018) and the Human Gene Mutation Database (HGMD, v.2017_4 SNVs) (Landrum et al., 2016; Stenson et al., 2014). sgRNA spacers were cloned upstream of SpCas9 F+E-modified hairpins with improved stability and folding properties (Chen et al., 2013), and a G was added to the 5’ end of spacers that did not natively start with G to ensure efficient transcription from the U6 promoter (Ma et al., 2014). Libraries were cloned into a plasmid that supports Tol2-transposon mediated genomic integration, sgRNA expression, and hygromycin selection for cells with integrated library members (Arbab et al., 2015; Barkal et al., 2016; Shen et al., 2018; Sherwood et al., 2014; Urasaki et al., 2006).
We stably integrated ≥38,538 unique library cassettes into the genomes of mouse embryonic stem cells (mESCs), human HEK293T cells, and human U2OS cells, and transfected these cells with a base editor expression plasmid that supports Tol2-transposon mediated genomic integration and blasticidin selection. To detect rare and diverse editing outcomes with high sensitivity, we maintained an average coverage of >300x per library cassette throughout the process. After five days we collected genomic DNA from treated cells and untreated cells as a control, amplified the library cassettes, and performed high-throughput sequencing (HTS) of the target sites at an average sequencing depth of ≥4,000x per target. This high sequencing depth maximized the number of unique library members that were suitable for downstream analysis despite variability among the representation of library members.
Using this approach, we studied six commonly used CBEs in the NLS- and codon-optimized BE4max architecture (bpNLS–deaminase–Cas9 D10A–2x uracil glycosylase inhibitor (UGI)–bpNLS) (Koblan et al., 2018): BE4max (referred to hereafter as BE4), circularly permuted CP1028-CBEmax (BE4-CP), evoAPOBEC1-BE4max (evoA-BE4), AID (AID-BE4), CDA1-BE4max (CDA-BE4), and engineered APOBEC3A (eA3A-BE4) (Gehrke et al., 2018; Huang et al., 2019; Komor et al., 2017; Thuronyi et al., 2019). We also studied two ABEs: ABEmax (bpNLS–wt TadA–evolved TadA*–Cas9 D10A–bpNLS, referred to hereafter as ABE) and circularly permuted CP1041-ABEmax (ABE-CP) (Gaudelli et al., 2017; Huang et al., 2019), for a total of eight previously reported base editors spanning a diverse range of editing window sizes and sequence preferences. We performed two biological replicates per base editor and per cell type and observed average editing efficiencies (frequency of target-modified outcomes among total sequenced reads) ranging from 2.9% to 58% (Figure S1A). We processed the resulting data from 2.1 billion sequencing reads, including quality filtering, identification and removal of PCR recombination products, sequence alignment, tabulating editing outcomes, adjusting treated conditions with matched untreated data, and adjusting for batch effects (STAR Methods) to obtain a read count distribution with an average of 1,317 reads per library member per experiment.
We filtered data from library members with low read count to accurately calculate editing efficiency (fraction of sequenced reads with edited outcomes) and outcome purities (frequency of a given outcome among all edited reads). Between biological replicates, the frequency of base editing outcomes among edited reads at library targets was consistent (median Pearson’s R = 0.87 across 33 conditions, Figure S1B) across editors, libraries, and cell types. Editing outcomes at library control sequences taken from the human genome were also consistent with editing outcomes at endogenous loci across five base editors with both narrow and broad editing windows (interquartile range (IQR) of R = 0.79−0.98, Figure S1C). Together, these observations suggest the data are comprehensive, consistent with endogenous editing, and at a scale not previously assessed in base editing.
High-Throughput Sequencing
Genomic DNA was collected from cells 5 days after transfection, after 4 days of antibiotic selection. For library samples, 16 μg gDNA was used for each sample and we maintained an average sequencing depth of ≥4,000x per target. For individual locus samples and untreated cell library samples, 2 μg gDNA was used; for plasmid library verification, 0.5 μg purified plasmid DNA was used. For individual locus samples, the locus surrounding CRISPR–Cas9 mutation was PCR-amplified in two steps using primers >50-bp from the Cas9 target site. PCR1 was performed to amplify the endogenous locus or library cassette using the primers specified below. PCR2 was performed to add full-length Illumina sequencing adapters using the NEBNext Index Primer Sets 1 and 2 (New England Biolabs) or internally ordered primers with equivalent sequences. All PCRs were performed using NEBNext Ultra II Q5 Master Mix. Extension time for all PCR reactions was extended to 2 min per cycle to prevent skewing towards GC-rich sequences. Samples were pooled using Tape Station (Agilent) and quantified using a KAPA Library Quantification Kit (KAPA Biosystems). The pooled samples were sequenced using Illumina NextSeq or MiSeq.
Library Names
Supplemental figures, tables, and deposited data use different names for designed libraries than the manuscript for convenience. The “comprehensive context library” is referred to as “12kChar” and contains 12,000 target sites designed with all possible 6-mers surrounding a substrate A or C nucleotide at protospacer position 6, and all possible 5-mers spanning positions −1 to 13. Within this design series, a particular target sequence can contain more than one such 5-mer, enabling the compression of 11×45 = 11,264 designs into 2,496 sgRNA–target pairs. Three disease-associated libraries called “CBE precision editing SNV library”, “ABE precision editing SNV library”, and “transversion-enriched SNV library” in the manuscript are referred to as “CtoT”, “AtoG”, and “CtoGA”, indicating the base editing event that corrects the disease-related variants included in each library.
Sequence Motif Models
For prediction tasks where the target variable is continuous and has range in (0, 1), we first applied a logistic transformation to the data, then used linear regression. For continuous data representing fractions, we discarded values equal to 0 or 1. For classification tasks, the target variables were either 0 or 1 indicating absence or presence of activity, and we used logistic regression. Target variables included the efficiency of C•G-to-TÂ editing by CBEs, A•T-to-G•C editing by ABEs, the presence or absence of cytosine editing by ABEs and of guanine editing by CBEs, and the purity of cytosine transversions by CBEs. Each of these statistics involves calculating a denominator corresponding to the total number of reads at a target sequence, or the total number of edited reads at a target sequence. Target sequences with fewer than 100 reads in the denominator were discarded to ensure the accuracy of estimated statistics in the training and testing data. Features were obtained by one-hot-encoding nucleotides per position relative to a substrate nucleotide or to the protospacer. When featurizing data relative to a single substrate nucleotide, each substrate nucleotide within a specified range of positions was used. Ranges used included position 6 only (for the characterization library that contained all NNN-NNN-mers surrounding position 6) and positions 4–8, which was used only when exploratory data analysis indicated that the activity of interest did not vary substantially by position. All nucleotides within a 10-bp radius of the target position were one-hot-encoded. Position was not used as a feature. The data were randomly split into training and test sets at an 80:20 ratio. We note that sequence motifs described by these regression models consider each position independently and are intended primarily for visualization.
Base Editing Efficiency Model
We observed that base editing efficiency varies by experimental batch. To combine replicates across batches, we first performed mean centering and logit transformation at up to 10,638 gRNA-target pairs in each experimental condition separately from the 12kChar library which includes all 4-mers surrounding A or C from protospacer positions 1 to 11. We discarded data at target sites with fewer than 100 total reads, then averaged values at matched target sites across experimental replicates. Values of negative or positive infinity (resulting from logit of 0 or 1) were discarded. The data were randomly split into training and test sets at a ratio of 90:10. Each target site had a single output value corresponding to the mean logit fraction of sequenced reads with any base editing activity. Data points comprising a single replicate were assigned weight = 0.5. Data points comprising multiple replicates were assigned a weight of the median logit variance divided by the logit variance at that data point, or 1, whichever value was smaller. In this manner, exactly half of the data points comprising multiple replicates were assigned a weight of 1, and those with higher variance were assigned a lower weight. We obtained features from each target sequence using protospacer positions −9 to 21. Features included one-hot encoded single nucleotide identities at each position, one-hot encoded dinucleotides at neighboring positions, the melting temperature of the sequence and various subsequences, the total number of each nucleotide in the sequence, and the total number of G or C nucleotides in the sequence.
We used gradient-boosted regression trees from the python package scikit-learn and trained them with tuples of (x, y, weights) using the training data. We performed hyperparameter optimization by varying the number of estimators between {100, 250, 500}, the minimum samples per leaf in {2, 5}, and the maximum tree depth in {2, 3, 4, 5}. We performed 5-fold cross-validation by splitting the training set into a training and validation set at a ratio of 8:1 and retained the combination of hyperparameters with the strongest average cross-validation performance as the final model. We trained models in this manner for each combination of cell-type and base editor. Models were evaluated on the test set which was not used during hyperparameter optimization.
These base editing efficiency models, as with most machine learning models, provide output on an abstract scale by default. BE-Hive also allows output to be customized to a more physically interpretable scale, such as the fraction of sequenced reads showing any base edits. This model design, in contrast with other models developed for CRISPR-related editing efficiency, alleviates the requirement for users to perform additional heuristic interpretation of machine learning model outputs (Doench et al., 2016).
Bystander Editing Model
We assembled a dataset where each gRNA-target pair was matched with a table of observed base editing genotypes and their frequencies among reads with edited outcomes. We discarded data points with fewer than 100 edited reads. We discarded edited genotypes occurring at higher than 2.5% frequency with no edits at any substrate nucleotides (defined as C for CBEs and A for ABEs) in positions 1–10. Data from multiple experimental replicates were combined by summing read counts for each observed genotype.
Briefly, we designed and implemented a deep conditional autoregressive model that uses an input target sequence surrounding a protospacer and PAM to output a frequency distribution on combinations of base editing outcomes in the python package pytorch. The model predicts substitutions at cytosines and guanines for CBEs and adenines and cytosines for ABEs from protospacer positions −10 to 20. The model transforms each substrate nucleotide and its local context using a shared encoder into a deep representation, then applies an autoregressive decoder that iteratively generates a distribution over base editing outcomes at each substrate nucleotide while conditioning on all previous generated outcomes. The encoder and decoder are coupled with a learned position-wise bias towards producing an unedited outcome. The model is trained on observed data by minimizing the KL divergence. Importantly, the conditional autoregressive design is sufficiently expressive to learn any possible joint distribution in the output space, thereby representing a powerful and general method for learning the editing tendencies of any base editor from data.
Input features were obtained by one-hot encoding each substrate nucleotide and the 5 nucleotides (where 5 is a hyperparameter) on either side of it and concatenating this with a one-hot encoding of the position of the substrate nucleotide within positions −9 to 20. Additional features considered but found to detract from model performance during hyperparameter optimization included concatenating a one-hot encoding of the full sequence context. Hyperparameter optimization on the radii of nucleotides surrounding the substrate nucleotide considered values in {3, 5, 7, 9}, and found 5 to be optimal when averaged across hyperparameter optimization rounds that included simultaneous changes in other hyperparameters. Each substrate nucleotide within the editing range were featurized in this manner for each target sequence.
The model uses two neural networks: an encoder with two hidden layers of 64 neurons and a decoder with five hidden layers of 64 neurons. The networks are fully connected, use ReLU activations, and contain residual connections between neighboring pairs of layers that have equal shape. A dropout frequency of 5.0% was used and tuned by hyperparameter optimization. We included architecture search in hyperparameter optimization and found that these shapes were a local optimum in the surrounding neighborhood varying the number of neurons per layer and the number of layers in each network.
During a forward pass of the model at a single target site, the shapes of relevant variables are:
x.shape = (n.edit.b, x_dim)
y_mask.shape = (n.uniq.e + 1, n.edit.b, y_mask_dim)
target.shape = (n.uniq.e + 1, n.edit.b, 4, 1)
obs_freq.shape = (n.uniq.e)
where:
‘x’ is the featurized input
‘y_mask’ is used to provide previously observed outcomes to the decoder while masking future outcomes, in a conditional autoregressive manner
‘target’ is a one-hot encoding of each unique edited genotype
‘obs_freq’ contains the observed frequencies for each edited genotype
n.uniq.e = the number of unique observed edited genotypes for a target site
n.edit.b = the number of editable bases in the target sequence
x_dim = the number of features for a single substrate nucleotide in a single target sequence
The shape n.uniq.e + 1 is used to indicate the inclusion of a row for the wild-type outcome. We run the model on this outcome and use the result to adjust all predicted probabilities to obtain a denominator equal to 1 – p(wild-type).
The tensor ‘y_mask’ is used to provide previously observed outcomes to the decoder while masking future outcomes in a conditional autoregressive fashion. Previously observed unedited nucleotides are encoded as [1/3, 1/3, 1/3], while editable nucleotides are encoded as [0, 0, 0] if unedited, and otherwise are a one-hot encoding of the nucleotide resulting from the base edit. Future nucleotides are encoded as [−1, −1, −1].
The following shape transformations occur during a forward pass.
Model encodes x: (n.edit.b, x_dim) → (n.edit.b, x_enc_dim)
Expanding and concatenating with y_mask → (n.uniq.e + 1, n.edit.b, x_enc_dim + y_mask_dim).
Decode → (n.uniq.e + 1, n.edit.b, 1, 4)
Add unedited bias, then log softmax → (n.uniq.e + 1, n.edit.b, 1,4)
Matrix multiplication with target one-hot-encoding → (n.uniq.e + 1, n.edit.b, 1, 1), reshape → (n.uniq.e + 1, n.edit.b)
Sum log likelihoods → (n.uniq.e + 1)
Adjust all likelihoods by (1 - wild-type) denominator → (n.uniq.e). The wild-type outcome is encoded at the last position.
The resulting (n.uniq.e) shape vector contains a number corresponding to the predicted frequency of each unique observed genotype (totaling n.uniq.e). To obtain a loss during training, the KL divergence between the predicted frequency distribution and the observed frequency distribution is used.
A learnable bias toward unedited outcomes is a part of the model. This component uses an input shape of (n.uniq.e + 1, n.edit.b, 1,4) and outputs a tensor with equivalent shape: (n.uniq.e + 1, n.edit.b, 1, 4). Its parameters correspond to a single value for each position and substrate nucleotide representing a bias towards producing an unedited outcome. One important aspect of the structure of the data is that most dimensions of the input and output tensors vary by target site. Batches comprised of groups of target sites. Empirically, we observed that this property caused minimal speed gains when training the model on CPUs versus GPUs.
QUANTIFICATION AND STATISTICAL ANALYSIS
Sequence Alignment and Data Processing
Sequencing reads were assigned to designed library target sites by locality sensitive hashing). Target contexts that were intentionally designed to be highly similar to each other were designed barcodes to assist accurate assignment. Sequence alignment was performed using Smith-Waterman with the parameters: match +1, mismatch −1, indel start −5, indel extend 0. Nucleotides with PHRED score below 30 were assumed to be the reference nucleotide.
For base editing analysis, aligned reads with no indels were retained for analysis and events were defined as the combination of all possible substitutions at all substrate nucleotides in the target site in a read, where a single sequencing read corresponds to an observation of a single event. Substrate nucleotides were defined as C and G for CBEs and A and C for ABEs.
For indel analysis, reads containing indels with at least one indel position occurring between protospacer positions −6 to 26 were retained, where position 1 is the 5’-most nucleotide of the protospacer, and 0 is used to refer to the position between −1 and 1. Reads containing indels without at least six nucleotides with at least 90% match frequency on both sides of each indel were discarded. Events were defined as indels identified by position, length, and inserted nucleotides occurring in a read. Combination indels were either not observed at all or only at exceedingly low frequencies in endogenous data and were therefore excluded from consideration when analyzing library data.
Quantifying Base Editing Profiles
We tabulated the frequencies of each single-nucleotide mutation at each position in each designed target sequence from the sequence alignments. We pooled data across the library to sensitively identify editing events with frequencies below 0.1%. This sensitivity is possible because a mutation event confidently identified at, for example, 10% frequency in one out of 1,000 target sites occurs at .01% frequency in aggregate. We then applied the following steps to adjust treatment data by control data, then to adjust batch effects and identify base editing mutations that occur at frequencies above background.
1. Filter control mutations in control data occurring at or above a 5.0% frequency threshold. Treatment conditions undergo one additional selection step (with 90-95% cell death then expansion) compared to untreated control conditions, where background mutations present in the control conditions (called ‘control mutations’) can stochastically enrich or deplete following a binomial sampling procedure where the variance increases as the control mutation frequency approaches 50%. While control mutations that depleted are not observed in treatment conditions, control mutations can also enrich to high levels in a manner that cannot be corrected for by simple subtraction of control mutation frequencies that would suffice for rare control mutation frequencies. For example, a control mutation at 0.1% frequency could be corrected by subtraction (step 3), but a control mutation with 10% frequency could stochastically expand to 40% frequency; subtraction in this case retains 30% frequency which is undesirable when we know by the binomial procedure that the 40% treatment mutation is likely explained by the 10% control mutation. We refer the interested reader to the Supplementary Discussion for more in-depth reasoning about this correction step, and provide empirical evidence supporting the existence of the binomial sampling process that we assume here.
2. Filter treatment mutations that can be explained by control mutations. We determine the probability of treatment mutations occurring from a binomial distribution parameterized by the observed mutation frequency in the control population and filter mutations at FDR = 0.05.
3. For mutations occurring in both control and treatment conditions, subtract control frequencies from treatment frequencies.
4. Filter treatment mutations that can be explained by Illumina sequencing errors. We determine the probability of treatment mutations under a binomial distribution parameterized by the lowest quality (>Q30) sequencing call at that position and filter at FDR = 0.05. The empirical determined lowest quality is often Q32 or Q36, which correspond to error thresholds of 6e-4 and 2e-4 respectively.
5. Filter treatment mutations that can be explained by batch effects (comparing treatment versus treatment). We calculate summary statistics of the mean mutation rate across all target site with a given substrate nucleotide at a particular position to another nucleotide, yielding an Lx12 matrix for each condition, where L = 55, 56, or 61. We then perform one-way ANOVA using the batches defined on the first slide and filter mutations at Bonferroni-corrected p-value threshold of 0.005.
6. Identify treatment mutations that are consistent by editor across conditions, especially rare ones, while filtering background mutations (comparing treatment versus treatment). On the batch-effect-corrected Lx12 matrix per condition, group by editors, calculate normalized rankings of each mutation within each condition. Perform robust rank aggregation on each mutation to obtain an upper bound on the p-value.
Based on the above analysis, we empirically defined editing profiles for denoising and filtering base editing outcomes. To ensure high sensitivity, we designed these profiles to be broad to minimize the possibility of excluding reads with legitimate base editing activity. For CBEs, we defined base editing activity as C to A, G, or T at positions −9 to 20 and G to A or C at positions −9 to 5. For ABEs, base editing activity was defined as A to G at positions −5 to 20, A to C or T at positions 1 to 10, and C to G or T at positions 1 to 10. For all analysis in this work that required tabulating reads with base editing activity, we discarded reads that did not have base editing activity according to these broad profiles.
Selection of Variants from Disease Databases
Disease variants were selected from the NCBI ClinVar database and the Human Gene Mutation Database (HGMD) for computational screening and subsequent experimental correction using versions of both database that were up to date as of September of 2018. Variants from ClinVar that were designated by at least one lab as ‘pathogenic’ or ‘likely pathogenic’ were retained. Variants from HGMD with a disease association of ‘DM’ or disease-causing mutation were retained.
SpCas9 gRNAs were enumerated for each disease allele. Using a previous version of BE-Hive, predicted correction precisions were predicted for each gRNA-allele combination and used to prioritize the design of libraries. Two libraries of 12,000 gRNA-target pairs were designed called ‘AtoG’ and ‘CtoT’. The ‘AtoG’ library contained 11,585 unique pathogenic variants while ‘CtoT’ contained 7,444 unique pathogenic variants. A third library ‘CtoGA’ with 3,800 gRNA-target pairs targeting pathogenic variants was designed with 2,668 unique pathogenic variants.
Quantifying the Ratio of Base Editing to Indel Activity
Target sites with greater than 1000 reads and with at least one indel read were retained (to avoid division by zero). Notably, no pseudocounts were used. To calculate BE:indel ratios, library target sites without a substrate nucleotide within the typical base editing window were filtered. These target sites resulted from our library design choices that prioritized diversity and exploration, but these target sites are unlikely to be selected for editing in common user applications. The geometric mean was selected as a summary statistic because BE:indel ratios were distributed roughly log-normal, and the statistic summarizes more of the data than the median.
Adjusting for Noise in 1-bp Indels
To characterize rare indels from base editing outcomes, we used endogenous data (with large sequencing depth, in HEK293T cells) and designed certain library conditions (with high editing efficiency and deep sequencing coverage) as gold standards to denoise the other library datasets. In both endogenous data and gold-standard library conditions, we observed the fraction of 1-bp indels to be 5–30% of all indels. In contrast, in many treatment library conditions, the fraction was as high as 80–95%, similar to those in untreated library controls. In addition, these background 1-bp indels appeared to occur nearly uniformly across the target site, while in the “gold standard” conditions, 1-bp indels are concentrated near the HnH nick and typical base editing window. Based on these sets of observations, we reasoned that our conservative adjustment of treatment conditions by control conditions (by subtracting the frequency of indels at matching target sites, with matching indel start position and length) did not completely adjust noise from treatment data. To enable a more accurate calculation of base editing to indel ratios, we applied an additional quality control step where the frequencies of 1-bp indels in library target sites were decreased uniformly such that the global (across the entire library of sequence contexts) frequency of 1-bp indels was at most 30% of all indels.
Adjusting for Batch Effects in Base Editing to Indel Ratios
We observed some batch effects in calculated BE:indel ratios. To adjust for batch effects, we applied two-way ANOVA, crossing experimental batch with base editor, on the geometric mean BE:indel ratio for all library experiments. We note that by our experimental protocol, batch must be distinct for each combination of cell-type and library. For this analysis, we binned all point mutants of base editors with their wild-type versions since we observed small differences in BE:indel ratios that were dominated by differences by experimental batch and by base editor. The average coefficient across all experimental batches was added to the learned coefficient for each base editor to obtain a batch-adjusted coefficient for each base editor. An adjustment factor was obtained as the difference between the average geometric mean BE:indel ratio across experiments for a given base editor and the batch-adjusted coefficient for that base editor. Adjustment factors were used to adjust the BE:indel ratio at individual target sites for analysis requiring such resolution.
Definition of Disequilibrium Score
Disequilibrium scores are calculated for a given pair of substrate nucleotides as the ratio between the observed joint editing probability and the probability of both nucleotides being edited together assuming statistical independence. Calculating a valid log disequilibrium score from observed data requires non-zero frequencies for p(first nucleotide is edited), p(second nucleotide is edited), and p(first and second nucleotide are edited). Disequilibrium score values above one indicate a tendency for both or neither to be edited together (positive log disequilibrium score), while values below one indicate a tendency for only one or the other to be edited (negative log disequilibrium score).
Design of VUS libraries
We propose that base editing could be used to interrogate the function of single-nucleotide variants of unknown significance (VUS) in high throughput. VUSs are common – over half of variants in the Clinvar database are annotated with uncertain or unknown clinical significance (241,068 out of 475,172 variants, or 50.7%; Landrum et al., 2014) and systematic high-throughput analysis of such variants may help to elucidate their potential function. To assist in the development of novel genome-wide assays to study the function of variants of unknown significance using high-throughput base editing approaches, we used BE-Hive to design libraries of SpCas9 and Cas9-NG sgRNAs with maximum predicted frequency of installing 97,465 C-to-T VUSs with BE4 and eA3A and 46,358 A-to-G VUSs with ABE. These designed libraries are provided as Tables S5–7 and summary statistics are depicted in Figures S7H–K. We used efficiency and bystander models trained on data from HEK293T cells and calculated installation frequency across a range of experimental conditions with varying mean base editing efficiencies.
Without BE-Hive, an obvious library design rule would be to choose sgRNAs that place each VUS as close to the center of the base editing window (typically, protospacer position 6) as possible. We used BE-Hive to characterize the variation in predicted precision and installation frequency for this baseline library design and compared the predicted properties of this baseline design to libraries designed using BE-Hive.
Libraries designed with BE-Hive had improved predicted VUS installation frequencies: across the three base editors, we observed 8.5% to 11.9% of VUS had improved predicted installation frequency when using BE-Hive to design libraries of SpCas9 sgRNAs, and only 0–1 VUSs had decreased predicted installation frequency. Improvements were greater when designing libraries of Cas9-NG sgRNAs, with 22.8% to 28.3% of VUSs representing 9,798 to 26,104 unique VUSs with improved predicted installation frequency, and only 0 to 2 VUSs with decreased installation frequency (Figure S7H–K). This observation reflects that as PAM specificities broaden, there are more candidate sgRNAs to install any particular VUS, and optimizing the choice of sgRNA becomes more important. We therefore anticipate that BE-Hive will tend to increase in usefulness over time as PAMs become less of a restriction for base editing.
We observed that most VUSs are predicted to be installed with low frequency: under hypothetical conditions with a mean base editing efficiency of 30%, over half (55% to 72%) of VUSs were predicted to be installed at less than 10% frequency among sequenced reads. Thus, prioritizing VUSs to study using methods like BE-Hive is important. Compared to the baseline library design, libraries designed with BE-Hive contain 12% to 24% more VUSs (644 to 1,031 VUSs) predicted to be installed at >50% frequency among sequenced reads. Taken together, BE-Hive optimizes the design of sgRNA libraries for high-throughput base editing screens.
Deaminase and Sequence Context Affect Editing of Proximal Substrate Nucleotides
Deaminase enzymes and base editors have been described as having varying degrees of processivity, the ability to sequentially catalyze multiple base conversions without releasing the target DNA (Gaudelli et al., 2017; Komor et al., 2016a; Love et al., 2012; Nishida et al., 2016; Pham et al., 2003). rAPOBEC1 CBEs such as BE4 and ABE base editors have been described as processive, while CDA-BE4 and eA3A-BE4 are thought not to be processive. Base editing processivity may be reflected in equilibrium scores, the ratio between observed frequency of two substrate nucleotides in a single substrate both being editing and the expected frequency of both nucleotides being edited together assuming statistical independence. Values above one indicate a preference for editing both or neither nucleotide over having only one or the other edited, consistent with processive base editing. We calculated disequilibrium scores for the eight CBEs and ABEs using data from 614 to 4,796 pairs of substrate nucleotides in the editing windows of 390 to 1,413 target sequences in the comprehensive context library.
From this analysis, we observed disequilibrium scores of 1.04 to 1.23 across all CBEs, and 0.86 for ABE and 0.73 ABE-CP on average, Figure 3F and S6C–D), contrary to prior observations demonstrating positive processivity of late-stage evolved ABEs (Gaudelli et al., 2017). We note that disequilibrium scores calculated in this manner are unavoidably confounded by local sequence context preferences, such as ABEs dislike of AA contexts. While this model predicts that the disequilibrium scores for ABEs should increase for non-sequential adenines, we observed only low levels of disequilibrium score increase for ABE and ABE-CP at substrate nucleotides spaced more than one nucleotide apart.
Interestingly, we found that sequence context contributes more strongly to disequilibrium scores than the choice of deaminase. Many pairs of substrate nucleotides were observed with disequilibrium scores both >1 and <1 among different tested base editors. Among CBEs, eA3A-BE4 was particularly susceptible to sequence context, and demonstrated the greatest disequilibrium score of narrow-window editors in a sequence-dependent manner. We observed mild to no change in disequilibrium score for most base editors as the substrate nucleotide pair distance varied from 1 to 8 bp apart.
Together, these data demonstrate that processive action of base editor deaminases at on-target sites, measured as joint editing probability, are a combined function of deaminase enzyme, activity range, and sequence context.
Bystander model performance with additional training data
As the bystander model is trained on only a subset of the comprehensive context library sites, we asked whether an increase in training data and data from our other libraries could further improve performance. We investigated this by training new models using a combination of data from the characterization library and a subset of the SNV library, and evaluated these “CL+SNVL models” against the standard “CL models” trained only on the characterization library, on a subset of the SNV library data that was held out for both CL+SNVL models and CL models. Using data for each base editor in mES cells, we used the original characterization library dataset and randomly split the ABE and CBE precision editing SNV libraries into a training set and held-out test set at a ratio of 50:50. As before, we used 10% of the characterization library as a validation set for early stopping during training.
| Mean bystander pattern test performance (Pearson’s R) | Correction precision test performance (Pearson’s R) | |||
|---|---|---|---|---|
| Base editor | CL only | CL+SNVL | CL only | CL+SNVL |
| ABE | 0.9281 | 0.9284* | 0.9208 | 0.9223* |
| ABE-CP1040 | 0.8768 | 0.8831* | 0.8452 | 0.8585* |
| BE4 | 0.8750 | 0.8841* | 0.9160 | 0.9204* |
| BE4-CP1028 | 0.6142 | 0.6261* | 0.7828* | 0.7771 |
| eA3A-BE4 | 0.8581* | 0.8568 | 0.8820 | 0.8835* |
| evoA-BE4 | 0.8330 | 0.8382* | 0.8761 | 0.8776* |
Best-in-class performance.
We observed that the CL+SNVL training set consistently increased performance for five out of six base editors evaluated on two tasks: predicting bystander pattern frequencies, and predicting correction precisions of held-out disease-related sequence contexts. However, the improvements were slim, which is consistent with the design of the characterization library as a minimally biased dataset with a large diversity of sequence contexts. Overall, these results demonstrate diminishing returns when subsetting the characterization library data, and strongly suggest that model performance is not primarily limited by dataset size.
We collectively named the editing efficiency and bystander editing models “BE-Hive” freely accessible at https://crisprbehive.design. Using target sequence as input alone, BE-Hive estimates base editing efficiency and outcomes at the single-nucleotide and coding-level. BE-Hive represents the first tool for designing base editing experiments that comprehensively considers on-target editing efficiency, deaminase and sequence related preferences for various editing outcomes, and the likelihood of bystander edits to distinguish targets that are amenable to high-precision single-nucleotide editing and coding-sequence correction using a variety of established base editors (Figure 3G).
Predicting Base Editing Outcomes of Cas Domain Variants
Base editor variants that use Cas protein components other than SpCas9 have greatly expanded the targeting scope of base editing by enabling the installation of point mutations at a greater number of sites (Rees and Liu, 2018). Base editing activity is a function of deaminase activity including sequence context preferences and bystander editing behavior, and of Cas protein properties that affect editing window position and target site PAM compatibility. We reasoned that deaminase-specific base editing activity learned by BE-Hive should generalize to other Cas variants, while Cas9-specific activity may vary. We thus sought to distinguish Cas9-specific base editing activity from deaminase activity and evaluate which factors BE-Hive has learned.
We observed that learned BE sequence motif models (Figure S5F) resemble a combination of each editor’s single-nucleotide sequence motif and activity window combined with previously identified sgRNA-related sequence determinants of Cas9 editing efficiency. We observed a preference for purines at position 20 related to sgRNA loading into Cas9 (Wang et al., 2014) and for G at position 0, indicating that 21 nt spacers that were extended with a 5’ G for the purpose of efficient U6 promoter expression enable more efficient editing when all 21 nucleotides are complementary to the target than when the prepended 5’ G is a mismatch, similar to observations in high-fidelity Cas9-variants (Kim et al., 2017a; Kleinstiver et al., 2016). We observe other characteristics of SpCas9 activity sequence dependence, including a dislike for G and T nucleotides in the seed region of the sgRNA (Doench et al., 2016). The sequence composition of the non-seed region of the sgRNA, in particular between positions 4–8 which are commonly the center of the base editing window, is reported to have little impact on Cas9 activity. In the context of base editing, we observe a strong preference for target nucleotides A and C for adenine and cytosine base editors and their respective dinucleotide preferences here as anticipated, that dominating base editor efficiency motifs overall. Thus, the activity of base editors predominantly depends on the availability of target nucleotides in the editing window, and secondarily on deaminase dinucleotide preferences within the window and known Cas9 sequence dependencies in the surrounding sgRNA context.
Next, we investigated whether our SpCas9-BE4 bystander model accurately predicts base editing outcomes of base editors with other Cas protein components, including LbCas12a-BE3, enAsCas12a-BE3 (Kleinstiver et al., 2019), and SaCas9-BE3 (Kim et al., 2017). Kleinstiver et al., 2019 provided deep sequencing data from eight endogenous sgRNA-target loci pairs and observed peak base editing frequencies around protospacer positions 9–13, with some edits extending as far as positions 6 to 18. The window size of peak base editing activity of these Cas12a variants is similar to that of BE4, but shifted in protospacer position. We first evaluated BE-Hive’s performance when controlling for editing window shift, parameterized as a protospacer offset. For example, to relate the empirical window of Cas12a at positions 9–13 to SpCas9’s window around positions 5–9, the Cas12a protospacer would be offset by +4 nucleotides to obtain a hypothetical Cas9 protospacer for input to BE-Hive. We ran BE-Hive with protospacer offsets ranging from −1 to +9 nucleotides and selected the best performing protospacer offset for each target site. The resulting median Pearson correlation between observed and predicted bystander editing pattern frequencies when controlling for editing window shift was 0.76 across both LbCas12a and enAsCas12a. BE-Hive, trained on SpCas9 base editors thus retains strong performance when predicting base editor deaminase activity for Cas12a variants.
We observed that the optimal protospacer offset varied substantially across target sites. At one site, Cas12a edited protospacer position 18 most frequently, suggesting an optimal protospacer offset of +12. At another site, Cas12a editing spans multiple Cs in a 10-nucleotide range from protospacer positions 10 to 20, suggesting a protospacer offset of +9, or alternatively that Cas12a-BE3 has a widened window compared to Cas9-BE4. Other target sites had maximal base editing activity at positions 9 and 10, consistent with a +3 or +4 offset. The single best protospacer offset for LbCas12a across eight target sites was +3 with a median Pearson correlation of 0.72, while the single best protospacer offset for enAsCas12a across eight target sites was +6 with a median Pearson correlation of 0.44 (Figure S6E). We note that an offset of +4 was also effective for enAsCas12a. Taken together, we recommend a protospacer offset of +3 or +4 for Cas12a variants to adjust for window shift. We further compared BE-Hive to SaCas9-BE3 at 13 endogenous sgRNA-target pairs from deep sequencing data provided by Kim et al., Nat Biotech 2017. We observed that controlling for window shift for each target site yielded a median Pearson correlation of 0.94 between observed and predicted bystander editing pattern frequencies. Across target sites, the best protospacer offset was +1 with a median Pearson correlation of 0.81 (Figure S6F). Comparison of predictions to observations at specific loci revealed lower performance at some target sites where cytosines beyond protospacer position 10 were edited more frequently by SaCas9-BE3 than predicted by SpCas9-BE4. Collectively, we conclude that BE-Hive retains strong performance at predicting SaCas9-BE3 and recommend a protospacer offset of +1 for SaCas9-BE3.
We note that comparison of BE-Hive predictions to these outcome data suggest that Cas domains may additionally affect differences in window size and other higher-order factors. Further illuminating these differences may strengthen bystander editing predictions for base editors with Cas protein components other than SpCas9.
Additional Details: Characterization of Indels Resulting from Base Editing
To date, indels resulting from base editing activity have remained poorly characterized. During cytosine base editing, rare indels may result from DNA nicking by the HNH nuclease domain on the protospacer-bound DNA strand and abasic site generation at deaminated cytosines through UNG-mediated excision of uracil, which can convert to a DNA strand break spontaneously or during base excision repair. During adenine base editing, deoxyinosine can be recognized by enzymes such as alkyl-adenine DNA glycosylase (AAG) and excised to facilitate base excision repair (Lau et al., 2000), although, AAG has been reported to have little activity on ssDNA (Hitchcock et al., 2004; Saparbaev and Laval, 1994). ABE-mediated adenine deamination products therefore may convert to abasic sites less frequently than CBE deamination products, which may explain why indels occur less frequently than in cytosine base editing (Gaudelli et al., 2017).
In order to sensitively identify indel activity, we surveyed data at a subset of target sequences (N > 19,925) per editor in HEK293T cells, U2OS cells, and mESC cells with high read count, and adjusted for batch effects with two-way ANOVA. In untreated library cells we observed 1-bp variations from designed sequences, presumably attributable to errors in synthesis, PCR amplification, and HTS. We correct for this noise by comparing treatment library data to untreated library data and data from endogenous contexts (STAR methods, Figure S4B–D). Among cell types, we observed a 1.2-fold increase in BE:indel ratio in HEK293T cells, and 2.1-fold increase in U2OS cells relative to mESCs, although neither of these differences were statistically significant (Figure S5C). These results suggest a minor role for cell type differences in affecting the ratio of BE:indel outcomes.
Wide-window editors induced indels at a lower relative frequency than narrow-window editors in both CBEs and ABEs (Figure 2G and S4B). We detected an average geometric mean BE:indel ratio of 129:1 for ABE and 37:1 in narrow-window CBEs, and 166:1 for ABE-CP and 46:1 in wide-window CBEs, representing typical indel frequencies of 0.2% and 0.5% in ABEs and CBEs, respectively. We observed a weak relationship between target sequence and frequency of indels resulting from base editing reflected by low replicate consistency of BE:indel ratios at matched target sites (IQR R = 0.13 to 0.29 across editors in mES cells, P < 3.8×10⁻³). Overall, our comprehensive characterization of BE:indel ratios confirmed the rarity of undesired indel events by base editors.
Our indel outcome analysis revealed a characteristic profile of indels that result from base editing. Deletions resulting from cytosine base editing were most frequently centered around the PAM-proximal Cas9 HNH domain’s nick locations preceding position 18, the PAM-distal deamination peak position for a given editor (often position 6), or spanning these two sites resulting in a peak in outcome frequency at ~ 12 bp deletions (Figure 2E and S5A), consistent with our understanding of the processes that give rise to indel events. However, the peak position of PAM-distal deletions that arise from deamination events did not always mirror the distribution of deamination activity in the editing window of all editors. While the BE4-CP editing window ranges from position 2–15 with peak editing at the central position 8, indels resulting from cytosine deamination were offset towards the PAM. Interestingly, cytosine transversion mutations induced by BE4-CP are likewise shifted in their location towards the pAm (Figure 1B), consistent with a model in which both indel formation and C•G-to-G•C and C•G-to-A•T mutations arise from repair of abasic lesions following uracil excision. The rare insertion outcomes from base editing are distinct from typical Cas9 nuclease-induced insertion products (Shen et al., 2018). Base editor-mediated insertions occurred primarily at the Cas9 HNH nick for both ABEs and CBEs, and were separable into three classes that occurred at approximately equal frequency: first, duplications of a single nucleotide, comprising 25–35% of insertions; second, a single repeat of two or more nucleotides from the native sequence context at 33–34%; and third, insertions of two or more nucleotides that do not correspond to duplications of the native sequence context, comprising 30–36% of insertions (Figure 2F and S5B). In Cas9-genome editing, insertion genotypes are heavily dominated by 1-bp insertion products that are frequently a duplication of the nucleotide immediately 5’ of the double-strand break (DSB) site (Allen et al., 2019; Shen et al., 2018). Base editor-induced insertions appeared to be consistent with Cas9-nuclease insertion mutations in that they often duplicate the sequence 5’ of the HNH nick, though more typically consist of longer duplicated regions. Cas9 DSB-mediated 1-bp insertions are thought to arise from occasional staggered cutting which causes a 3’-overhang that is filled in by DNA-polymerase and ligated by non-homologous end joining (Lemos et al., 2018; Richardson et al., 2016; Shou et al., 2018; Zuo and Liu, 2016). Although this same mechanism cannot explain insertions that arise from base editing, it is tempting to speculate that longer 3’-overhangs resulting from base editing-induced abasic lesions and hNh nick activity may similarly contribute to insertion outcomes.
Cytosine transversion outcomes of base editing also arise from UNG-mediated abasic sites and were enriched at RCTA motifs (Figure 2C and S4A); however, we did not observe strong sequence determinants of indels that result from base editing. We trained sequence motifs to predict BE:indel ratios from target sequences and identified a minor association of indels with adenine and thymine relative to cytosine and guanine (Figure S5D). Overall these motifs performed weakly, explaining only 1–7% of the variation in BE:indel ratios in held-out sequences (P < 7.0×10⁻³¹). Indels resulting from base editing may also depend on the Cas9 component. We noted a mild improvement in BE:indel ratio by base editing with NG-fused eA3A-BE4 overall (45:1), relative to eA3A-BE4 (43:1). The engineered Cas9-NG is reported to have lower activity than wild-type SpCas9 protein, similar to high-fidelity Cas9 variants that have reduced binding strength relative to wild-type Cas9, which may underlie this variability (Nishimasu et al., 2018).
These analyses provide the first comprehensive characterization of indels that result from base editing. We confirmed the relative rarity of indels resulting from base editing by ABEs and CBEs and observed a minimal role for cell type, sequence context, and Cas9 component in determining their frequency. We discovered a characteristic profile of indels that result from base editing that is consistent with a model based on HNH-nicking and abasic site generation following deamination. Collectively, our findings suggest that rare base editor-induced indels may arise through similar, yet distinct mechanisms from Cas9 nuclease-induced indels.
Additional Details: Model-Guided Design for Precise Base Editing Correction of Pathogenic Alleles
Optimal base editor choice for induction of a desired edit depends on sequence preferences and base editor position with respect to the substrate nucleotide. An increase in the number of editable nucleotides exponentially expands the combinatorial space of potential outcomes at a given target, further complicating experimental design for precision editing applications. Across the six CBEs and two ABEs tested here, BE-Hive performed strongly with a median R = 0.86–0.99 on 606 or more held-out target sequences (Figure 3E). We observed mild reductions in performance with increasing numbers of proximal substrate nucleotides and editor window size, achieving a median R = 0.98 and R = 0.90 at held-out target sites with two and five substrate nucleotides in positions 1–12, respectively (Figure 4B and S6A).
We investigated the ways in which sequence composition affects single-nucleotide editing precision of ABEs and CBEs by considering subsets of SNP alleles in which we controlled for the number and position of substrate nucleotides in the editing window. For example, we investigated BE4 editing activity at 31 disease-related SNPs with a fixed cytosine at positions 3 and 5 with no other cytosines (IUPAC code D) in positions 2–10 (C3 and C5 mask) and observed a large amount of variation in single-nucleotide correction precision ranging from 5.6% to 93%, as predicted by BE-Hive (R = 0.94, Figure 4E). ABE demonstrated similar variability; for example, in editing of 136 disease-related alleles in the ABE precision editing SNP library in mES cells masked on A6 and A8, we observed single-nucleotide correction precision ranging from 0% to 99%, as predicted by BE-Hive (R = 0.71, Figure 4F). These analyses affirm that single-nucleotide precision is factor to more than the number and activity window position of substrate nucleotides. Sequence determinants that may appear relatively weak at single substrate nucleotides can combine into stronger sequence determinants when considering combinations of editing events.
Differences in base editor sequence preference result in variability in precision editing of target sites with multiple substrates (Figure 4G–H). To illustrate this, we compared eA3A-BE4 and BE4 editing in the CBE precision editing SNP library in mES cells at two C7 SNP alleles – one for tetrameric protein transthyretin gene (TTR) involved in transthyretin amyloidosis (OMIM 105210), and one in the transmembrane protein 127 gene (TMEM127) related to pheochromocytoma (OMIM 171300) – where C4 and C7 are the only cytosines among positions 2–10. We observed single-nucleotide correction precision of 74% in TTR and 16% at TMEM127 by BE4 editing, while eA3A-BE4 corrected both alleles at 91% and 90% precision, respectively. BE4’s relative dislike of the GC motif at C4 compared to the AC motif at C7 may explain the high precision achieved in TTR editing and the lower precision in TMEM127 where both target and bystander nucleotide share the disfavored GC motif, however, eA3A-BE4 disfavors both these dinucleotide motifs equally and induced high precision edits in both alleles. The variability in precision editing is therefore dependent, but not fully explained by the deaminase dinucleotide preferences described in the literature, but is accurately captured by BE-Hive (R = 0.96). While C4 and C7 both lie within the canonical editing window of eA3A-BE4, the average editing efficiency at position 7 is nearly double that of position 4. This finding agrees with, though is disproportionate to the heavy bias for precise editing of C7 in both TTR and TMEM.
Moreover, we observed vastly different editing precision outcomes even at sites with identical dinucleotide motifs and substrate position. In the myosin heavy chain beta gene (MYH7) SNP allele related to cardiac disease (Tajsharghi et al., 2003), and the glutamate ionotropic receptor NMDA type subunit 2B gene (GRIN2B) sNp allele related to a number of neurodevelopmental disorders (Hu et al., 2016), the target cytosine at position 7 lies within the disfavored AC context and the position 4 bystander cytosine is preceded by T, yet editing precision of C7 varied from 28% at MYH7 to 0% at GRIN2B. These data suggest that precision base editing relies on a complex relationship between the position of target and bystander nucleotides and base editor sequence preference that is not easily interpreted from window and dinucleotide preference alone.
In some cases, optimal base editor choice can even be counterintuitive. For example, at three targets with a pathogenic SNP at positions C5 or C7 – the fibroblast growth factor receptor 1 gene (FGFR1) underlying Kallman syndrome (Dodé et al., 2003), the growth differentiation factor 1 gene (GDF1) related to congenital heart defects (OMIM 613854), and in the polycystin 1 gene (PKD1) related to polycystic kidney disease – BE4-CP had higher genotype correction precision than any other CBE, even when additional cytosines were present within its wide editing window. Bystander mutations at on-target sites can also be innocuous – for example when they induce a silent mutation in a protein-coding gene, which is estimated to occur with 47% probability for CBEs with a 5-nt window and 38% for ABEs with a 4-nt window (Rees and Liu, 2018) – or deleterious if they introduce unwanted functional changes in protein coding or regulatory regions. We added functionality to BE-Hive to predict changes to amino acid sequences following base editing to help further distinguish favored from unfavored edited outcomes (Figure 3A and G).
Additional Details: Sequence Features Partially Determine Rare CBE-Outcomes
The occurrence of rare base editing outcomes varies by base editor, cell type, and target site. Both cytosine transversion byproducts and indels that result from CBEs are thought to arise from abasic lesions induced by UNG (Komor et al., 2016a). The sequence motif describing uracil excision from double-stranded DNA (dsDNA) by UNG-family members in vitro is approximated as WCAW, and in the context of somatic hypermutation (SHM) UNG demonstrates a preference for inducing transversions at deaminated WGCT and transitions at WACT motifs (Pérez-Durán et al., 2012). These motifs differ substantially from the RCTA motif observed in our analysis to enrich for cytosine transversion events (Figure 2C and S4A). Thus, native UNG preferences are weak predictors of cytosine transversion outcomes that result from CBE editing. We sought to assess the contribution of sequence context in determining specific CBE-mediated cytosine conversion to G and A, its potential utility in editing disease-relevant SNVs, and the ability of BE-Hive to accurately predict these events. We found that while an RCTA motif (test R = 0.63) is predictive of C•G-to-G•C conversion, a looser and weaker RC motif (test R = 0.39) is predicted to predispose sites to C•G-to-A•T outcomes (Figure 5A). These findings suggest that sequence features not only affect the ratio of CBE-mediated cytosine transition versus transversion outcomes but may also determine the specific transversion product. We experimentally assess the significance of these sequence features using a library of 3,400 sgRNA-target pairs predicted to induce 8.5%–78% precise single-nucleotide C•G-to-G•C conversion, and 400 sgRNA-target pairs to induce 5.9%–30% C•G-to-A•T conversion among edited outcomes by eA3A-BE4 and eA3A-BE4-NG editing, which we collectively named the “transversion-enriched sNv library”. For technical reasons, the library contained 35-nt and 61-nt target sites, but base editing outcomes were highly consistent between target sites of differing length that represented the same sequence contexts (median R = 0.96; Figure S7C). We observed higher cytosine transversion purity in mES cells in this library, averaging 25% by eA3A-BE4-NG, compared to 12% by eA3A-BE4 in the comprehensive context library (P = 2.7×10−93, Welch’s T-test, N = 2,440 versus 5,282 substrate nucleotides; Figure 5B) and compared to approximately 3% on average across all other CBEs tested (Figure 1B). These results indicate that BE-Hive learned sequence features that determine cytosine transversion outcomes of cytosine base editing.
We explored whether CBE-mediated cytosine transversions co-segregate with indels and observed no meaningful relationship between cytosine transversion purity and BE:indel ratio by eA3A-BE4-NG editing (R = −0.02, P = 0.2, N = 4,320 target sites; Figure 5C). These data suggest that sequence contexts with enriched transversion product purities enrich for specific resolution of abasic intermediates towards transversion edits, rather than merely increasing abasic site formation by promoting base excision that would increase the frequency of both outcomes.
Taken together, these data establish the importance of sequence context in determining both the frequency and the identity of repair products that arise from abasic intermediates of cytosine base editing. Target sequences predicted by BE-Hive greatly enriched C•G-to-G•C and C•G-to-A•T outcomes from cytosine base editing of disease-associated alleles without increasing indels. The processed base editing outcome data including correction precisions are reported in Table S4.
Additional Details: Deaminase Enzymes Partially Determine Rare CBE Repair Outcomes
While indels and transversions have previously been noted as byproducts of CBE editing, factors that determine their frequency have not been investigated beyond the fusion of UGI and Mu Gam to diminish these outcomes (Komor et al., 2016b, 2017; Nishida et al., 2016). Analyses of the comprehensive context library revealed that these rare outcomes varied somewhat by cell type. The purity of cytosine transversions resulting from CBE editing was elevated in mESCs compared to HEK293T and U2OS (mean of 2.8–16% of edited reads across CBEs in mESCs, compared to 2.6–9.5% in HEK293T and 1.6–7.7% in U2OS) and was accompanied by a slight increase in indels (1.3-fold and 2.1-fold relative to HEK293T and U2OS, respectively). In somatic hypermutation, the translesion synthesis (TLS) polymerase REV1 facilitates deoxycytidine installment opposite deoxyuridine and abasic residues that follow from AID cytosine deamination (Jansen et al., 2006), yet comparative transcriptomics analysis in the Cancer DepMap (https://depmap.org/portal/depmap/) reveals similar REV1 expression in HEKTE and U2OS cell types (Barretina et al., 2012) which is also comparable to Rev1 expression in mES cell types reported in ENCODE (Parkhomchuk et al., 2009). Thus, C•G-to-G•C purity observed in the comprehensive context library does not clearly correlate to REV1 expression. Similarly, we do not observe significant differences in C•G-to-G•C purity in HEK293T cell lines with modified REV1 expression (Figure S7B). Instead, the difference in frequency of cytosine transversion outcomes may in part be explained by elevated UNG in mESCs, which facilitates deoxyuracil excision to create an abasic site (Wu et al., 2013) that is an intermediate of transversion and indel formation.
Aside from cell type differences, cytosine product purities were also dependent on the CBE’s cytidine deaminase. Targets with multiple editable cytosines were previously noted to yield C•G-to-TÂ edits with greater purity than targets with only a single editable cytosine (Komor et al., 2017), which predominantly relates to CBE window. Indeed, our base editor sequence-activity analysis confirmed that wide-window CBEs tended to have higher C•G-to-TÂ product purities (Spearman r = −0.81, P = 0.05, N = 6 CBEs), yet, activity window size alone did not explain the variance in the frequency of rare outcomes among CBEs.
We investigated additional factors that may affect CBE product purity, and found that rare outcomes of cytosine base editing appear non-uniform among fused deaminase components. Transversion outcomes occurred at 4-fold higher frequency following eA3A-BE4 editing compared all other CBEs tested (approximately 12% compared to 3% average, respectively; Figure 1B), and C•G-to-G•C outcomes were enriched relative to C•G-to-A•T conversion (~ 3:1 for eA3A, compared to ~ 3:2 mean for remaining CBEs). Editors that display the lowest frequency of cytosine transversion mutations include the narrow-window editor evoA-BE4 and the wide-window editor CDA-BE4 (Figure 1B); however, these editors also displayed the lowest BE:indel ratios of their window classes (32:1 and 39:1 respectively, Figure 2G). These findings strongly suggest that the deaminase components of CBEs not only create uracil products, but also play an additional, previously unrecognized role in the partitioning of outcomes that result from U•G mismatch repair.
Additional Details: Adjusting Treatment Mutation Frequencies by Control Mutations
For this study, we designed experiments to ensure that we could identify the quality of our data with maximum accuracy by collecting biological replicates of each treatment condition and also collecting untreated control data of the genome-integrated libraries. We reasoned that mutations may occur in untreated control data from DNA synthesis, PCR errors, spontaneous cellular mutations (expected to be extremely rare), and DNA sequencing errors (which we controlled for at earlier steps in data processing by filtering reads by PHRED quality; STAR Methods). Our experimental protocol first transfects library constructs into cells and selects for successful genomic integration, where selection kills ~95% of cells. At this step libraries can be sequenced to obtain untreated control data. We obtain treatment data by taking these cells and transfecting base editor constructs and selecting for successful uptake, where this second selection step also kills ~95% of cells. Overall, untreated control conditions undergo one selection step, and treatment conditions have an additional selection step.
Our study used three oligonucleotide libraries with 12,000 oligonucleotides of 56-nt or 61-nt target sites, and one library with 4,000 oligonucleotides of 35-nt target sites. A mutation is a substitution at a particular target site at a particular position. Thus, for our characterization library, there are 56*12,000 = 672,000 possible positions for a mutation to occur. In aggregate across untreated libraries conditions, we observed a median frequency of 0.09% (mean = 0.4%) of positions that had >5% frequency control mutations. This observation highlights that this noise impacts a tiny fraction of all target sites and reads.
Despite their rarity, we reasoned from first principles that our data might benefit (however incrementally) by addressing these mutations. Consider a single mutation with frequency p in control data. Its frequency in n samples follows a binomial model with variance = p*(1−p)/n. When n is reduced by 95% from a selection step, the relative variance thus increases by 20x. Similarly, as p increases, the variance also increases: the variance is 18x higher when p = 10% compared to when p = 0.5%.
A standard approach for adjusting treatment mutation frequencies by control mutation frequencies is to subtract the control mutation frequency from the treatment mutation frequency and setting it to 0% if the result is negative. This approach works well when p is very low; the treatment mutation frequency is sampled with relatively low variance and is thus expected to be quite close to the control mutation frequency. However, when p is high or the selection is highly stringent, variance is higher: when the control mutation frequency is 5%, the mutation frequency could expand to >50% in treatment data following selection, which will not be adjusted correctly by the subtraction approach. Of course, the average treatment mutation frequency is equal to p, so there is a large probability that the treatment mutation frequency will be less than 5% as well. However, in expectation over many independent control mutations, we will observe expansions with high probability.
We combine the standard subtraction approach with a second denoising approach to handle the case when the control mutation frequency is high. We set 5% as a threshold to distinguish high-variance vs low-variance mutations. Below 5%, we apply the subtraction method. Above 5%, we completely mask data at only that position in all treatment conditions. Notably, neither correction strategy filters any reads.
Importantly, we did not observe any notable enrichment of control mutations at substrate nucleotides in the canonical base editing window, which collectively constitute ~3% of all positions in the library (3% = 6 nt window * 12,000 target sites * (1/4 nucleotides that are substrates) divided by 56*12,000). We note that any collisions between the ~3% of substrate nucleotides and 0.1% of positions that were masked cannot introduce error into downstream data analysis including characterization of base editing windows, sequence preferences, and rare base editing outcomes, since sufficient supporting evidence for each is available by considering the vast majority of treatment substrate nucleotides (99.9%) that we confirmed to not coincide with a high frequency control mutation.
Lastly, we quantify the stochastic depletion and enrichment of control mutations following a single selection step by comparison to these mutation frequencies in treatment data. We show that high frequency control mutations deplete and enrich with higher variation than low frequency control mutations (see Table), consistent with the binomial model.
| Treatment mutation frequency | ||
|---|---|---|
| Control mutation frequency | Mean | Variance |
| 0% – 1% | 0.8% | 0.2% |
| 1% – 2% | 1.8% | 0.3% |
| 5% - 6% | 5.1% | 0.6% |
| 10% - 15% | 12% | 1.6% |
| 15% – 20% | 18% | 2.5% |
| 20% - 25% | 20% | 2.8% |
| 25% - 30% | 28% | 5.5% |
| 40% - 45% | 40% | 12% |
| 50% - 55% | 49% | 7.4% |
| 70% - 75% | 60% | 7.1% |
| 90% - 95% | 92% | 3.0% |
| 95% - 100% | 98% | 0.8% |
Notably, the consistency of stochastic enrichments and depletions with the binomial model confirms that mutations are not DNA sequencing errors but physically exist. In addition, we empirically observe that a single selection step is capable of enriching a small subset (0.18%) of control mutations from under 0.5% frequency to >5% frequency by comparing untreated library data to base editor treated and selected cells. Collectively, our observations suggest that rare >5% frequency mutations in untreated libraries arise from rare DNA synthesis errors or rare PCR errors (expected to occur approximately at <0.1% per nucleotide or lower) that are stochastically expanded by selection.
Modeling Design: Separation of Tasks
We describe three distinct model classes for two tasks: logistic regression (LR) for predicting base editing efficiency at any substrate nucleotide, gradient-boosted regression trees (GBTR) for predicting base editing efficiency at any substrate nucleotide, and a deep conditional autoregressive model (DCAR) for predicting bystander editing pattern frequencies among sequenced reads with at least one edit in any substrate nucleotide. The LR model is used to produce motifs for the figures, and the GBTR and DCAR models are the “production” models intended for research-quality design applications.
A key design decision is conceptually splitting the task of predicting base editing efficiency from predicting bystander patterns given that some edit occurred. These models are defined to yield a single end-to-end prediction pipeline: given an input target sequence, we can separately predict base editing efficiency (fraction of sequenced reads with any editing outcome) and the precision of a desired outcome among sequenced reads with any edit, and multiply these predictions to obtain a predicted fraction of sequenced reads with the desired edit. Within this framework, we report motifs for base editing efficiency at a single substrate nucleotide in Figure 2, which must come from “interpreting” one or both efficiency models. We chose to use simple logistic regression models to obtain interpretable motifs due to its simplicity for data visualization.
Why then do we conceptually split the task of predicting base editing efficiency from predicting bystander editing patterns? Doing so is equivalent to assuming that base editing efficiency is conditionally independent from bystander editing patterns given an input target sequence. We made this design decision for 1) computational convenience, and 2) from a biological understanding supported by strong empirical evidence that this conceptual split makes sense. From a computational perspective, we wish to design a machine learning model that, when trained on our specific dataset, learns generalizable rules of base editing that apply in other experimental conditions. While base editing outcomes in our dataset are determined by base editor and sequence context, base editing efficiency additionally relies on the independent experimental factors of cell type, cell state, and delivery mechanism that determine an arbitrary ceiling of editing efficiency for a base editor in that experiment. Average editing efficiency will therefore vary by user-specific experimental design decisions such as how the base editor is expressed that are unknowable to us.
Across our eight base editors, three human and mouse cell-types, and replicates, our mean editing efficiencies vary between 3% to 53% (Figure S1A), however, we only care to learn if for base editor B, target site A had above average editing efficiency, not specifically that target A had 30% efficiency against a mean of 20% in replicate 1, and 50% efficiency against a mean of 40% in replicate 2. By normalizing such data first before training a model to predict editing efficiency as is common practice in machine learning we are able to determine relative sgRNA efficiencies across datasets and we provide base editing efficiency models that can be translated to the scale of “fraction of sequenced reads with any editing” by using a user-specified scaling factor. We provide a Python package to learn these scaling factors given user-provided data at https://github.com/maxwshen/be_predict_efficiency. In general, we expand this philosophy by separating statistics that vary by unknowable experimental choices (such as editing efficiency) from properly normalized data that is most convenient for machine learning (such as normalized bystander editing patterns).
Empirically, we observe excellent replicate consistency in bystander editing pattern frequencies when we normalize for editing efficiencies (R ~ 0.95, Figure S6B), indicating that this normalization produces high-quality data for training machine learning models. Importantly, we observe excellent replicate consistency between replicate pairs of conditions that vary across a wide range of editing efficiencies, from 3% to 53% (Figure S1B). Thus, we conclude that bystander editing patterns are conditionally independent of editing efficiency at a given target sequence. We note that, in contrast, base editing efficiency has lower replicate consistency at around R ~ 0.50. This difference is consistent with the observation that the base editing efficiency models perform worse on their task (R ~ 0.70) than the bystander models perform on their task (R ~ 0.90). We reasoned that the task of predicting bystander editing pattern frequencies is the more difficult and important task, so it is prudent to normalize data to remove unrelated variation (such as in editing efficiency) to maximize data quality for this task.
Modeling Design: Considerations on Convolutional Networks
The bystander task demands a model whose input is a target DNA sequence and outputs a probability of each combination of base editing outcome at all substrate nucleotides in the target sequence. A primary challenge of the bystander task is solving the partition function in order to obtain element-wise probabilities in an exponentially sized space. While prior understandings of base editing may have motivated modeling approaches that consider only two outcomes per substrate nucleotide: edited or unedited, for example, T or C for CBEs, our work characterizes rarer outcomes including C to G and C to A editing outcomes. The space of base editing outcome combinations is thus 4N instead of 2n where N is the number of substrate nucleotides in the editing window.
Though on average, the number of substrate nucleotides would be small: for example, at 1/4th frequency in a window of 8 nucleotides we only have 2 substrate nucleotides in expectation, we would like our modeling approach to not arbitrarily fail for targets with many substrate nucleotides and to not require a subroutine with exponential time complexity. With binary outcomes, the space scales as 2N, which is feasible in practice for any realistic value of N; 210 = 1,024. However, 4N scales significantly more poorly. To make our models maximally accessible, we would like our interactive web app (https://www.crisprbehive.design) to have fast response times without limiting what a user can input.
By conventional design, a convolutional neural network may output a real number, which could be trained by a loss function that minimizes the distance to an observed normalized probability in the training set. However, at test time, we can only obtain a normalized probability for a particular combination of editing outcomes by dividing by the sum of output numbers obtained from all exponentially many inputs. In contrast, a deep conditional autoregressive model explicitly models the joint distribution of combinations of editing outcomes p(x1, x2, …, xN) where x, is the editing outcome of substrate nucleotide i. It does so by decomposing the joint distribution into a product of p(xi | x1, …, xi−1) terms for all i. At test time, we can obtain a normalized probability for any combination of editing outcomes with a single pass rather than exponentially many passes. We then apply a heuristic approach to efficiently explore the total probability space using prior knowledge of likely base editing outcomes while requiring a relatively small number of evaluations. In practice, we can cover on average 98% of the probability space with a few dozen evaluations, and we always assume the remaining probability space is the least desirable outcome (for example, does not correct a SNV), to err on the side of underestimating rather than overestimating statistics of interest. For any model prediction, we report the statistic of how much probability space is covered to calibrate user confidence in model predictions – for particularly adversarial target sequences, our heuristic approach may cover insufficient probability to yield useful results, so our heuristic can be manually modified to cover more probability space at the cost of longer runtime. Methods for modifying code are described in our bystander model github repository: https://github.com/maxwshen/be_predict_bystander.
Taken together, we conclude that a convolutional neural network could not replace the deep conditional autoregressive model.
ADDITIONAL RESOURCES
Interactive web application for BE-Hive: https://crisprbehive.design
Python package for BE-Hive: https://github.com/maxwshen/be_predict_efficiency and https://github.com/maxwshen/be_predict_bystander.
Supplementary Material
Figure S1 Genome-integrated library assay is replicable and consistent with endogenous data, related to Figure 1
(A) Average base editing efficiency by experimental condition. (B) Consistency of base editing outcome frequencies between biological replicates of the library assay at matched target sites. (C) Consistency of base editing outcome frequencies between data from the library assay versus data from endogenous sites at matched sgRNA–target pairs. (D) Base editor mutation activity profiles in HEK293T cells. Values are normalized to a maximum of 100. Protospacer positions with values ≥50% of maximum are outlined and ≥30% of maximum are shaded purple.
Figure S2 Base editor activity profiles, related to Figure 1
(A-B) Base editor activity profiles in HEK293T (A) and U2OS (B) cells. Values are normalized to a maximum of 100. Positions with values ≥50% of maximum are outlined and ≥30% of maximum are shaded purple.
Figure S3 Base editing efficiency sequence motifs, related to Figure 2
(A) Sequence motifs for base editing efficiency from logistic regression models. Logo opacity is proportional to the motif’s Pearson’s R or AUC on held-out sequence contexts. (B) Heat map representation of sequence motifs for cytosine base editing efficiency from logistic regression models. Rows depict individual experimental replicates across cell-types and base editors.
Figure S4 Characterization of rare base editing outcomes, related to Figure 2
(A) Heat map representation of sequence motifs for cytosine transversion purity from logistic regression models. Rows depict individual experimental replicates across cell-types and base editors. (B) Table of BE:indel ratio statistics with and without 1-bp indel adjustment. (C) Frequency of 1-bp indels by protospacer position. Gold standard conditions (gold) have a bimodal distribution peaking at positions 6 and 18, while other library conditions (red) are similar to untreated library conditions (gray) with a mostly uniform distribution. (D) Fraction of 1-bp indels among all indels, represented by box plots depicting median and interquartile range for various groups of data. Library gold standard conditions were manually defined.
Figure S5 Characterization of base editing indels and modeling of editing outcomes, related to Figures 2 and 3
(A) Heat map of indel frequencies among edited reads by position and length. Frequencies are normalized (divided) by indel length. (B) Heat map of insertion frequencies among all insertions by insertion length and repeat length. (C) Learned parameters from two-way ANOVA performed for adjusting batch effects in observed BE:indel ratios, grouped by cell-type. Horizontal lines indicate the geometric mean. (D) Sequence motifs for BE:indel ratios from logistic regression models. Logo opacity is proportional to the motif’s Pearson’s R or AUC on held-out sequence contexts. Positive logo weights are correlated with higher BE:indel ratios and therefore a lower indel frequency relative to base editing activity. (E) Comparison of BE:indel ratios between experimental replicates of the library assay at matched target sites in mES cells. (F) Sequence motifs for base editing efficiency from logistic regression models. Logo opacity is proportional to the motif’s Pearson’s R or AUC on held-out sequence contexts. Positive logo weights are correlated with higher BE:indel ratios and therefore a lower indel frequency relative to base editing activity. (G-H) Performance of the gradient-boosted regression tree model at predicting base editing efficiency. Each dot represents a distinct random splitting of data into training and test sets. (G) Performance by training versus test set for each base editor in mES and HEK293T cells. (H) Performance by fraction of training set used, with and without hyperparameter optimization, in mES cells. Trend line is from a LOWESS model which performs locally weighted linear regression. Trend line was manually extended to “100% with hyperparameter optimization”. (I-J) Performance of the deep conditional autoregressive model at predicting bystander editing patterns. Each dot represents a distinct random splitting of data into training and test sets. (I) Performance by training versus test set for each base editor in mES and HEK293T cells. (J) Performance by fraction of training set used. Trend line is from a LOWESS model which performs locally weighted linear regression.
Figure S6 Bystander editing model performance, related to Figure 3
(A) Performance of the deep conditional autoregressive model at predicting bystander editing patterns by the number of substrate nucleotides in protospacer positions 1-12 across all base editors in mES cells. (B) Consistency of observed bystander editing patterns between experimental library replicates at matched target sites by the number of substrate nucleotides in protospacer positions 1-12 across all base editors in mES cells. (C) Observed disequilibrium scores between pairs of substrate nucleotides by the nucleotide distance in mES cells. Disequilibrium scores equal the predicted or observed probability of both substrate nucleotides edited divided by the probability under the assumption of independent editing events. (D) Comparison between observed disequilibrium scores and predicted disequilibrium scores from the deep conditional autoregressive model in mES cells. (E-F) Consistency of BE-Hive predicted frequencies of bystander patterns by protospacer offset with Cas12a (E) and SaCas9 (F) base editing data. (G) Comparison of predicted versus observed correction precision of disease-related SNVs in mES cells. Trend line depicts rolling mean and standard deviation.
Figure S7 Editing outcomes on the transversion-enriched SNV library, related to Figures 5–7
(A) Comparison of predicted versus observed correction precision of disease-related SNVs in HEK293T cells. Trend line depicts rolling mean and standard deviation. (B) Transversion purity at eA3A-BE4 and eA3A-BE4-NG edited endogenous sites in HEK293T cells with varying levels of REV1 expression. (C) Consistency of bystander editing patterns between 35-nt and 61-nt matched target sites by eA3A-BE4 in mES cells. (D) Table of observed base editing purity of C to A among edited reads by eA3A-BE4 at synthetically optimized target sites in mES cells. (E) Sequence motifs for the purity of cytosine editing to adenine, guanine, and thymine by eA3A-BE4, T31A from logistic regression models. Logo opacity is proportional to the motif’s Pearson’s R or AUC on held-out sequence contexts. Positive logo weights are correlated with higher BE:indel ratios and therefore a lower indel frequency relative to base editing activity. (F-G) Base editing to indel ratio distributions comparing (F) BE4 to EA-BE4 and comparing (G) eA3A-BE4 to eA3A-BE5. (H-J) Comparison of predicted VUS installation frequency between a baseline method and BE-Hive for Cas9-NG for BE4, eA3A-BE4, and ABE. (K) Table of predicted installation frequency statistics.
Table S1. Feature importance values learned by the base editing efficiency model (gradient-boosted regression trees), related to Figure 3, provided as separate ‘.csv’ file.
Table S2. Base editing outcomes at disease-related alleles correctable by editing C•G to T•A, related to Figure 5, provided as separate ‘.csv’ file.
Table S3. Base editing outcomes at disease-related alleles correctable by editing A•T to G•C, related to Figure 5, provided as separate ‘.csv’ file.
Table S4. Base editing outcomes at disease-related alleles correctable by editing C•G to G•C or to A•T, related to Figure 6, provided as separate ‘.csv’ file.
Table S5. BE-Hive optimized sgRNA library for genome wide installation of VUS using BE4-NG, related to Supplemental Figure S7 and STAR Methods, provided as separate ‘.csv’ file.
Table S6. BE-Hive optimized sgRNA library for genome wide installation of VUS using eA3A-BE4-NG, related to Supplemental Figure S7 and STAR Methods, provided as separate ‘.csv’ file.
Table S7. BE-Hive optimized sgRNA library for genome wide installation of VUS using ABE-NG, related to Supplemental Figure S7 and STAR Methods, provided as separate ‘.csv’ file.
Table S8. Oligos Used in Study, related to STAR Methods.
Base editing outcome precision and efficiency are frequently unintuitive.
Machine learning model (BE-Hive) accurately predicts base editing outcomes.
Base editor engineering can increase and reduce aberrant transversion editing.
We precisely correct 3,388 pathogenic SNVs, many previously considered intractable.
Acknowledgements
This work was supported by US NIH grants U01AI142756, RM1HG009490, R01EB022376, and R35GM118062, St. Jude Collaborative Research Consortium, and HHMI (D.R.L.), and National Human Genome Research Institute grants R01HG010372 and R21HG010391 (C.A.C.). The authors acknowledge funding from an NWO Rubicon Fellowship to M.A., an NSF Graduate Research Fellowship to M.W.S., and a Marion Abbe Fellowship of the Damon Runyon Cancer Research Foundation (DRG-2343-18) to C.W.
Footnotes
Publisher's Disclaimer: This is a PDF file of an unedited manuscript that has been accepted for publication. As a service to our customers we are providing this early version of the manuscript. The manuscript will undergo copyediting, typesetting, and review of the resulting proof before it is published in its final form. Please note that during the production process errors may be discovered which could affect the content, and all legal disclaimers that apply to the journal pertain.
Declaration of Interests
D. R.L. is a consultant and co-founder of Beam Therapeutics, Prime Medicine, Editas Medicine, and Pairwise Plants, companies that use genome editing technologies. The authors have filed a patent application on aspects of this work.
REFERENCES
- Adli M (2018). The CRISPR tool kit for genome editing and beyond. Nat. Commun 9, 1911. [DOI] [PMC free article] [PubMed] [Google Scholar]
- Adolph MB, Love RP, Feng Y, and Chelico L (2017). Enzyme cycling contributes to efficient induction of genome mutagenesis by the cytidine deaminase APOBEC3B. Nucleic Acids Res. 45, 11925–11940. [DOI] [PMC free article] [PubMed] [Google Scholar]
- Allen F, Crepaldi L, Alsinet C, Strong AJ, Kleshchevnikov V, De Angeli P, Páleníková P, Khodak A, Kiselev V, Kosicki M, et al. (2019). Predicting the mutations generated by repair of Cas9-induced double-strand breaks. Nat. Biotechnol 37, 64–82. [DOI] [PMC free article] [PubMed] [Google Scholar]
- Anzalone AV, Randolph PB, Davis JR, Sousa AA, Koblan LW, Levy JM, Chen PJ, Wilson C, Newby GA, Raguram A, et al. (2019). Search-and-replace genome editing without double-strand breaks or donor DNA. Nature. [DOI] [PMC free article] [PubMed] [Google Scholar]
- Arbab M, Srinivasan S, Hashimoto T, Geijsen N, and Sherwood RI (2015). Cloning-free CRISPR. Stem Cell Rep. 5, 1–10. [DOI] [PMC free article] [PubMed] [Google Scholar]
- Bailey MH, Tokheim C, Porta-Pardo E, Sengupta S, Bertrand D, Weerasinghe A, Colaprico A, Wendl MC, Kim J, Reardon B, et al. (2018). Comprehensive Characterization of Cancer Driver Genes and Mutations. Cell 173, 371–385.e18. [DOI] [PMC free article] [PubMed] [Google Scholar]
- Barkal AA, Srinivasan S, Hashimoto T, Gifford DK, and Sherwood RI (2016). Cas9 Functionally Opens Chromatin. [DOI] [PMC free article] [PubMed] [Google Scholar]
- Barretina J, Caponigro G, Stransky N, Venkatesan K, Margolin AA, Kim S, Wilson CJ, Lehár J, Kryukov GV, Sonkin D, et al. (2012). The Cancer Cell Line Encyclopedia enables predictive modelling of anticancer drug sensitivity. Nature 483, 603–607. [DOI] [PMC free article] [PubMed] [Google Scholar]
- Basu U, Chaudhuri J, Alpert C, Dutt S, Ranganath S, Li G, Schrum JP, Manis JP, and Alt FW (2005). The AID antibody diversification enzyme is regulated by protein kinase a phosphorylation. Nature 438, 508–511. [DOI] [PubMed] [Google Scholar]
- Beale RCL, Petersen-Mahrt SK, Watt IN, Harris RS, Rada C, and Neuberger MS (2004). Comparison of the Differential Context-dependence of DNA Deamination by APOBEC Enzymes: Correlation with Mutation Spectra in Vivo. J. Mol. Biol 337, 585–596. [DOI] [PubMed] [Google Scholar]
- Blom N, Sicheritz-Pontén T, Gupta R, Gammeltoft S, and Brunak S (2004). Prediction of post-translational glycosylation and phosphorylation of proteins from the amino acid sequence. PROTEOMICS 4, 1633–1649. [DOI] [PubMed] [Google Scholar]
- Brown A-L, Li M, Goncearenco A, and Panchenko AR (2019). Finding driver mutations in cancer: Elucidating the role of background mutational processes. PLOS Comput. Biol 15, e1006981. [DOI] [PMC free article] [PubMed] [Google Scholar]
- Chaudhuri A, and Behan PO (2004). Fatigue in neurological disorders. The Lancet 363, 978–988. [DOI] [PubMed] [Google Scholar]
- Chen B, Gilbert LA, Cimini BA, Schnitzbauer J, Zhang W, Li G-W, Park J, Blackburn EH, Weissman JS, Qi LS, et al. (2013). Dynamic Imaging of Genomic Loci in Living Human Cells by an Optimized CRISPR/Cas System. Cell 155, 1479–1491. [DOI] [PMC free article] [PubMed] [Google Scholar]
- Cong L, Ran FA, Cox D, Lin S, Barretto R, Habib N, Hsu PD, Wu X, Jiang W, Marraffini LA, et al. (2013). Multiplex Genome Engineering Using CRISPR/Cas Systems. Science 339, 819. [DOI] [PMC free article] [PubMed] [Google Scholar]
- Després PC, Dubé AK, Seki M, Yachie N, and Landry CR (2020). Perturbing proteomes at single residue resolution using base editing. Nat. Commun 11, 1871. [DOI] [PMC free article] [PubMed] [Google Scholar]
- Dodé C, Levilliers J, Dupont JM, De Paepe A, Le Dû N, Soussi-Yanicostas N, Coimbra RS, Delmaghani S, Compain-Nouaille S, Baverel F, et al. (2003). Loss-of-function mutations in FGFR1 cause autosomal dominant Kallmann syndrome. Nat. Genet 33, 463–465. [DOI] [PubMed] [Google Scholar]
- Doench JG, Fusi N, Sullender M, Hegde M, Vaimberg EW, Donovan KF, Smith I, Tothova Z, Wilen C, Orchard R, et al. (2016). Optimized sgRNA design to maximize activity and minimize off-target effects of CRISPR-Cas9. Nat. Biotechnol 34, 184–191. [DOI] [PMC free article] [PubMed] [Google Scholar]
- Doudna J, and Knott G (2018). CRISPR-Cas guides the future of genetic engineering. Science 361, 1–4. [DOI] [PMC free article] [PubMed] [Google Scholar]
- Friedman JH (2001). Greedy Function Approximation. Gradient Boosting Machine. Friedman (1999). Ann. Stat 29, 1189–1232. [Google Scholar]
- Gaudelli NM, Komor AC, Rees HA, Packer MS, Badran AH, Bryson DI, and Liu DR (2017). Programmable base editing of A»T to G»C in genomic DNA without DNA cleavage. Nature 551, 464–471. [DOI] [PMC free article] [PubMed] [Google Scholar]
- Gehrke JM, Cervantes O, Clement MK, Wu Y, Zeng J, Bauer DE, Pinello L, and Joung JK (2018). An APOBeC3A-Cas9 base editor with minimized bystander and off-target activities. Nat. Biotechnol 36, 977. [DOI] [PMC free article] [PubMed] [Google Scholar]
- Hart T, Chandrashekhar M, Aregger M, Steinhart Z, Brown KR, MacLeod G, Mis M, Zimmermann M, Fradet-Turcotte A, Sun S, et al. (2015). High-Resolution CRISPR Screens Reveal Fitness Genes and Genotype-Specific Cancer Liabilities. Cell 163, 1515–1526. [DOI] [PubMed] [Google Scholar]
- Hitchcock TM, Dong L, Connor EE, Meira LB, Samson LD, Wyatt MD, and Cao W (2004). Oxanine DNA glycosylase activity from mammalian alkyladenine glycosylase. J. Biol. Chem 279, 38177–38183. [DOI] [PubMed] [Google Scholar]
- Hu C, Chen W, Myers SJ, Yuan H, and Traynelis SF (2016). Human GRIN2B variants in neurodevelopmental disorders. J. Pharmacol. Sci 132, 115–121. [DOI] [PMC free article] [PubMed] [Google Scholar]
- Huang TP, Zhao KT, Miller SM, Gaudelli NM, Oakes BL, Fellmann C, Savage DF, and Liu DR (2019). Circularly permuted and PAM-modified Cas9 variants broaden the targeting scope of base editors. Nat. Biotechnol [DOI] [PMC free article] [PubMed] [Google Scholar]
- Imai K, Slupphaug G, Lee W-I, Revy P, Nonoyama S, Catalan N, Yel L, Forveille M, Kavli B, Krokan HE, et al. (2003). Human uracil-DNA glycosylase deficiency associated with profoundly impaired immunoglobulin class-switch recombination. Nat. Immunol 4, 1023–1028. [DOI] [PubMed] [Google Scholar]
- Jansen JG, Langerak P, Tsaalbi-Shtylik A, van den Berk P, Jacobs H, and de Wind N (2006). Strand-biased defect in C/G transversions in hypermutating immunoglobulin genes in Rev1-deficient mice. J. Exp. Med 203, 319–323. [DOI] [PMC free article] [PubMed] [Google Scholar]
- Jinek M, East A, Cheng A, Lin S, Ma E, and Doudna J (2013). RNA-programmed genome editing in human cells. ELife 2, e00471. [DOI] [PMC free article] [PubMed] [Google Scholar]
- Kalia SS, Adelman K, Bale SJ, Chung WK, Eng C, Evans JP, Herman GE, Hufnagel SB, Klein TE, Korf BR, et al. (2016). Recommendations for reporting of secondary findings in clinical exome and genome sequencing, 2016 update (ACMG SF v2.0): a policy statement of the American College of Medical Genetics and Genomics. Genet. Med 19, 249. [DOI] [PubMed] [Google Scholar]
- Kim HS, Jeong YK, Hur JK, Kim J-S, and Bae S (2019). Adenine base editors catalyze cytosine conversions in human cells. Nat. Biotechnol [DOI] [PubMed] [Google Scholar]
- Kim YB, Komor AC, Levy JM, Packer MS, Zhao KT, and Liu DR (2017). Increasing the genome-targeting scope and precision of base editing with engineered Cas9-cytidine deaminase fusions. Nat. Biotechnol 35, 371–376. [DOI] [PMC free article] [PubMed] [Google Scholar]
- Kleinstiver BP, Sousa AA, Walton RT, Tak YE, Hsu JY, Clement K, Welch MM, Horng JE, Malagon-Lopez J, Scarfo I, et al. (2019). Engineered CRISPR-Cas12a variants with increased activities and improved targeting ranges for gene, epigenetic and base editing. Nat. Biotechnol 37, 276–282. [DOI] [PMC free article] [PubMed] [Google Scholar]
- Koblan LW, Doman JL, Wilson C, Levy JM, Tay T, Newby GA, Maianti JP, Raguram A, and Liu DR (2018). Improving cytidine and adenine base editors by expression optimization and ancestral reconstruction. Nat. Biotechnol 36, 843–848. [DOI] [PMC free article] [PubMed] [Google Scholar]
- Koike-Yusa H, Li Y, Tan E-P, Velasco-Herrera MDC, and Yusa K (2013). Genome-wide recessive genetic screening in mammalian cells with a lentiviral CRISPR-guide RNA library. Nat. Biotechnol 32, 267–273. [DOI] [PubMed] [Google Scholar]
- Komor AC, Kim YB, Packer MS, Zuris JA, and Liu DR (2016a). Programmable editing of a target base in genomic DNA without double-stranded DNA cleavage. Nature 533, 420–424. [DOI] [PMC free article] [PubMed] [Google Scholar]
- Komor AC, Kim YB, Packer MS, Zuris JA, and Liu DR (2016b). Programmable editing of a target base in genomic DNA without double-stranded DNA cleavage. Nature 533, 420–424. [DOI] [PMC free article] [PubMed] [Google Scholar]
- Komor AC, Zhao KT, Packer MS, Gaudelli NM, Waterbury AL, Koblan LW, Kim YB, Badran AH, and Liu DR (2017). Improved base excision repair inhibition and bacteriophage Mu Gam protein yields C:G-to-T:A base editors with higher efficiency and product purity. Sci. Adv 3, eaao4774. [DOI] [PMC free article] [PubMed] [Google Scholar]
- Kuscu C, Parlak M, Tufan T, Yang J, Szlachta K, Wei X, Mammadov R, and Adli M (2017). CRISPR-STOP: gene silencing through base-editing-induced nonsense mutations. Nat. Methods 14, 710–712. [DOI] [PubMed] [Google Scholar]
- Kweon J, Jang A-H, Shin HR, See J-E, Lee W, Lee JW, Chang S, Kim K, and Kim Y (2019). A CRISPR-based base-editing screen for the functional assessment of BRCA1 variants. Oncogene. [DOI] [PMC free article] [PubMed] [Google Scholar]
- Landrum MJ, Lee JM, Benson M, Brown G, Chao C, Chitipiralla S, Gu B, Hart J, Hoffman D, Hoover J, et al. (2016). ClinVar: public archive of interpretations of clinically relevant variants. Nucleic Acids Res 44, D862–8. [DOI] [PMC free article] [PubMed] [Google Scholar]
- Lau AY, Wyatt MD, Glassner BJ, Samson LD, and Ellenberger T (2000). Molecular basis for discriminating between normal and damaged bases by the human alkyladenine glycosylase, AAG. Proc. Natl. Acad. Sci 97, 13573–13578. [DOI] [PMC free article] [PubMed] [Google Scholar]
- Lemos BR, Kaplan AC, Bae JE, Ferrazzoli AE, Kuo J, Anand RP, Waterman DP, and Haber JE (2018). CRISPR/Cas9 cleavages in budding yeast reveal templated insertions and strand-specific insertion/deletion profiles. Proc. Natl. Acad. Sci. U. S. A 115, E2040–E2047. [DOI] [PMC free article] [PubMed] [Google Scholar]
- Li Q, Li Y, Yang S, Huang S, Yan M, Ding Y, Tang W, Lou X, Yin Q, Sun Z, et al. (2018). CRISPR–Cas9-mediated base-editing screening in mice identifies DND1 amino acids that are critical for primordial germ cell development. Nat. Cell Biol 20, 1315–1325. [DOI] [PubMed] [Google Scholar]
- Lin S, Staahl BT, Alla RK, and Doudna JA (2014). Enhanced homology-directed human genome engineering by controlled timing of CRISPR/Cas9 delivery. ELife 3, e04766–e04766. [DOI] [PMC free article] [PubMed] [Google Scholar]
- Liu LD, Huang M, Dai P, Liu T, Fan S, Cheng X, Zhao Y, Yeap LS, and Meng FL (2018). Intrinsic Nucleotide Preference of Diversifying Base Editors Guides Antibody Ex Vivo Affinity Maturation. Cell Rep. 25, 884–892.e3. [DOI] [PubMed] [Google Scholar]
- Love RP, Xu H, and Chelico L (2012). Biochemical analysis of hypermutation by the deoxycytidine deaminase APOBEC3A. J. Biol. Chem 287, 30812–30822. [DOI] [PMC free article] [PubMed] [Google Scholar]
- Ma H, Wu Y, Dang Y, Choi J-G, Zhang J, and Wu H (2014). Pol III Promoters to Express Small RNAs: Delineation of Transcription Initiation. Mol. Ther. Nucleic Acids 3, e161. [DOI] [PMC free article] [PubMed] [Google Scholar]
- Mali P, Yang L, Esvelt KM, Aach J, Guell M, DiCarlo JE, Norville JE, and Church GM (2013). RNA-Guided Human Genome Engineering via Cas9. Science 339, 823. [DOI] [PMC free article] [PubMed] [Google Scholar]
- McBride KM, Gazumyan A, Woo EM, Schwickert TA, Chait BT, and Nussenzweig MC (2008). Regulation of class switch recombination and somatic mutation by AID phosphorylation. J. Exp. Med 205, 2585–2594. [DOI] [PMC free article] [PubMed] [Google Scholar]
- Molla KA, and Yang Y (2019). CRISPR/Cas-Mediated Base Editing: Technical Considerations and Practical Applications. Trends Biotechnol. 37, 1121–1142. [DOI] [PubMed] [Google Scholar]
- Nishida K, Arazoe T, Yachie N, Banno S, Kakimoto M, Tabata M, Mochizuki M, Miyabe A, Araki M, Hara KY, et al. (2016). Targeted nucleotide editing using hybrid prokaryotic and vertebrate adaptive immune systems. Science 353, aaf8729. [DOI] [PubMed] [Google Scholar]
- Nishimasu H, Shi X, Ishiguro S, Gao L, Hirano S, Okazaki S, Noda T, Abudayyeh OO, Gootenberg JS, Mori H, et al. (2018). Engineered CRISPR-Cas9 nuclease with expanded targeting space. Science 361, 1259. [DOI] [PMC free article] [PubMed] [Google Scholar]
- Van Den Oord A, Kalchbrenner N, and Kavukcuoglu K (2016). Pixel recurrent neural networks. In 33rd International Conference on Machine Learning, ICML 2016, pp. 2611–2620. [Google Scholar]
- Paquet D, Kwart D, Chen A, Sproul A, Jacob S, Teo S, Olsen KM, Gregg A, Noggle S, and Tessier-Lavigne M (2016). Efficient introduction of specific homozygous and heterozygous mutations using CRISPR/Cas9. Nature 533, 1–18. [DOI] [PubMed] [Google Scholar]
- Pardiñas AF, Holmans P, Pocklington AJ, Escott-Price V, Ripke S, Carrera N, Legge SE, Bishop S, Cameron D, Hamshere ML, et al. (2018). Common schizophrenia alleles are enriched in mutation-intolerant genes and in regions under strong background selection. Nat. Genet 50, 381–389. [DOI] [PMC free article] [PubMed] [Google Scholar]
- Parkhomchuk D, Borodina T, Amstislavskiy V, Banaru M, Hallen L, Krobitsch S, Lehrach H, and Soldatov A (2009). Transcriptome analysis by strand-specific sequencing of complementary DNA. Nucleic Acids Res. 37, e123–e123. [DOI] [PMC free article] [PubMed] [Google Scholar]
- Pérez-Durán P, Belver L, de Yébenes VG, Delgado P, Pisano DG, and Ramiro AR (2012). UNG shapes the specificity of AID-induced somatic hypermutation. J. Exp. Med 209, 1379–1389. [DOI] [PMC free article] [PubMed] [Google Scholar]
- Pérez-Palma E, Gramm M, Nürnberg P, May P, and Lal D (2019). Simple ClinVar: an interactive web server to explore and retrieve gene and disease variants aggregated in ClinVar database. Nucleic Acids Res. 47, W99–W105. [DOI] [PMC free article] [PubMed] [Google Scholar]
- Pham P, Bransteitter R, Petruska J, and Goodman MF (2003). Processive AID-catalysed cytosine deamination on single-stranded DNA simulates somatic hypermutation. Nature 424, 103–107. [DOI] [PubMed] [Google Scholar]
- Pham P, Smolka MB, Calabrese P, Landolph A, Zhang K, Zhou H, and Goodman MF (2008). Impact of phosphorylation and phosphorylation-null mutants on the activity and deamination specificity of activation-induced cytidine deaminase. J. Biol. Chem 283, 17428–17439. [DOI] [PMC free article] [PubMed] [Google Scholar]
- Rajagopal N, Srinivasan S, Kooshesh K, Guo Y, Edwards MD, Banerjee B, Syed T, Emons BJM, Gifford DK, and Sherwood RI (2016). High-throughput mapping of regulatory DNA. Nat. Biotechnol 34, 167–174. [DOI] [PMC free article] [PubMed] [Google Scholar]
- Rees HA, and Liu DR (2018). Base editing: precision chemistry on the genome and transcriptome of living cells. Nat. Rev. Genet 19, 770–788. [DOI] [PMC free article] [PubMed] [Google Scholar]
- Richardson CD, Ray GJ, DeWitt MA, Curie GL, and Corn JE (2016). Enhancing homology-directed genome editing by catalytically active and inactive CRISPR-Cas9 using asymmetric donor DNA. Nat. Biotechnol 34, 339–344. [DOI] [PubMed] [Google Scholar]
- Saparbaev M, and Laval J (1994). Excision of hypoxanthine from DNA containing dIMP residues by the Escherichia coli, yeast, rat, and human alkylpurine DNA glycosylases. Proc. Natl. Acad. Sci 91, 5873–5877. [DOI] [PMC free article] [PubMed] [Google Scholar]
- Shalem O, Sanjana NE, Hartenian E, Shi X, Scott DA, Mikkelsen TS, Heckl D, Ebert BL, Root DE, Doench JG, et al. (2014). Genome-Scale CRISPR-Cas9 Knockout Screening in Human Cells. Science 343, 84. [DOI] [PMC free article] [PubMed] [Google Scholar]
- Shen MW, Arbab M, Hsu JY, Worstell D, Culbertson SJ, Krabbe O, Cassa A, Liu DR, Gifford DK, and Sherwood RI (2018). Predictable and precise template-free CRISPR editing of pathogenic variants. Nature 563, 646–651. [DOI] [PMC free article] [PubMed] [Google Scholar]
- Sherwood RI, Hashimoto T, O’Donnell CW, Lewis S, Barkal AA, Van Hoff JP, Karun V, Jaakkola T, and Gifford DK (2014). Discovery of directional and nondirectional pioneer transcription factors by modeling DNase profile magnitude and shape. Nat. Biotechnol 32, 171–178. [DOI] [PMC free article] [PubMed] [Google Scholar]
- Shou J, Li J, Liu Y, and Wu Q (2018). Precise and Predictable CRISPR Chromosomal Rearrangements Reveal Principles of Cas9-Mediated Nucleotide Insertion. Mol. Cell 77, 498–509.e4. [DOI] [PubMed] [Google Scholar]
- Stahl EA, Breen G, Forstner AJ, McQuillin A, Ripke S, Trubetskoy V, Mattheisen M, Wang Y, Coleman JRI, Gaspar HA, et al. (2019). Genome-wide association study identifies 30 loci associated with bipolar disorder. Nat. Genet 57, 793–803. [DOI] [PMC free article] [PubMed] [Google Scholar]
- Stenson PD, Mort M, Ball EV, Shaw K, Phillips AD, and Cooper DN (2014). The Human Gene Mutation Database: Building a comprehensive mutation repository for clinical and molecular genetics, diagnostic testing and personalized genomic medicine. Hum. Genet 733, 1–9. [DOI] [PMC free article] [PubMed] [Google Scholar]
- Tajsharghi H, Thornell L-E, Lindberg C, Lindvall B, Henriksson K-G, and Oldfors A (2003). Myosin storage myopathy associated with a heterozygous missense mutation in MYH7. Ann. Neurol 54, 494–500. [DOI] [PubMed] [Google Scholar]
- Tan J, Zhang F, Karcher D, and Bock R (2019). Engineering of high-precision base editors for site-specific single nucleotide replacement. Nat. Commun 70. [DOI] [PMC free article] [PubMed] [Google Scholar]
- Theobald DL, and Steindel PA (2012). Optimal simultaneous superpositioning of multiple structures with missing data. Bioinformatics 28, 1972–1979. [DOI] [PMC free article] [PubMed] [Google Scholar]
- Thuronyi BW, Koblan LW, Levy JM, Yeh W-H, Zheng C, Newby GA, Wilson C, Bhaumik M, Shubina-Oleinik O, Holt JR, et al. (2019). Continuous evolution of base editors with expanded target compatibility and improved activity. Nat. Biotechnol [DOI] [PMC free article] [PubMed] [Google Scholar]
- Urasaki A, Morvan G, and Kawakami K (2006). Functional dissection of the Tol2 transposable element identified the minimal cis-sequence and a highly repetitive sequence in the subterminal region essential for transposition. Genetics 774, 639–649. [DOI] [PMC free article] [PubMed] [Google Scholar]
- Villiger L, Grisch-Chan HM, Lindsay H, Ringnalda F, Pogliano CB, Allegri G, Fingerhut R, Haberle J, Matos J, Robinson MD, et al. (2018). Treatment of a metabolic liver disease by in vivo genome base editing in adult mice. Nat Med 24, 1519–1525. [DOI] [PubMed] [Google Scholar]
- Wang T, Wei JJ, Sabatini DM, and Lander ES (2014). Genetic Screens in Human Cells Using the CRISPR-Cas9 System. Science 343, 80. [DOI] [PMC free article] [PubMed] [Google Scholar]
- Wu C, MacLeod I, and Su AI (2013). BioGPS and MyGene.info: Organizing online, gene-centric information. Nucleic Acids Res. 47, D561–D565. [DOI] [PMC free article] [PubMed] [Google Scholar]
- Yamane A, Resch W, Kuo N, Kuchen S, Li Z, Sun HW, Robbiani DF, McBride K, Nussenzweig MC, and Casellas R (2011). Deep-sequencing identification of the genomic targets of the cytidine deaminase AID and its cofactor RPA in B lymphocytes. Nat. Immunol 72, 62–69. [DOI] [PMC free article] [PubMed] [Google Scholar]
- Zuo Z, and Liu J (2016). Cas9-catalyzed DNA Cleavage Generates Staggered Ends: Evidence from Molecular Dynamics Simulations. Sci. Rep 6, 37584–37584. [DOI] [PMC free article] [PubMed] [Google Scholar]
Associated Data
This section collects any data citations, data availability statements, or supplementary materials included in this article.
Supplementary Materials
Figure S1 Genome-integrated library assay is replicable and consistent with endogenous data, related to Figure 1
(A) Average base editing efficiency by experimental condition. (B) Consistency of base editing outcome frequencies between biological replicates of the library assay at matched target sites. (C) Consistency of base editing outcome frequencies between data from the library assay versus data from endogenous sites at matched sgRNA–target pairs. (D) Base editor mutation activity profiles in HEK293T cells. Values are normalized to a maximum of 100. Protospacer positions with values ≥50% of maximum are outlined and ≥30% of maximum are shaded purple.
Figure S2 Base editor activity profiles, related to Figure 1
(A-B) Base editor activity profiles in HEK293T (A) and U2OS (B) cells. Values are normalized to a maximum of 100. Positions with values ≥50% of maximum are outlined and ≥30% of maximum are shaded purple.
Figure S3 Base editing efficiency sequence motifs, related to Figure 2
(A) Sequence motifs for base editing efficiency from logistic regression models. Logo opacity is proportional to the motif’s Pearson’s R or AUC on held-out sequence contexts. (B) Heat map representation of sequence motifs for cytosine base editing efficiency from logistic regression models. Rows depict individual experimental replicates across cell-types and base editors.
Figure S4 Characterization of rare base editing outcomes, related to Figure 2
(A) Heat map representation of sequence motifs for cytosine transversion purity from logistic regression models. Rows depict individual experimental replicates across cell-types and base editors. (B) Table of BE:indel ratio statistics with and without 1-bp indel adjustment. (C) Frequency of 1-bp indels by protospacer position. Gold standard conditions (gold) have a bimodal distribution peaking at positions 6 and 18, while other library conditions (red) are similar to untreated library conditions (gray) with a mostly uniform distribution. (D) Fraction of 1-bp indels among all indels, represented by box plots depicting median and interquartile range for various groups of data. Library gold standard conditions were manually defined.
Figure S5 Characterization of base editing indels and modeling of editing outcomes, related to Figures 2 and 3
(A) Heat map of indel frequencies among edited reads by position and length. Frequencies are normalized (divided) by indel length. (B) Heat map of insertion frequencies among all insertions by insertion length and repeat length. (C) Learned parameters from two-way ANOVA performed for adjusting batch effects in observed BE:indel ratios, grouped by cell-type. Horizontal lines indicate the geometric mean. (D) Sequence motifs for BE:indel ratios from logistic regression models. Logo opacity is proportional to the motif’s Pearson’s R or AUC on held-out sequence contexts. Positive logo weights are correlated with higher BE:indel ratios and therefore a lower indel frequency relative to base editing activity. (E) Comparison of BE:indel ratios between experimental replicates of the library assay at matched target sites in mES cells. (F) Sequence motifs for base editing efficiency from logistic regression models. Logo opacity is proportional to the motif’s Pearson’s R or AUC on held-out sequence contexts. Positive logo weights are correlated with higher BE:indel ratios and therefore a lower indel frequency relative to base editing activity. (G-H) Performance of the gradient-boosted regression tree model at predicting base editing efficiency. Each dot represents a distinct random splitting of data into training and test sets. (G) Performance by training versus test set for each base editor in mES and HEK293T cells. (H) Performance by fraction of training set used, with and without hyperparameter optimization, in mES cells. Trend line is from a LOWESS model which performs locally weighted linear regression. Trend line was manually extended to “100% with hyperparameter optimization”. (I-J) Performance of the deep conditional autoregressive model at predicting bystander editing patterns. Each dot represents a distinct random splitting of data into training and test sets. (I) Performance by training versus test set for each base editor in mES and HEK293T cells. (J) Performance by fraction of training set used. Trend line is from a LOWESS model which performs locally weighted linear regression.
Figure S6 Bystander editing model performance, related to Figure 3
(A) Performance of the deep conditional autoregressive model at predicting bystander editing patterns by the number of substrate nucleotides in protospacer positions 1-12 across all base editors in mES cells. (B) Consistency of observed bystander editing patterns between experimental library replicates at matched target sites by the number of substrate nucleotides in protospacer positions 1-12 across all base editors in mES cells. (C) Observed disequilibrium scores between pairs of substrate nucleotides by the nucleotide distance in mES cells. Disequilibrium scores equal the predicted or observed probability of both substrate nucleotides edited divided by the probability under the assumption of independent editing events. (D) Comparison between observed disequilibrium scores and predicted disequilibrium scores from the deep conditional autoregressive model in mES cells. (E-F) Consistency of BE-Hive predicted frequencies of bystander patterns by protospacer offset with Cas12a (E) and SaCas9 (F) base editing data. (G) Comparison of predicted versus observed correction precision of disease-related SNVs in mES cells. Trend line depicts rolling mean and standard deviation.
Figure S7 Editing outcomes on the transversion-enriched SNV library, related to Figures 5–7
(A) Comparison of predicted versus observed correction precision of disease-related SNVs in HEK293T cells. Trend line depicts rolling mean and standard deviation. (B) Transversion purity at eA3A-BE4 and eA3A-BE4-NG edited endogenous sites in HEK293T cells with varying levels of REV1 expression. (C) Consistency of bystander editing patterns between 35-nt and 61-nt matched target sites by eA3A-BE4 in mES cells. (D) Table of observed base editing purity of C to A among edited reads by eA3A-BE4 at synthetically optimized target sites in mES cells. (E) Sequence motifs for the purity of cytosine editing to adenine, guanine, and thymine by eA3A-BE4, T31A from logistic regression models. Logo opacity is proportional to the motif’s Pearson’s R or AUC on held-out sequence contexts. Positive logo weights are correlated with higher BE:indel ratios and therefore a lower indel frequency relative to base editing activity. (F-G) Base editing to indel ratio distributions comparing (F) BE4 to EA-BE4 and comparing (G) eA3A-BE4 to eA3A-BE5. (H-J) Comparison of predicted VUS installation frequency between a baseline method and BE-Hive for Cas9-NG for BE4, eA3A-BE4, and ABE. (K) Table of predicted installation frequency statistics.
Table S1. Feature importance values learned by the base editing efficiency model (gradient-boosted regression trees), related to Figure 3, provided as separate ‘.csv’ file.
Table S2. Base editing outcomes at disease-related alleles correctable by editing C•G to T•A, related to Figure 5, provided as separate ‘.csv’ file.
Table S3. Base editing outcomes at disease-related alleles correctable by editing A•T to G•C, related to Figure 5, provided as separate ‘.csv’ file.
Table S4. Base editing outcomes at disease-related alleles correctable by editing C•G to G•C or to A•T, related to Figure 6, provided as separate ‘.csv’ file.
Table S5. BE-Hive optimized sgRNA library for genome wide installation of VUS using BE4-NG, related to Supplemental Figure S7 and STAR Methods, provided as separate ‘.csv’ file.
Table S6. BE-Hive optimized sgRNA library for genome wide installation of VUS using eA3A-BE4-NG, related to Supplemental Figure S7 and STAR Methods, provided as separate ‘.csv’ file.
Table S7. BE-Hive optimized sgRNA library for genome wide installation of VUS using ABE-NG, related to Supplemental Figure S7 and STAR Methods, provided as separate ‘.csv’ file.
Table S8. Oligos Used in Study, related to STAR Methods.
Data Availability Statement
The sequencing data generated during this study are available at the NCBI Sequence Read Archive database under PRJNA591007. Processed data have been deposited under the following DOIs: 10.6084/m9.figshare.10673816 and 10.6084/m9.figshare.10678097. The code used for data processing and analysis are available at https://github.com/maxwshen/lib-dataprocessing and https://github.com/maxwshen/lib-analysis.