Abstract
INTRODUCTION:
Colorectal cancer is a common malignancy that can be cured when detected early, but recurrence among survivors is a persistent risk. A field effect of cancer in the colon has been reported and could have implications for surveillance, but studies to date have been limited. A joint analysis of pooled transcriptomic data from all available bulk RNA-sequencing data sets of healthy, histologically normal tumor-adjacent, and tumor tissues was performed to provide an unbiased assessment of field effect.
METHODS:
A novel bulk RNA-sequencing data set from biopsies of nondiseased colon from screening colonoscopy along with published data sets from the Genomic Data Commons and Sequence Read Archive were considered for inclusion. Analyses were limited to samples with a quantified read depth of at least 10 million reads. Transcript abundance was estimated with Salmon, and downstream analysis was performed in R.
RESULTS:
A total of 1,139 samples were analyzed in 3 cohorts. The primary cohort consisted of 834 independent samples from 8 independent data sets, including 462 healthy, 61 tumor-adjacent, and 311 tumor samples. Tumor-adjacent gene expression was found to represent an intermediate state between healthy and tumor expression. Among differentially expressed genes in tumor-adjacent samples, 1,143 were expressed in patterns similar to tumor samples, and these genes were enriched for cancer-associated pathways.
DISCUSSION:
Novel insights into the field effect in colorectal cancer were generated in this mega-analysis of the colorectal transcriptome. Oncogenic features that might help explain metachronous lesions in cancer survivors and could be used for surveillance and risk stratification were identified.
INTRODUCTION
Colorectal cancer (CRC) is a common and often lethal malignancy with a significant impact on public health in the United States and worldwide. Because of early detection and effective treatment of local disease, CRC can sometimes be cured. However, epidemiological studies have demonstrated a higher risk of new disease in survivors with CRC compared with age-matched general populations (1–3). To manage that risk, the US Multisociety Task Force recommends surveillance colonoscopy at regular intervals after resection (4). Whether interval tumors represent missed synchronous, incompletely resected primary or true metachronous cancers is often uncertain, but many likely represent second primary tumors (2,5). At a molecular level, the field effect model can help explain new cancers in survivors with CRC.
The field effect hypothesis posits that cancer susceptibility results from a range of exposures that include carcinogenic agents and local host–tumor interactions. Somatic mutations or epigenetic alterations in physically proximate progenitor cells engender patches of molecularly aberrant epithelium from which multifocal cancers subsequently emerge (6–8). Evidence for field effect has been found in histologically normal-appearing colonic mucosa adjacent to tumors in surgical specimens (9–13). However, studies of field effect in CRC have been limited by sample size, tissue suitability, and assay availability.
Transcriptome profiling is a useful measurement for investigation of tissue biology because it provides a comprehensive assessment of molecular consequences downstream of genetic and epigenetic differences across phenotypes. RNA sequencing (RNA-seq) is the preferred assay for transcriptome profiling and is now affordable at population scale. In vivo adult colorectal epithelial cells and their niche in the settings of health and primary cancer are the biological units of interest for evaluation of the field effect. Bulk RNA-seq of tissue from biopsies or surgical specimens with an epithelial component collected from subjects with and without cancer should, therefore, provide the most accurate representation of field effects. However, inclusion of healthy mucosal samples from subjects without disease is rare in studies of CRC, and tumor-adjacent samples are also relatively limited.
Multiple groups have recently harmonized colorectal RNA-seq data sets from The Cancer Genome Atlas (TCGA) (14) and the Genotype-Tissue Expression Project (GTEx) (15), allowing large-scale comparisons among healthy mucosa, histologically normal tumor-adjacent mucosa, and tumor tissue (13,16). However, tumor-adjacent samples account for only 10% of TCGA samples, and half of GTEx samples have no mucosal component (17). Two recent meta-analyses of CRC transcriptomes demonstrated that applying consistent methods across heterogeneous data sets can permit investigators to leverage increased sample sizes to discover robust and biologically meaningful signals in measurements with substantial underlying variability (18,19).
In this study, previously successful methods were extended to harmonize all publicly available data sets of colorectal bulk RNA-seq and unpublished RNA-seq of healthy colon tissue collected during screening colonoscopy in a pooled analysis of the transcriptomic field effect in CRC. The molecular features that distinguish normal tissue adjacent to tumors from healthy tissues despite similar histologic appearances were shown. Some of the molecular differences characteristic of tumor-adjacent tissue were oncogenic, providing a possible molecular basis for the increased incidence of metachronous tumors in survivors with CRC and potential targets for posttreatment surveillance. To the authors' knowledge, this is the largest RNA-seq-based study of the field effect in CRC to date. The pooled data set will be provided as an R (20) package on Bioconductor (21).
METHODS
Samples
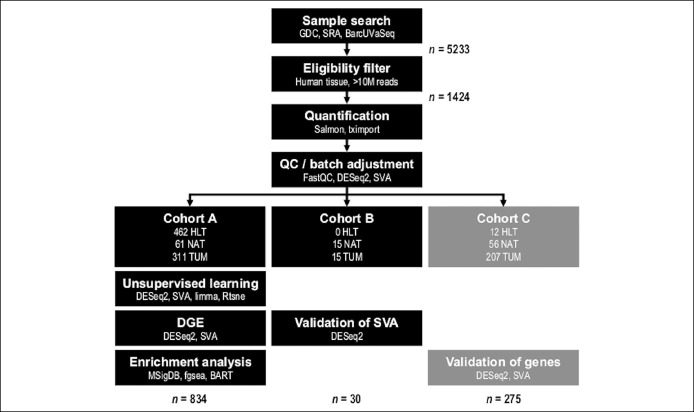
Bulk RNA-seq samples from the University of Barcelona and the University of Virginia (BarcUVa-Seq) were derived from healthy mucosal biopsies obtained during screening colonoscopies from subjects without known predisposition to colorectal neoplasm at the Catalan Institute for Oncology. All samples sequenced as of January 21, 2019, were screened for inclusion. Samples from public data sets were identified by systematic searches of the Genomic Data Commons (22) and Sequence Read Archive (23), the 2 largest public genomics repositories (Figure 1). All bulk RNA-seq data sets of human colorectal tissue available as of January 21, 2019, were screened for inclusion. Detailed protocols for RNA extraction and sequencing for the BarcUVa-Seq study and full search parameters for systematic review of public data sets are provided in the Supplementary Methods (see Supplementary Digital Content 1, http://links.lww.com/CTG/A315).
Figure 1.
Workflow diagram. Pathway outline of mega-analysis. Cohorts A and B were independent and composed of paired-end libraries. Cohort C was independent of cohorts A and B and composed of single-end libraries. The Study Design subsection of the Methods section includes a description of the 3 independent cohorts. BarcUVA-Seq, University of Barcelona and University of Virginia RNA sequencing project; BART, binding analysis for regulation of transcription; GDC, Genomic Data Commons; HLT, healthy; NAT, normal-adjacent-to-tumor; SRA, Sequence Read Archive; SVA, Surrogate Variable Analysis; TCGA, The Cancer Genome Atlas; TUM, tumor.
A total of 5,233 samples from 167 data sets were screened (see Table ST1A, Supplementary Digital Content 2, http://links.lww.com/CTG/A316). Most samples were derived from cell lines and were, therefore, ineligible for inclusion. A total of 1,424 samples from 14 data sets (see Tables ST1B and ST1C, Supplementary Digital Content 2, http://links.lww.com/CTG/A316) were eligible for pooled analysis after screening based on criteria described in the Supplementary Methods (see Supplementary Digital Content 1, http://links.lww.com/CTG/A315).
Study design
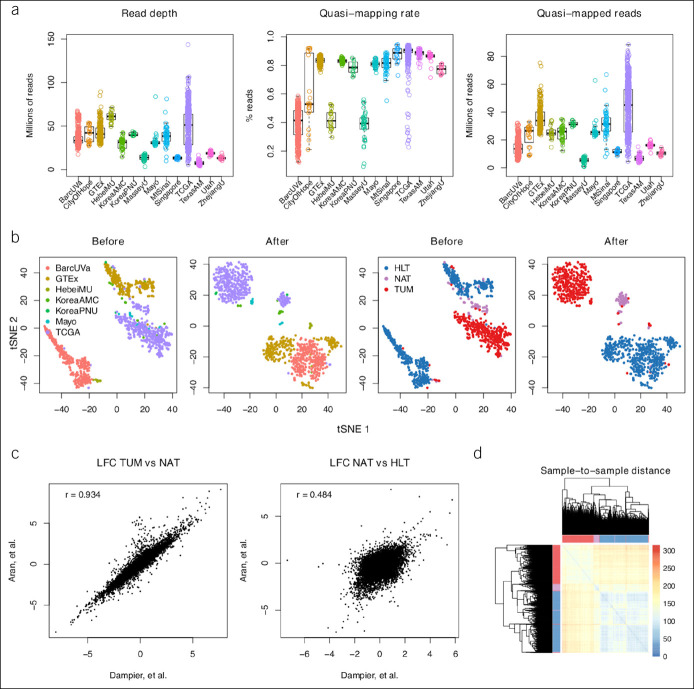
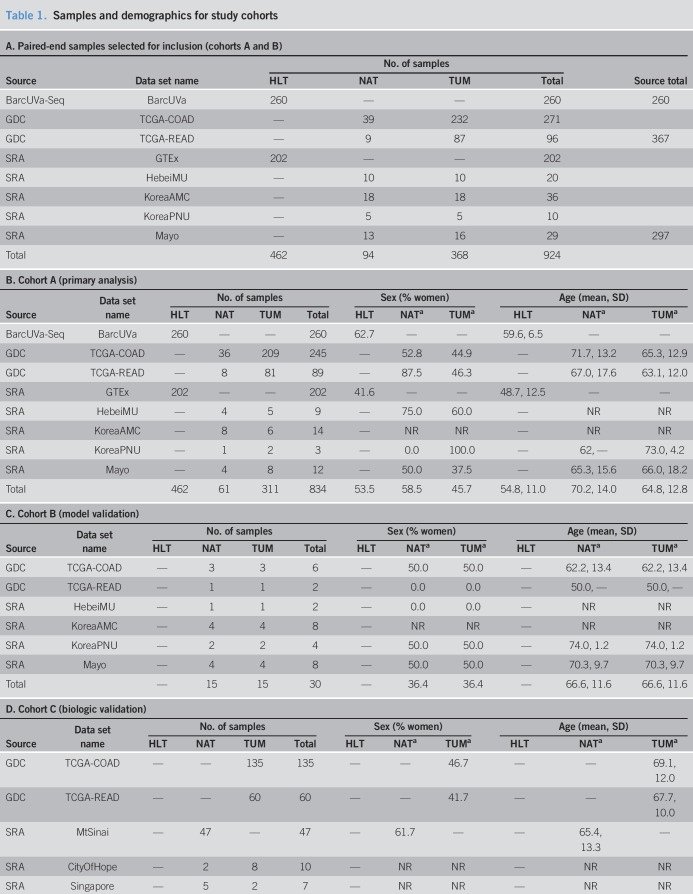
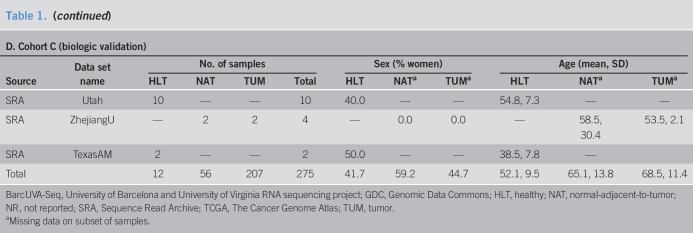
After implementation of a common bioinformatics pipeline as described in the Supplementary Methods (see Supplementary Digital Content 1, http://links.lww.com/CTG/A315), samples with at least 10 million quantified reads (24) were selected (Figures 1 and 2a). For duplicated samples, the one with highest total quasi-mapped reads was selected. A total of 1,199 samples across 14 data sets were retained. Paired-end samples accounted for 924 samples across 8 data sets (Table 1, A), and single-end samples accounted for 275 samples and 6 additional data sets (Table 1, D). Dimension reduction analysis demonstrated that batch effects due to library format could not be adequately modeled with latent factor analysis, so single-end samples were analyzed separately (see Supplementary Methods, Supplementary Digital Content 1, http://links.lww.com/CTG/A315). A primary analysis cohort, cohort A, a methodological validation cohort, cohort B, and a biological validation cohort, cohort C, were created from the retained samples (Table 1 and Figure 1). Details regarding allocation of samples to cohorts is provided in the Supplementary Methods (see Supplementary Digital Content 1, http://links.lww.com/CTG/A315).
Figure 2.
Exploration of data sets. (a) Box plots representing library quality across data sets, where TCGA-COAD and TCGA-READ samples are grouped together. Each ring is a single sample. Library preparation with poly-A tail selection resulted in higher quasi-mapping rates. (b) Scatterplots of tSNE1 and tSNE2 of VST-transformed counts before and after batch adjustment with coloring by data set and phenotype to highlight likely drivers of observed clustering in cohort A. Each point is a sample. (c) Scatterplot of LFC for all shared genes across the study by Aran et al. and this study in the TUM vs NAT and NAT vs HLT sample comparisons; Pearson correlations shown in top left. (d) Hierarchical clustering dendrogram and heatmap of pairwise Euclidean distance between all samples in cohort A. Distances calculated on batch-adjusted counts. HLT, healthy; LFC, log2 fold change; NAT, normal-adjacent-to-tumor; TCGA, The Cancer Genome Atlas; tSNE, tdistributed stochastic neighbor embedding; TUM, tumor; VST, variance stabilizing transformation.
Table 1.
Samples and demographics for study cohorts
Expression analysis
Differential gene expression (DGE) analysis across phenotypes was performed using DESeq2 (25) with phenotype (e.g., healthy, tumor-adjacent, and tumor) and 5 surrogate variables as estimated by SVA (26) to model gene expression in cohorts A and C. No other covariates were included. The model for cohort B included a blocking factor in addition to phenotype to specify within-subject comparisons across samples of different phenotype; no surrogate variables were used. Gene set enrichment analysis was performed using fgsea (27) and the Molecular Signatures Database hallmark gene sets (28). Prediction of key drivers of DGE was performed using binding analysis for regulation of transcription (BART) (29). Significance thresholds were set using Benjamini–Hochberg false discovery rate adjustments with false discovery rate of 5%. Details regarding the choice of tools and support for the choice of 5 surrogate variables are presented in the Supplementary Methods (see Supplementary Digital Content 1, http://links.lww.com/CTG/A315 and Figures SF1 and SF2, Supplementary Digital Content 3, http://links.lww.com/CTG/A317).
RESULTS
Tumor-adjacent tissue represents an intermediate phenotype
To explore the relationship between global gene expression and phenotype in cohort A, unsupervised learning with t-distributed stochastic neighbor embedding was performed. Scatterplots of the t-distributed stochastic neighbor embedding vectors were generated, and clustering by phenotype was observed (Figure 2b). Normal-adjacent-to-tumor (NAT) samples tended to cluster apart from healthy (HLT) and tumor (TUM) samples, as demonstrated previously by Aran et al. (13). However, contrary to the analysis by Aran et al., which included GTEx sigmoid samples without epithelium in the healthy group, a single dominant cluster of HLT samples was found in the pooled data set of this study. To compare the 2 studies quantitatively, scatterplots of log2 fold change per gene shared across the study by Aran et al. and this study were generated. In the TUM vs NAT comparisons, which used many of the same TCGA samples, the 2 analyses were very similar (Pearson correlation r = 0.93, P < 2.20E-16) (Figure 2c). In the NAT vs HLT comparisons, for which this study replaced the GTEx sigmoid cohort in the study by Aran et al. with BarcUVa-Seq samples, the analyses were less consistent (Pearson correlation r = 0.48, P < 2.20E-16) (Figure 2c). The lower correlation coefficient of the NAT vs HLT comparisons underscores the importance of the BarcUVa-Seq cohort. Despite the modest difference in HLT samples, both the analysis of the study by Aran and this study provided evidence for a field effect in the colon that leaves NAT tissue in a molecularly intermediate state between healthy and malignant. Consistent with histologic appearance, NAT samples tended to have a closer relationship to HLT samples than to TUM samples by sample-to-sample distance, but clustering demonstrated the resemblance of NAT samples to both HLT and TUM samples (Figure 2d). To investigate the intermediate state of NAT samples, DGE analysis was performed across phenotypes in cohort A.
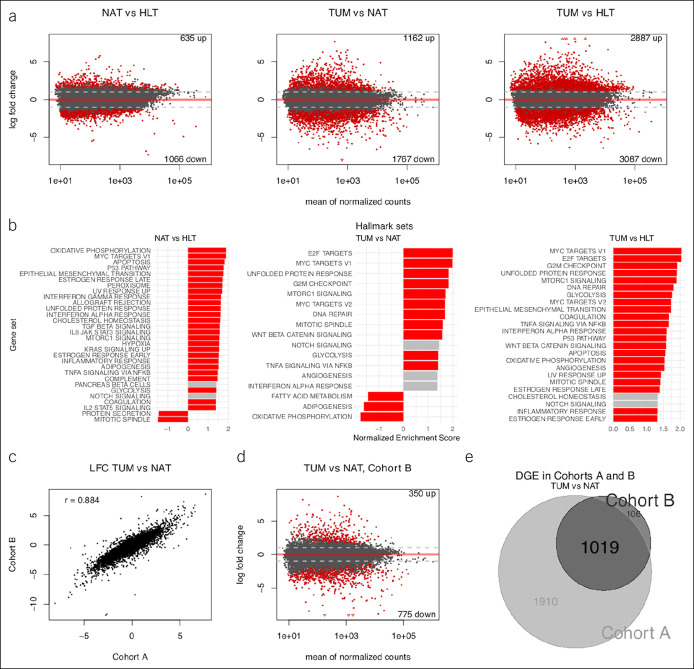
A total of 1,701 genes were differentially expressed between HLT and NAT samples, 2,929 between NAT and TUM samples, and 5,974 between HLT and TUM samples (Figure 3a; see Tables ST2–ST4, Supplementary Digital Content 2, http://links.lww.com/CTG/A316). These results reinforced the relative molecular position of NAT samples between the extremes of healthy and pathologically dysregulated expression. Cohort A was further interrogated with gene set enrichment analysis using hallmark gene sets (Figure 3b; see Table ST5, Supplementary Digital Content 2, http://links.lww.com/CTG/A316). The MYC- and E2F-target gene sets had the 2 highest normalized enrichment scores (NESs) in both the TUM vs NAT and TUM vs HLT comparisons (P-adj = 2.20E-03 for both sets in TUM vs NAT; P-adj = 5.66E-04 for both sets in TUM vs HLT). This result indicated that genes regulated by MYC and E2F tended to be more highly expressed in TUM samples. Surprisingly, MYC targets were also overrepresented in the NAT vs HLT comparison (second highest NES, P-adj = 1.89E-03), indicating higher expression in NAT samples as well.
Figure 3.
Transcriptome-wide comparison across phenotypes. (a) Scatterplots (i.e., MA plots) depicting LFC vs gene expression across phenotypes in cohort A; red demonstrates DGE at FDR 5%. Number of differentially expressed genes shown in top right and bottom right. (b) Bar plots of GSEA results for overrepresentation of hallmark gene sets in DGE results across phenotypes in cohort A; red demonstrates enrichment at FDR 5%. Only hallmark sets with absolute NES >1.3 are shown. Genes were preranked by test statistics from their respective comparisons. (c) Scatterplot of LFC for all shared genes across cohorts A and B in the TUM vs NAT sample comparisons; Pearson correlation shown in top left. (d) MA plot depicting LFC vs gene expression for the TUM vs NAT sample comparison in cohort B; red demonstrates DGE at FDR 5%. (e) Venn diagram demonstrating intersection of DGE lists from the TUM vs NAT sample comparisons in cohorts A and B. DGE, differential gene expression; FDR, false discovery rate; GSEA, gene set enrichment analysis; LFC, log2 fold change; NAT, normal-adjacent-to-tumor; NES, normalized enrichment score; TUM, tumor.
To validate the modeling of batch effects in cohort A, repeated-measures tests were performed on the matched pairs in cohort B. Overall concordance of log2 fold change and test statistics was high between the 2 cohorts (Pearson r = 0.88, P < 2.20E-16 and r = 0.84, P < 2.20E-16, respectively) (Figure 3c), and consistency of DGE results (Figure 3d,e) supported the model of batch effects used for cohort A.
A molecular description of the field effect in CRC
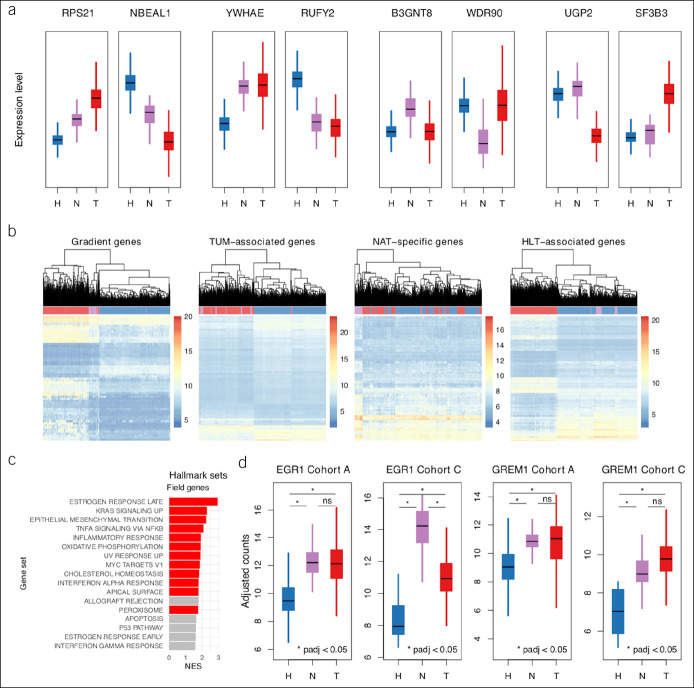
Next, 4 patterns of gene expression in NAT samples relative to the other phenotypes were identified to better characterize DGE in NAT samples. Hierarchical clustering of all samples based on expression levels of genes in each pattern was performed to test the robustness of pattern classification. Pattern definitions and clustering strategies are described in the Supplementary Methods (see Supplementary Digital Content 1, http://links.lww.com/CTG/A315). Gene sets corresponding to HLT-NAT-TUM gradient (61 genes), TUM associated (1,082 genes), NAT specific (172 genes), and HLT-associated expression (2,001 genes) were defined with over- and underexpression combined within each category (Figure 4a). Clustering results confirmed the utility of pattern-based categories (Figure 4b).
Figure 4.
Patterns in gene-level variation. (a) Box plots of batch-adjusted counts for arbitrarily selected genes representative of each of 8 DGE subpatterns aggregated into the following 4 expression patterns: gradient, TUM associated, NAT specific, and HLT associated. (b) Hierarchical clustering dendrograms and heatmaps of gene expression for all samples from cohort A. Clustering based on expression levels of all or top 500 genes from each pattern set, whichever is smaller. Heatmap gene expression levels based on batch-adjusted counts. Genes in each pattern set ordered by adjusted P value from NAT vs HLT sample comparisons. (c) Bar plot of GSEA results for overrepresentation of hallmark gene sets among gradient and TUM-associated genes using test statistics from NAT vs HLT sample comparisons for ranking; red demonstrates enrichment at FDR 5%. Only hallmark sets with absolute NES >1.5 are shown. (d) Box plots of batch-adjusted counts for EGR1 and GREM1, 2 potential drivers of tumorigenesis among field effect genes from cohort A validated in cohort C. DGE, differential gene expression; FDR, false discovery rate; GSEA, gene set enrichment analysis; HLT, healthy; NAT, normal-adjacent-to-tumor; NES, normalized enrichment score; TUM, tumor.
To identify biological processes that could be modulators of malignant potential in NAT tissue, gradient and TUM-associated genes were pooled and evaluated for hallmark gene set enrichment and for predicted transcription factor regulation. Late-phase estrogen response (NES = 2.94, P-adj = 1.63E-02), increased KRAS signaling (NES = 2.30, P-adj = 1.83E-02), epithelial to mesenchymal transition (NES = 2.26, P-adj = 1.83E-02), and TNF-α signaling (NES = 2.08, P-adj = 2.92E-02) were the gene sets with highest enrichment (Figure 4c; see Table ST6, Supplementary Digital Content 2, http://links.lww.com/CTG/A316). Tripartite motif-containing 28 (TRIM28) and SRY-box 2 (SOX2) were the transcription factors with the highest probability of regulatory effect (Irwin-Hall P = 3.29E-05 and P = 5.74E-05, respectively) (see Table ST7, Supplementary Digital Content 2, http://links.lww.com/CTG/A316). Interestingly, TRIM28 and SOX2 were overexpressed in TUM samples (P-adj = 1.47E-28 and P-adj = 1.55E-17, respectively) but not in NAT samples relative to HLT samples.
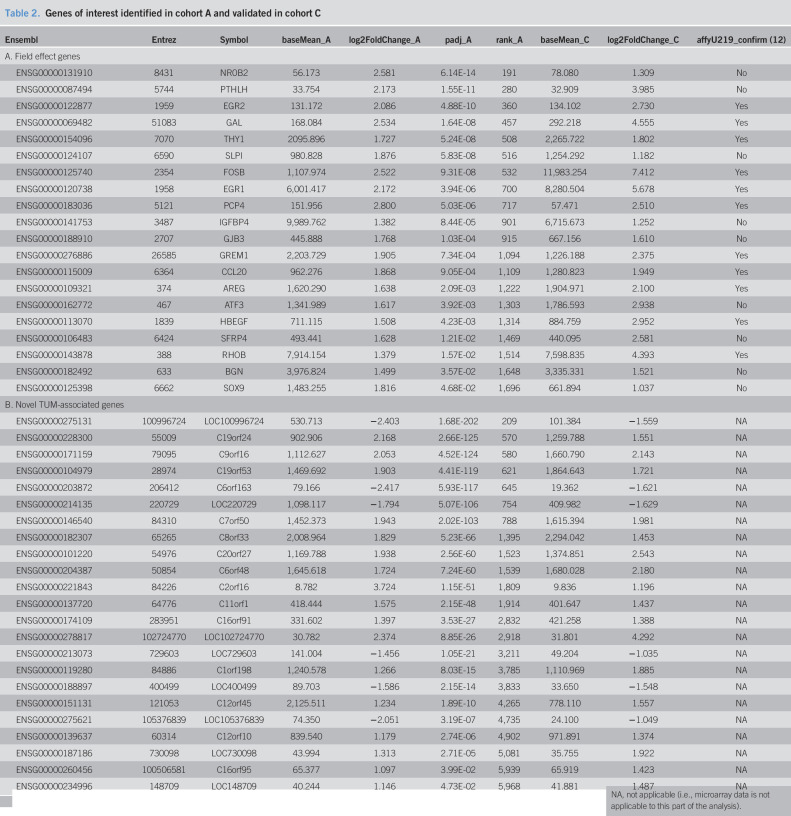
Given established modulatory relationships between the gene sets of highest enrichment and CRC (30–33) and between the predicted transcription factors and CRC (34,35), a representative set of core field effect genes with coherent expression and related biological processes was sought. Genes contributing most to the enrichment scores of the 4 gene sets with highest NES were selected for independent validation as field effect genes. Of the 33 unique genes from the leading edges of the 4 sets, 20 were found to have the same direction of relative expression between NAT and HLT samples in cohort C, as observed in cohort A (Table 2, A). The relative expression of 9 of the 20 reached statistical significance at a transcriptome-wide level in cohort C despite the small number of HLT samples in that cohort. An additional 11 of the 33 had detectable but statistically indeterminate expression in cohort C, as indicated by a test statistic of zero. Only 2 of the 33 varied in the opposite direction in the validation cohort, and neither was statistically significant.
Table 2.
Genes of interest identified in cohort A and validated in cohort C
To ascertain whether age discrepancies across phenotypes biased the effect of phenotype on expression levels of the 20 validated field effect genes, the correlation between age and expression for each of the 20 genes was investigated as detailed in the Supplementary Methods (see Supplementary Digital Content 1, http://links.lww.com/CTG/A315). The effect of age did not seem to bias the effect of phenotype (see Figures SF3 and SF4, Supplementary Digital Content 3, http://links.lww.com/CTG/A317).
Among validated genes, several were recognized as possible drivers of CRC, including amphiregulin (AREG), early growth response 1 and 2 (EGR1 and EGR2, respectively), gremlin-1 (GREM1), and SRY-box 9 (SOX9). Confirmation of these potentially oncogenic expression patterns in NAT samples was sought in another population-scale transcriptome profiling study. Because of the inclusive nature of this mega-analysis, there were no additional RNA-seq data sets available for comparison. However, of the 20 validated field effect genes, 11 had been previously found to be differentially expressed across NAT and HLT samples in the same direction in a microarray data set (Table 2, A, “affyU219_confirm”) (12). The microarray study provided a second level of independent biological validation and a technical validation with a different experimental assay.
A quantitative assessment of the association between field effect and distance from tumor was not possible in this study because of limited information regarding distance from tumor for NAT samples, but a qualitative evaluation was attempted and was inconclusive (see Supplementary Methods, Supplementary Digital Content 1, http://links.lww.com/CTG/A315).
Novel tumor-specific expression
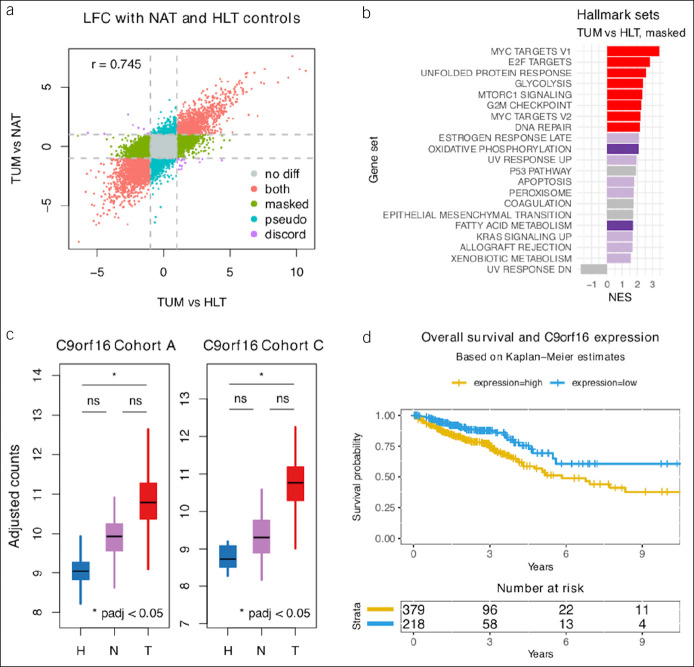
Based on the observation that important biological pathways were dysregulated in NAT samples in TUM-like patterns, the possibility that some TUM-specific molecular features could be masked by field effect was tested as described in the Supplementary Methods (see Supplementary Digital Content 1, http://links.lww.com/CTG/A315). The difference between DGE using NAT and HLT samples as controls in comparisons against TUM samples suggested that the field effect could mask important TUM-specific metabolic features (Figure 5a,b). Furthermore, a set of underannotated genes not previously known to be dysregulated in a TUM-specific pattern was revealed after adjustment for field effect. This set included C9orf16, which was previously shown to be prognostic in CRC (Figure 5c,d). The previously reported prognostic value of C9orf16 was redemonstrated after adjusting for age and tumor stage (P = 2.78E-3) as described in the Supplementary Methods (see Supplementary Digital Content 1, http://links.lww.com/CTG/A315 and Figures SF7 and SF8, Supplementary Digital Content 3, http://links.lww.com/CTG/A317), which the previous report did not show.
Figure 5.
Healthy controls. (a) Scatterplot of transcriptome-wide LFC between TUM and control samples, where control samples are HLT (x axis) or NAT samples (y axis). Colors indicate genes potentially masked (green), misleadingly highlighted (bluish-green), or unaffected (red) by field effect. (b) GSEA results for the 3,856 genes differentially expressed specifically between TUM and HLT and not between TUM and NAT samples; darker colors demonstrate enrichment at FDR 5% in both HLT specific and TUM vs NAT DGE results. Purple and red show discordant and concordant results, respectively. Only hallmark sets with absolute NES >1.5 are shown. (c) Box plots of batch-adjusted counts for C9orf16, 1 of 23 novel TUM-specific genes discovered in this mega-analysis. (d) Overall survival curves for C9orf16 high- and low-expression groups from previously published TCGA data downloaded from the Human Protein Atlas. FDR, false discovery rate; GSEA, gene set enrichment analysis; HLT, healthy; LFC, log2 fold change; NAT, normal-adjacent-to-tumor; NES, normalized enrichment score; TCGA, The Cancer Genome Atlas; TUM, tumor.
DISCUSSION
There is mounting evidence that histologically normal mucosa adjacent to tumors is molecularly distinct from healthy mucosa in the absence of cancer (6–13). The transcriptomic features of that distinction are important for posttreatment surveillance and could also be useful for screening, initial diagnosis, and therapy. In this study, a comprehensive description of transcriptional features in normal-appearing healthy, normal-appearing tumor-adjacent, and tumor colorectal tissue was obtained in a joint analysis of pooled RNA-seq data sets combining a novel cohort with all human colorectal samples available in the Genomic Data Commons and Sequence Read Archive. Tumor-adjacent tissue was found to be more similar to healthy tissue than to cancer tissue in global transcriptional variation. However, tumor-adjacent tissue was found to harbor some transcriptional features of cancer that might be important modulators of malignancy. Furthermore, normal colon mucosa from healthy controls was used to identify novel TUM-specific gene expression.
This study is the largest to date to investigate transcriptome-wide effects of CRC on adjacent, histologically normal mucosa using RNA-seq. The results are the first to demonstrate the consistent overexpression of 20 TUM-associated genes in histologically normal tissue sampled adjacent to tumors. Remarkably, genes contributing to established oncogenic pathways, such as epidermal growth factor receptor (EGFR) signaling (e.g., AREG), early growth response (e.g., EGR1 and EGR2), and stem cell maintenance and differentiation (e.g., GREM1 and SOX9), were among the genes dysregulated in normal-appearing tissue. AREG encodes a ligand of EGFR, which activates signaling pathways that modulate cellular proliferation and apoptosis. EGFR is the target of monoclonal antibodies in the treatment of metastatic CRC, and AREG expression might be a useful biomarker for therapy response in select populations (36). EGR1 and EGR2 are transcription factors involved in regulation of differentiation and apoptosis. EGR1 was shown to promote tumor cell growth in experimental models, and higher expression levels in tumor were associated with decreased disease-free survival in a CRC cohort (37). GREM1 encodes a BMP antagonist ectopically and highly expressed in hereditary mixed polyposis syndrome (38). In healthy tissue, GREM1 is expressed in subepithelial myofibroblasts, and secretion of its protein contributes to maintenance of the stem cell niche at the crypt base by permitting Wnt signaling. Overexpression of GREM1 in histologically normal tissue would be expected to potentiate malignant transformation. SOX9 is also involved in Wnt signaling and epithelial homeostasis and has been shown to affect goblet cell lineage and colonic morphology in mice (39). Dynamic monitoring of expression levels of these genes in unresected tissue could add prognostic information postoperatively.
This study is also the first to identify novel genes associated with CRC that can be consistently masked by the field effect, including 23 genes that, to the authors' knowledge, have not previously been shown to vary in TUM samples compared with control samples. Intriguingly, expression levels of 2 such genes, C9orf16 and C7orf50, were previously associated with overall survival in CRC and pancreatic cancer, respectively (40). Neither the function nor the oncogenic role of either gene is known, making them attractive targets for further characterization. Thus, this study not only provided provocative insights into the molecular features of histologically normal tissue adjacent to tumors but also revealed novel genes dysregulated in CRC for future investigation.
These results are important, because they provide a set of candidate genes that might be useful for determination of distal margins for low-lying rectal cancers and for posttreatment surveillance and they indicate a molecular basis for metachronous lesions in ostensibly normal tissue. Furthermore, they demonstrate that the use of matched tumor–normal pairs in the study of CRC, which is common and has yielded biological insights (41), is, nevertheless, influenced by field effect bias.
Limitations of this study included a potential for batch effects to drive spurious results and insufficient information for quantitative assessment of the spatiotemporal extent of the field effect in CRC. The influence of batch effect was reduced in multiple ways, including implementation of a common bioinformatics pipeline for gene quantification, establishment of appropriate eligibility and inclusion criteria, latent factor estimation with SVA, inclusion of surrogate variables as covariates in primary regression models for cohorts A and C (42), use of curated hallmark gene sets to interpret results, and validation of methods and results in independent cohorts. Determination of the spatiotemporal dimensions of field effect in CRC requires new data and is an important goal of the authors' future work.
CONFLICTS OF INTEREST
Guarantor of the article: Graham Casey, PhD.
Specific author contributions: C.H.D. extracted and processed raw sequencing data and annotation files. C.H.D. and M.D. designed the study, analyzed the data, and wrote the manuscript. V.M. and G.C. designed the protocol for collecting healthy colon biopsies included in the BarcUVa-Seq cohort. S.J.P. extracted RNA from healthy colon biopsies included in the BarcUVa-Seq cohort. V.D.O. processed raw sequencing files for samples included in the BarcUVa-Seq cohort. G.C. and L.T.J. provided guidance on study design and results interpretation. All authors read and approved the final manuscript.
Financial support: Funding for this work was provided by the following NIH Grants: R01 NIH/NCI CA143237 and CA201407 (G.C.), T32 5T32CA163177-07 (Craig Slingluff, MD). This research was supported by the Genomics Core Facility of the CWRU School of Medicine's Genetics and Genome Sciences Department.
Potential competing interests: None to report.
Ethics approval and consent to participate: All publicly available data sets were generated in accordance with local Institutional Review Board requirements, and reanalysis was performed only after appropriate permissions had been granted through dbGaP for controlled-access data. BarcUVa-Seq data were generated from consented subjects in accordance with the University of Barcelona Institutional Review Board requirements, which were approved by the University of Virginia Institutional Review Board.
Availability of data and material: The public data sets supporting the conclusions of this article are available in the Genomic Data Commons and Sequence Read Archive repositories, available at https://portal.gdc.cancer.gov and https://www.ncbi.nlm.nih.gov/sra, respectively. The BarcUVa-Seq data set will be made available in the Sequence Read Archive at the conclusion of the ongoing BarcUVa-Seq project and after associated studies have been published. The curated data set of gene counts and associated technical and clinical annotations generated by the bioinformatics pipeline developed for this study will be made available on Bioconductor and Synapse (ID syn22237139) with protected dbGaP data censored.
Study Highlights.
WHAT IS KNOWN
✓ Metachronous colorectal cancer is a risk to colorectal cancer survivors.
✓ Colonoscopy is recommended for posttreatment surveillance.
WHAT IS NEW HERE
✓ A distinct transcriptomic profile characterizes tumor-adjacent tissue despite normal histologic appearance.
✓ Cancer-related gene expression that might help explain metachronous lesions is present in tumor-adjacent tissue.
✓ Adjustment for field effect can reveal novel tumor-specific gene expression in transcriptome profiling studies.
TRANSLATIONAL IMPACT
✓ Molecular assays could complement colonoscopy in the setting of posttreatment surveillance.
✓ Molecular assays could help define safe distal margin for low-lying rectal cancer.
Supplementary Material
ACKNOWLEDGEMENTS
The results shown here are in part based on data generated by The Cancer Genome Atlas (TCGA) Research Network: https://www.cancer.gov/tcga. The results are also based on data generated by the Genotype-Tissue Expression (GTEx) Project. GTEx was supported by the Common Fund of the Office of the Director of the National Institutes of Health and by NCI, NHGRI, NHLBI, NIDA, NIMH, and NINDS. The data used for the analyses described in this manuscript were obtained from dbGaP accession number phs000424.v7.p2 on 5/6/2019.
The authors are grateful for helpful suggestions on study design and analysis from Aakrosh Ratan and Catherine Robertson from the Center for Public Health Genomics at the University of Virginia. The authors are also grateful to Dr Craig Slingluff from the Department of Surgery at the University of Virginia, whose T32 training grant supported CHD.
Footnotes
SUPPLEMENTARY MATERIAL accompanies this paper at http://links.lww.com/CTG/A315; http://links.lww.com/CTG/A316; http://links.lww.com/CTG/A317
REFERENCES
- 1.Raj KP, Taylor TH, Wray C, et al. Risk of second primary colorectal cancer among colorectal cancer cases: A population-based analysis. J Carcinog 2011;10:6. [DOI] [PMC free article] [PubMed] [Google Scholar]
- 2.Mulder SA, Kranse R, Damhuis RA, et al. The incidence and risk factors of metachronous colorectal cancer: An indication for follow-up. Dis Colon Rectum 2012;55(5):522–31. [DOI] [PubMed] [Google Scholar]
- 3.Lindberg LJ, Ladelund S, Bernstein I, et al. Risk of synchronous and metachronous colorectal cancer: Population-based estimates in Denmark with focus on non-hereditary cases diagnosed after age 50. Scand J Surg 2019;108(2):152–8. [DOI] [PubMed] [Google Scholar]
- 4.Kahi CJ, Boland CR, Dominitz JA, et al. Colonoscopy surveillance after colorectal cancer resection: Recommendations of the US Multi-Society Task Force on Colorectal Cancer. Gastroenterology 2016;150(3):758–68.e11. [DOI] [PubMed] [Google Scholar]
- 5.Fuccio L, Rex D, Ponchon T, et al. New and recurrent colorectal cancers after resection: A systematic review and meta-analysis of endoscopic surveillance studies. Gastroenterology 2019;156(5):1309–23.e3. [DOI] [PubMed] [Google Scholar]
- 6.Braakhuis BJ, Tabor MP, Kummer JA, et al. A genetic explanation of Slaughter's concept of field cancerization: Evidence and clinical implications. Cancer Res 2003;63(8):1727–30. [PubMed] [Google Scholar]
- 7.Slaughter DP, Southwick HW, Smejkal W. “Field cancerization” in oral stratified squamous epithelium. Clinical implications of multicentric origin. Cancer 1953;6(5):963–8. [DOI] [PubMed] [Google Scholar]
- 8.Lochhead P, Chan AT, Nishihara R, et al. Etiologic field effect: Reappraisal of the field effect concept in cancer predisposition and progression. Mod Pathol 2015;28(1):14–29. [DOI] [PMC free article] [PubMed] [Google Scholar]
- 9.Shen L, Kondo Y, Rosner GL, et al. MGMT promoter methylation and field defect in sporadic colorectal cancer. J Natl Cancer Inst 2005;97(18):1330–8. [DOI] [PubMed] [Google Scholar]
- 10.Galandiuk S, Rodriguez-Justo M, Jeffery R, et al. Field cancerization in the intestinal epithelium of patients with Crohn's ileocolitis. Gastroenterology 2012;142(4):855–64.e8. [DOI] [PMC free article] [PubMed] [Google Scholar]
- 11.Hawthorn L, Lan L, Mojica W. Evidence for field effect cancerization in colorectal cancer. Genomics 2014;103(2):211–21. [DOI] [PubMed] [Google Scholar]
- 12.Sanz-Pamplona R, Berenguer A, Cordero D, et al. Aberrant gene expression in mucosa adjacent to tumor reveals a molecular crosstalk in colon cancer. Mol Cancer 2014;13(1):46. [DOI] [PMC free article] [PubMed] [Google Scholar]
- 13.Aran D, Camarda R, Odegaard J, et al. Comprehensive analysis of normal adjacent to tumor transcriptomes. Nat Commun 2017;8(1):1077. [DOI] [PMC free article] [PubMed] [Google Scholar]
- 14.The Cancer Genome Atlas. 2019. Available at: https://www.cancer.gov/tcga. Accessed July 2, 2019. [Google Scholar]
- 15.GTEx Portal. 2019. Available at: https://gtexportal.org/home/. Accessed July 2, 2019.
- 16.Wang Q, Armenia J, Zhang C, et al. Unifying cancer and normal RNA sequencing data from different sources. Sci Data 2018;5:180061. [DOI] [PMC free article] [PubMed] [Google Scholar]
- 17.BBRB-PR-0004-W1-G3 GTEx Organ Retrieval, Dissection, and Preservation Details Table. NCI; 2015. Available at: https://biospecimens.cancer.gov/resources/sops/docs/GTEx_SOPs/BBRB-PR-0004-W1-G3%20GTEx%20Organ%20Retrieval,%20Dissection,%20and%20Preservation%20Details%20Table%20.pdf. Accessed October 1, 2018. [Google Scholar]
- 18.Guinney J, Dienstmann R, Wang X, et al. The consensus molecular subtypes of colorectal cancer. Nat Med 2015;21:1350. [DOI] [PMC free article] [PubMed] [Google Scholar]
- 19.Ma S, Ogino S, Parsana P, et al. Continuity of transcriptomes among colorectal cancer subtypes based on meta-analysis. Genome Biol 2018;19(1):142. [DOI] [PMC free article] [PubMed] [Google Scholar]
- 20.R Core Team. R: A language and environment for statistical computing. Vienna, Austria: R Foundation for Statistical Computing; 2019: Available at: https://www.R-project.org/. [Google Scholar]
- 21.Huber W, Carey VJ, Gentleman R, et al. Orchestrating high-throughput genomic analysis with Bioconductor. Nat Methods 2015;12(2):115–21. [DOI] [PMC free article] [PubMed] [Google Scholar]
- 22.Genomic Data Commons Data Portal. 2019. Available at: https://portal.gdc.cancer.gov/. Accessed October 20, 2018.
- 23.SRA. 2019. Available at: https://www.ncbi.nlm.nih.gov/sra. Accessed January 21, 2019.
- 24.Liu Y, Zhou J, White KP. RNA-seq differential expression studies: More sequence or more replication? Bioinformatics 2014;30(3):301–4. [DOI] [PMC free article] [PubMed] [Google Scholar]
- 25.Love MI, Huber W, Anders S. Moderated estimation of fold change and dispersion for RNA-seq data with DESeq2. Genome Biol 2014;15(12):550. [DOI] [PMC free article] [PubMed] [Google Scholar]
- 26.Leek J, Storey J. Capturing heterogeneity in gene expression studies by surrogate variable analysis. PLoS Genet 2007;3(9):1724–35. [DOI] [PMC free article] [PubMed] [Google Scholar]
- 27.Fast Gene Set Enrichment Analysis (fgsea) [computer program]. Version 1.1.3. CT Lab GitHub Repository (https://github.com/ctlab): GitHub; 2016.
- 28.Liberzon A, Birger C, Thorvaldsdottir H, et al. The Molecular Signatures Database (MSigDB) hallmark gene set collection. Cell Syst 2015;1(6):417–25. [DOI] [PMC free article] [PubMed] [Google Scholar]
- 29.Wang Z, Civelek M, Miller CL, et al. BART: A transcription factor prediction tool with query gene sets or epigenomic profiles. Bioinformatics 2018;34(16):2867–9. [DOI] [PMC free article] [PubMed] [Google Scholar]
- 30.Caiazza F, Ryan EJ, Doherty G, et al. Estrogen receptors and their implications in colorectal carcinogenesis. Front Oncol 2015;5:19. [DOI] [PMC free article] [PubMed] [Google Scholar]
- 31.Amado RG, Wolf M, Peeters M, et al. Wild-type KRAS is required for panitumumab efficacy in patients with metastatic colorectal cancer. J Clin Oncol 2008;26(10):1626–34. [DOI] [PubMed] [Google Scholar]
- 32.Spaderna S, Schmalhofer O, Hlubek F, et al. A transient, EMT-linked loss of basement membranes indicates metastasis and poor survival in colorectal cancer. Gastroenterology 2006;131(3):830–40. [DOI] [PubMed] [Google Scholar]
- 33.Grimm M, Lazariotou M, Kircher S, et al. Tumor necrosis factor-alpha is associated with positive lymph node status in patients with recurrence of colorectal cancer-indications for anti-TNF-alpha agents in cancer treatment. Cell Oncol (Dordr) 2011;34(4):315–26. [DOI] [PubMed] [Google Scholar]
- 34.Takeda K, Mizushima T, Yokoyama Y, et al. Sox2 is associated with cancer stem-like properties in colorectal cancer. Sci Rep 2018;8(1):17639. [DOI] [PMC free article] [PubMed] [Google Scholar]
- 35.Fitzgerald S, Sheehan KM, O'Grady A, et al. Relationship between epithelial and stromal TRIM28 expression predicts survival in colorectal cancer patients. J Gastroenterol Hepatol 2013;28(6):967–74. [DOI] [PubMed] [Google Scholar]
- 36.Stintzing S, Ivanova B, Ricard I, et al. Amphiregulin (AREG) and epiregulin (EREG) gene expression as predictor for overall survival (OS) in oxaliplatin/fluoropyrimidine plus bevacizumab treated mCRC patients-analysis of the phase III AIO KRK-0207 trial. Front Oncol 2018;8:474. [DOI] [PMC free article] [PubMed] [Google Scholar]
- 37.Kim SH, Park YY, Cho SN, et al. Kruppel-like factor 12 promotes colorectal cancer growth through early growth response protein 1. PLoS One 2016;11(7):e0159899. [DOI] [PMC free article] [PubMed] [Google Scholar]
- 38.Jaeger E, Leedham S, Lewis A, et al. Hereditary mixed polyposis syndrome is caused by a 40-kb upstream duplication that leads to increased and ectopic expression of the BMP antagonist GREM1. Nat Genet 2012;44:699–703. [DOI] [PMC free article] [PubMed] [Google Scholar]
- 39.Bastide P, Darido C, Pannequin J, et al. Sox9 regulates cell proliferation and is required for Paneth cell differentiation in the intestinal epithelium. J Cell Biol 2007;178(4):635–48. [DOI] [PMC free article] [PubMed] [Google Scholar]
- 40.Uhlen M, Zhang C, Lee S, et al. A pathology atlas of the human cancer transcriptome. Science 2017;357(6352):eaan2507. [DOI] [PubMed] [Google Scholar]
- 41.Ongen H, Andersen CL, Bramsen JB, et al. Putative cis-regulatory drivers in colorectal cancer. Nature 2014;512(7512):87–90. [DOI] [PubMed] [Google Scholar]
- 42.Nygaard V, Rødland EA, Hovig E. Methods that remove batch effects while retaining group differences may lead to exaggerated confidence in downstream analyses. Biostatistics 2015;17(1):29–39. [DOI] [PMC free article] [PubMed] [Google Scholar]
Associated Data
This section collects any data citations, data availability statements, or supplementary materials included in this article.


