

Abstract
Saudi Arabia is in a tropical geographical region with a population that has access to adequate diet. There is, however, a high level of vitamin D deficiency in the Kingdom, comorbid with other disease. There is the postulation of a correlation between a healthy gut microbiota and balanced levels of serum vitamin D. This investigation looks into the effect of vitamin D supplementation on the gut flora of laboratory-bred mice as well as any possible association on body weight. BALB/C mice weighing between 34 and 35.8 g were divided into 4 groups and placed on daily doses of vitamin D of 3.75 µg (low dose), 7.5 µg (normal dose), and 15 µg (high dose). The fourth group was the control group that did not receive any supplementation with vitamin D. Body weights were monitored on weekly basis, while faecal samples from the rectum were obtained for microbial culturing and the monitoring of bacterial colony count using the Vitek 2 Compact automated system (BioMerieux, Marcy-l’Etoile, France) according to manufacturer’s guidelines. The data presented as mean ± SD, while significant differences were determined with 2-way analysis of variance in comparing differences within and between treatment groups. The different doses of vitamin D showed varying effects on the body weight and gut microbial colonies of the mice. There was a highly significant difference between the control, 15 µg (high), and 7.5 µg (normal) dose groups. This is suggestive that supplementation with vitamin D could a role in the gut microbial flora in the gut which could reflect in changes in body weight.
Keywords: Vitamin D, gut microbiota, body weight
Introduction
An endocrine hormone produced at exposure to a specific UVB wavelength of the sun, vitamin D, assists in the functioning of some endocrine system inclusive of feeding.1 There is also the suggestion of a possible association between vitamin D and intestinal microbiome. This is because during the winter months, some bacterial species are favoured when levels of vitamin D are lowered, thus promoting weight gain.1 However, as vitamin D levels increased during the summer months, it is postulated that growth of healthy gut bacterial species would be favoured.1 This could lead to a subsequent weight loss.1 High levels of vitamin D deficiency is reported globally inclusive of Saudi Arabia2 even among healthy individuals. Al-Alyani et al3 reported that vitamin D deficiency was 30% among Saudi Arabia population between 1983 and 1984. The same study queried the 100% deficiency reported by other researchers for the same region in later years.2,4 Their research attributed this query to the fact that major cities in the Kingdom of Saudi Arabia are in the tropics with appropriate sunshine and that the fact that the population is on an adequate diet, the reported 100% deficiency was not realistic.3
The importance of vitamin D in human health is receiving global attention due to deficiencies of the vitamin being linked to numerous diseases.5-7 Also the role of the gut microbiome has received much attention in recent times. This is because changes in the human intestinal microbiome have been associated with many chronic diseases all of which have been associated with deficiency of vitamin D.8-11
One of the attributed reasons for vitamin D deficiency is sedentary life style, which is generally a risk factor for many chronic diseases such as obesity,12 and it is reported that gut bacteria play an important role in the regulation of human health system.13,14 In one of the reports, the role of vitamin D receptor (VDR) in affecting the microbiome was highlighted.13 They were of the view that dietary vitamin D was crucial for a healthy state with VDR involved in many body functions through distinct effector molecules. They indicated that the progress they had made in establishing the association between microbiome vitamin D/VDR in disease and inflammation was encouraging. The report also pointed to the need for more concise and detailed investigations in this aspect of research which could provide new opportunities for the prevention and treatment of metabolic diseases.13 However, while researchers are looking at deficiency in vitamin D and its links to numerous diseases, literature is minimal on details of how this endocrine hormone could affect the gut microbiome and consequently possible changes in body weight. With obesity on a global increase, researchers have been reporting a link between vitamin D deficiency–associated obesity and other health problems.15,16 Studies have shown that higher body weight and higher fat mass are linked to vitamin D deficiency.17 There is need for a closer look at the relationship between varying levels of vitamin D as it affects the gut microbiome. This could be a leading gateway in preventing or controlling chronic metabolic diseases that are currently of major public health concern. The present investigation therefore looks at the effect of supplementation with different doses of vitamin D on laboratory-bred mice to ascertain any possible correlation between it, the gut microbiome, and body weight.
Materials and Methods
Ethical approval: the research and ethics committee of the College of Medicine, King Faisal University approved the research (approval number 200919B).
Animals and their sources
BALB/C male mice of 8 to 12 weeks old with mean weights 34 to 35.8 g were used for the investigation. They were from the animal house of the College of Medicine and had been kept in line with the ethical policy of King Faisal University on the use of laboratory-bred animals. The animals were in groups of 5, in well-ventilated cages according to internationally recommended principles for the use and care of laboratory animals as found in the National Institute of Health Guidelines for the care of laboratory animals.18 They were allowed 12 hours of day light, 12 hours of dark cycle as well as being allowed free access to standard normal mice chow and water (Supplementary data for chow composition). On selection, they were monitored for 2 weeks before the start of the experiment.
Calculation of vitamin D dosage and experimental procedure
Vitamin D3 concentrations were prepared according to the method of Hummel et al,19 with modifications, as mice were observed to drink approximately 10 mL of water per day, in 0.375, 0.75, and 1.5 µg/mL concentrations. Therefore, daily doses were 3.75, 7.5, and 15 µg/d, respectively, representing 150, 300, and 600 IU of vitamin D per day. These doses were presented as low (0.375 µg/mL), normal (0.75 µg/mL), and high dosages (1.5 µg/mL).19
A total of 20 mice used for the investigation were placed in cages consisting of 5 mice each. They were divided into the following treatment groups: low dose which received daily low doses of vitamin D, normal vitamin D dose supplementation group, the third group which received daily high doses of vitamin D3, and the final group was the control group which did not receive vitamin D3 supplementation. Individual weights of mice were measured using an electronic balance to the nearest 0.1 g. Weights were monitored and recorded on weekly basis for the period of 8 weeks until euthanised.20,21
Collection of sample for microbiome analysis
Faecal samples were collected from each mouse in the group at week 0, the start of vitamin D supplementation, and 8 weeks later according to the method described by Ericsson et al,22 with modifications. In addition, samples from the rectum of each mouse were collected from all the groups at baseline and at week 8 with sterile inoculating loop (10 μL).
They were finally euthanised by cervical dislocation for the collection and assay of faecal microbiota.
Bacteria colony count
Manual counting of bacteria colony-forming units was done using a hand counter and a dissecting microscope.23 Plate covers were partitioned for the counting with the counted colonies marked with a pen on the cover of each plate. The identification and characterisation of microbial colonies were done with the Vitek Compact 2 with all bacterial isolates grouped into the following: gram-positive bacteria, gram-negative (Escherichia coli), gram-negative anaerobic bacilli (Bacteroidetes), and Salmonella/Shigella.
Microbial analysis of faecal samples
Collected faecal samples were inoculated into nutrient broth and cultured at 37°C for 24 hours. Two nutrient broth samples were prepared per inoculum, one incubated aerobically (aerobic incubator) and the second anaerobically in a CO2 incubator (10% CO2) for 24 hours. Overnight growth was plated out on the following selective media: Salmonella/Shigella agar, blood, MacConkey, and chocolate agars in duplicates. One set of plates were incubated aerobically, whereas the other set anaerobically for 24 hours. Colony counts were performed using the spread agar plate method24,25 with microbial colonies identified phenotypically. Basic bacteriological techniques were used for the preparation of pure colonies with the isolated bacteria identified with the Vitek 2 Compact automated system (BioMerieux) according to manufacturer’s guidelines using the ID cards. The identified bacterial colonies were counted and placed in the groups of Bacteroidetes, Firmicutes, Actinobacteria, and Gammaproteobacteria.
Statistical analysis
Data analysis was performed using Prism version 8.2.3 (GraphPad Software) and presented as mean ± SD, unless otherwise indicated. Significant differences were determined using 2-way analysis of variance (ANOVA) to compare differences within treatment groups and between groups for weight changes. Furthermore, covariate analysis was done by SPSS to confirm the association between dosage groups in terms of weight changes. Two-way ANOVA was used to determine significant differences of microbial colony counts among treatment groups.
Results
Weekly observations on weight changes
Results on mean weekly weight observation for all groups of mice are presented in Figure 1. The figure shows the mean weight ± SD at baseline and for each week of the intervention according to treatment groups. Mice receiving the normal dose of vitamin D showed a significant decrease in mean weight at baseline and at week 8 (mean change: −5.6 g; 95% CL: 3.495-6.555, P = .0001). No other treatment groups showed a significant change in weight (Table 1). All groups showed variations in weight during the period of observations. At the end of the intervention, mice that received normal or high doses of vitamin D had significantly lower mean weights than those of the control group (Supplementary data). In Table 1, we present mean weights of control and treatment groups.
Figure 1.
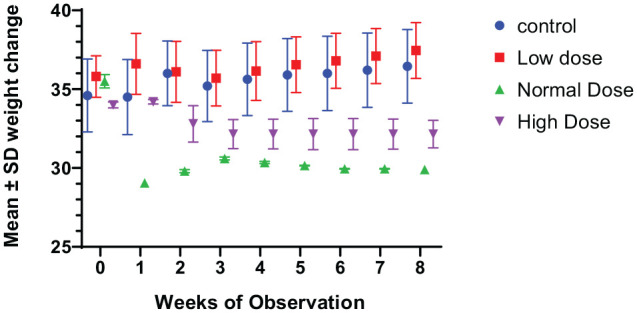
Weekly changes in weight among the vitamin D–supplemented (low, normal, high) and control groups.
Table 1.
Showing mean weight changes ± SEM at weeks 0 and 8 post supplementation with different doses of vitamin D.
| Treatment group | Initial mean weight, g | Final mean weight, g | Mean weight change, g | P value | Percentage weight change |
|---|---|---|---|---|---|
| Control | 34.6 ± 6.9 | 36.45 ± 6.8 | 1.8 | .9382 | 5.06 |
| Low dose | 35.8 ± 3.96 | 37.45 ± 5.30 | 1.65 | .9849 | 4.6 |
| Normal dose | 35.5 ± 1.27 | 29.9 ± 0.28* | −5.6 | .0335* | −15.7 |
| High dose | 34 ± 0.57 | 32.15 ± 2.76 | −1.85 | .4512 | −5.4 |
represents P < 0.05.
Gut bacteria colony count
The results on mean colony count of gut bacteria on selective agars are presented in Figure 2. Mean number of gram-positive gut bacteria colonies was seen to slightly increase in all groups but more in the treated groups. This difference is considered not to be quite statistically significant. Gram-negative gut bacteria colonies observed on MacConkey agar showed an increase in the number of counted colonies in all groups inclusive of the control groups. There was a statistically significant difference between the low and high vitamin D dosage groups. However, a non-statistically significant increase was seen in the group that had received the normal vitamin D supplementation. On the Salmonella/Shigella agar, the results showed that supplementation with low and high doses led to an increase in the mean number of bacterial colonies.
Figure 2.

Overall mean colony count on selective media with different doses of vitamin D.
P < .05.
Observation, however, differed among the control untreated group and those placed on normal daily doses which showed difference at baseline and the final count. A similar pattern is seen with colonies of Bacteroidetes gut bacteria (Figure 2). In terms of bacterial species, the results in Figure 3 is a comparison in mean percentages of colonies for E coli, Pseudomonas aeruginosa, and Salmonella/Shigella spp. In the control untreated group of mice and those placed on low levels of daily doses of vitamin D, there were no significant differences at baseline and at week 8 for all bacterial species. Differences between the control and those that had received normal dose were statistically significant with a P value of .0045, whereas differences between the low- and high-dose supplemented groups were not significant with P values of .08 and .26, respectively.
Figure 3.

Comparison of mean gut colonies of bacterial species ± SD of gut colonies by different treatment groups.
0 = Baseline, 8 = Week 8. Control = without vitamin D supplementation; low dose = 0.375 µg/mL; normal = 0.75 µg/mL; high dose = 1.5 µg/mL. *P < .0045.
The overall percentage changes in the colonies of Salmonella/Shigella species, P aeruginosa, and E coli for all groups at baseline and at the finishing of the investigation showed a decrease in the low- and normal-dose vitamin D groups. The only observed reduction was with Salmonella/Shigella species seen in the high-dose vitamin D group. Changes in gut bacteria species increased significantly at baseline and at week 8 for the control group (Figure 3).
Discussion
Supplementation with vitamin D as low, normal, or high dose is seen in this investigation to have led to some changes in body weight of the experimental mice at varying degrees. The low-dose group showed no statistically significant difference in weight at baseline up to week 8 when the experiment was terminated. Similar findings had been reported26 that insufficiency in vitamin D did not result to weight gain in obese or lean mice. The researchers, therefore, concluded that low levels of vitamin D were not associated with weight gain in their laboratory mice.26 However, contrary to these reports are those of other researchers27,28 who found that diet-induced deficiency of vitamin D in mice led to a gain in weight and attributed this to the fact that the mice in their experiments were resistant to high-fat food diet and thus gained weight. These reports, therefore, suggest differences in laboratory findings on laboratory-bred mice. Such variations in results could be attributed to reasons that include the age of mice, duration of administration of vitamin D, diet type, as well as alterations in diet.26 However, in numerous human clinical studies,29-32 insufficiency in vitamin D is associated with weight gain. These reports while associating low levels of vitamin D to gain weight also indicated that normal levels of the vitamin would promote loss of weight. A clinical trial study33 reported significant decrease after 6 weeks of intervention with vitamin D. The research suggested an association between vitamin D and body weight that could probably explain the results seen in the present investigation. There are, however, general controversies in literature on the effect of insufficiency in vitamin D and its association with weight gain. Due to these varying reports, it was suggested that there should be well-laid foundations in defining the efficacy of vitamin D supplementation in therapeutic options aimed at weight loss.34 In the present investigation, that there were no significant weight changes in the group that received low vitamin D supplementation probably suggests the that normal balanced levels of this vitamin could be needed to initiate any meaningful changes in body weight. However, more detailed investigations would be needed to confirm or refute the probable effective therapeutic options.35
In this investigation, normal dose of vitamin D supplementation led to a sharp decrease in weight within 7 days of the administration of daily doses with body weight at week 8 remaining lower than the starting weight. This suggests the possibility that adequate levels of vitamin D might be needed to lose weight but to a certain degree. This is because in this group there were no noticeable changes in weight between weeks 3 and 8. This suggests the possibility of stabilisation in weight which might be as a result of consistent levels of vitamin D in which the body composition was not modulated a view earlier expressed by other researchers.26,36 These researchers reported that during consistent levels of vitamin D, the body composition is not modulated. As such, it could be assumed that at week 3 post supplementation, consistent levels of vitamin D would have been attained leading to no further changes in body weight as seen in this study. There is also the possibility of an interplay between other contributory factors and these would have led to either weight gain or otherwise. One of such interplays of contributory factors is those between vitamin D and its effect on parathyroid.36 In this study, that the final body weights of the normal and overdose vitamin D groups remained lower than the initial starting weights could indicate initial changes in weights at the start of supplementation that stabilised between weeks 3 and 8. However, that the differences in mean weights of the normal- and high-dose groups were not statistically significant could imply that high supplementation did not significantly increase the levels of vitamin D to further effect weight changes beyond the normal as earlier suggested.27,37 Another contributory factor to non-significant changes in this group could also be attributed to duration in time of vitamin D supplementation.26 It was reported26 that changes at week 16 among lean mice on high doses of vitamin D remained inconsistent leading to no specific conclusions. However, the fact that significant reduced levels of vitamin D in humans38,39 were associated with obesity, it would have been expected that mice place on a high supplementation dose would have lost more weight than in all the other experimental groups. As this was not the case seen in this study suggests the possibility of weight loss being associated with normal levels of vitamin D as well as factors created by its consistency.
Another contributory factor could also be the possibility of an interplay in alterations in gut microbiome resulting from different vitamin D levels which could have subsequently resulted in changes in body weight.40 This investigation showed variations in gut bacteria between the treated and untreated groups with changes differing in gut bacteria species. Earlier suggestions40 are that low doses of the vitamin led to alterations in faecal microbiome composition in mice. These findings were explained to be due to the ability of the vitamin to alter the permeability of the intestinal epithelia. This leads to factors in body metabolism that could subsequently facilitate weight gain as well as the ability to fight diseases.40 Bashir et al20 observed that high vitamin D doses led to massive changes in gut microbiome with decreases in Gammaproteobacteria (Pseudomonas, E coli, and Shigella) species in upper gastro-intestinal tract (GIT). Their findings are contrary to those of the present report where there was a significant increase of gram-negative Proteobacteria (E coli) in all treatment groups as compared with the control group. In other human studies, certain Firmicutes (Staphylococcus) or Proteobacteria (E coli) were found to increase in number with vitamin D supplementation.41 With other reports42 associating obesity with the ratio of Firmicutes/Bacteroidetes, the interplay between vitamin D and the gut microbiome is further highlighted. The resulting changes could affect the body metabolism and subsequently reflect on body weight.
Generally, the gut microbiome of mammals is divided into 4 phyla. Among the gram-negative bacteria are Bacteroidetes and Proteobacteria, whereas those in the gram-positive are Actinobacteria and Firmicutes.43 It is postulated that alterations in quantity between these groups of gut bacteria could lead to changes in body weight with the possibility of such alterations resulting from differing vitamin D levels.
The result in this investigation showed a significant increase of species of Salmonella/Shigella and gram-negative anaerobic bacilli in the low- and high-dose vitamin D treatment groups, whereas these bacterial species were seen to either decrease or remained stable in the normal supplementation group. This therefore suggests that the gut microbiome was either altered or regulated by normal vitamin D doses. Reports, however, differ as some observations44 indicated that increase in quantities of Bacteroidetes, Firmicutes, and Gammaproteobacteria was encountered in vitamin D–deficient mice. Thus, that Firmicutes were not significantly increased in this investigation could probably be due to vitamin D consistent levels whereby no longer modulating the gut microbiome of this group of bacteria.45 There is also the possibility that this vitamin acted on the Firmicutes’ composition of the gut microbiome resulting in no significant changes as earlier reported.46 Also, a similar observation in humans47 suggested that alterations in gut microbiome could be due to low levels of vitamin D, suggesting that different supplementation doses will affect the gut microbiome in one way or another. Gain or loss of weight could therefore be attributed to differences in gut bacteria as seen in the present investigation as earlier noted.48 That the normal dose of vitamin D–supplemented group lost weight could be due to the ratios of Firmicutes and Bacteroidetes that either increased or remained stable. However, reports on changes in gut microbiota of humans supplemented with vitamin D differ. Some researchers49 reported lower rates of Firmicutes and Bacteroidetes in obese patients, whereas others50 associated weight gain to reduced Bacteroidetes and increased Firmicutes. While dominancy of Firmicutes had been demonstrated in lean and obese individuals,51 the Bacteroidetes were seen to be significantly enriched in obese patients.52-54
The present report, therefore, suggests that the gut microbiome could be altered by different levels of vitamin D, an information that could be beneficial to health care providers in the management of patients with GIT disease. More so, as other research works have highlighted the fact that a shift in the intestinal microbial composition results from low vitamin D levels could be a contributory factor to many GIT diseases.55,56
Limitations of the study
One of the limitations of this study is not having evaluated serum levels of vitamin D in groups. Although our main goal was to study the microbial count in mice administered with different doses of vitamin D, it would have been useful for completeness to also dose this vitamin in the blood. In addition, as we observed weight loss, we could also examine the lipid profile.
Supplemental Material
Supplemental material, Supplementary_Data_Chow_composition_xyz4028321b287b6 for Vitamin D Supplementation in Laboratory-Bred Mice: An In Vivo Assay on Gut Microbiome and Body Weight by Lorina Ineta Badger-Emeka, Zainab Yaseen AlJaziri, Cereen Fahad Almulhim, Asma Saleh Aldrees, Zainab Hamzah AlShakhs, Reem Ibrahim AlAithan and Fatimah Abdullah Alothman in Microbiology Insights
Acknowledgments
Researchers would like to acknowledge Dr Promise Emeka for his contributions in the study. We would like to thank Hajer Salman Al-Dehailan, Nouf Khaled Al-Humini, Fatimah Ahamd Al-Najja for their technical assistance.
Footnotes
Funding:The author(s) received no financial support for the research, authorship, and/or publication of this article.
Declaration of conflicting interests:The author(s) declared no potential conflicts of interest with respect to the research, authorship, and/or publication of this article.
Author Contributions: LIB-E developed the research concept, involved in all laboratory experiment, statistical data analysis, and writing of the article. ZYA, CFA, ASA, ZHA, RIA, and FAA were involved in laboratory experiments, collection of data, literature search, and review of the article.
ORCID iD: Lorina Ineta Badger-Emeka  https://orcid.org/0000-0002-9201-6215
Supplemental Material: Supplemental material for this article is available online.
References
- 1. Gominak SC. Vitamin D deficiency changes the intestinal microbiome reducing B vitamin production in the gut. The resulting lack of pantothenic acid adversely affects the immune system, producing a ‘pro-inflammatory’ state associated with atherosclerosis and autoimmunity. Med Hypotheses. 2016;94:103-107. doi: 10.1016/j.mehy.2016.07.007. [DOI] [PubMed] [Google Scholar]
- 2. Alsuwadia AO, Farag YM, Al Sayyari AA, et al. Prevalence of vitamin D deficiency in Saudi adults. Saudi Med J. 2013;34:814-818. http://www.jfcmonline.com/text.asp?2018/25/1/1/222261. [PubMed] [Google Scholar]
- 3. Al-Alyani H, Al-Turki HA, Al-Essa ON, Alani FM, Sadat-Ali M. Vitamin D deficiency in Saudi Arabians: a reality or simply hype: a meta-analysis (2008-2015). J Family Community Med. 2018;25:1-4. http://www.jfcmonline.com/text.asp?2018/25/1/1/222261. [DOI] [PMC free article] [PubMed] [Google Scholar]
- 4. Ardawi MS, Sibiany AM, Bakhsh TM, Qari MH, Maimani AA. High prevalence of vitamin D deficiency among healthy Saudi Arabian men: relationship to bone mineral density, parathyroid hormone, bone turnover markers, and lifestyle factors. Osteoporos Int. 2012;23:675-686. doi: 10.1007/s00198-011-1606-1. [DOI] [PubMed] [Google Scholar]
- 5. Gominak SC, Stumpf WE. The world epidemic of sleep disorders is linked to vitamin D deficiency. Med Hypotheses. 2012;79:132-135. doi: 10.1016/j.mehy.2012.03.031. [DOI] [PubMed] [Google Scholar]
- 6. Reynolds JA, Haque S, Williamson K, Ray DW, Alexander MY, Bruce IN. Vitamin D improves endothelial dysfunction and restores myeloid angiogenic cell function via reduced CXCL-10 expression in systemic lupus erythematosus. Sci Rep. 2016;1:22341. http://refhub.elsevier.com/S0306-9877(16)30350-4/h0015. [DOI] [PMC free article] [PubMed] [Google Scholar]
- 7. Lin Z, Li W. The roles of vitamin D and its analogs in inflammatory diseases. Curr Top Med Chem. 2016;16:1242-1261. doi: 10.2174/1568026615666150915111557. [DOI] [PubMed] [Google Scholar]
- 8. Faith JJ, Guruge J, Charbonneau M, et al. The long-term stability of the human gut microbiota. Science. 2013;341:1237439. doi: 10.1126/science.1237439. [DOI] [PMC free article] [PubMed] [Google Scholar]
- 9. Frosali S, Pagliari D, Gambassi G, Landolfi R, Pandolfi F, Cianci R. How the intricate interaction among toll-like receptors microbiota and intestinal immunity can influence gastrointestinal pathology. J Immunol Res. 2015;2015:489821. http://refhub.elsevier.com/S0306-9877(16)30350-4/h0075. [DOI] [PMC free article] [PubMed] [Google Scholar]
- 10. Griffin JL, Wang X, Stanley E. Does our gut microbiome predict cardiovascular risk? a review of the evidence from metabolomics. Circ Cardiovasc Genet. 2015;8:187-191. doi: 10.1161/CIRCGENETICS.114.000219. [DOI] [PMC free article] [PubMed] [Google Scholar]
- 11. Gregory JC, Buffa JA, Org E, et al. Transmission of atherosclerosis susceptibility with gut microbial transplantation. J Biol Chem. 2015;290:5647-5660. http://refhub.elsevier.com/S0306-9877(16)30350-4/h0085. [DOI] [PMC free article] [PubMed] [Google Scholar]
- 12. BinSaeed AA, Torchyan AA, AlOmair BN, et al. Determinants of vitamin D deficiency among undergraduate medical students in Saudi Arabia. Eur J Clin Nutr. 2015;69:1151-1155. http://www.jfcmonline.com/text.asp?2018/25/1/1/222261. [DOI] [PubMed] [Google Scholar]
- 13. Bakke D, Chatterjee I, Agrawal A, Dai Y, Sun J. Regulation of microbiota by vitamin D receptor: a nuclear weapon in metabolic diseases. Nucl Receptor Res. 2018;5:101377. doi: 10.11131/2018/101377. [DOI] [PMC free article] [PubMed] [Google Scholar]
- 14. Yamada T, Takahashi D, Hase K. The diet-microbiota-metabolite axis regulates the host physiology. J Biochem. 2016;160:1-10. doi: 10.1093/jb/mvw022. [DOI] [PubMed] [Google Scholar]
- 15. Petrov ME, Lichstein KL. Differences in sleep between black and white adults: an update and future directions. Sleep Med. 2016;18:74-81. doi: 10.1016/j.sleep.2015.01.011. [DOI] [PubMed] [Google Scholar]
- 16. Chen X, Wang R, Zee P, et al. Racial/ethnic differences in sleep disturbances: the multi-ethnic study of atherosclerosis. Sleep. 2015;38:877-888. doi: 10.5665/sleep.4732. [DOI] [PMC free article] [PubMed] [Google Scholar]
- 17. De Pergola G, Martino T, Zupo R, et al. 25 hydroxyvitamin D levels are negatively and independently associated with fat mass in a cohort of healthy overweight and obese subjects. Endocr Metab Immune Disord Drug Targets. 2019;19:838-844. doi: 10.2174/1871530319666190122094039. [DOI] [PMC free article] [PubMed] [Google Scholar]
- 18. Committee on Care Use of Laboratory Animals, Institute of Laboratory Animal Resources. Guide for the Care and Use of Laboratory Animals (DHEW Publ. No. (NIH) 78-123). Washington, DC: National Research Council; 1978. https://grants.nih.gov/grants/olaw/guide-for-the-care-and-use-of-laboratory-animals_prepub.pdf. [Google Scholar]
- 19. Hummel DM, Thiem U, Höbaus J, et al. Prevention of preneoplastic lesions by dietary vitamin D in a mouse model of colorectal carcinogenesis. J Steroid Biochem Mol Biol. 2013;136:284-288. doi: 10.1016/j.jsbmb.2012.09.003. [DOI] [PMC free article] [PubMed] [Google Scholar]
- 20. Bashir M, Prietl B, Tauschmann M, et al. Effects of high doses of vitamin D3 on mucosa-associated gut microbiome vary between regions of the human gastrointestinal tract. Eur J Nutr. 2016;55:1479-1489. doi.org10.1007/s00394-015-0966-2. [DOI] [PMC free article] [PubMed] [Google Scholar]
- 21. Assa A, Vong L, Pinnell LJ, Avitzur N, Johnson-Henry KC, Sherman PM. Vitamin D deficiency promotes epithelial barrier dysfunction and intestinal inflammation. J Infect Dis. 2014;210:1296-1305. doi: 10.1093/infdis/jiu235. [DOI] [PubMed] [Google Scholar]
- 22. Ericsson AC, Gagliardi J, Bouhan D, Spollen WG, Givan SA, Franklin CL. The influence of caging, bedding, and diet on the composition of the microbiota in different regions of the mouse gut. Sci Rep. 2018;8:4065. doi: 10.1038/s41598-018 https://www.nature.com/articles/s41598-018-21986-7. [DOI] [PMC free article] [PubMed] [Google Scholar]
- 23. Brugger SD, Baumberger C, Jost M, Jenni W, Brugger U, Mühlemann K. Automated counting of bacterial colony forming units on agar plates. PLoS ONE. 2012;7:e33695. doi: 10.1371/journal.pone.0033695. [DOI] [PMC free article] [PubMed] [Google Scholar]
- 24. Puchkov E. Image analysis in microbiology: a review. J Comput Comm. 2016;4:8-32. doi: 10.4236/jcc.2016.415002. [DOI] [Google Scholar]
- 25. Sousa AM, Machado I, Nicolau A, Pereira MO. Improvements on colony morphology identification towards bacterial profiling. J Microbiol Methods. 2013;95:327-335. doi: 10.1016/j.mimet.2013.09.020. [DOI] [PubMed] [Google Scholar]
- 26. Seldeen KL, Pang M, Rodríguez-Gonzalez M, et al. A mouse model of vitamin D insufficiency: is there a relationship between 25(OH) vitamin D levels and obesity? Nutr Metab. 2017;14:26. doi: 10.1186/s12986-017. [DOI] [PMC free article] [PubMed] [Google Scholar]
- 27. Bastie CC, Gaffney-Stomberg E, Lee TW, Dhima E, Pessin JE, Augenlicht LH. Dietary cholecalciferol and calcium levels in a Western-style defined rodent diet alter energy metabolism and inflammatory responses in mice. J Nutr. 2012;142:859-865. [DOI] [PMC free article] [PubMed] [Google Scholar]
- 28. Liu XJ, Wang BW, Zhang C, et al. Vitamin D deficiency attenuates high-fat diet-induced hyperinsulinemia and hepatic lipid accumulation in male mice. Endocrinology. 2015;156:2103-2113. [DOI] [PubMed] [Google Scholar]
- 29. Gallagher JC, Yalamanchili V, Smith LM. The effect of vitamin D supplementation on serum 25(OH)D in thin and obese women. J Steroid Biochem Mol Biol. 2013;136:195-200. doi: 10.1016/j.jsbmb.2012.12.003. [DOI] [PMC free article] [PubMed] [Google Scholar]
- 30. Vanlint S. Vitamin D and obesity. Nutrients. 2013;5:949-956. doi: 10.3390/nu5030949. [DOI] [PMC free article] [PubMed] [Google Scholar]
- 31. Farrell SW, Willis BL. Cardiorespiratory fitness, adiposity, and serum 25-dihydroxyvitamin D levels in women: the Cooper Center Longitudinal Study. J Womens Health. 2012;21:80-86. [DOI] [PubMed] [Google Scholar]
- 32. Lee P, Greenfield JR, Seibel MJ, Eisman JA, Center JR. Adequacy of vitamin D replacement in severe deficiency is dependent on body mass index. Am J Med. 2009;122:1056-1060. doi: 10.1016/j.amjmed.2009.06.008. [DOI] [PubMed] [Google Scholar]
- 33. Khosravi ZS, Kafeshani M, Tavasoli P, Zadeh AH, Entezari MH. Effect of vitamin D supplementation on weight loss, glycemic indices, and lipid profile in obese and overweight women: a clinical trial study. Int J Prev Med. 2018;9:63. doi:10.4103%2Fijpvm.IJPVM_329_15. [DOI] [PMC free article] [PubMed] [Google Scholar]
- 34. Perna S. Is vitamin D supplementation useful for weight loss programs? a systematic review and meta-analysis of randomized controlled trials. Medicina. 2019;55:368. doi: 10.3390/medicina55070368. [DOI] [PMC free article] [PubMed] [Google Scholar]
- 35. Kim M, Na W, Sohn C. Correlation between vitamin D and cardiovascular disease predictors in overweight and obese Koreans. J Clin Biochem Nutr. 2013;52:167-171. [DOI] [PMC free article] [PubMed] [Google Scholar]
- 36. Park JM, Park CY, Han SN. High fat diet-induced obesity alters vitamin D metabolizing enzyme expression in mice. Biofactors. 2015;41:175-182. doi: 10.1002/biof.1211. [DOI] [PubMed] [Google Scholar]
- 37. Anderson PH, Sawyer RK, Moore AJ, May BK, O’Loughlin PD, Morris HA. Vitamin D depletion induces RANKL-mediated osteoclastogenesis and bone loss in a rodent model. J Bone Miner Res. 2008;23:1789-1797. doi: 10.1359/jbmr.08061. [DOI] [PubMed] [Google Scholar]
- 38. Sarrafzadegan N, Talaei M, Sadeghi M, et al. Determinants of weight change in a longitudinal study of Iranian adults: Isfahan Cohort Study. Arch Iran Med. 2014;17:539-544. [PubMed] [Google Scholar]
- 39. Johnson LK, Hofsø D, Aasheim ET, et al. Impact of gender on vitamin D deficiency in morbidly obese patients: a cross-sectional study. Eur J Clin Nutr. 2012;66:83-90. [DOI] [PubMed] [Google Scholar]
- 40. Assa A, Vong L, Pinnell LJ, et al. Vitamin D deficiency predisposes to adherent-invasive Escherichia coli-induced barrier dysfunction and experimental colonic injury. Inflamm Bowel Dis. 2015;21:297-306. doi: 10.1097/MIB.0000000000000282. [DOI] [PubMed] [Google Scholar]
- 41. Santacruz A, Collado MC, García-Valdés L, et al. Gut microbiota composition is associated with body weight, weight gain and biochemical parameters in pregnant women. Br J Nutr. 2010;104:83-92. doi: 10.1017/S0007114510000176. [DOI] [PubMed] [Google Scholar]
- 42. Ley RE, Turnbaugh PJ, Klein S, Gordon JI. Microbial ecology: human gut microbes associated with obesity. Nature. 2006;444:1022-1023. doi: 10.1038/4441022a. [DOI] [PubMed] [Google Scholar]
- 43. Malaguarnera L. Vitamin D and microbiota: two sides of the same coin in the immunomodulatory aspects. Int Immunopharmacol. 2020;79:106112. doi: 10.1016/j.intimp.2019.106112. [DOI] [PubMed] [Google Scholar]
- 44. Ghaly S, Kaakoush NO, Lloyd F, et al. High dose vitamin D supplementation alters faecal microbiome and predisposes mice to more severe colitis. Sci Rep. 2018;8:11511. doi: 10.1038/s41598-018-29759-y. [DOI] [PMC free article] [PubMed] [Google Scholar]
- 45. Bora SA, Kennett MJ, Smith PB, Patterson AD, Cantorna MT. The gut microbiota regulates endocrine vitamin D metabolism through fibroblast growth factor 23. Front Immunol. 2018;9:408. [DOI] [PMC free article] [PubMed] [Google Scholar]
- 46. Wu S, Zhang YG, Lu R, et al. Intestinal epithelial vitamin D receptor deletion leads to defective autophagy in colitis. Gut. 2015;64:1082-1094. [DOI] [PMC free article] [PubMed] [Google Scholar]
- 47. Tabatabaeizadeh SA, Tafazoli N, Ferns GA, Avan A, Ghayour-Mobarhan M. Vitamin D, the gut microbiome and inflammatory bowel disease. J Res Med Sci. 2018;23:75. doi: 10.4103/jrms.JRMS_606_17. [DOI] [PMC free article] [PubMed] [Google Scholar]
- 48. Lagishetty V, Misharin AV, Liu NQ, et al. Vitamin D deficiency in mice impairs colonic antibacterial activity and predisposes to colitis. Endocrinology. 2010;151:2423-2432. doi: 10.1210/en.2010-0089. [DOI] [PMC free article] [PubMed] [Google Scholar]
- 49. Schwiertz A, Taras D, Schäfer K, et al. Microbiota and SCFA in lean and overweight healthy subjects. Obesity. 2010;18:190-195. [DOI] [PubMed] [Google Scholar]
- 50. Armougom F, Henry M, Vialettes B, Raccah D, Raoult D. Monitoring bacterial community of human gut microbiota reveals an increase in Lactobacillus in obese patients and methanogens in anorexic patients. PLoS ONE. 2009;4:e7125. doi: 10.1371/journal.pone.0007125. [DOI] [PMC free article] [PubMed] [Google Scholar]
- 51. Zhang H, DiBaise JK, Zuccolo A, et al. Human gut microbiota in obesity and after gastric bypass. P Natl Acad Sci USA. 2009;106:2365-2370. doi: 10.1073/pnas.0812600106. [DOI] [PMC free article] [PubMed] [Google Scholar]
- 52. Koliada A, Syzenko G, Moseiko V, et al. Association between body mass index and Firmicutes/Bacteroidetes ratio in an adult Ukrainian population. BMC Microbiol. 2017;17:120. [DOI] [PMC free article] [PubMed] [Google Scholar]
- 53. Blandino G, Inturri R, Lazzara F, Di Rosa M, Malaguarnera L. Impact of gut microbiota on diabetes mellitus. Diabetes Metab. 2016;42:303-315. doi: 10.1093/infdis/jiu235. [DOI] [PubMed] [Google Scholar]
- 54. Everard A, Belzer C, Geurts L, et al. Cross-talk between Akkermansia muciniphila and intestinal epithelium controls diet-induced obesity. P Natl Acad Sci USA. 2013;110:9066-9071. [DOI] [PMC free article] [PubMed] [Google Scholar]
- 55. Schäffler H, Herlemann DP, Klinitzke P, et al. Vitamin D administration leads to a shift of the intestinal bacterial composition in Crohn’s disease patients, but not in healthy controls. J Dig Dis. 2018;19:225-234. [DOI] [PubMed] [Google Scholar]
- 56. Kanhere M, He J, Chassaing B, et al. Bolus weekly vitamin D3 supplementation impacts gut and airway microbiota in adults with cystic fibrosis: a double-blind, randomized, placebo-controlled clinical trial. J Clin Endocrinol Metab. 2018;103:564-574. [DOI] [PMC free article] [PubMed] [Google Scholar]
Associated Data
This section collects any data citations, data availability statements, or supplementary materials included in this article.
Supplementary Materials
Supplemental material, Supplementary_Data_Chow_composition_xyz4028321b287b6 for Vitamin D Supplementation in Laboratory-Bred Mice: An In Vivo Assay on Gut Microbiome and Body Weight by Lorina Ineta Badger-Emeka, Zainab Yaseen AlJaziri, Cereen Fahad Almulhim, Asma Saleh Aldrees, Zainab Hamzah AlShakhs, Reem Ibrahim AlAithan and Fatimah Abdullah Alothman in Microbiology Insights