

Abstract
Background
The World Health Organization (WHO) recommends undertaking 150 minutes of moderate‐intensity physical activity per week, but most people do not. Workplaces present opportunities to influence behaviour and encourage physical activity, as well as other aspects of a healthy lifestyle. A pedometer is an inexpensive device that encourages physical activity by providing feedback on daily steps, although pedometers are now being largely replaced by more sophisticated devices such as accelerometers and Smartphone apps. For this reason, this is the final update of this review.
Objectives
To assess the effectiveness of pedometer interventions in the workplace for increasing physical activity and improving long‐term health outcomes.
Search methods
We searched the Cochrane Central Register of Controlled Trials, MEDLINE, Embase, the Cumulative Index to Nursing and Allied Health Literature (CINAHL), Occupational Safety and Health (OSH) UPDATE, Web of Science, ClinicalTrials.gov, and the WHO International Clinical Trials Registry Platform from the earliest record to December 2016. We also consulted the reference lists of included studies and contacted study authors to identify additional records. We updated this search in May 2019, but these results have not yet been incorporated. One more study, previously identified as an ongoing study, was placed in 'Studies awaiting classification'.
Selection criteria
We included randomised controlled trials (RCTs) of workplace interventions with a pedometer component for employed adults, compared to no or minimal interventions, or to alternative physical activity interventions. We excluded athletes and interventions using accelerometers. The primary outcome was physical activity. Studies were excluded if physical activity was not measured.
Data collection and analysis
We used standard methodological procedures expected by Cochrane. When studies presented more than one physical activity measure, we used a pre‐specified list of preferred measures to select one measure and up to three time points for analysis. When possible, follow‐up measures were taken after completion of the intervention to identify lasting effects once the intervention had ceased. Given the diversity of measures found, we used ratios of means (RoMs) as standardised effect measures for physical activity.
Main results
We included 14 studies, recruiting a total of 4762 participants. These studies were conducted in various high‐income countries and in diverse workplaces (from offices to physical workplaces). Participants included both healthy populations and those at risk of chronic disease (e.g. through inactivity or overweight), with a mean age of 41 years. All studies used multi‐component health promotion interventions. Eleven studies used minimal intervention controls, and four used alternative physical activity interventions. Intervention duration ranged from one week to two years, and follow‐up after completion of the intervention ranged from three to ten months.
Most studies and outcomes were rated at overall unclear or high risk of bias, and only one study was rated at low risk of bias. The most frequent concerns were absence of blinding and high rates of attrition.
When pedometer interventions are compared to minimal interventions at follow‐up points at least one month after completion of the intervention, pedometers may have no effect on physical activity (6 studies; very low‐certainty evidence; no meta‐analysis due to very high heterogeneity), but the effect is very uncertain. Pedometers may have effects on sedentary behaviour and on quality of life (mental health component), but these effects were very uncertain (1 study; very low‐certainty evidence).
Pedometer interventions may slightly reduce anthropometry (body mass index (BMI) ‐0.64, 95% confidence interval (CI) ‐1.45 to 0.18; 3 studies; low‐certainty evidence). Pedometer interventions probably had little to no effect on blood pressure (systolic: ‐0.08 mmHg, 95% CI ‐3.26 to 3.11; 2 studies; moderate‐certainty evidence) and may have reduced adverse effects (such as injuries; from 24 to 10 per 100 people in populations experiencing relatively frequent events; odds ratio (OR) 0.50, 95% CI 0.30 to 0.84; low‐certainty evidence). No studies compared biochemical measures or disease risk scores at follow‐up after completion of the intervention versus a minimal intervention.
Comparison of pedometer interventions to alternative physical activity interventions at follow‐up points at least one month after completion of the intervention revealed that pedometers may have an effect on physical activity, but the effect is very uncertain (1 study; very low‐certainty evidence). Sedentary behaviour, anthropometry (BMI or waist circumference), blood pressure (systolic or diastolic), biochemistry (low‐density lipoprotein (LDL) cholesterol, total cholesterol, or triglycerides), disease risk scores, quality of life (mental or physical health components), and adverse effects at follow‐up after completion of the intervention were not compared to an alternative physical activity intervention.
Some positive effects were observed immediately at completion of the intervention periods, but these effects were not consistent, and overall certainty of evidence was insufficient to assess the effectiveness of workplace pedometer interventions.
Authors' conclusions
Exercise interventions can have positive effects on employee physical activity and health, although current evidence is insufficient to suggest that a pedometer‐based intervention would be more effective than other options. It is important to note that over the past decade, technological advancement in accelerometers as commercial products, often freely available in Smartphones, has in many ways rendered the use of pedometers outdated. Future studies aiming to test the impact of either pedometers or accelerometers would likely find any control arm highly contaminated. Decision‐makers considering allocating resources to large‐scale programmes of this kind should be cautious about the expected benefits of incorporating a pedometer and should note that these effects may not be sustained over the longer term.
Future studies should be designed to identify the effective components of multi‐component interventions, although pedometers may not be given the highest priority (especially considering the increased availability of accelerometers). Approaches to increase the sustainability of intervention effects and behaviours over a longer term should be considered, as should more consistent measures of physical activity and health outcomes.
Keywords: Adult, Humans, Actigraphy, Actigraphy/instrumentation, Bias, Cardiovascular Diseases, Cardiovascular Diseases/etiology, Health Promotion, Health Promotion/methods, Motor Activity, Motor Activity/physiology, Quality of Life, Randomized Controlled Trials as Topic, Risk Factors, Sedentary Behavior, Walking, Walking/physiology, Workplace
Plain language summary
Do health promotion programmes in the workplace increase people's physical activity if they include a pedometer?
Key messages
Overall, there is not enough evidence to show whether workplace health promotion programmes involving a pedometer affect people's physical activity, especially in the long term.
What is a pedometer?
A pedometer is a small, portable electronic device that counts the number of steps a person takes, but unlike an accelerometer, there is no record of intensity. Pedometers aim to encourage people to increase their physical activity by giving them feedback on their daily steps.
Why we did this review
Most people do not do enough physical activity. According to the World Health Organization, doing at least 30 minutes of moderately intense physical activity on most days can reduce a person's risk of developing cardiovascular disease, diabetes, and some cancers. We wanted to find out if workplace health promotion programmes that involve wearing pedometers would motivate people to increase their physical activity.
What did we do?
We searched for studies of workplace programmes that used pedometers to promote health in employees. We looked for randomised controlled studies, where the treatment each person receives is decided randomly.
Search date: We included evidence published up to December 2016.
What we found
We found 14 studies including 4762 people in different workplaces, ranging from offices to construction sites, mostly in high‐income countries. In all studies, pedometers were part of a health programme that included other components, such as walking groups, counselling, or dietary advice. Studies compared the effects of participating in pedometer programmes with:
‐ receiving no or a minimal health programme such as regular advice about the benefits of physical activity; and
‐ participating in other health programmes, that did not include a pedometer.
The programmes lasted from two weeks to two years; assessments continued for three to ten months afterwards.
We were most interested to see whether there pedometers had a lasting effect on physical activity and health. We were also interested in learning about effects on sedentary behaviour (time spent sitting), risk factors for cardiovascular disease and diabetes (blood pressure, body mass index (BMI) and levels of cholesterol in the blood), quality of life (well‐being) and adverse (unwanted) effects.
What are the results of our review?
Compared with no or a minimal health programme:
Pedometer programmes may not affect physical activity at least one month after the programme end (6 studies), but they may reduce sedentary behaviour and may improve people's well‐being (1 study). We have very little certainty about these results.
Pedometer programmes may slightly reduce body mass index (3 studies, low certainty), but probably make little to no difference in blood pressure (2 studies, moderate certainty) and may reduce unwanted effects such as injuries (2 studies, low certainty).
No studies measured cholesterol or disease risk scores at least one month after the programme ended.
Compared with another health programme:
Pedometer programmes may affect physical activity after at least one month since the programme end (1 study), but we have very little certainty about this result.
We could not draw conclusions about unwanted effects. The evidence was not good enough for us to be certain about effects on sedentary behaviour, BMI, blood pressure, cholesterol, cardiovascular disease risk and well‐being. Some effects were seen but findings were not consistent.
Conclusions
Exercise programmes can have positive effects on an employee's physical activity and health, but we did not find enough reliable evidence to be certain whether a pedometer programme is better than other types of health programmes, especially for achieving long‐term changes in behaviour.
Evidence is uncertain because results were reported by a small number of studies — sometimes only one study. In most studies, the people involved knew which study group they were in, which can affect results. Many people dropped out of studies before the studies ended, so not enough results were collected. Some studies did not report any results for some measures we were interested in or did not assess/evaluate if benefits were maintained after the program ended.
As pedometers are largely being replaced by more sophisticated devices such as accelerometers and Smartphone apps, we will not update this review again.
Summary of findings
Summary of findings 1. Pedometer intervention compared to minimal intervention for increasing physical activity.
| Pedometer intervention compared to minimal intervention for increasing physical activity | ||||||
| Patient or population: employees Setting: workplace Intervention: pedometer intervention Comparison: minimal intervention | ||||||
| Outcomes | Anticipated absolute effects* (95% CI) | Relative effect (95% CI) | № of participants (studies) | Certainty of the evidence (GRADE) | Comments | |
| Risk with minimal intervention | Risk with pedometer intervention | |||||
| Physical activity assessed with combined measures Follow‐up after completion: range 3 to 10 monthsa | See comment | See comment | ‐ | 724 (6 RCTs) | ⊕⊝⊝⊝ Very lowb,c,d | Pedometer interventions may have no effect on physical activity compared to minimal intervention, but the effect is very uncertain. Available studies could not be meta‐analysed due to very high heterogeneity (I² = 94%) |
| Sedentary behaviour Follow‐up after completion: 6 months | Mean sedentary behaviour was 510 min/de | MD 33 min/d lower (84.28 lower to 18.28 higher) | ‐ | 172 (1 RCT) | ⊕⊝⊝⊝ Very lowf,g,h | Pedometer interventions may have an effect on sedentary behaviour compared to minimal intervention, but the effect is very uncertain |
| CVD risk factor: body mass index (BMI) Follow‐up after completion: range 3 to 6 months | Mean CVD risk factor: BMI was 27.94 kg/m²i | MD 0.64 kg/m² lower (1.45 lower to 0.18 higher) | ‐ | 486 (3 RCTs) | ⊕⊕⊝⊝ Lowj,k | Pedometer interventions may reduce BMI slightly compared to minimal intervention, based on low‐certainty evidence |
| CVD risk factor: systolic blood pressure (SBP) Follow‐up after completion: range 3 to 8 months | Mean CVD risk factor: SBP was 127.6 mmHgi | MD 0.08 mmHg lower (3.26 lower to 3.11 higher) | ‐ | 315 (2 RCTs) | ⊕⊕⊕⊝ Moderatel | Pedometer interventions probably result in little to no difference in SBP compared to minimal intervention, based on moderate‐certainty evidence |
| CVD risk factor: LDL cholesterol At completion of interventionm | Mean CVD risk factor: LDL cholesterol was 120.2 mg/dLn | MD 3.58 mg/dL lower (10.76 lower to 3.59 higher) | ‐ | 127 (2 RCTs) | ⊕⊝⊝⊝ Very lowg,o,p | Pedometer interventions may have an effect on LDL cholesterol compared to minimal intervention, but the effect is very uncertain |
| Quality of life: mental health component (QoL) assessed with: SF‐36v2 Health Survey Scale from 0 to 100 Follow‐up after completion: range 3 to 6 months | Mean QoL: mental health component was 51.8e | MD 1.3 higher (1.8 lower to 4.4 higher) | ‐ | 58 (1 RCT) | ⊕⊝⊝⊝ Very lowh,q,r | Pedometer interventions may have an effect on QoL compared to minimal intervention, but the effect is very uncertain |
| Adverse effects Follow‐up after completion: range 6 to 9 months | 24 per 100n | 14 per 100 (9 to 21) | OR 0.50 (0.30 to 0.84) | 286 (2 RCTs) | ⊕⊕⊝⊝ Lowh,o,s | Pedometer interventions may reduce the rate of adverse effects compared to minimal intervention, based on moderate‐certainty evidence. Two additional studies measured adverse effects and found 0 events |
| *The risk in the intervention group (and its 95% confidence interval) is based on the assumed risk in the comparison group and the relative effect of the intervention (and its 95% CI). BMI: body mass index; CI: confidence interval; CVD: cardiovascular disease; LDL: low‐density lipoprotein; MD: mean difference; OR: odds ratio; QoL: quality of life; RR: risk ratio; SBP: systolic blood pressure; SF‐36v2: Short Form 36 version 2. | ||||||
| GRADE Working Group grades of evidence. High certainty: we are very confident that the true effect lies close to that of the estimate of the effect. Moderate certainty: we are moderately confident in the effect estimate: the true effect is likely to be close to the estimate of the effect, but there is a possibility that it is substantially different. Low certainty: our confidence in the effect estimate is limited: the true effect may be substantially different from the estimate of the effect. Very low certainty: we have very little confidence in the effect estimate: the true effect is likely to be substantially different from the estimate of effect. | ||||||
aAll follow‐up periods (unless otherwise stated) measured from completion of the intervention period, to identify lasting effects once the intervention ceases. Longest available follow‐up periods preferred. All study intervention periods were of medium duration (range 10 weeks to 6 months).
bDowngraded by one level for risk of bias, as a large proportion of included studies were at high or unclear risk for three or more domains (blinding of participants and personnel, blinding of outcome assessment, incomplete outcome data, selective outcome reporting, and other concerns).
cDowngraded by two levels for heterogeneity: I² was 94%, which was pre‐specified in the protocol to be too high for the meta‐analysis to be useful.
dDowngraded by one level for imprecision. The 95% CI could not be calculated as the data were not pooled, but the range of effects in included studies included a possible decrease or increase in the outcome.
eMean of control group in single included study.
fDowngraded by one level for risk of bias as the single included study was at high or unclear risk for three or more domains (blinding of participants and personnel, blinding of outcome assessment, and incomplete outcome data).
gDowngraded by two levels for imprecision, as the 95% confidence interval included a meaningful decrease or increase in the outcome and was based on a small sample size.
hDowngraded by one level for indirectness, as the included studies were conducted in people who were either sedentary or overweight, which may substantively affect their outcomes.
iUnweighted average of means of control groups in included studies.
jDowngraded by one level for imprecision, as the 95% confidence interval included both a negligible increase and a meaningful decrease in the outcome.
kDowngraded by one level for risk of bias as one of the included studies was at high or unclear risk of bias in three or more domains, and sensitivity analysis indicated that removal of this study would have led to a smaller and less precise effect estimate.
lDowngraded by one level for imprecision, as the 95% confidence interval included a meaningful increase and decrease in the outcome.
mMeasured at completion of intervention period. No follow‐up available after completion of the intervention.
nMean of control group in one of the included studies that used endpoint measures, while the other study reported change from baseline.
oNot downgraded for risk of bias, although one of the included studies was at high or unclear risk of bias in three or more domains, as sensitivity analysis indicated that removal of this study had no important impact on the overall result.
pDowngraded one level for indirectness, as no post‐intervention follow‐up was available, only end of intervention, and all studies were conducted in people who were either sedentary or overweight, which may substantively affect their outcomes.
qDowngraded by one level for imprecision, as the 95% confidence interval included both a negligible decrease and a meaningful increase in the outcome and was based on a small sample size.
rDowngraded by one level for risk of bias, as the only included study was at high or unclear risk or bias for three or more domains (random sequence generation, blinding of participants and personnel, and blinding of outcome assessment).
sDowngraded by one level for imprecision due to small sample size.
Summary of findings 2. Pedometer intervention compared to alternative physical activity intervention for increasing physical activity.
| Pedometer intervention compared to alternative physical activity intervention for increasing physical activity | ||||||
| Patient or population: employees Setting: workplace Intervention: pedometer intervention Comparison: alternative physical activity intervention | ||||||
| Outcomes | Anticipated absolute effects* (95% CI) | Relative effect (95% CI) | № of participants (studies) | Certainty of the evidence (GRADE) | Comments | |
| Risk with alternative intervention | Risk with pedometer intervention | |||||
| Physical activity assessed with combined measures Follow‐up after completion: 3 monthsa | Mean steps per day was 10,100b | RoM 707 steps higher (303 steps lower to 1818 steps higher) | Ratio of means 1.07 (0.97 to 1.18) | 143 (1 RCT) | ⊕⊝⊝⊝ Very lowc,d,e | The effect of pedometer interventions on physical activity compared to an alternative physical activity intervention is very uncertain |
| Sedentary time assessed with % of accelerometer wear time At completion of interventionf | Mean change in sedentary time was ‐2.05%b | MD 1.48% higher (1.52 lower to 4.49 higher) | ‐ | 62 (1 RCT) | ⊕⊝⊝⊝ Very lowd,g,h | The effect of pedometer interventions on sedentary time compared to alternative physical activity interventions is very uncertain |
| CVD risk factor: body mass index (BMI) At completion of interventionf | Mean CVD risk factor: BMI was 29.14 kg/m²i | MD 1.23 kg/m² lower (2.85 lower to 0.39 higher) | ‐ | 144 (2 RCTs) | ⊕⊝⊝⊝ Very lowg,j,k | The effect of pedometer interventions on BMI compared to alternative physical activity interventions is very uncertain |
| CVD risk factor: systolic blood pressure (SBP) At completion of interventionf |
Mean CVD risk factor: SBP was 124.5 mmHgb | MD 4 mmHg lower (10.15 lower to 2.15 higher) | ‐ | 94 (1 RCT) | ⊕⊝⊝⊝ Very lowg,j,k | The effect of pedometer interventions on SBP compared to alternative physical activity interventions is very uncertain |
| CVD risk factor: LDL cholesterol At completion of interventionf |
Mean CVD risk factor: LDL cholesterol was 112.6 mg/dLb | MD 0.6 mg/dL higher (15.08 lower to 16.28 higher) | ‐ | 94 (1 RCT) | ⊕⊝⊝⊝ Very lowg,j,l | The effect of pedometer interventions on LDL cholesterol compared to alternative physical activity interventions is very uncertain |
| Quality of life (QoL) ‐ not reported | ‐ | ‐ | ‐ | ‐ | ‐ | One study measured QoL but did not report the results. |
| Adverse effects ‐ not measured | One study reported that no adverse effects were reported | ‐ | ‐ | ‐ | No conclusions could be drawn about the adverse effects of pedometers and other physical activity interventions | |
| *The risk in the intervention group (and its 95% confidence interval) is based on the assumed risk in the comparison group and the relative effect of the intervention (and its 95% CI). BMI: body mass index; CI: confidence interval; CVD: cardiovascular disease; LDL: low‐density lipoprotein; MD: mean difference; OR: odds ratio; QoL: quality of life; RCT: randomised controlled trial; RoM: ratio of means; RR: risk ratio; SBP: systolic blood pressure. | ||||||
| GRADE Working Group grades of evidence. High certainty: we are very confident that the true effect lies close to that of the estimate of the effect. Moderate certainty: we are moderately confident in the effect estimate: the true effect is likely to be close to the estimate of the effect, but there is a possibility that it is substantially different. Low certainty: our confidence in the effect estimate is limited: the true effect may be substantially different from the estimate of the effect. Very low certainty: we have very little confidence in the effect estimate: the true effect is likely to be substantially different from the estimate of effect. | ||||||
aFollow‐up period measured from completion of the intervention period to identify lasting effects once the intervention ceases. Longest available follow‐up periods preferred. All study interventions periods were of medium duration (range 3 to 6 months).
bMean value in the control group of the single included study.
cDowngraded by one level for risk of bias, as the single included study was at high or unclear risk of bias in three or more domains (blinding of participants and personnel, blinding of outcome assessment, and selective outcome reporting).
dDowngraded by one level for imprecision, as the 95% CI included both a negligible decrease and a meaningful increase in the outcome and was based on a small sample size.
eDowngraded by one level for indirectness, as the single included study was conducted only in sedentary women. Gender and activity levels were pre‐specified in the protocol for this review as possible effect modifiers.
fMeasured at completion of the intervention period. No follow‐up available after completion.
gDowngraded one level for indirectness, as no post‐intervention follow‐up period was measured and lasting impact is therefore unknown.
hDowngraded by one level for risk of bias, as the single included study was at high or unclear risk of bias in three or more domains (blinding of participants and personnel, incomplete outcome data, and selective outcome reporting).
iUnweighted average of means of control groups in included studies.
jDowngraded by one level for risk of bias, as the included study or studies were at high or unclear risk of bias in three or more domains (random sequence generation, allocation concealment, blinding of participants and personnel, incomplete outcome data, and selective outcome reporting).
kDowngraded by one level for imprecision, as the 95% CI included both a negligible increase and a meaningful decrease in the outcome, and was based on a small sample size.
lDowngraded by two levels for imprecision, as the 95% CI included both a meaningful decrease or increase in the outcome and was based on a small sample size.
Background
Description of the condition
The World Health Organization (WHO) recommends that most adults should undertake at least 150 minutes of moderate‐intensity physical activity per week, or equivalent, as this reduces the risk of cardiovascular disease, diabetes, and some cancers (WHO 2014). Although the health benefits of physical activity are recognised, in 2010, only 23% of the world’s population was undertaking adequate amounts of physical activity (WHO 2014), and rates have been declining (Brownson 2005; Food and Agricultural Organization of the UN 2006; Norman 2003; WHO 2010). This trend is likely to continue, as physical activity is continuously being reduced in all life environments including at home, during school/work, during recreation, and in transport (Brownson 2005; WHO 2004; WHO 2010). Currently, physical inactivity is the fourth leading global risk for mortality and the 11th leading global risk for burden of disease (WHO 2009). Physical inactivity and low physical activity accounted for 3.2 million global deaths and 2.8% of disability‐adjusted life‐years in 2010 (Lim 2014; WHO 2014).
Description of the intervention
Workplace as a setting for health promotion
The workplace has become a key setting for health promotion and disease prevention (Freak‐Poli 2010; Freak‐Poli 2011a; Freak‐Poli 2012; Freak‐Poli 2013a; WHO 2002; WHO 2004; WHO & WEF 2008). The potential to positively influence behaviour in the workplace setting is especially important as occupations have gradually become more sedentary (Ferro‐Luzzi 1996; Puig‐Ribera 2008; WHO 2000; WHO 2009). Health promotion interventions are increasingly conducted at workplaces to access groups of participants in their daily lives, and to provide opportunities for employers to improve worker health, reduce absenteeism, and increase productivity (Marshall 2004; WHO & WEF 2008). Workplace health intervention evaluations have demonstrated improvement in the leading global risk factors for chronic disease (Rongen 2013; WHO 2004); they have also been found to benefit the employer (Batt 2009; Speck 2009; WHO & WEF 2008).
Pedometer use in health promotion
A pedometer, or step counter, is a small, light, portable, easy‐to‐use electronic device that counts the number of steps taken by an individual. Pedometers are usually around the size of a matchbox, and they can be worn clipped to the person's clothing at the hip, or at another convenient place. They are low in cost, usually priced between USD 20 and USD 35, making them an accessible and feasible intervention.
By wearing a pedometer for a period of time, during either ordinary daily activities or a specific period of walking, the individual receives feedback on the number of steps taken and thereby a measure of his or her physical activity. Pedometers have been used as a measurement tool by athletes and in fitness training programmes, and have served as health promotion interventions aimed at increasing physical activity levels. Health promotion interventions usually encourage participants to wear a pedometer during waking hours to record and give feedback on the number of steps taken on a daily or weekly basis (Bravata 2007; Freak‐Poli 2011a; Kang 2009; Ogilvie 2007; Richardson 2008). These interventions encourage individuals to increase their level of walking (a moderate‐intensity activity) or running (a vigorous‐intensity activity) and often provide a target step goal, such as the commonly used 10,000 steps per day (Behrens 2007; Dishman 2009; Low 2007; Maruyama 2010; Rush 2009; Warren 2010).
Pedometers are rarely used alone; health interventions may include a variety of additional components such as a diary or a website for logging steps, dissemination of additional health promotion information, motivational reminders, shared reporting of step counts, counselling sessions, group facilitators, weekly meetings, a website for communication among participants, team competition, participation rewards, or group physical activity sessions (Aittasalo 2004; Behrens 2007; Chan 2004; Croteau 2004; De Cocker 2010; Dishman 2009; Faghri 2008; Farag 2010; Freak‐Poli 2011a; GCC 2010; Gemson 2008; Gilson 2007; Goetzel 2009; Goetzel 2010; Haines 2007; Kwak 2010; Low 2007; Lubans 2009; Maruyama 2010; Naito 2008; Puig‐Ribera 2008; Racette 2009; Rush 2009; Speck 2009; Thomas 2006; Warren 2010). Pedometer use can also be incorporated as a component of broader health promotion interventions incorporating elements such as mass media, community‐based activities, physical health checks, and healthy eating initiatives. A systematic review of workplace physical activity interventions concluded that a pedometer was among the components that assisted with intervention effectiveness (To 2013).
It is important to note that the use of pedometers in health promotion interventions is now being superseded by widespread access to more sophisticated devices such as wearable accelerometers and Smartphone apps.
How the intervention might work
Pedometers provide immediate, specific feedback on levels of physical activity that is intended to motivate individuals to increase their activity over time (Matevey 2006). Health interventions that utilise pedometers are generally based on social‐cognitive theory, identifying self‐efficacy as the main driver of positive physical activity and health behaviour change (Bandura 2001; Culos‐Reed 2001; De Cocker 2010; Lemon 2010; Lubans 2009; Maruyama 2010; Prabhakaran 2009; Prodaniuk 2004; Tudor‐Locke 2009). Pedometer‐based interventions promote self‐efficacy by focusing on walking or running activities, which usually have few barriers to participation. A pedometer can facilitate progressive individual goal‐setting and can allow the individual to be flexible in amount and scheduling of physical activity. In this way, the pedometer acts as both a motivator and a monitor of activity. The use of additional components such as targets, education, and rewards is intended to increase that motivation.
By setting a health promotion intervention incorporating pedometers in a workplace context, social‐cognitive motivation is combined with an ecological approach, addressing the environment in which people interact (Prodaniuk 2004). The workplace is a pre‐existing social setting in which collegiate camaraderie and endorsement of leaders can reinforce participation in interventions. Available facilities can be used to undertake physical activity, and existing communication networks, such as email or a common notice board, can be used to encourage and inform participants (Freak‐Poli 2011a).
This review aims to measure effects of the unique monitoring and motivational role of pedometers used to increase physical activity in workplace settings, including relatively simple interventions in which pedometers are the main intervention (although they may be supported by the components listed above) and broader interventions incorporating pedometers as a component. Although it is more difficult to assess the impact of pedometers in the context of a complex, multi‐component intervention, it is important to consider the evidence for these interventions, as this is often how pedometers are used in health promotion practice.
There is a further particular question to be examined, which is whether any measured impact of interventions incorporating pedometers in the short term can be translated into long‐term increases in physical activity that could feasibly lead to a reduction in risk factors for and incidence of a range of chronic diseases such as cardiovascular disease and diabetes.
Why it is important to do this review
The World Health Organization and the World Economic Forum recommend that further research is needed to strengthen current knowledge of workplace health interventions, particularly regarding effectiveness and use of simple instruments (WHO & WEF 2008).
A number of Cochrane Reviews have assessed the evidence surrounding the effectiveness of different interventions to increase physical activity within certain environments, including community‐wide interventions and school‐based interventions (Baker 2011; Baker 2015; Dobbins 2013).
Only one other review, published elsewhere, has examined pedometers in a workplace context (Bravata 2007), reporting inconclusive results.
To understand whether workplace health interventions incorporating pedometers offer an avenue for improving physical activity and consequent health risk factors, a systematic review incorporating the current literature is required. This review is an update of a previous version of the review (Freak‐Poli 2013). In the previous version, we identified four relevant studies providing data for 1809 employees. Although we observed that independent studies reported health benefits associated with the pedometer programmes, we determined that there was "a need for more high‐quality randomised controlled trials to assess the effectiveness of pedometer interventions in the workplace for increasing physical activity and improving subsequent health outcomes". We concluded that "there [were] limited and low‐quality data providing insufficient evidence to assess the effectiveness of pedometer interventions in the workplace for increasing physical activity and improving subsequent health outcomes". A number of new studies on this topic have now been published, warranting an updated review.
Although it is useful to bring this review up‐to‐date, we note that growing use of accelerometers and Smartphone apps to provide feedback on physical activity is superseding the use of pedometers. For this reason, this will be the final update of this review.
The original protocol for this review was published (Freak‐Poli 2011). Changes made between the protocol or the last published version and this version are detailed in the Differences between protocol and review section.
Objectives
To assess the effectiveness of pedometer interventions in the workplace for increasing physical activity and improving long‐term health outcomes.
Methods
Criteria for considering studies for this review
Types of studies
We included individual and cluster‐randomised controlled trials (RCTs).
Types of participants
We included studies conducted with employed adults. Adults were defined as 16 years of age or older. Mixed‐age populations were eligible if a separate analysis of adult participants was available; however, none were available for inclusion. Studies conducted with trained athletes would have been excluded; however, none were available.
Types of interventions
We included any workplace health intervention that incorporated the use of a pedometer. To be eligible, the pedometer had to be incorporated into the health intervention for the entire duration of the intervention, and participants had to be able to view their step count. We included studies in which the pedometer was the sole component of the intervention; studies in which the pedometer was the main focus of the intervention but was supported by other intervention components like step goals, diaries, teams, or rewards to increase motivation; and broader health promotion interventions that incorporated pedometers as one of many components. We aimed to explore the modifying effects of additional intervention components through subgroup analysis.
We did not include health interventions incorporating accelerometers rather than pedometers. Although both accelerometers and pedometers are unobtrusive, accurate motion sensors, there are four main distinctions. First, the mechanics of an accelerometer function differently from a pedometer, allowing detection of three‐dimensional movement in addition to simple step counting (Tudor‐Locke 2002). Second, an accelerometer allows more complex analysis, with the capacity to segregate recorded movements into subsets of time and analyse their frequency or intensity (Tudor‐Locke 2002). Additional information such as speed, distance, caloric expenditure, and total physical activity time may be available, dependent on the brand, and could be an extra motivator for the user. Third, an accelerometer unit is at least four times more expensive than a pedometer unit; the usual price ranges between USD 120 and USD 299, but it can cost up to USD 450 per unit (Tudor‐Locke 2002; Tudor‐Locke 2004b). Fourth, to access the information that an accelerometer provides, it often must be plugged in to a computer with a specific software or synchronised with a mobile device. The cost of the accelerometer, the use of a computer or device, the costs of specific software, and the time required to set up and monitor these devices increase barriers to accelerometer use in health promotion, particularly for populations less comfortable with the use of technology (Tudor‐Locke 2002; Tudor‐Locke 2004b). Due to differing mechanical function, additional information types, and increased costs, we did not view accelerometers as a low‐cost, easy‐to‐use device; therefore, we have not assessed them in this review. However, over time, with technological advances and the introduction of companies such as Fitbit® (www.fitbit.com) and Bellabeat (webshop.bellabeat.com), accelerometers are becoming less expensive and may render pedometers as obsolete. Note that we did include studies that used accelerometers solely to measure physical activity as an outcome, but only if the accelerometers were available during limited data collection rounds for both the pedometer intervention group and the control group, and were not available throughout the study.
We included all comparator groups in the review, including any intervention without a pedometer, or no intervention.
Types of outcome measures
We aimed to report the following outcomes, but only the primary outcome was required as part of the eligibility criteria of studies for inclusion in the review.
Primary outcomes
The primary outcome was physical activity.
If multiple physical activity measurements were reported, preference was first given to activity assessed over the whole day. For example (in order of preference), metabolic equivalents (METs), step count, METs for moderate and vigorous activity combined, incidental activity (incorporated into work or leisure time (Prodaniuk 2004)), duration of physical activity.
Second, if one of these was not available, preference was given to one specific type of activity assessed over the whole day. For example (in order of preference), moderate and vigorous activity, moderate activity, vigorous activity, light activity.
Third, preference was given to activity assessed within work time rather than within leisure time (Godin 1985).
When more than one measure (e.g. objective, self‐report) was available within one of these three categories, preference was given to measures with less risk of bias. For example (in order of preference), physical activity that is objectively measured, followed by observed and then self‐reported activity (e.g. the Stanford Usual Activity Questionnaire (Sallis 1985), the Dutch short questionnaire to assess health‐enhancing physical activity (Wendel‐Vos 2003), the International Physical Activity Questionnaire (IPAQ 2011)).
We categorised time points into two categories: those occurring at completion of the intervention (labelled intervention "duration"), and those occurring at follow‐up after completion of the intervention (labelled follow‐up "term"). The primary measurement time points of interest were those at follow‐up after completion of the intervention period, as these may identify whether any sustainable change in behaviour has occurred. Within these categories, duration of the intervention and follow‐up time were grouped as short term (less than one month), medium term (at least a month but less than one year), and long term (at least one year). Thereby the duration of an intervention and the follow‐up term after completion of the intervention were categorised independently of each other.
We excluded outcomes that were measured only in subsets of the study population.
Secondary outcomes
Health risk factors of interest included the following (in order of preference).
Sedentary behaviour (e.g. time sitting, time spent under 1.5 metabolic equivalent of task units (METs) ‐ a measure of energy consumption, time watching television or other media).
Cardiovascular disease and type 2 diabetes risk factors.
Anthropometric measures (e.g. body mass index (BMI), waist circumference (WC), waist‐to‐hip ratio, body fat, body weight, hip circumference).
Blood pressure (e.g. systolic blood pressure (SBP), diastolic blood pressure (DBP), hypertension, resting heart rate (for comparison, as heart rate should not change due to the health intervention)).
Biochemical measures (e.g. blood glucose (fasting, not fasting), blood cholesterol (high‐density lipoprotein (HDL), high‐ to low‐density lipoprotein ratio, low‐density lipoprotein (LDL), blood triglycerides).
Disease risk scores (e.g. cardiovascular disease risk (D'Agostino 2008), type 2 diabetes risk (Baker IDI Heart and Diabetes Institute 2008)).
Quality of life (e.g. Short Form 36 or 12 Health Survey (SF‐36 2011), the Social Support Inventory (Dunkel‐Schetter 1986), the Satisfaction With Life Scale (Diener 1985)).
Adverse effects including injury.
Search methods for identification of studies
Electronic searches
We searched the following sources from the earliest record. The latest date on which the search was fully up‐to‐date across all sources was 1 December 2016 (see Appendices for complete dates, including all updates and specific search strategies).
CENTRAL (the Cochrane Central Register of Controlled Trials, in the Cochrane Library).
CINAHL (Cumulative Index to Nursing and Allied Health Literature).
MEDLINE.
Embase.
OSH (Occupational Safety and Health) UPDATE (CISDOC, HSELINE, NIOSHTIC, NIOSHTIC‐2, RILOSH, IRSST, and INTERNATIONAL BIBLIOGRAPHIC databases) (this source was excluded from the search after 1 December 2014 due to lack of relevant results).
Web of Science (SCI‐Expanded, SSCI, and A&HCI databases).
ClinicalTrials.gov.
WHO International Clinical Trials Registry Platform (ICTRP).
Before publication of this review, to assess the currency of the search, we conducted a provisional update of the search across all electronic databases in May 2019, although the results of this provisional search are not fully incorporated into the review and are reported separately in the Results of the search section.
We developed our systematic search strategy with help from information specialists at Cochrane Occupational Safety and Health (see Acknowledgements). We tested the strategy against a set of 13 known relevant studies from across the globe before running final searches. We did not limit the search by language.
Searching other resources
We searched the websites of organisations actively involved in workplace physical activity interventions, for example, the World Health Organization, including Global Strategy on Diet, Physical Activity and Health (WHO 2004), and Preventing Noncommunicable Diseases in the Workplace Through Diet and Physical Activity (WHO & WEF 2008). These sources did not reveal any included studies in the initial search, and we did not search them again when we updated the review.
We scanned the references of included studies for additional studies. For the first version of this review, we sent a comprehensive list of relevant articles together with the inclusion criteria for the review to the first author of each paper that met the inclusion criteria, asking if they knew of any additional published or unpublished studies that might be relevant. No additional studies were found, and this process was not repeated when the review was updated.
Data collection and analysis
Selection of studies
Two review authors or other contributors undertook an initial screening of titles and abstracts independently, to remove those that were obviously outside the scope of the review. We sought full‐text translations or evaluations of all relevant non‐English articles. We rejected articles at the initial screening stage if both review authors agreed based on title and abstract that it met one of these specified criteria.
The article was not a report of an RCT.
The intervention was not tested on employed adults.
The trial did not address a pedometer‐based physical activity intervention.
We were over‐inclusive at this stage, and, if in doubt, we did not exclude the record. For the 2016 update of the search, one review author screened titles and abstracts as above. For the duplicate screen, search results were initially screened by Cochrane Crowd (http://crowd.cochrane.org), Cochrane's crowd‐sourcing platform, to identify records referring to randomised trials. This reduced set was then forwarded for screening against the remaining criteria by a second review author as normal.
We obtained the full text of all papers potentially meeting the inclusion criteria. We linked together multiple publications and reports on the same study. Two review authors (of RFP, MC, and LAB) screened all full‐text papers independently. We rejected articles at this stage if both review authors agreed, based on the full text, that the study did not meet all eligibility criteria. When two review authors were uncertain about the classification of a study, a third review author was consulted and/or the study authors were contacted via email to request further information.
For the provisional updated search conducted in May 2019, results were initially screened to identify randomised trials using Cochrane Crowd, and the remaining studies were provisionally screened by only one review author (MC or LAB).
Data extraction and management
Two review authors (of RFP, MC, and LAB) independently completed a data extraction form for each included study. We tailored the data extraction form to the requirements of this review, and we piloted it to assess its ability to capture study data. We incorporated items for assessing risk of bias into the data extraction form. In addition, we assembled and compared multiple reports and publications of the same study to ensure completeness and to identify possible contradictions.
We collected data on the study population, the study environment, intervention specifics, study methods, and outcomes for each study. We recorded all measures identified as primary or secondary outcomes, regardless of how the information was reported (e.g. categorical cut‐offs, continuous mean ± standard deviation data). When studies reported more than one time point, we collected all outcomes at all time points.
Assessment of risk of bias in included studies
Two review authors (of RFP, MC, and LAB) independently assessed the risk of bias of each included study using a descriptive approach, as outlined in the Cochrane Handbook for Systematic Reviews of Interventions (Higgins 2011b). We assessed the following key criteria: random sequence generation; allocation concealment; blinding of participants and personnel; blinding of outcome assessment; incomplete outcome data; selective outcome reporting; and other sources of bias (e.g. baseline imbalance, risks associated with cluster‐randomised designs such as differences in recruitment and comparability of clusters) (Higgins 2011b). We assessed each study as having low, high, or unclear risk of bias. A judgement of unclear risk of bias indicated either lack of information or uncertainty over the potential for bias. There was no persisting difference of opinion, so a third review author was not required to review additional papers.
We considered trials that were not assessed as low risk in three or more of the above criteria to be at high risk of bias overall.
Measures of treatment effect
When possible, we aimed to express effect sizes for dichotomous outcomes as risk ratios (RRs). For continuous outcomes, we aimed to use mean differences (MDs) between post‐intervention values of intervention and control groups to express effect sizes when possible.
When studies used different scales to measure the same outcome, we aimed to use standardised mean differences (SMDs). For the primary outcome of physical activity, the included studies were very heterogeneous across a number of domains and used diverse definitions and measures of physical activity. These factors would almost certainly influence the standard deviations (SDs) in each study, undermining the required assumption for the calculation of an SMD that the SDs reflect only variation in measurement scales, and not other important differences (Deeks 2011). We therefore made the decision to express this outcome as a ratio of means (RoM), using the methods outlined in Friedrich 2008.
For the outcome of adverse effects, results were reported in one study as dichotomous data (Aittasalo 2012), and in another as a continuous measure of the number of events over two 12‐month periods (Morgan 2011). We converted both to log(odds ratio) to enable meta‐analysis of these two studies using the methods described in Deeks 2011.
We reported all effect measures with a 95% confidence interval (CI).
Unit of analysis issues
If a study had more than two arms, we considered the interventions in each arm and did not analyse any arms not relevant to the review. When two intervention arms were considered comparable for the purposes of this review, we combined the two and treated them as a single arm for the purposes of our analysis (either combining the data ourselves or obtaining them from the study authors). When it was not appropriate to combine groups, we would have conducted separate comparisons of each arm of interest (e.g. one intervention arm versus control, then the second intervention arm versus control), taking care not to include the same participants twice within a meta‐analysis and preventing unit of analysis error, but this situation did not arise.
The review included a number of cluster‐randomised controlled trials, in which participants were allocated to intervention or control arms in groups (e.g. workplaces). Unit of analysis errors may occur when studies allocate participants in clusters but analyse the results by the total number of individuals. This can result in overestimation of the statistical significance of the results by not accounting for clustering of individuals in the data. Correcting the error by analysing results by the unit of randomisation (the cluster) can underestimate the statistical significance of the results, particularly when clusters are very large. In our meta‐analysis, we assessed the included cluster‐randomised trials for unit of analysis errors. When studies correctly accounted for clustering, we extracted and used these data in our analyses (usually presented as overall effect estimates, e.g. odds or risk ratios based on a multi‐level model and analysed through the generic inverse variance method).
When clustering was not accounted for by an included study (or when the separate intervention and control group data required for calculation of the RoM were unadjusted), we adjusted the data according to the methods outlined in Higgins 2011c. We adjusted for clustering by calculating robust standard errors using the svy linearized commands for control and intervention groups in Stata version 15 (StataCorp 2015).
For Linde 2012 (for which individual participant data were available), to indicate whether a variable correlated more strongly within workplaces than between workplaces, we calculated two statistics: the design effect and the intracluster correlation coefficient. The design effect (deff) assessed the loss of statistical efficiency arising from the study’s cluster‐sampling method compared with the hypothetical use of a simple random sample (Campbell 2004; Carlin 1999). Intracluster correlation coefficients (ICCs) were calculated as deff minus one, divided by the sum of minus one and division of the average cluster size by the number of clusters (Campbell 2004; Carlin 1999). For physical activity (total METs per week), these were calculated as deff = 16.02 and ICC = 0.07, and for sedentary behaviour, deff = 44.87, ICC = 0.20, indicating a low clustering effect. For BMI, these were calculated as deff = 2.20, ICC = 0, indicating no correlation within clusters.
For Audrey 2015 and Morgan 2011 (physical activity only as other outcomes were already adjusted) and Parry 2013, data were adjusted by calculating an effective sample size according to the methods outlined in Higgins 2011c, using an ICC of 0.12 (95% CI 0 to 0.3) calculated by Audrey 2015, for physical activity. This ICC was used in preference to those calculated for Linde 2012, as it assumed a higher level of correlation and therefore produced more conservative estimates with wider standard errors.
Dealing with missing data
When information was missing from the included studies, we contacted the study authors to request additional information. Linde 2012 provided individual patient data for physical activity, sedentary behaviour, and BMI via personal communication. We assessed the risk of bias arising from incomplete outcome data as part of the overall risk of bias assessment.
When a standard deviation (SD) was not available for a continuous outcome, we used the methods demonstrated by Higgins 2011a to obtain one. In one case (Ribeiro 2014), SDs were not available for the outcome of physical activity and could not be calculated, and so we imputed appropriate SDs from the most closely comparable study in group mean values and outcome definitions for each comparison (Maruyama 2010 for Comparison 1, Talbot 2011 for Comparison 2).
Assessment of heterogeneity
We considered the clinical heterogeneity of included studies before conducting any analyses. We considered the following PICO elements too different to be combined.
For interventions:
studies of pedometers alone;
pedometer‐focused interventions with supporting components to increase motivation (e.g. step goals, diaries, teams, rewards); and
broader health promotion interventions that incorporated pedometers as one of many components.
For comparison groups:
studies comparing pedometer interventions to no intervention;
studies comparing pedometer interventions to similar components without a pedometer; and
studies comparing pedometer interventions to larger‐scale health promotion interventions and other active interventions without a pedometer.
For follow‐up periods:
measures taken at completion of the intervention period;
follow‐up measures taken after completion of the intervention period; and
in either category, short‐, medium‐, and long‐term periods.
We quantified and evaluated the amount of statistical heterogeneity to determine whether the observed variation in study results was compatible with the variation expected by chance alone (Higgins 2003). We assessed heterogeneity through examination of forest plots and quantified it using the I² statistic. When we observed an I² statistic greater than 90%, we considered heterogeneity to be too high to conduct a meta‐analysis.
Assessment of reporting biases
If ten or more studies were included in a meta‐analysis, we aimed to assess the possibility of publication bias by using funnel plots (Higgins 2011a). We also aimed to investigate alternative explanations for funnel plot asymmetry (such as clinical or methodological heterogeneity, statistical artefacts, or chance) (Egger 1998). We aimed to assess the potential impact of any suspected small‐study effects by using a comparison between fixed‐effect and random‐effects meta‐analysis models. However, no meta‐analysis included more than nine studies, and these methods were not required.
We also aimed to assess the risk of bias arising from selective outcome reporting within studies as part of the overall risk of bias assessment.
Data synthesis
For data synthesis, we followed the meta‐analysis methods outlined in Deeks 2011. When we considered studies to be clinically and methodologically homogeneous, and when comparable data were available from at least two studies measuring the same outcome, we performed meta‐analyses using Review Manager 5 software (RevMan 2011). We used a random‐effects model as the default to incorporate the assumption of heterogeneity between studies.
Subgroup analysis and investigation of heterogeneity
If more than two trials that reported data in each category were available, we aimed to explore the following participant characteristics using subgroup analyses.
Gender: men compared to women.
Age (as the probability of maintaining good health diminishes as an individual gets older (AIHW 2008), there may be differing motivations for participation in pedometer‐based workplace health interventions depending on age): younger (< 40 years) compared to older (≥ 40 years).
Educational status: tertiary education completed compared to not completed.
If more than two trials that reported data in each category were available, we aimed to explore the following intervention characteristics.
-
Eligibility of participants.
Are interventions targeting high‐risk employees more effective than interventions targeting all employees?
Are interventions targeting sedentary or office‐based employees more successful than interventions targeting active or manual employees?
Step goal: are interventions that utilise a daily step goal (e.g. 10,000 steps per day) more effective than non‐step goal‐defined interventions?
Step diary: are interventions that utilise a step diary (e.g. daily or weekly record of steps) more effective in changing physical activity than non‐diary interventions?
Duration of intervention period: are short‐duration interventions (less than one month), medium‐duration interventions (more than a month but less than one year), or long‐duration interventions (equal to or more than one year) more effective?
Provider: are interventions with an external intervention provider more effective than interventions undertaken internally within the workplace?
Sensitivity analysis
We aimed to carry out a sensitivity analysis including only studies at overall low risk of bias, defined as being assessed at low risk of bias in at least four of the seven domains assessed.
We aimed to use sensitivity analysis to assess the impact of any suspected publication bias by comparing fixed‐effect and random‐effects meta‐analysis models.
'Summary of findings' and assessment of the certainty of evidence
The following outcomes were selected as most important for summarising findings of the review: physical activity, sedentary behaviour, BMI, SBP, LDL cholesterol, quality of life (mental health component), and adverse effects. For each of these outcomes, the longest available period of follow‐up after completion of the intervention was used as the main measure. When no follow‐up was conducted after the intervention period, the measure at completion of the longest available duration of interventions was used.
For these measures, two review authors (MC, LAB) assessed the certainty of evidence using the GRADE approach (Schünemann 2011). We summarised the level of certainty as ‘high’, ‘moderate’, ‘low’, or ‘very low’, based on risk of bias, directness of evidence, heterogeneity and its causes, precision, and publication bias. We incorporated these assessments into our descriptions of these outcomes by using standardised language recommended by Cochrane Consumers and Communication (Ryan 2016). Accordingly, throughout the text, we indicated whether the observed effect represents a meaningful change, a slight change, or little to no change. When the certainty of evidence is moderate, we use the word 'probably'; when it is low, we use the word 'may'; and when it is very low, we use the word 'may' but indicate that the result is too uncertain to estimate. Details of the GRADE assessments are included in Table 1 and Table 2.
Summary of findings and assessment of the certainty of the evidence
The following outcomes were selected as the most important to summarise the findings of the review: physical activity, sedentary behaviour, BMI, SBP, LDL cholesterol, quality of life (mental health component), and adverse effects. For each of these outcomes. the longest available period of follow‐up after completion of the intervention was used as the main measure. Where no follow‐up after the intervention period was conducted, the measure at completion of the longest available duration of interventions was used.
For these measures, two authors (MC, LAB) assessed the certainty of evidence using the GRADE approach (Schünemann 2011). We summarised the level of certainty as ‘High’, ‘Moderate’, ‘Low’, or ‘Very Low’, based on risk of bias, directness of the evidence, heterogeneity and its causes, precision and publication bias. We incorporated these assessments into our descriptions of these outcomes using standardised language recommended by Cochrane Consumers and Communication (Ryan 2016). Accordingly, throughout the text, we indicate whether the observed effect represents a meaningful change, a slight change or little or no change. Where the certainty of the evidence is moderate, we use the word 'probably'; where it is low, we use the word 'may', and where it is very low, we used the word 'may' but indicate that the result is too uncertain to estimate. Details of the GRADE assessments are included in Table 1 and Table 2.
Results
Description of studies
Results of the search
In the first published version of this review (Freak‐Poli 2013), we identified and screened 5947 records, and we included four studies. Since that time, the search has been updated three times: in March 2013, December 2014, and December 2016 (see Figure 1). In total, based on both original and updated searches, we identified 8785 records (6197 unique records after removal of duplicates). Of these, we considered 321 potentially eligible based on the title and abstract, and we assessed them in full text. Of these, we excluded 302 (see Excluded studies section and Characteristics of excluded studies table). An additional two met our inclusion criteria, but these studies were ongoing at the time of the search (Audrey 2019; Pillay 2012; see Characteristics of ongoing studies table). We included 14 studies (see Included studies section and Characteristics of included studies table).
1.

PRISMA flow chart. * Note that additional records associated with included studies were identified during the course of the review, including through author correspondence and targeted searching for study protocols.
We contacted the authors of 24 studies to clarify eligibility, identify additional related publications, and obtain additional results. We received responses regarding 19 studies, providing additional information (Aittasalo 2012; Audrey 2015; Bort Roig 2012; Dishman 2009; Finkelstein 2015; Kazi 2012; Mansi 2013; Martin 2013; Maruyama 2010; Mattila 2013; Morgan 2011; Parry 2013; Pillay 2014; Puhkala 2011; Ribeiro 2014; Swartz 2014; Talbot 2011; Thøgersen‐Ntoumani 2010; Viester 2012). One study was eligible based on the study author's response, but published data were available for only one of the three randomised groups, and no response was received from the larger study's custodians; this study is awaiting classification (Mattila 2013; Studies awaiting classification).
Note that no additional included studies were identified between December 2014 and December 2016, when the most recent search was completed.
Before publication of this review, we conducted a provisional updated search to identify the extent to which additional studies that could be eligible for the review might be available. The provisional search was conducted in May 2019, and we identified 4617 records (2824 unique records after removal of duplicates). Provisional screening of 1162 records based on titles and abstracts was performed by one review author (MC or LA) via Cochrane Crowd to remove non‐randomised trials. Seventy‐nine records were screened in full text by one review author (MC), of which only one appeared to be potentially eligible. This was the final publication of Audrey 2019, which was previously identified as an ongoing study in the main search. This study and one other that could not be excluded pending translation are described in the Characteristics of studies awaiting classification table. We determined that the findings of this provisional search were unlikely to substantively impact the conclusions of the review, and the results of this search have not been fully incorporated into the review. We identified four additional studies in progress that may be eligible for inclusion when completed (see Characteristics of ongoing studies).
Included studies
We included 14 studies in this review (Aittasalo 2012; Audrey 2015; Carr 2013; Dishman 2009; Linde 2012; Mansi 2013; Maruyama 2010; Morgan 2011; Parry 2013; Pillay 2014; Ribeiro 2014; Swartz 2014; Talbot 2011; Viester 2012). In total, the included studies had recruited 4762 employees, with the greatest contribution of 1747 employees coming from Linde 2012, followed by 1442 employees from Dishman 2009; each of the remaining studies contributed fewer than 320 participants. Key features of these studies are summarised below, and more detailed descriptions are given in the Characteristics of included studies table.
Intervention
Duration
One study had a short duration of one week (Swartz 2014); 12 studies were of medium duration (between ten weeks and six months), and one had a long duration of two years (Linde 2012).
Theoretical basis
Several studies mentioned that their interventions had a theoretical basis. These included theory‐based behaviour modification principles built around goal‐setting theory (Dishman 2009), social‐cognitive theory (Carr 2013; Morgan 2011), self‐regulation theory (Mansi 2013), and stages of change theory (Maruyama 2010).
Intervention components
None of the studies used pedometers alone. All included studies used broad health promotion interventions that incorporated pedometers as one of many components. Interventions were heterogeneous in terms of the other components that they incorporated. No studies used pedometers alone, nor were co‐interventions limited to pedometer‐focused supporting components to increase motivation (e.g. step goals, diaries, teams, rewards), although all included some components of this type.
Three used organisational action to engage local staff in development and implementation of the programme, such as employees nominated or volunteered to be champions (Audrey 2015), management and employees involved in project objectives, implementation and encouragement via joint employee–management steering committees (Dishman 2009), or employees on advisory panels to provide feedback on planning, implementation, and acceptability of all intervention activities (Linde 2012). Five used professional individualised contact with a dietician and a physical trainer (Maruyama 2010), a researcher (Aittasalo 2012; Morgan 2011), or a counsellor (Maruyama 2010; Morgan 2011; Ribeiro 2014; Talbot 2011). Three used personalised websites (Carr 2013; Maruyama 2010; Morgan 2011). Two used group‐based incentives for reaching designated goals such as lunch bags, intervention t‐shirts, recognition plaques, free catered lunch, and local sporting equipment store gift vouchers (Dishman 2009; Morgan 2011). Three used environmental prompts such as signage (Dishman 2009); motivational signs, decorative posters, and music (Linde 2012); and motivational postcards (Talbot 2011).
All included studies used personal goal‐setting. Two specifically had the goal of 10,000 or more pedometer steps each day (Maruyama 2010; Talbot 2011). Four used participants' personal baseline average number of daily steps as the basis for further step goals: to increase by a minimum of 2000 steps per day over the three months (Ribeiro 2014), to gradually increase the level of activities by 5% to reach at least 10,000 steps per day at the end of the three‐month period (Mansi 2013), or to gradually increase the level of activities by 10% to reach the recommended 150 minutes of moderate‐intensity physical activity per week (Pillay 2014); one did not specify the individual goals (Aittasalo 2012). Two used the 10,000 steps goal if individually chosen with or without an alternative physical activity goal (Dishman 2009), or amongst other personalised strategies to address body weight loss, to reduce energy intake, and to increase energy expenditure (Morgan 2011); three had more general goals of (1) incorporating walking into the journey to and from work (Audrey 2015), and (2) providing advice on how to set goals and suggestions for daily active time (Carr 2013), or personal goals for walking at work (Linde 2012), or walking 100 steps for every 60 minutes of sedentary time (Swartz 2014). Seven used step diaries (Audrey 2015; Dishman 2009; Mansi 2013; Maruyama 2010; Morgan 2011; Ribeiro 2014; Talbot 2011).
Eleven studies reported the pedometer brand: seven studies used a Yamax pedometer, model SW 200 (Dishman 2009; Mansi 2013; Morgan 2011; Swartz 2014; Talbot 2011), SW 700 (Parry 2013), or PW 610 (Ribeiro 2014); and four used an Omron pedometer, model HJ‐7101T (Maruyama 2010), HJ‐150 (Carr 2013), HJ‐750 ITC (Pillay 2014), or Walking Style II (Aittasalo 2012).
Control
Eleven studies compared the pedometer intervention to a 'no intervention' or 'minimal intervention' control condition (Aittasalo 2012; Audrey 2015; Carr 2013; Dishman 2009; Linde 2012; Mansi 2013; Maruyama 2010; Morgan 2011; Pillay 2014; Ribeiro 2014; Viester 2012).
Four studies compared the pedometer intervention to a 'minimal intervention' control condition, which included completing the Centers for Disease Control and Prevention (CDC) health‐risk appraisal and receiving monthly newsletters describing the health benefits of physical activity (Dishman 2009), receiving bi‐weekly general motivational messages (Pillay 2014), receiving three 15‐minute individual sessions and a booklet for general advice on physical activity benefits (Ribeiro 2014), or receiving 'usual care', which included a non‐compulsory periodic health screening (Viester 2012).
Although seven studies compared the pedometer intervention to a 'no intervention' control condition, only two did not intervene at the end of the pedometer intervention (Audrey 2015; Mansi 2013). One study used a cross‐over design, and follow‐up data were not eligible for this review (Maruyama 2010). Two studies stated that they were wait‐list controls and offered intervention material at the end of the three‐month intervention (Dishman 2009), or following the 3.5‐month intervention (Morgan 2011). Another two studies offered the control group a one‐hour seminar and intervention material at the end of the three‐month intervention (Aittasalo 2012), or they provided a DVD containing intervention materials at the end of the two‐year intervention (Linde 2012; two of the three sites obtained).
Four studies compared the pedometer intervention to an alternative physical activity intervention (Parry 2013; Ribeiro 2014; Swartz 2014; Talbot 2011, noting that Ribeiro 2014 included multiple intervention groups and contributed to both comparisons). The alternative physical activity interventions included an active workstation or office ergonomics (Parry 2013); aerobic exercise (Ribeiro 2014); computer prompts to undertake steps (and as a wait‐list control, they also received a one‐hour seminar and intervention material at the end of three months; Swartz 2014); and the US National Guard's usual fitness improvement programme (Talbot 2011).
Eligibility and recruitment
Pedometer interventions versus 'no intervention' control
All but three studies recruited participants based on health status (Audrey 2015; Linde 2012; Viester 2012). Two studies recruited participants based on being healthy (Dishman 2009 ‐ without overt cardiovascular, pulmonary, or metabolic disease; Pillay 2014 ‐ without cancer and with physical ability). Two studies recruited participants based on being unhealthy (Aittasalo 2012 ‐ insufficiently physically active; Maruyama 2010 ‐ risk factors for developing metabolic syndrome). The remaining four recruited participants based on a mix of healthy and unhealthy criteria (Carr 2013 ‐ sedentary, overweight, and physically inactive but without major medical problems; Mansi 2013 ‐ physically inactive but physically able; Morgan 2011 ‐ overweight or obese but without a history of major medical problems; Ribeiro 2014 ‐ physically inactive during leisure time but without a number of health conditions).
All studies first recruited the participating work sites, and then the participants within each site, or they undertook recruitment at only one company.
Studies used a variety of methods to recruit participants but could generally be categorised as individualised or passive. Nine studies used individualised techniques: Aittasalo 2012 circulated information to all employees after the occupational healthcare units recruited the workplaces; Audrey 2015 contacted participants by email or letter after recruitment of the workplace through a mailed leaflet to all Bristol Chamber of Commerce employers; Carr 2013 emailed all employees; Linde 2012 sent emails to all employees deemed eligible by the human resources department of businesses (selected from the business directory) that responded to phone calls and a letter; Maruyama 2010 recruited face‐to‐face at regular medical check‐ups; Morgan 2011 emailed all staff; Pillay 2014 emailed all employees; Viester 2012 recruited face‐to‐face at non‐compulsory periodic health screening; and Dishman 2009 used both individualised (employees sent e‐messages) and passive (onsite flyers, interoffice mail, face‐to‐face meetings, and posters) techniques after the work sites agreed to participate. Two studies used passive techniques: Mansi 2013 put up advertisements (posters) at different work sites including the health clinic, plant administration, cafeterias, and all department notice boards; Ribeiro 2014 put up pamphlets and posters.
Pedometer interventions versus alternative intervention without pedometer
All recruited based on health status. One study was based on being healthy (Talbot 2011 ‐ without a history of major medical problems), two on sedentary occupation (considered unhealthy ‐ Parry 2013; Swartz 2014), and one on a mix (Ribeiro 2014 ‐ physically inactive during leisure time but without a number of health conditions).
Three studies were undertaken at only one company (Ribeiro 2014; Swartz 2014; Talbot 2011), and it is unclear how the three large government organisations were recruited for one study (Parry 2013).
One study did not report participant recruitment (Swartz 2014), two studies used passive techniques (Parry 2013 ‐ at regular monthly staff meetings; Ribeiro 2014 ‐ put up pamphlets and posters), and one study used individualised techniques (Talbot 2011 ‐ automatic after failed physical activity test).
Employee demographics
Pedometer interventions versus 'no intervention' control
Workplaces in this group included 20 office‐based work sites (Aittasalo 2012 ‐ specifics not described); 17 workplaces from professional, scientific and technical, manufacturing, transportation, education, accommodation and food services, public administration, and financial and insurance activities (Audrey 2015); two universities (Carr 2013; Pillay 2014); a home improvement store chain (Dishman 2009); two community colleges; a regional insurance office; a beauty industry corporate headquarters with an attached manufacturing and distribution centre; a utility company office and a national headquarters for a health‐related nonprofit organisation (Linde 2012); a meat processing plant (Mansi 2013); a health insurance association (Maruyama 2010); an aluminium factory (Morgan 2011); a university hospital (Ribeiro 2014); and a construction company (Maruyama 2010; Viester 2012).
The proportion of male participants ranged from 0% in Ribeiro 2014 to 100% in Maruyama 2010, Morgan 2011, and Viester 2012. Among studies that recruited males and females, the proportion of males ranged from 10% in Carr 2013 to 74% in Talbot 2011 (mean 34% ± SD 18%; median 34%). For studies that reported gender by intervention/control group, males were more likely to be randomised to the control group (mean 41% ± SD 24%; median 44%) than to the intervention group (mean 32% ± SD 20%; median 29%) (Aittasalo 2012; Audrey 2015; Carr 2013; Mansi 2013; Pillay 2014; Talbot 2011). Studies recruited adults aged between 17.3 years in Audrey 2015 and 75 years in Linde 2012. The mean age of participants ranged from 32.8 years in Talbot 2011 to 46.64 years in Viester 2012 (overall mean 41.31 ± SD 4.14 years; median 42.9 years). For studies that reported age by intervention/control group, the mean age of participants ranged from 32.7 years (± SD 10.1; Talbot 2011 intervention group) to 47.6 years (± SD 9.9; Carr 2013 control group). For intervention groups, the overall mean of age means was 41.68 ± SD 4.51 years (median 43 years). For control groups, the overall mean of age means was 40.59 ± SD 5.23 years (median 40 years).
Pedometer interventions versus alternative intervention without pedometer
Workplaces in this group included three large government organisations (Parry 2013): a university hospital (Ribeiro 2014); a university (Swartz 2014); and the US National Guard (an army reserve organisation).
The proportion of male participants was 0% (Ribeiro 2014), 19.4% (Parry 2013), 32% (Swartz 2014), and 74.15% (Talbot 2011). The mean age of participants ranged from 33 years in Talbot 2011 to 46 years (± SD 10.5) in the Swartz 2014 pedometer intervention group.
Excluded studies
Of the 321 papers assessed in full text, we determined that 302 did not meet the pre‐specified eligibility criteria for this review, and we excluded them (i.e. because they were RCTs, recruited participants who were not employed, were not undertaken in a workplace setting, did not use a pedometer, did not use a pedometer throughout the intervention period, used accelerometers, also provided pedometers to the control group, did not allow participants to view their step count, or did not measure a physical activity outcome). Those studies most likely to have been considered eligible for the review are listed in the Characteristics of excluded studies table, along with specific reasons for their exclusion. We also excluded two studies because only one workplace cluster was allocated to each of the intervention and control arms (Baghianimoghaddam 2016; Racette 2009). In our opinion, this was not adequate to reduce the risk of imbalance of confounders between the two study arms. This was an additional criterion that was not originally planned (at the protocol stage).
Risk of bias in included studies
For details of risk of bias in included studies, see the Characteristics of included studies table. A brief visual summary is given in Figure 2. As we had hypothesised, given the nature of physical activity as an intervention and the public workplace setting, none of the studies was able to successfully blind all participants, personnel, or outcome measurements, and most studies were rated at unclear or high risk for a number of other domains. Only one study was assessed as overall at low risk of bias for all included outcomes (Carr 2013). A summary of assessments against each risk of bias domain is outlined below. Overall risk of bias was assessed separately for each outcome, incorporated into GRADE assessments of the certainty of evidence, and reported accordingly throughout the review.
2.

Risk of bias summary: review authors' judgements about each risk of bias item for each included study.
Allocation
We judged random sequence generation to be at unclear risk of bias for four studies due to insufficient detail provided about methods of generating the random sequence (Mansi 2013; Pillay 2014; Swartz 2014; Talbot 2011). We judged allocation concealment to be at unclear risk for five studies (Aittasalo 2012; Dishman 2009; Pillay 2014; Ribeiro 2014; Talbot 2011), again due to insufficient information provided on this element of the study methods. All other studies were at low risk of bias in these two domains.
Blinding
Only one study was judged at low risk for blinding of participants and personnel (performance bias). Morgan 2011 was able to achieve blinding of participants through allocation of clusters of shift workers in an industrial setting: workers receiving the intervention were not on the same roster as workers in the control group. All other studies were considered at high risk in this domain.
Given the challenges of blinding in this field, the level of risk for blinding of outcome assessment (detection bias) largely depended on whether the outcome measure was robust enough to be unaffected by the absence of blinding. Six studies were rated as low risk in this domain for physical activity and sedentary behaviours, largely when these were electronically collected by a pedometer or accelerometer and were not self‐reported (Audrey 2015; Carr 2013; Maruyama 2010; Parry 2013; Pillay 2014; Swartz 2014). No studies were assessed at low risk for quality of life measures. All studies were assessed at low risk for objectively measured risk factors for chronic disease, including BMI, weight, blood pressure, cholesterol, etc. Two studies were assessed at low risk for reporting of adverse effects (Audrey 2015; Morgan 2011), two at unclear risk (Linde 2012; Parry 2013), and the remainder at high risk.
Incomplete outcome data
A number of participants withdrew or were lost to follow‐up in most studies, but the level of risk in this domain was assessed using sensitivity analysis to identify whether the observed effect measure was robust to plausible high and low risk assumptions about missing data. As such, this domain also varied by outcome. Of those studies reporting adverse effects, only one was judged at low risk of bias (Morgan 2011). For all other outcomes, five studies were assessed at low risk of bias (Carr 2013; Mansi 2013; Pillay 2014; Ribeiro 2014; Viester 2012).
Selective reporting
We attempted to locate study protocols or trials register records for all included studies, to compare available outcomes and analyses with those planned ahead of time. Four studies had published protocols (Audrey 2015; Mansi 2013; Parry 2013; Ribeiro 2014), and four were registered at a clinical trials register (Carr 2013; Linde 2012; Morgan 2011; Ribeiro 2014). Five studies were judged at low risk of bias on this basis (Audrey 2015; Carr 2013; Linde 2012; Mansi 2013; Pillay 2014). Three were judged at high risk of bias, with identifiable unreported or selectively reported outcome data (Parry 2013; Ribeiro 2014; Viester 2012). The remainder were judged unclear.
Other potential sources of bias
Three studies were judged to be at high risk of bias for reasons arising from their cluster‐randomised design. In Audrey 2015, recruitment of participants occurred after randomisation, and it is possible that knowledge of the intervention affected the types of participants recruited (noting that there was a substantive difference in numbers recruited to each group). In Dishman 2009, although work sites were allocated at random, the nature of the intervention offered at each specific site would have been clear to individual participants before they voluntarily enrolled. Following cluster‐randomisation, recruitment of individuals at each work site was voluntary. Volunteers were permitted to join the study after allocation and baseline measurement, at which point the nature of the intervention would have been clear, leading to possible differences in the types of participants recruited (and again, there were differences in recruitment rates between groups). In Morgan 2011, the small number of clusters may have led to an increased chance of an important baseline imbalance between randomised groups in terms of the clusters or the individuals.
Effects of interventions
Pedometer intervention versus 'no intervention' control
Findings for our main outcomes for this comparison and the detailed assessment of certainty using GRADE are summarised in Table 1. We found no studies that assessed long‐term follow‐up after completion of the intervention (> 12 months ‐ our optimal outcome time point) or short‐term follow‐up after completion of the intervention (< 1 month). We found no studies with a short‐duration intervention period (< 1 month).
Primary outcome: physical activity
Follow‐up after completion of the intervention
Six studies assessed physical activity at medium‐term follow‐up after completion of the intervention (range 3 to 10 months; see Analysis 1.1) (Aittasalo 2012; Audrey 2015; Mansi 2013; Maruyama 2010; Ribeiro 2014; Viester 2012). Due to very high statistical heterogeneity (I² = 94%), we were unable to undertake meta‐analysis. We assessed the evidence to be at very low certainty, meaning that pedometer interventions may have no effect on physical activity but the effect is very uncertain. Individual studies reported a range of effects on physical activity from little to no effect (ratio of means (RoM) 0.91, 95% confidence interval (CI) 0.75 to 1.11, equivalent to the intervention group undertaking 46 fewer METs minutes/week than the control group, or 971 fewer steps/d; Maruyama 2010) to likely improvement (RoM 2.66, 95% CI 2.17 to 3.26, equivalent to the intervention group undertaking 863 more total METs minutes/week than the control group, or 3700 more steps/d; Mansi 2013). This last study appeared to be an outlier, reporting a substantially larger effect than the other studies and accounting for the high heterogeneity. However, no specific characteristic could be readily identified to cause this difference based on our pre‐specified categories considered likely to modify the effect (see Subgroup analysis and investigation of heterogeneity).
1.1. Analysis.

Comparison 1: Pedometer intervention vs minimal intervention, Outcome 1: Physical activity: combined (follow‐up after completion)
At completion of the intervention
One study assessed physical activity immediately at completion of a long‐duration (two year) intervention (see Analysis 1.2). Linde 2012 observed that participants in the intervention group on average appeared to have lower levels of physical activity (RoM 0.91, 95% CI 0.63 to 1.31; 1299 participants) but with a wide confidence interval consistent with the possibility of a large reduction or a large increase in physical activity.
1.2. Analysis.

Comparison 1: Pedometer intervention vs minimal intervention, Outcome 2: Physical activity: combined (at completion of intervention)
Nine studies assessed physical activity immediately at completion of interventions of medium duration (range 10 weeks to 6 months) (Aittasalo 2012; Carr 2013; Dishman 2009; Mansi 2013; Maruyama 2010; Morgan 2011; Pillay 2014; Ribeiro 2014; Viester 2012). Participation in the intervention appears to improve physical activity (RoM 1.37, 95% CI 1.11 to 1.71; 1672 participants), which is roughly equivalent to the intervention group taking 1900 more steps/d or 470 more METs minutes/week compared to the control group, although heterogeneity between studies was very high (I² = 86%).
Measurements at completion of the intervention were not our main outcomes of interest, and we performed no GRADE assessment.
In summary, although pedometer interventions appear to improve physical activity during the course of medium‐ or long‐duration interventions, it is uncertain whether effects are sustained in the medium term after completion of the intervention.
Secondary outcome: sedentary behaviour
Follow‐up after completion of the intervention
One study assessed sedentary behaviour at medium‐term (six months) follow‐up after completion of the intervention (Aittasalo 2012; see Analysis 1.3). Pedometers may have an effect on sedentary behaviour, but the effect is very uncertain (mean difference (MD) ‐33.00 minutes/d, 95% CI ‐84.28 to 18.28; 172 participants).
1.3. Analysis.

Comparison 1: Pedometer intervention vs minimal intervention, Outcome 3: Sedentary behaviour (min/d)
At completion of the intervention
Two studies measured sedentary behaviour immediately at completion of medium‐duration interventions (range 3 to 6 months; see Analysis 1.3) (Aittasalo 2012Carr 2013). Researchers observed a large reduction in sedentary time of MD ‐44.09 minutes/d (95% CI ‐99.51 to 11.33; 227 participants), although the confidence intervals were also consistent with the possibility of an increase in sedentary time, and heterogeneity between studies was moderate (I² = 57%).
One study assessed sedentary behaviour at completion of a long‐duration intervention (two years) and observed on average a slight increase in sedentary behaviour, but with wide confidence intervals consistent with a large decrease or increase (MD 16.60 minutes/d, 95% CI ‐61.11 to 93.18; 1354 participants) (Linde 2012).
Measurements at completion of the intervention were not our main outcomes of interest, and we performed no GRADE assessment.
In addition, one study did not report its findings (Audrey 2015), and another study collected data on sedentary time for only a subset of participants (Viester 2012).
In summary, although pedometer interventions appear to improve sedentary behaviour during the course of medium‐duration interventions, it is uncertain whether effects are sustained over the course of a long‐term intervention or after the intervention is finished.
Secondary outcome: cardiovascular disease and type 2 diabetes risk factors
Anthropometric measures
Follow‐up after completion of the intervention
Body mass index (BMI) was assessed at medium‐term (range 3 to 8 months) follow‐up after completion of the intervention by three studies (Aittasalo 2012; Mansi 2013; Viester 2012; see Analysis 1.4). Low‐certainty evidence suggests that pedometer intervention may improve (reduce) BMI slightly in the medium term (MD ‐0.64 kg/m², 95% CI ‐1.45 to 0.18; 486 participants).
1.4. Analysis.
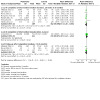
Comparison 1: Pedometer intervention vs minimal intervention, Outcome 4: CVD risk factor: body mass index (BMI; kg/m²)
Three studies measured waist circumference (WC) at medium‐term follow‐up after completion of the intervention (range 3 to 8 months; see Analysis 1.5) (Mansi 2013; Ribeiro 2014; Viester 2012), finding an uncertain effect consistent with the possibility of a slight improvement in WC (MD ‐0.77 cm, 95% CI ‐1.91 to 0.37; 439 participants), although with low heterogeneity (I² = 16%).
1.5. Analysis.

Comparison 1: Pedometer intervention vs minimal intervention, Outcome 5: CVD risk factor: waist circumference (cm)
At completion of the intervention
Seven studies (see Analysis 1.4) measured BMI immediately at completion of medium‐duration interventions (range 10 weeks to 6 months) and observed a slight improvement (reduction) (MD ‐0.67 kg/m², 95% CI ‐0.1.28 to ‐0.06; 751 participants) (Aittasalo 2012; Carr 2013; Mansi 2013; Maruyama 2010; Morgan 2011; Pillay 2014; Viester 2012). Heterogeneity was moderate (I² = 60%). Linde 2012 assessed BMI immediately at completion of a long‐duration intervention (two years) and observed a negligible increase (worsening) in BMI on average (MD 0.67 kg/m², 95% CI ‐0.17 to 1.51; 1405 participants).
Seven studies (see Analysis 1.5) measured WC at completion of medium‐duration interventions (range 10 weeks to 6 months; MD ‐1.67 cm, 95% CI ‐3.85 to 0.51; 694 participants) (Carr 2013; Mansi 2013; Maruyama 2010; Morgan 2011; Pillay 2014; Ribeiro 2014; Viester 2012). This represents an uncertain effect consistent with a possible increase or decrease, and heterogeneity for medium‐term measures was high (I² = 85%). WC was not a main outcome of interest; therefore no GRADE assessment was performed. No study reported WC at completion of a long‐term intervention.
In addition, Ribeiro 2014 reported weight through the time of publication and did not report BMI.
In summary, pedometer interventions may slightly improve BMI during the course of medium‐duration interventions and at medium‐term follow‐up after completion of the intervention, but it is uncertain if any effect is sustained over the course of a long‐duration intervention. There is no clear evidence of an effect on WC.
Blood pressure
Follow‐up after completion of the intervention
Two studies assessed systolic (SBP) and diastolic blood pressure (DBP) following medium‐term (three to eight months) follow‐up after completion of the intervention (see Analysis 1.6 and Analysis 1.7) (Mansi 2013; Viester 2012). Moderate‐certainty evidence shows that pedometer interventions probably make little or no difference to SBP (MD ‐0.08 mmHg, 95% CI ‐3.26 to 3.11; 315 participants). The DBP finding was consistent with the systolic finding (MD 0.70 mmHg, 95% CI ‐1.34 to 2.73; 315 participants), although DBP was not considered a main outcome for this review, and no GRADE assessment was performed. No statistical heterogeneity was observed for either measure (I² = 0).
1.6. Analysis.

Comparison 1: Pedometer intervention vs minimal intervention, Outcome 6: CVD risk factor: systolic blood pressure (mmHg)
1.7. Analysis.

Comparison 1: Pedometer intervention vs minimal intervention, Outcome 7: CVD risk factor: diastolic blood pressure (mmHg)
At completion of the intervention
Six studies measured blood pressure at completion of medium‐duration interventions (range 10 weeks to 6 months) and observed no clear evidence of an effect on SBP (MD ‐1.56 mmHg, 95% CI ‐3.66 to 0.53; 571 participants) or DBP (MD ‐0.71 mmHg, 95% CI 2.57 to 1.14; 571 participants) (Carr 2013; Mansi 2013; Maruyama 2010; Morgan 2011; Pillay 2014; Viester 2012). Heterogeneity was very low for both measures (I² = 0%). No GRADE assessment was performed. No studies assessed blood pressure after long (> 12 months) pedometer interventions.
One study assessed resting heart rate and reported that on average, those allocated to the medium‐length (three‐month) pedometer intervention had a lower resting heart rate at completion of the intervention than those allocated to the control group (MD ‐7.90 beats per minute, 95% CI ‐11.59 to ‐4.21; 110 participants) (Morgan 2011). No GRADE assessment was performed. We hypothesised that resting heart rate would not change due to a low‐impact health intervention. It is important to note that this benefit may be due to other factors such as increased participant calmness at the second round of data collection. Hence, the significant benefits for resting heart rate in this one small study should be interpreted with caution.
In summary, there is no clear evidence that pedometer interventions affect blood pressure during the course of medium‐duration interventions, and there is moderate certainty that they make little to no difference to blood pressure at medium‐term follow‐up after completion of the intervention.
Biochemical measures
Follow‐up after completion of the intervention
We found no studies that assessed biochemical measures at follow‐up after completion of the intervention.
At completion of the intervention
Two studies assessed biochemical measures at completion of medium‐duration (three to four months) interventions (Carr 2013; Maruyama 2010). Low‐density lipoprotein (LDL) cholesterol was considered a main outcome of interest for this review (see Analysis 1.8). Pedometer interventions may have an effect on LDL cholesterol (MD ‐3.58 mg/dL, 95% CI ‐10.76 to 3.59; 2 studies; 127 participants), but the effect is very uncertain.
1.8. Analysis.

Comparison 1: Pedometer intervention vs minimal intervention, Outcome 8: CVD risk factor: cholesterol: LDL
In the same studies, little to no effect on high‐density lipoprotein (HDL) cholesterol was observed (MD ‐0.94 mg/dL, 95% CI ‐3.77 to 1.89; 2 studies; 127 participants; see Analysis 1.9), and the effect on triglycerides was uncertain (MD ‐10.83 mg/dL, 95% CI ‐33.84 to 12.18; 2 studies; 127 participants; see Analysis 1.10). Maruyama 2010 assessed blood glucose at completion of a four‐month intervention and observed moderate improvement (reduction) (MD ‐4.80 mg/dL, 95% CI ‐9.14 to ‐0.46; 87 participants; 4‐month intervention). No statistical heterogeneity was observed for these outcomes (I² = 0%). These outcomes were not considered main outcomes for this review; therefore no GRADE assessment was performed.
1.9. Analysis.

Comparison 1: Pedometer intervention vs minimal intervention, Outcome 9: CVD risk factor: cholesterol: HDL
1.10. Analysis.

Comparison 1: Pedometer intervention vs minimal intervention, Outcome 10: CVD risk factor: triglycerides
In summary, it is uncertain whether pedometer interventions improve LDL cholesterol during the course of medium‐duration interventions. We found no studies that assessed biochemical measures during follow‐up after completion of the intervention. Effects on other biochemical measures were also uncertain, and no clear evidence was observed.
Disease risk scores
Viester 2012 listed the European Systematic Coronary Risk Evaluation (SCORE) in the study protocol but did not report the results. None of the other included studies reported disease risk scores as an outcome in this comparison.
Secondary outcome: quality of life
Follow‐up after completion of the intervention
Mansi 2013 assessed the mental health component of quality of life using the Short Form 36 version 2 scale (SF‐36v2) at medium‐term (three months) follow‐up after completion of the intervention. Pedometer interventions may have an effect on the mental health component of quality of life, but the effect is very uncertain (MD 1.30 units, 95% CI ‐1.80 to ‐4.40; 58 participants; see Analysis 1.11).
1.11. Analysis.

Comparison 1: Pedometer intervention vs minimal intervention, Outcome 11: Quality of life: mental health component
Two studies assessed the physical health component of quality of life using the SF‐36v2 and RAND‐36 scales at medium‐term (range 3 to 6 months) follow‐up after completion of the intervention (Mansi 2013; Viester 2012). The intervention appeared to make little to no difference (standardised mean difference (SMD) 0.08 units, 95% CI ‐0.14 to 0.30; 310 participants; see Analysis 1.12), with no statistical heterogeneity (I² = 0%). This was not a main outcome of interest for the review, and no GRADE assessment was performed.
1.12. Analysis.

Comparison 1: Pedometer intervention vs minimal intervention, Outcome 12: Quality of life: physical health component
At completion of the intervention
Two studies measured the mental health component using the SF‐36v2 or SF‐12 scale (which can be converted to the same units) at completion of medium‐duration interventions (range 3 to 3.5 months) and observed a very slight improvement (MD 3.18 units, 95% CI ‐1.32 to 07.68; 168 participants; see Analysis 1.11) (Mansi 2013; Morgan 2011), although heterogeneity was high (I² = 70%).
Two studies measured the physical health component using the SF‐36v2 and RAND‐36 scales at completion of medium‐duration interventions (six months) and observed little to no difference (MD 0.08 units, 95% CI ‐0.14 to 0.30; 210 participants; see Analysis 1.12), with moderate heterogeneity (I² = 53%) (Mansi 2013; Viester 2012). One additional study reported the physical health component at completion of a medium‐duration intervention (three months) but reported the results as change from baseline using the SF‐12 scale and could not be standardised alongside the other two studies in a single meta‐analysis (Morgan 2011). This study reported a consistent finding of little to no difference (MD 2.8 units, 95% CI ‐0.30 to 5.9; 110 participants). These time points were not considered main outcomes for the review, and no GRADE assessment was performed.
We found no studies that assessed long‐duration (> 12 months) pedometer interventions.
Aittasalo 2012 planned to but did not assess quality of life. Ribeiro 2014 measured quality of life but did not report the results.
In summary, the effect of pedometer interventions on quality of life is very uncertain. A slight improvement in mental health quality of life was observed at completion of medium‐duration interventions, but all observed effects were small to negligible.
Secondary outcome: adverse effects
Follow‐up after completion of the intervention
Two studies provided low‐certainty evidence suggesting that pedometer interventions probably reduce the rate of adverse effects at medium‐term follow‐up (range 6 to 9 months) after completion of the intervention (odds ratio (OR) 0.50 95% CI 0.30 to 0.84; 286 participants; see Analysis 1.13), with no statistical heterogeneity (I² = 0%) (Aittasalo 2012; Morgan 2011). Aittasalo 2012 measured exercise‐related adverse events six months after the intervention, and Morgan 2011 compared reported work site injuries in the 12 months before to the 12 months including and following intervention implementation (8.5 months' follow‐up). The absolute impact of this reduction would depend on the definitions and rates of adverse effects in the population, given that some populations observed no adverse effects. In a population comparable to Aittasalo 2012, where a relatively high rate of adverse effects of 24 people experiencing an adverse effect per hundred was observed in the control group, this would translate to a reduction to 14 people per hundred (95% CI 9 to 21 people).
1.13. Analysis.

Comparison 1: Pedometer intervention vs minimal intervention, Outcome 13: Adverse effects
In addition, Audrey 2015 reported zero adverse effects due to walking to work (including physical and social adverse effects) at eight months' follow‐up after completion of the intervention, but this information could not be incorporated into the meta‐analysis.
At completion of the intervention
Linde 2012 reported zero adverse effects (not defined) at completion of a long‐duration intervention (two years), but these data could not be included in a meta‐analysis. Aittasalo 2012 reported exercise‐related adverse effects at completion of a medium‐duration intervention (six months) and observed uncertain evidence of effect (OR 0.87, 95% CI 0.39 to 1.94; 180 participants; see Analysis 1.13). These time points were not of main interest to this review, and no GRADE assessment was performed.
In addition, Mansi 2013 collected adverse events only in the pedometer intervention group as part of a feasibility trial (reported no adverse events), which could not be analysed in this review.
In summary, moderate‐certainty evidence shows that pedometer interventions probably reduce the rate of adverse effects in the medium term after completion of the intervention, although the reason for this is uncertain. Aittasalo 2012 measured an increase in physical activity following completion of the intervention, and so in theory, increased exercise could lead to improved health and fitness. Morgan 2011 did not report physical activity at a comparable time point. The effects remain at completion of pedometer interventions.
Pedometer intervention versus alternative intervention without pedometer
Findings for our main outcomes for this comparison and detailed assessment of certainty using GRADE are summarised in Table 2. We found no studies that assessed long‐term follow‐up after completion of the intervention (> 12 months ‐ our optimal outcome time point) or short‐term follow‐up after completion of the intervention (< 1 month). We found no studies that measured outcomes immediately at completion of a long‐duration intervention (> 12 months).
Primary outcome: physical activity
Follow‐up after completion of the intervention
Ribeiro 2014 assessed physical activity at medium‐term follow‐up (three months) after completion of the intervention. Pedometer interventions may improve physical activity, but the effect is very uncertain (RoM 1.07, 95% CI 0.97 to 1.18; 143 participants; 3 months' follow‐up after completion of the intervention; see Analysis 2.1). To assist interpretation, an RoM of 1.07 is roughly equivalent to the intervention group taking 681 steps/d more than the comparison group, but with a confidence interval also consistent with the possibility of a small decrease or a large increase.
2.1. Analysis.

Comparison 2: Pedometer intervention vs alternative physical activity intervention, Outcome 1: Physical activity: combined
At completion of the intervention
Three studies assessed physical activity at completion of medium‐duration interventions (three to six months), reporting an uncertain effect on physical activity (RoM 1.04, 95% CI 0.92 to 1.17; 273 participants; see Analysis 2.1) with moderate heterogeneity (I² = 48%) (Parry 2013; Ribeiro 2014; Talbot 2011). To assist interpretation, an RoM of 1.04 is roughly equivalent to the intervention group taking 398 steps/d or 10 METs minutes/workday more than the comparison group, but with a confidence interval also consistent with an important decrease or increase.
Swartz 2014 assessed physical activity at completion of a short‐duration intervention (two weeks) and appeared to observe an increase in physical activity (RoM 1.26, 95% CI 0.96 to 1.66; 60 participants), but the result was uncertain, with a confidence interval also consistent with a small decrease or a very large increase in physical activity. For Swartz 2014, the RoM of 1.26 was equivalent to the intervention group taking 1032 steps/workday more than the alternative intervention group. These time points were not of main interest to this review, and no GRADE assessment was observed.
In summary, it is uncertain whether pedometer interventions increase physical activity in comparison to alternative physical activity interventions.
Secondary outcome: sedentary behaviour
Follow‐up after completion of the intervention
We found no studies that assessed sedentary behaviour at follow‐up after completion of the intervention.
At completion of the intervention
One study measured sedentary behaviour as a percentage of pedometer wear time at completion of a medium‐duration intervention (three months) (Pillay 2014). Pedometer interventions may improve sedentary behaviour, but the effect is very uncertain (MD 1.48% of accelerometer wear time, 95% CI ‐1.52 to 4.49; 62 participants).
One study measured sedentary behaviour in minutes per workday after completion of a short‐duration intervention (two weeks) and appeared to observe an increase (worsening) in sedentary time in the pedometer group compared to the alternative exercise intervention group (MD 25.00 minutes/workday, 95% CI 0.61 to 49.39; 60 participants), although no GRADE assessment was performed on this time point.
In summary, it is uncertain whether pedometer interventions improve sedentary behaviour during the course of short‐ to medium‐duration interventions in comparison to alternative exercise interventions.
Secondary outcome: cardiovascular disease and type 2 diabetes risk factors
Anthropometric measures
Follow‐up after completion of the intervention
We found no studies that assessed BMI at follow‐up after completion of the intervention.
Ribeiro 2014 assessed WC (cm) at medium‐term follow‐up (three months) after completion of the intervention. No clear evidence of effect was observed (MD 0.75 cm, 95% CI ‐0.49 to 1.99; 148 participants).
At completion of the intervention
Two studies (see Analysis 2.2) assessed BMI at completion of medium‐duration interventions (three to six months) (Parry 2013; Talbot 2011). Pedometer interventions may improve BMI at completion of medium‐duration pedometer interventions, but the effect is very uncertain (MD ‐1.23 kg/m², 95% CI ‐2.85 to 0.39; 144 participants). No statistical heterogeneity was observed (I² = 0%).
2.2. Analysis.

Comparison 2: Pedometer intervention vs alternative physical activity intervention, Outcome 2: CVD risk factor: body mass index (BMI; kg/m²)
In addition, Ribeiro 2014 reported BMI as a planned measure in the study protocol but did not report the results.
Ribeiro 2014 measured WC at completion of its medium‐duration intervention (three months) and observed no clear evidence of effect (MD 0.76, 95% CI ‐0.48 to 2.00; 148 participants). We found no studies that assessed WC at completion of a short‐duration intervention. This outcome was not of main interest to the review, and no GRADE assessment was performed. .
In summary, it is uncertain whether pedometer interventions affect adiposity in comparison to alternative exercise interventions.
Blood pressure
Follow‐up after completion of the intervention
No studies reported blood pressure at follow‐up after completion of the intervention.
At completion of the intervention
Talbot 2011 reported blood pressure at completion of a medium‐duration intervention (six months). Pedometers may improve SBP at completion of medium‐duration interventions, but the effect is very uncertain (MD ‐4.00 mmHg, 95% CI ‐10.15 to 2.15; 94 participants). The result for DBP was similar (MD ‐2.20 mmHg, 95% CI ‐6.74 to 2.34; 94 participants), although no GRADE assessment was performed on this result.
In addition, Ribeiro 2014 measured blood pressure but did not report the results.
In summary, it is uncertain whether pedometer interventions improve blood pressure in comparison to alternative exercise interventions.
Biochemical measures
Follow‐up after completion of the intervention
No studies reported LDL cholesterol at follow‐up after completion of the intervention.
At completion of the intervention
Talbot 2011 measured LDL cholesterol at completion of a medium‐duration intervention. Pedometer interventions may have an effect on LDL cholesterol, but the effect is very uncertain (MD 0.60 mg/dL, 95% CI ‐15.08 to 16.28; 94 participants). The same study appeared to observe an increase in HDL cholesterol with the pedometer intervention (7.50 mg/dL, 95% CI 1.55 to 13.45), although no GRADE assessment was performed on this outcome. This result should be interpreted with caution.
No studies reported cholesterol at completion of a short‐term intervention.
In addition, triglycerides were included in the protocol for Talbot 2011, but study authors did not include these results in their study report. Ribeiro 2014 listed blood glucose in the study protocol but did not report the results.
In summary, it is uncertain whether pedometer interventions improve cholesterol in comparison to alternative physical activity interventions. Pedometer interventions may be associated with a comparative increase in HDL cholesterol during the course of a medium‐duration intervention, but this should be considered uncertain.
Disease risk scores
Follow‐up after completion of the intervention
No studies measured disease risk scores at follow‐up after completion of the intervention.
At completion of the intervention
Talbot 2011 measured 10‐year hard coronary heart disease (CHD) risk levels (recognised and unrecognised myocardial infarction, coronary insufficiency, CHD death) calculated via the Framingham study risk equations, at completion of a medium‐duration intervention (six months). No important difference was observed between pedometers and the alternative exercise intervention (MD 0.00%, 95% CI ‐0.11 to 0.11; 94 participants), although this outcome was not of main interest to the review, and no GRADE assessment was performed.
No studies measured disease risk scores at completion of a short‐duration intervention.
In summary, there appears to be no evidence of a difference between pedometer interventions and alternative exercise interventions in disease risk scores, but this should be considered uncertain.
Secondary outcome: quality of life
Ribeiro 2014 measured quality of life (SF‐36) at completion of a medium‐duration (three‐month) intervention and at medium‐term (three‐month) follow‐up after completion of the intervention but did not report the results. None of the other included studies reported quality of life as an outcome.
Secondary outcome: adverse effects
Parry 2013 reported, "No adverse outcomes were reported for any participants" at completion of a medium‐duration (three‐month) intervention. None of the other included studies reported adverse effects as an outcome.
Subgroup analysis
We conducted subgroup analyses by participant risk profile, that is, comparing studies that specifically recruited participants at high risk of cardiovascular disease or diabetes, or who led lifestyles that were more sedentary than average. These subgroup analyses were conducted for physical activity at medium‐term follow‐up after completion of the intervention (see Analysis 3.1) and for measures at completion of medium‐duration interventions (see Analysis 3.2). No subgroup effect was observed in either case, and the heterogeneity of these studies was not explained by this factor.
3.1. Analysis.
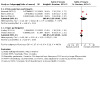
Comparison 3: Subgroup analyses, Outcome 1: Phyical activity: subgroup analysis by participant risk profile of Analysis 1.1 (follow‐up after completion)
3.2. Analysis.

Comparison 3: Subgroup analyses, Outcome 2: Physical activity: subgroup analysis by participant risk profile of Analysis 1.2.1
It was not possible to conduct the remaining planned subgroup analyses in either Comparison 1 or Comparison 2 (see Subgroup analysis and investigation of heterogeneity section). Three included studies included only male participants (Maruyama 2010; Morgan 2011; Viester 2012), but only one study included only women (Ribeiro 2014), and the remaining studies did not report effects by gender to provide sufficient data for this subgroup analysis. No studies reported data broken down by age or educational status. All studies used a step or exercise time goal and a means of recording progress against the goal, such as a step diary.
Subgroup analysis was not possible based on duration of the intervention. In Comparison 1, all intervention periods were of medium duration, with the exception of Linde 2012, which provided an intervention of long duration. In Comparison 2, all studies were of medium duration, with the exception of Swartz 2014, which provided an intervention of short duration.
It was not possible in most cases to classify groups as using an external intervention provider compared to interventions undertaken in the workplace. In most cases, interventions were conducted within the workplace or through existing workplace health service programmes but were initiated by external research groups.
Discussion
Summary of main results
This review aimed to investigate whether introducing interventions that incorporate a pedometer in a workplace setting would be effective for increasing physical activity and improving subsequent health outcomes. We included 14 studies that were heterogeneous in the age of recruited participants, the duration of the intervention, the range of additional components included in the intervention, and the timing of outcome assessment.
Eleven studies compared programmes including a pedometer to what we considered a no‐intervention control group. Our primary interest was the effects sustained after completion of the active intervention. In this comparison, the effects observed on physical activity, sedentary behaviour, and quality of life (mental health component) were very uncertain, and no studies measured biochemical measures or disease risk scores. Low‐certainty evidence suggests that body mass index (BMI) was slightly improved (decreased) at three to eight months' follow‐up after the intervention. Moderate‐certainty evidence shows that pedometer interventions had little or no effect on systolic blood pressure, and low‐certainty evidence suggests that the rate of adverse effects was lower following the pedometer intervention at 6 to 10 months' follow‐up.
Measured at completion of interventions of medium duration (between one month and one year), and indicating changes that may have occurred during the course of the active intervention, pedometer interventions appeared to improve physical activity (average increase approximately 1900 steps/d) and sedentary behaviour (average decrease 44 minutes/d) and appeared to slightly improve BMI (average decrease 0.67 kg/m²) and quality of life (mental health component; average improvement 3.18 units), but these outcomes were not our primary time points of interest, and no GRADE assessment of uncertainty was performed. Effects on systolic blood pressure, low‐density lipoprotein (LDL) cholesterol, and adverse effects were uncertain. No studies measured disease risk scores. One study looked at effects during a long‐term (two‐year) intervention and did not observe any clear effects, throwing further uncertainty on the sustainability of effects of these interventions.
Four studies compared programmes including a pedometer with alternative physical activity interventions. Again, looking first at sustained effects after completion of the active intervention period, the effects observed on physical activity were very uncertain. Sedentary behaviour, BMI, systolic blood pressure, LDL cholesterol, disease risk scores, quality of life (mental health component), and adverse effects were not measured.
Measured at completion of interventions of medium duration, effects on physical activity, sedentary behaviour, BMI, systolic blood pressure, and LDL cholesterol were very uncertain. Quality of life (mental health component) was not reported. One study reported that no adverse effects were observed in either group.
Overall completeness and applicability of evidence
Several limitations are noted for the studies included in this review, which contributed to lack of certainty around the review's conclusions. Although studies included broad working populations and used intervention designs that are likely to be generally applicable to the working population, there were limitations in the completeness of available evidence.
Most included studies used the pedometer as part of a multi‐component intervention compared to no intervention. This makes it difficult to draw conclusions on the effectiveness of pedometers as a specific component to increase physical activity and improve subsequent health outcomes due to the potential confounding effects of other intervention components. Sufficient data were not available to explore the interventions' multiple components, nor other possible sources of heterogeneity, including age, gender, and educational status of participants, or the impact of risk of bias on the results.
Although pedometers formed only one component of the intervention, it was observed that participants did not uniformly find the pedometers useful. As described in relation to Audrey 2015, "this study used pedometers as an optional self‐monitoring tool and participants had mixed views about using them. Although some found them important for goal setting, over half did not use them for practical reasons ... the current study suggests that pedometers were useful for some participants and not for others. It would seem that to develop an intervention that specifically requires their use may restrict the involvement of some potential participants". Although the pedometer is an objective measurer of physical activity, the individual must choose to wear the device. This subjective choice to wear the device may be influenced by forgetfulness, especially after being in contact with water (e.g. when showering or swimming), when the device must be removed; or for appearance reasons, as it may be difficult to wear hip devices with dresses or during certain activities; or deliberately during an intended low activity day.
It is important to note that over the past decade, technological advancement in accelerometers as commercial products has in many ways rendered the use of pedometers outdated. Accelerometers have become cheaper, if not freely available, through Smartphone applications. Accelerometers have been integrated within other devices such as watches and jewelry. They are commonly waterproof, overcoming difficulties with use during water sports and the need to remove during showering. They are now widespread in the community, in contrast to the niche technology of pedometers. Furthermore, '10,000 steps per day' and other public health messages encouraging breaks in sedentary time have been successfully distributed through many avenues, including the workplace. Any future study aiming to test the impact of access to this technology (as distinct from more complex support programmes) would likely find any control arm highly contaminated.
This may be one reason that recent searching (including the final search for this review between 2014 and 2016, and our provisional search update to May 2019) yielded no additional eligible studies (with the exception of one extension of the Audrey 2015 pilot study included in this review), and why further updates of this review may not be useful.
Quality of the evidence
Using the GRADE approach (Higgins 2011a), we assessed the overall certainty of evidence for our main outcomes of interest, and we found most to be of low or very low certainty (see Table 1; Table 2). The certainty of the evidence was commonly downgraded due to high risk of bias in the included studies, which often arose from high levels of attrition and lack of blinding, both of which are likely to be intractable issues in this kind of pragmatic community intervention. Many of the observed effects were imprecise, encompassing a wide range of possible effects, and many outcomes were based on small sample sizes. There were high levels of heterogeneity among observed results, for which adequate evidence was not available to conduct targeted subgroup analyses to identify the causes, among the many variations in populations, interventions, and comparisons in the included studies.
Potential biases in the review process
Throughout the process of conducting this review, we endeavoured to use methods that would minimise risk of bias in our work.
Our literature searches were comprehensive, including a range of electronic databases, trials registers, and contact with identified authors in the field. However, the most recent search (conducted in 2016) is now considerably out of date. Given observed trends in the literature (no eligible studies identified after 2014, and a preliminary update of the search to 2019 identifying only one eligible study that has not been incorporated) and in the community (given the widespread use of accelerometers), it is in our view very unlikely that enough additional studies have been completed to resolve the uncertainties identified in this review. It is more likely that current research in this field will encompass new technology and will focus more broadly on multi‐component support interventions rather than testing of individual technological components.
Data collection for this review was conducted thoroughly and in duplicate. Sufficient detail on the included studies was available for the purposes of analysis, although the level of detail describing the interventions was variable and was dependent on the authors of those studies. Some readers of this review may not find sufficient information available to replicate or assess in detail all the interventions included. Efforts were made to obtain as much additional information as possible, although our focus on the use of pedometers may not have covered all aspects of interest to all readers.
We went to some lengths to ensure that as many data as possible were included in the analysis, including standardised assessment of different measures of physical activity using ratios of means, and imputed values for missing values such as standard deviations. These efforts reduced the level of potential bias arising from exclusion of studies from the analysis, although there is always a level of risk in making the assumptions required in this approach. We were largely unable to test the robustness of data using planned sensitivity analyses, subgroup analyses, and funnel plots, given limitations of the data obtained.
Agreements and disagreements with other studies or reviews
We identified eight systematic reviews related to the broader topics of workplace physical activity interventions, workplace health promotion interventions to increase physical activity, or pedometer interventions in adults. We did not identify any relevant systematic review that assessed sustained changes after completion of interventions.
In relation to the immediate impact of these interventions on physical activity, four reviews found positive effects on physical activity outcomes, broadly consistent with our review. Bravata 2007 reviewed pedometer‐based interventions (27 studies, randomised and non‐randomised; five in a workplace setting). Foster 2013 compared interventions with a pedometer to alternative physical activity interventions (three studies). Commissaris 2016 reviewed interventions to reduce sedentary behaviour and increase physical activity during productive work (six studies of self‐monitoring techniques including pedometers). Jahangiry 2017 reviewed Web‐based physical activity interventions (six studies using pedometer walking interventions). In contrast, Malik 2014 reviewed workplace health promotion interventions for increasing physical activity and identified six studies (five randomised), of which two demonstrated a statistically significant increase against a control group. Reed 2017 reviewed workplace physical activity interventions and did not find a positive effect on metabolic equivalents per week (three studies).
The systematic reviews Bravata 2007, Reed 2017, and Verweij 2011 (11 studies) also found improvements in BMI immediately following an intervention, again consistent with our review.
Workplace pedometer interventions may not increase physical activity enough for blood pressure changes to occur. Igarashi 2018, a systematic review, calculated that although there is no set number of steps (e.g. 10,000 per day) that would cause a reduction in blood pressure, increasing one's step count could do so, which is in contrast to our finding that despite an increase in physical activity, the effect on blood pressure was uncertain. Also in contrast to our uncertain findings on LDL cholesterol is the finding by Reed 2017 that workplace physical activity interventions decrease LDL cholesterol (four studies).
The findings of these reviews reinforce that there may be an immediate impact on physical activity immediately following workplace interventions using pedometers, but these effects may not be greater than those obtained when other physical activity interventions are used, and may not be sustained in the long term. There may be positive effects on other outcomes, including disease risk factors, but uncertainty remains. Considerable heterogeneity in the focus and components of physical activity interventions is a challenge across the literature.
Authors' conclusions
Implications for practice.
Evidence was insufficient to justify clear conclusions about the effectiveness of pedometer interventions in a workplace setting for increasing physical activity and improving subsequent health outcomes.
When compared to minimal intervention, some immediate benefits are seen to occur during a pedometer‐based intervention, but evidence is insufficient to show whether these effects are sustained following completion of the active intervention period, and sustainability during very long interventions (longer than one year) is not assured. This comparison does not demonstrate whether the pedometer is a critical component of physical activity interventions, or whether any similar multi‐component intervention would achieve similar outcomes. When compared to alternative physical activity interventions, the effects overall are very uncertain.
Exercise interventions can have positive effects on employee physical activity and health, although there is currently no reason to suggest that a pedometer‐based intervention would be more effective than other options. Decision‐makers considering allocating resources to large‐scale programmes of this kind should balance expected benefits with realistic expectations about participation (including high levels of withdrawals), and should note that effects may not be sustained over the longer term.
Implications for research.
Several factors could be considered for planning future research in this field. In terms of participants, the existing literature has successfully included a diversity of workplaces and countries and both healthy and higher‐risk populations. In terms of interventions to be investigated, we suggest that more studies are needed that have been designed to identify the core effective components of multi‐component interventions. Pedometers may not be the highest priority component to test for future research, especially given the increased availability of low‐cost accelerometers. Approaches to increase the sustainability of and engagement with the intervention over longer terms should be considered. If the aim of physical activity interventions is to prevent obesity and chronic disease, then the theoretical basis for intervention components and the role of other lifestyle components such as diet could also be considered.
Future research should consider measuring sustained outcomes after completion of the active intervention period and should include more consistently meaningful measures of physical activity (such as total metabolic equivalents (METs)), as well as important outcomes that indicate that increased physical activity is achieving desired outcomes (including anthropometry, blood pressure, quality of life, and reduced risk of adverse effects).
Future studies should ensure that they are designed to achieve low risk of bias. Particular challenges involving research in physical activity include the difficulty of blinding (although this is less important if the intention is to measure the effect of introducing a physical activity programme in a real workplace setting, where uptake would be variable) and high levels of attrition (which may be linked to issues with sustainability of the intervention), both of which could be considered in future intervention designs. Studies should be sufficiently powered to enable subgroup analyses (including intervention components or population categories) in this context of high attrition.
What's new
| Date | Event | Description |
|---|---|---|
| 14 June 2020 | New citation required and conclusions have changed | Updated, with ten new studies included |
| 14 June 2020 | New search has been performed | Updated, with ten new studies included |
History
Protocol first published: Issue 7, 2011 Review first published: Issue 4, 2013
| Date | Event | Description |
|---|---|---|
| 13 October 2013 | Amended | Provided more detailed information on studies awaiting classification that were identified in the updated search in March 2013 |
Acknowledgements
The review authors are grateful for the support and help of many people during the course of this review. Leena Isotalo, Kaisa Neuvonen, and Heikki Laitinen, Information Specialists at Cochrane Work, assisted in designing (LK) and undertaking most of the electronic database searches (excluding CINAHL and trials registry searches, and the 2016 search update). Lorena Romero at Monash University Library assisted with conducting additional searches. Leon Hopkins‐Gamble and Syed Uzair Ahmed assisted in the title and abstract screening, and Leon also drafted the 'Characteristics of included studies' table for newly included studies following the 2016 search. Dario Sambunjak assisted in screening a study in German. From Cochrane Australia, Sharon Kramer assisted with clarification of the discussion requirements, Madeleine Hill assisted with correspondence with study authors, and Joanne McKenzie provided statistical advice. Many contributors to Cochrane Crowd assisted in screening abstracts, including Deirdre Beecher, Hariklia Nguyen, Simon Stones, Alex Coppell, Maura Scott, Vanisree Staniforth, Katarina Paunovic, and Silvana Urru, who screened more than 200 records each, and Anna Noel‐Storr, who co‐ordinated the submission of records to the crowd. We would also like to thank the Co‐ordinating Editor of Cochrane Work, Jos Verbeek, Managing Editors Jani Ruotsalainen and Julitta Boschman, editors Alex Burdorf and Wim van Veelen, and external peer referees Katrien de Cocker, Suzan Robroek, Katriina Kukkonen‐Harjula, Jukka Salmi, and Lisanne Verweij for their comments. Finally, we thank Jani Ruotsalainen, Julitta Boschman, and Kate Cahill for copyediting the text.
Appendices
Appendix 1. CENTRAL search
We ran the following search strategy initially on 1 Feb 2012, and updated on 12 March 2013, 3 December 2014, and 13 December 2016 using appropriate date limits.
| #1 | (work* OR occupat* OR company* OR offic* OR busines*):ti,ab,kw |
| #2 | MeSH descriptor: [Work], this term only |
| #3 | MeSH descriptor: [Workplace], this term only |
| #4 | MeSH descriptor: [Occupational Groups] explode all trees |
| #5 | MeSH descriptor: [Walking] explode all trees |
| #6 | step* near/5 count* |
| #7 | step* near/5 daily |
| #8 | (pedometer* OR manpometer OR "manpo meter" OR step next/1 meter* OR stepmeter*):ti,ab,kw |
| #9 | (walking OR "10,000 step" OR "10,000 steps" OR "10000 steps" OR "10000 step" OR "10 000 step" OR "10 000 steps"):ti,ab,kw |
| #10 | (#1 OR #2 OR #3 OR #4) |
| #11 | (#5 OR #6 OR #7 OR #8 OR #9) |
| #12 | (#10 AND #11) |
| #13 | #12 in Trials |
Appendix 2. CINAHL search
We ran the following search strategy initially on CINAHL through EBSCOhost on 6 Feb 2012, and updated on 14 March 2014, 10 December 2014, and 8 December 2016, using appropriate date limits.
| S1 | TX work or TX works* or TX work’* or TX worka* or TX worke* or TX workg* or TX worki* or TX workl* or TX workp* or TX occupat* or TX company* or TX (offic* OR busines* ) |
| S2 | Walking or TX Walking or MW Walking |
| S3 | TX step or TX steps or TX “10,000 step*” or TX “10000 step*” |
| S4 | TX count or TX counts or TX counting or TX counter or TX counters or TX counting or TX daily |
| S5 | S3 and S4 |
| S6 | TX pedometer* or TX manpo‐meter or TX "manpometer" or TX "manpo meter" |
| S7 | S2 or S5 or S6 |
| S8 | TX randomized controlled trial or TX controlled clinical trial or AB placebo or TX clinical trials or AB randomly or TI trial or TX intervent* |
| S9 | S1 and S7 and S8 |
| S10 | TX animal not TX human |
| S11 | S9 not S10 |
Appendix 3. MEDLINE search
We ran the following search strategy initially on MEDLINE through PubMed on 30 Janurary 2012, and updated on 11 March 2013, 1 December 2014, and 9 December 2016.
| #1 | Search work[tw] OR works*[tw] OR work'*[tw] OR worka*[tw] OR worke*[tw] OR workg*[tw] OR worki*[tw] OR workl*[tw] OR workp*[tw] OR occupat*[tw] OR company*[tw] OR offic*[tw] OR busines*[tw] |
| #2 | Search "Walking"[Mesh] OR walking[tw] OR "10,000 step"[tw] OR "10,000 steps"[tw] OR "10000 steps"[tw] OR "10000 step"[tw] OR "10 000 step"[tw] OR "10 000 steps"[tw] |
| #3 | Search (step[tw] OR steps[tw]) AND (count[tw] OR counts[tw] OR counting[tw] OR counter[tw] OR counters[tw] OR daily[tw]) |
| #4 | Search (pedometer* OR manpo‐meter[tw] OR "manpometer"[tw] OR "manpo meter"[tw] OR "step meter"[tw] OR "step meters"[tw] OR stepmeter*[tw]) |
| #5 | Search #2 OR #3 OR #4 |
| #6 | Search (randomized controlled trial[pt] OR controlled clinical trial[pt] OR randomized[tiab] OR placebo[tiab] OR clinical trials as topic[mesh:noexp] OR randomly[tiab] OR trial[ti] NOT (animals[mh] NOT humans[mh])) |
| #7 | Search intervent* |
| #8 | Search #6 OR #7 |
| #9 | Search #1 AND #5 AND #8 |
Appendix 4. Embase search
We ran the following search strategy initially on Embase through Embase.com on 31 Janurary 2012, and updated on 11 March 2013, 1 December 2014, and 13 December 2016.
| #1 | (work*or occupat*or company*or offic*or busines*).de,ab,ti. |
| #2 | ('10,000 step' or '10,000 steps' or '10000 steps' or '10000 step' or '10 000 step' or '10 000 steps').ab,ti. |
| #3 | 'walking'/exp OR walking {No Related Terms} |
| #4 | (count* OR daily) NEAR/5 step* {No Related Terms} |
| #5 | pedometer* OR 'manpometer' OR 'manpo meter' OR 'step meter' OR 'step meters' OR stepmeter* {No Related Terms} |
| #6 | #2 OR #3 OR #4 OR #5 |
| #7 | 'controlled clinical trial'/exp {No Related Terms} |
| #8 | intervention* {No Related Terms} |
| #9 | #1 AND #6 |
| #10 | #7 AND #9 |
| #11 | #8 AND #9 |
| #12 | #10 OR #11 {No Related Terms} |
| #13 | 'nonhuman'/exp {No Related Terms} |
| #14 | #12 NOT #13 |
Appendix 5. OSH UPDATE
We searched the following reference databases.
Health and Safety Information Centre of The International Labour Office in Geneva, Switzerland (CISDOC).
UK Health and Safety Executive Information Services and Health and Safety Commission (HSELINE).
INTERNATIONAL BIBLIOGRAPHIC DATABASE.
Occupational Safety and Health Research Institute (IRSST).
US National Institute for Occupational Safety and Health (NIOSHTIC, NIOSHTIC‐2).
Ryerson International Labour Occupational Safety and Health (RILOSH).
We ran the following search strategy initially on OSH UPDATE on 31st Janurary 2012, 11 March 2013, and 1 December 2014. For the 2016 update, it was decided not to include OSH UPDATE, as the results of previous searches had not revealed additional included studies.
| #1 | GW{pedometer* OR manpo‐meter OR "manpometer" OR "manpo meter" OR "step meter" OR "step meters" OR stepmeter*} |
| #2 | GW{walking OR 10,000 step OR 10,000 steps OR 10000 steps OR 10000 step OR 10 000 step OR 10 000 steps OR foot steps} |
| #3 | GW{(step OR steps) AND (count OR counts OR counting OR counter OR counters OR daily)} |
| #4 | #1 OR #2 OR #3 |
| #5 | GW{intervent* OR random*} OR TW{trial*} |
| #6 | #4 AND #5 |
| #7 | DC{OUBIB OR OUCISD OR OUHSEL OR OUISST OR OUNIOC OR OUNIOS OR OURILO} |
| #8 | #6 AND #7 |
Appendix 6. Web of Science search
We ran the following search strategy initially on Web of Science through apps.isiknowledge.com (including SCI‐Expanded, SSCI, and A&HCI databases on 31 Janurary 2012, and updated on 11 March 2013, 5 December 2014, and 9 December 2016.
| #1 | TS=(work* OR occupat* OR company* OR offic* OR busines*) |
| #2 | TS=walking |
| #3 | TS=((step OR steps) AND (count OR counts OR counting OR Counter OR counters OR daily)) |
| #4 | TS=("10,000 step" OR "10,000 steps" OR "10000 steps" OR "10000 step" OR "10 000 step" OR "10 000 steps") |
| #5 | TS=(pedometer* OR "manpo‐meter" OR "manpometer" OR "manpo meter" OR "step meter" OR "step meters" OR stepmeter*) |
| #6 | #2 OR #3 OR #4 OR #5 |
| #7 | #1 AND #6 |
| #8 | TS=("randomized controlled trial" OR "controlled clinical trial" OR placebo OR "clinical trials" OR randomly OR intervent*) OR TI=trial |
| #9 | #7 AND #8 |
| #10 | TS=(animal* NOT human*) |
| #11 | #9 NOT #10 |
| #12 | #11 |
Appendix 7. Clinicaltrials.gov search
We ran the following search strategy on clinicaltrials.gov on 26 April 2017.
(pedometer OR “10,000 steps” OR “10000 steps” OR “10 000 steps” OR "step count") AND (work OR workplace OR worksite OR employee OR employer OR company OR business OR office) AND (randomized OR randomised).
Appendix 8. WHO International Clinical Trials Registry Platform (ICTRP) search
We ran the following search strategy on the WHO International Clinical Trials Registry Platform (ICTRP), via http://apps.who.int/trialsearch/AdvSearch.aspx, on 26 April 2017.
Title: (work OR workplace OR worksite OR employee OR employer OR company OR business OR office).
Intervention: (pedometer OR 10,000 steps OR 10000 steps OR 10 000 steps OR step count).
Recruitment status is: ALL.
Data and analyses
Comparison 1. Pedometer intervention vs minimal intervention.
| Outcome or subgroup title | No. of studies | No. of participants | Statistical method | Effect size |
|---|---|---|---|---|
| 1.1 Physical activity: combined (follow‐up after completion) | 6 | Ratio of means (IV, Random, 95% CI) | Totals not selected | |
| 1.1.1 Follow‐up after completion (medium, 3 to 10 months) | 6 | Ratio of means (IV, Random, 95% CI) | Totals not selected | |
| 1.2 Physical activity: combined (at completion of intervention) | 10 | Ratio of means (IV, Random, 95% CI) | Subtotals only | |
| 1.2.1 At completion of intervention (medium duration, 10 weeks to 6 months) | 9 | 1672 | Ratio of means (IV, Random, 95% CI) | 1.37 [1.11, 1.71] |
| 1.2.2 At completion of intervention (long duration, 2 years) | 1 | 1299 | Ratio of means (IV, Random, 95% CI) | 0.91 [0.63, 1.31] |
| 1.3 Sedentary behaviour (min/d) | 3 | Mean Difference (IV, Random, 95% CI) | Subtotals only | |
| 1.3.1 At completion of intervention (medium duration, 3 to 6 months) | 2 | 227 | Mean Difference (IV, Random, 95% CI) | ‐44.09 [‐99.51, 11.33] |
| 1.3.2 At completion of intervention (long duration, 2 years) | 1 | 1354 | Mean Difference (IV, Random, 95% CI) | 16.03 [‐61.11, 93.18] |
| 1.3.3 Follow‐up after completion (medium, 6 months) | 1 | 172 | Mean Difference (IV, Random, 95% CI) | ‐33.00 [‐84.28, 18.28] |
| 1.4 CVD risk factor: body mass index (BMI; kg/m²) | 8 | Mean Difference (IV, Random, 95% CI) | Subtotals only | |
| 1.4.1 At completion of intervention (medium duration, 10 weeks to 6 months) | 7 | 751 | Mean Difference (IV, Random, 95% CI) | ‐0.67 [‐1.28, ‐0.06] |
| 1.4.2 At completion of intervention (long duration, 2 years) | 1 | 1405 | Mean Difference (IV, Random, 95% CI) | 0.67 [‐0.17, 1.51] |
| 1.4.3 Follow‐up after completion (medium, 3 to 6 months) | 3 | 486 | Mean Difference (IV, Random, 95% CI) | ‐0.64 [‐1.45, 0.17] |
| 1.5 CVD risk factor: waist circumference (cm) | 7 | Mean Difference (IV, Random, 95% CI) | Subtotals only | |
| 1.5.1 At completion of intervention (medium duration, 10 weeks to 6 months) | 7 | 694 | Mean Difference (IV, Random, 95% CI) | ‐1.67 [‐3.85, 0.51] |
| 1.5.2 Follow‐up after completion (3 to 6 months) | 3 | 439 | Mean Difference (IV, Random, 95% CI) | ‐0.77 [‐1.91, 0.37] |
| 1.6 CVD risk factor: systolic blood pressure (mmHg) | 6 | Mean Difference (IV, Random, 95% CI) | Subtotals only | |
| 1.6.1 At completion of intervention (medium duration, 10 weeks to 6 months) | 6 | 571 | Mean Difference (IV, Random, 95% CI) | ‐1.56 [‐3.66, 0.53] |
| 1.6.2 Follow‐up after completion (medium, 3 to 6 months) | 2 | 315 | Mean Difference (IV, Random, 95% CI) | ‐0.08 [‐3.26, 3.11] |
| 1.7 CVD risk factor: diastolic blood pressure (mmHg) | 6 | Mean Difference (IV, Random, 95% CI) | Subtotals only | |
| 1.7.1 At completion of interventions (medium duration, 10 weeks to 6 months) | 6 | 571 | Mean Difference (IV, Random, 95% CI) | ‐0.71 [‐2.57, 1.14] |
| 1.7.2 Follow‐up after completion (medium, 3 to 6 months) | 2 | 315 | Mean Difference (IV, Random, 95% CI) | 0.70 [‐1.34, 2.73] |
| 1.8 CVD risk factor: cholesterol: LDL | 2 | Mean Difference (IV, Random, 95% CI) | Subtotals only | |
| 1.8.1 At completion of intervention (medium duration, 3 to 4 months) | 2 | 127 | Mean Difference (IV, Random, 95% CI) | ‐3.58 [‐10.76, 3.59] |
| 1.9 CVD risk factor: cholesterol: HDL | 2 | Mean Difference (IV, Random, 95% CI) | Subtotals only | |
| 1.9.1 At completion of intervention (medium duration, 3 to 4 months) | 2 | 127 | Mean Difference (IV, Random, 95% CI) | ‐0.94 [‐3.77, 1.89] |
| 1.10 CVD risk factor: triglycerides | 2 | Mean Difference (IV, Random, 95% CI) | Subtotals only | |
| 1.10.1 At completion of intervention (medium duration, 3 to 4 months) | 2 | 127 | Mean Difference (IV, Random, 95% CI) | ‐10.83 [‐33.84, 12.18] |
| 1.11 Quality of life: mental health component | 2 | Mean Difference (IV, Random, 95% CI) | Subtotals only | |
| 1.11.1 At completion of intervention (medium duration, 3 months) | 2 | 168 | Mean Difference (IV, Random, 95% CI) | 3.18 [‐1.32, 7.68] |
| 1.11.2 Follow‐up after completion (medium, 3 months) | 1 | 58 | Mean Difference (IV, Random, 95% CI) | 1.30 [‐1.80, 4.40] |
| 1.12 Quality of life: physical health component | 2 | Std. Mean Difference (IV, Random, 95% CI) | Subtotals only | |
| 1.12.1 At completion of intervention (medium duration, 3 to 6 months) | 2 | 310 | Std. Mean Difference (IV, Random, 95% CI) | 0.21 [‐0.29, 0.70] |
| 1.12.2 Follow‐up after completion (medium, 3 to 6 months) | 2 | 310 | Std. Mean Difference (IV, Random, 95% CI) | 0.08 [‐0.14, 0.30] |
| 1.13 Adverse effects | 2 | Odds Ratio (IV, Random, 95% CI) | Subtotals only | |
| 1.13.1 At completion of intervention (medium duration, 6 months) | 1 | 180 | Odds Ratio (IV, Random, 95% CI) | 0.87 [0.39, 1.94] |
| 1.13.2 Follow‐up after completion (6 to 9 months) | 2 | 286 | Odds Ratio (IV, Random, 95% CI) | 0.50 [0.30, 0.84] |
Comparison 2. Pedometer intervention vs alternative physical activity intervention.
| Outcome or subgroup title | No. of studies | No. of participants | Statistical method | Effect size |
|---|---|---|---|---|
| 2.1 Physical activity: combined | 4 | Ratio of means (IV, Random, 95% CI) | Subtotals only | |
| 2.1.1 At completion of intervention (short duration, 1 week) | 1 | 60 | Ratio of means (IV, Random, 95% CI) | 1.26 [0.96, 1.66] |
| 2.1.2 At completion of intervention (medium duration, 3 to 6 months) | 3 | 273 | Ratio of means (IV, Random, 95% CI) | 1.04 [0.92, 1.17] |
| 2.1.3 Follow‐up after completion (medium, 3 months) | 1 | 143 | Ratio of means (IV, Random, 95% CI) | 1.07 [0.97, 1.18] |
| 2.2 CVD risk factor: body mass index (BMI; kg/m²) | 2 | Mean Difference (IV, Random, 95% CI) | Subtotals only | |
| 2.2.1 At completion of intervention (medium duration, 3 to 6 months) | 2 | 144 | Mean Difference (IV, Random, 95% CI) | ‐1.23 [‐2.85, 0.39] |
Comparison 3. Subgroup analyses.
| Outcome or subgroup title | No. of studies | No. of participants | Statistical method | Effect size |
|---|---|---|---|---|
| 3.1 Phyical activity: subgroup analysis by participant risk profile of Analysis 1.1 (follow‐up after completion) | 5 | Ratio of means (IV, Random, 95% CI) | Subtotals only | |
| 3.1.1 Only sedentary participants | 3 | Ratio of means (IV, Random, 95% CI) | 1.55 [0.86, 2.79] | |
| 3.1.2 Open participation | 2 | Ratio of means (IV, Random, 95% CI) | 1.03 [0.88, 1.21] | |
| 3.2 Physical activity: subgroup analysis by participant risk profile of Analysis 1.2.1 | 9 | Ratio of means (IV, Random, 95% CI) | 1.37 [1.11, 1.71] | |
| 3.2.1 Only high‐risk participants | 3 | Ratio of means (IV, Random, 95% CI) | 1.20 [1.02, 1.41] | |
| 3.2.2 Only sedentary participants | 3 | Ratio of means (IV, Random, 95% CI) | 1.49 [0.87, 2.56] | |
| 3.2.3 Open participation | 3 | Ratio of means (IV, Random, 95% CI) | 1.32 [1.12, 1.55] |
Characteristics of studies
Characteristics of included studies [ordered by study ID]
Aittasalo 2012.
| Study characteristics | ||
| Methods | Randomised controlled trial Aim: to evaluate a 6‐month intervention to promote walking in office workers using pedometers and email messages |
|
| Participants |
Population description: insufficiently physically active employees at 20 office‐based work sites (specifics not described) Intervention group: 123 participants Control group: 118 participants Location: Southern Finland Inclusion criteria: respondents to the baseline questionnaire were eligible if they volunteered for the study and were insufficiently physically active for cardiorespiratory health (less than 150 minutes of moderate‐intensity physical activity or less than 75 minutes of vigorous‐intensity physical activity per week accumulated from fewer than 3 days a week) and perceived no restrictions for physical activity Recruitment: 10 occupational healthcare units (OHCs) recruited 20 work sites for which they provide services. Baseline questionnaires were circulated to all 2230 employees. 646 responded, of whom 241 met the eligibility criteria Demographics: age: mean (SD) for control 45.3 (9.1), for intervention 44.1 (9.4) years Gender: control 44% male, intervention 29% male Highest level of education: control basic 9%, polytechnic or vocational school 64%, university degree 27%, intervention basic 6%, polytechnic or vocational school 64%, university degree 30% |
|
| Interventions |
Duration: 6 months Intervention: the STEP programme consisted of 2 phases Pre‐intervention phase: a 1‐hour preliminary meeting at each work site held by a researcher and providing information on the intervention as well as on health benefits and recommendations for physical activity (PA) and walking. The use of stairs was emphasised from the aspect of health and easy applicability. Employees were supplied with walking leaflets, pedometers (Omron, Walking Style II), and printed logbooks. Employees were instructed to assess their average daily steps with the pedometer over 3 days including 2 working and 1 non‐working day. The average number of daily steps was then used as the baseline for further step goals, rather than using a general goal such as 10,000 steps per day Intervention phase: 1. Self‐reporting
2. Emails
Control: participated in data collection only until after the 12 months' follow‐up measurement, when a 1‐hour seminar was offered at each work site to provide feedback to all employees and to supply control participants with pedometers, logbooks, and walking leaflets. As a gesture of appreciation, participating OHCs were also provided point‐of‐choice stair posters and were offered a 2‐hour training session on physical activity and health for health personnel |
|
| Outcomes |
Physical activity
Sedentary behaviour
Adverse effects
Other outcomes not reported in this review
|
|
| Statistical analysis |
Imputation of missing data: not reported by study authors Sample size calculation: "according to the power calculations (significance level of 0.05, power of 80%), 175 participants in each group totaling 350 participants were needed to detect the 30% between‐group difference in change in the weekly minutes of total walking" Statistical analysis: self‐reported data on different types of walking were analysed by using generalised linear mixed models (GLMMs). Due to the excess number of zeros (no walking) in the data, analysis was performed in 2 parts as suggested by Tooze et al [33]: 1. Logistic regression To analyse the between‐group difference in change in the probability (odds ratio ‐ OR) of walking from baseline to 2‐, 6‐, and 12‐month follow‐up. Data were coded dichotomously into zeros 2. Linear model To estimate between‐group changes in non‐zero responses. In this model, measurements indicated repetitions with the assumption that the correlations between repeated measurements were constant (compound symmetry). As most of the distributions were skewed, logarithm transformation was performed and geometric mean ratio (GMR) was used as an indicator of group differences. Work site was included in the model as a random effect (intercept), along with gender, taking care of children younger than 18 years of age (yes.no), age (continuous), and self‐reported body mass index at baseline (continuous). Random errors were assumed to be independent between the 2 model components |
|
| Notes | Funding sources include the Finnish Work Environment Fund and the Juho Vainio Foundation for financial support | |
| Risk of bias | ||
| Bias | Authors' judgement | Support for judgement |
| Random sequence generation (selection bias) | Low risk | "Eligible respondents at each work site were then allocated equally to either a pedometer (STEP) or a comparison group (COMP) using computer‐generated randomisation lists (stratified randomisations with random allocation sequences to ensure closely balanced groups within each work site)" |
| Allocation concealment (selection bias) | Unclear risk | Sites were recruited, employees were invited to participate, and baseline data collection was completed before randomisation was conducted. Eligibility was determined by defined criteria measured through the baseline survey (current levels of physical activity and any restrictions preventing physical activity); however no information was provided on whether study personnel or site staff could have known or altered the recruitment or allocation of individual participants before individual participants were enrolled or received the intervention |
| Blinding of participants and personnel (performance bias) All outcomes | High risk | Interventions included meetings, emails, and physical activity interventions, and participants were not blinded. Intervention participants were asked to not discuss the intervention with colleagues, as control participants were present in the same workplace. No blinding of other personnel was discussed. Personnel based in the workplace would likely have been aware of the identify of participants due to baseline meeting and role in sending motivational emails. Participants and personnel were aware of their allocation and could easily have changed behaviour in relation to physical activity |
| Blinding of outcome assessment (detection bias) PA, sedentary and QoL | High risk | Self‐reported via questionnaire. Participants were aware of the expectation that intervention would increase exercise levels, and of specific targets identified. Both groups were likely to exaggerate levels of exercise, but intervention groups were more likely to be affected. Participants self‐reporting exercise data were likely to be influenced by knowledge of expectations of the intervention |
| Blinding of outcome assessment (detection bias) Disease risk factors | Low risk | BMI was objectively measured and was unlikely to be affected by lack of blinding |
| Blinding of outcome assessment (detection bias) Adverse events | High risk | Self‐reported via questionnaire. Participants' recall and attribution of adverse events to physical activity were likely to be influenced by knowledge of the intervention |
| Incomplete outcome data (attrition bias) Adverse events | High risk |
Intervention: randomised: 123. Analysed at 6 months: 86, at 12 months: 89 Control: randomised: 118. Analysed at 6 months: 94, at 12 months: 87 Sensitivity analysis based on plausible assumptions about the data indicated that the effect estimate is very susceptible to change |
| Incomplete outcome data (attrition bias) All other outcomes | High risk |
Intervention: analysed for walking time at 6 months: 86, at 12 months: 84. Analysed for sedentary time at 6 and 12 months: 87 Control: analysed for walking time at 6 months: 94, at 12 months: 80. Analysed for sedentary time at 6 months: 94, at 12 months 85. Sensitivity analysis based on plausible assumptions about the data indicated that effect estimates are very susceptible to change |
| Selective reporting (reporting bias) | Unclear risk | Study protocol could not be obtained. Although some planned outcome measures were not reported (study authors advised that quality of life was planned but was not assessed), multiple measures for some outcomes were reported and did not appear to have been selected for statistical significance |
| Other bias | Low risk | None was identified |
Audrey 2015.
| Study characteristics | ||
| Methods | Cluster‐randomised controlled trial Aim: to develop a pilot employer‐led scheme to increase walking to work, and to test the feasibility of implementing and evaluating the intervention in a full‐scale trial |
|
| Participants |
Population description: employees who were professional, scientific, and technical; manufacturing; transportation; education; accommodation and food services; public administration; financial and insurance activities Randomisation: workplaces were paired with another as similar as possible with respect to total number of employees (up to 50, 51 to 250, 250+), location characteristics, and type of business. To allow for seasonality, data collections took place concurrently in each ‘matched’ pair of workplaces Intervention group: 7 workplaces (4 small; 3 medium; 2 large), 100 participants Control group: 10 workplaces (5 small; 3 medium; 2 large), 87 participants Location: Bristol, England Inclusion criteria: employees who were willing to incorporate some walking into their daily commute, with initial recruitment targeted at employees living within 2 miles of the workplace Participants were excluded if they cycled or used ‘other’ modes of travel to work Recruitment: workplaces were approached through the Bristol Chamber of Commerce via their mailing list of employers and a publicly available list of major employers. Initial contact included an information leaflet about the study and expectations, with contact details for the research team. Paper copies were also sent, with a reply‐paid envelope for initial expressions of interest, including willingness to allocate employee time for study activities. Those that did express an interest were asked to complete a short questionnaire about the size and type of business, and to identify how many of their employees lived within 2 miles of the workplace. This process was aided by the research team supplying the first 4 digits of postcodes likely to contain employees living within the required range and an instruction leaflet on how to calculate distance using Walkit.com. Workplaces that provided this information were recruited to the study and were ‘matched’ into pairs, with each pair containing workplaces as similar as possible with respect to total number of employees (up to 50, 51 to 250, 250+), location characteristics, and type of business Participants were contacted by e‐mail or by letter, as appropriate to the workplace Demographics: age: overall mean (SD) 37.8 (12) (range 17.3 to 67 years). Control mean (SD) 36.8 (12.4), intervention 38.7 (11.7) years Gender: control 52.9% male, intervention 43.0% male Highest level of education: control missing 10.3%, other 0%, no formal qualifications 0%, GCSE grades A to C or equivalent 9.2%, BTEC national or equivalent 5.8%, GCE A level NVQ level 3 8.0%, BTEC higher or equivalent 4.6%, degree NVQ level 4 39.1%, PhD masters degree NVQ level 5 23.0%; intervention missing 12.0%, other 1.0%, no formal qualifications 2.0%, GCSE grades A to C or equivalent 9.0%, BTEC national or equivalent 2.0%, GCE A level NVQ level 3 13.0%, BTEC higher or equivalent 3.0%, degree NVQ level 4 41.0%, PhD masters degree NVQ level 5 17.0% Ethnicity: control: white British 74.7%, white other 12.6%, mixed ethnic group 1.1%, Asian or Asian British 3.4%, Chinese 0%, missing 8.1%; intervention: white British 79.0%, white other 8.0%, mixed ethnic group 1.0%, Asian or Asian British 1.0%, Chinese 1.0%, missing 10.0% Income: control: < £10,000 6.9%, £ 10,000 to 20,000 8.1%, £20,000 to 30,000 8.1%, £30,000 to 40,000 16.1%, £40,000 to 50,000 12.6%; > £50,000 27.6%, don't know 10.3%, missing 10.3%; intervention: < £10,000 0%, £10,000 to 20,000 9.0%, £20,000 to 30,000 15.0%, £30,000 to 40,000 15.0%, £40,000 to 50,000 13.0%, > £50,000 26.0%, don't know 6.0%, missing 16.0% Occupation activity level: control: sedentary 65.5%, standing 23.0%, manual 3.5%, missing 8.0%; intervention: sedentary 83.0%, standing 4.0%, manual 3.0%, missing 10.0% |
|
| Interventions | The Walk to Work intervention was designed to encourage employers and employees to consider and address facilitators and barriers at each level of the socio‐ecological model, with 9 targeted behaviour change techniques based on taxonomy of multiple frameworks Duration: 10 weeks Intervention: 1. Organisational action
2. Goal‐setting
3. Encouragement/Extrinsic motivation
Control: completion of data collection rounds only |
|
| Outcomes |
Physical activity
Adverse events
Other outcomes not reported in this review
|
|
| Statistical analysis |
Imputation of missing data: not reported by study authors Interview transcripts: transcripts were read and reread, and textual data were placed in charts focusing on key research questions. Charts were scrutinised, and each unit of data was coded Sample size calculation: this was a pilot study with the primary aim of testing feasibility, and it was not powered to detect differences in outcomes |
|
| Notes | The project was funded by the National Institute for Health Research (NIHR) Public Health Research programme (project number 10/3001/04) The work was undertaken with the support of The Centre for the Development and Evaluation of Complex Interventions for Public Health Improvement (DECIPHer), a UK Clinical Research Collaboration Public Health Research Centre of Excellence. Joint funding (MR/KO232331/1) from the British Heart Foundation, Cancer Research UK, Economic and Social Research Council, Medical Research Council, the Welsh Government, and the Wellcome Trust, under the auspices of the UK Clinical Research Collaboration, is gratefully acknowledged |
|
| Risk of bias | ||
| Bias | Authors' judgement | Support for judgement |
| Random sequence generation (selection bias) | Low risk | "Randomised controlled trial". “Assignment of workplaces to the intervention group occurred within these matched pairs and employed computer‐generated allocation" |
| Allocation concealment (selection bias) | Low risk | Assignment was performed “by an independent member of the co‐applicant group” |
| Blinding of participants and personnel (performance bias) All outcomes | High risk | No information was provided and wait‐list for control was not mentioned. Unlikely to be blinded at the cluster level. Individuals within the clusters may not have been aware of differences in the intervention. Researchers identified the likelihood of a ‘Hawthorne effect’, increasing physical activity due to knowledge of the intervention, which they felt would be present in both groups, and was likely to reduce the observed difference between groups |
| Blinding of outcome assessment (detection bias) PA, sedentary and QoL | Low risk | No information was provided; however physical activity was recorded objectively by an accelerometer |
| Blinding of outcome assessment (detection bias) Adverse events | Low risk | Self‐reported by participants. Intervention group may have been more likely to report adverse events, but no events were reported in either group |
| Incomplete outcome data (attrition bias) Adverse events | High risk |
Intervention group: 9 workplaces were randomised, 2 withdrew before baseline data collection (1 due to time constraints, 1 due to "ample parking").
100 individuals were recruited. 27 withdrew before 1‐year follow‐up (8 left workplace, 5 maternity leave, 1 retired, 10 declined, 3 sick) Participants remaining at 1‐year follow‐up = 73 Control group: 10 workplaces randomised. 1 eliminated after sole participant retired 87 individuals were recruited. 28 withdrew before 1‐year follow‐up (15 left workplace, 1 retired, 10 declined, 2 sick) Participants remaining at 1‐year follow‐up = 59 No events were observed, so effect estimate was not robust to small quantities of missing data |
| Incomplete outcome data (attrition bias) All other outcomes | High risk |
Intervention group: as above Responses for physical activity = 71 Control group: as above Responses for physical activity = 57 Sensitivity analysis based on plausible assumptions about the data indicated that effect estimates were very susceptible to change |
| Selective reporting (reporting bias) | Low risk | Study protocol was published and all relevant outcomes and analyses were reported as planned |
| Other bias | High risk | As this is a cluster‐randomised trial, and recruitment of participants occurred after randomisation, it is possible that knowledge of the intervention affected the types of participants recruited. Given the substantive difference in numbers recruited, this could mean only that more self‐motivated participants joined the control arms |
Carr 2013.
| Study characteristics | ||
| Methods | Randomised controlled trial Aim: to test the efficacy of a multi‐component technology intervention for reducing daily sedentary time and improving cardiometabolic disease risk among sedentary, overweight university employees |
|
| Participants |
Population description: middle‐aged, primarily female, physically inactive, overweight but without major medical problems, and employed in sedentary jobs at a large university Intervention group: 25 participants randomised Control group: 24 participants randomised Location: southeastern USA Inclusion criteria: healthy but physically inactive (self‐reporting less than 60 minutes of moderate‐ to vigorous‐intensity physical activity per week), overweight (body mass index (BMI) ≥ 25 kg/m²), working in full‐time (reporting a minimum of 35+ hours/week) at sedentary/desk‐dependent occupations (reporting a minimum of 75% of working time spent sitting). Participants were required to gain permission from their supervisor prior to enrolment. Participants were excluded if they had (1) limitations with or contraindications to ambulatory exercise; (2) acute illness or injury; (3) cognitive impairment, psychosis, or other diagnosed psychological illness (with the exception of depression and anxiety); (4) currently using psychotropic drugs; or (5) with diagnosis of a chronic condition such as heart failure or cancer Recruitment: via email advertisements placed on an electronic mailing list to 5392 employees Demographics: age: mean (SD) control 47.6 (9.9) years, intervention 42.6 (8.9) years Gender: control 5.9% male, intervention 13.1% male Education: college graduate: control 71.0%, intervention 86.0% Income > $40 000: control 62.5%, intervention 63.6% Job category: control professional/executive 35.0%, administrative 65.0%; intervention professional/executive 52.0%, administrative 48.0% Ethnicity: non‐Hispanic white: control 76.5%, intervention 63.6% |
|
| Interventions |
Duration: 12 weeks Intervention: 1. Machine
2. Website
3. Pedometer use
4. Email
Cost of the intervention was $180 (pedal machine and software, pedometer, access to website) per participant Control:
|
|
| Outcomes |
Physical activity
Sedentary behaviour
Cardiovascuar disease and type 2 diabetes risk factors
Other outcomes not reported in this review
|
|
| Statistical analysis |
Imputation of missing data: not reported by study authors Sample size calculation: a sample size of 40 was necessary to detect, with 80% power, a 30 min/d difference in daily sedentary time. This study was not powered to detect differences in measured cardiometabolic risk factors. These measures were collected as secondary outcomes and were used to inform future trials Statistical analysis: a paired samples t‐test was used to determine any within‐group differences at baseline and post intervention. Analysis of covariance (ANCOVA) was used to test for differences between groups post intervention. Baseline values of interest were included as covariates in the model for all continuous variables, consistent with the recommended statistical procedures. The underlying assumption of no between‐group differences at baseline was confirmed for all measures by 1‐way ANCOVA |
|
| Notes | Funded by Oak Ridge Associated Universities grant #212112. Study authors declared no other conflicts of interest | |
| Risk of bias | ||
| Bias | Authors' judgement | Support for judgement |
| Random sequence generation (selection bias) | Low risk | "A 1:1 random allocation sequence was generated by the principal investigator using an online random sequence generator" |
| Allocation concealment (selection bias) | Low risk | "Participants were assigned to one of two groups by a research staff member not involved in data collection based on the order in which they enrolled into the study" |
| Blinding of participants and personnel (performance bias) All outcomes | High risk | Intervention involved physical activity supported by a desk pedaling device and pedometer, compared to a wait‐list control who was asked to maintain usual behaviour. Although "Participants were located in 18 different buildings across the campus. No participants worked within visible proximity of each other", participants would have been aware of their own group allocation. Trial staff would have been aware of allocation through active communication by regular email intervention. Participants' supervisors were required to give permission to participate in the study and would have been aware. Physical activity behaviours could easily have been modified in response to participation in the trial. The control group would be more likely to modify behaviours in response to participation in the trial, despite being asked to maintain existing behaviours, whereas intervention group participants' responses would be considered a response to the intervention |
| Blinding of outcome assessment (detection bias) PA, sedentary and QoL | Low risk | Physical activity was measured objectively by a computerised device, the Stepwatch physical activity monitor |
| Blinding of outcome assessment (detection bias) Disease risk factors | Low risk | "All measures were collected at baseline and postintervention (12 weeks) in a controlled laboratory setting by two staff members blinded to the participant’s group assignment. The two staff members were provided specific measurement duties to ensure that each measure was collected by the same staff member at baseline and postintervention." Measures were objective, although outcome assessors may have been unblinded by participants |
| Incomplete outcome data (attrition bias) All other outcomes | Low risk | 9 participants were missing (2 of 25 from the intervention group, 7 of 24 from the control group), and the reason given for all was 'did not complete' All outcomes appeared robust to sensitivity analysis based on plausible assumptions about missing data |
| Selective reporting (reporting bias) | Low risk | Trial registration information was obtained from ClinicalTrials.gov. Although primary outcome appears to have changed from total physical activity to measures divided into intensity level, and heart rate was a planned outcome but was not reported, multiple measures are reported and none are statistically significant |
| Other bias | Low risk | None was identified |
Dishman 2009.
| Study characteristics | ||
| Methods | Cluster‐randomised controlled trial Aim: to evaluate the efficacy of Move to Improve, a socio–ecological intervention delivered at the workplace to increase leisure time physical activity |
|
| Participants |
Population description: employees without major medical problems from Home Depot, Inc., based at divisional offices, subsidiaries, call centres, and distribution centres, none of which dealt directly with customers Intervention group: 8 work sites, 885 participants (mean cluster size 111, range 49 to 387) Control group: 8 work sites, 557 participants (mean cluster size 70, range 42 to 126) Location: USA (Arizona, California, Colorado, Florida, Georgia, Illinois, Louisiana, Maryland, Texas) and Canada (Toronto) Inclusion criteria: employees without overt cardiovascular, pulmonary, or metabolic disease Recruitment: 20 sites in diverse regions were identified as eligible for the study because they could be paired on number of employees and nature of work. Sixteen work sites agreed to participate, were paired, and were randomly assigned. Recruitment of volunteers within each work site was performed via e‐messages, onsite flyers, interoffice mail, face‐to‐face meetings, and posters developed and delivered by site co‐ordinators, who recruited and supervised team captains. All employees who completed baseline testing received an incentive (e.g. t‐shirt, lunch cooler) Demographics: Age: range 19 to 64 years, mean (SD) 36.2 (9.8) years Gender: 31% male Ethnicity: white (60%), black (25%), Asian (3%), Pacific Islander or Native American (1%), or other (11%); 7% identified themselves as Hispanic or Latino Highest level of education: high school graduate (9%), some college or technical training (34%), associate degree (12%), bachelor degree (31%), postgraduate work or degree (14%). Job title: non–manager/supervisor (45%), supervisor (8%), manager/senior manager/director (12%), other (35%) |
|
| Interventions | A collaborative effort with the Building Better Health (BBH) programme, a pre‐existing health promotion intervention operating at approximately 1700 Home Depot locations Duration: 2‐month pre‐intervention phase, followed by a 12‐week intervention Intervention Pre‐intervention phase: project staff consulted with senior management at each work site to discuss project objectives and to review site selection criteria and expectations for participation. An employee was selected as a site co‐ordinator during the first month of installation Intervention phase: adapted from the Director’s 50th Anniversary Physical Activity Challenge implemented at the CDC in Atlanta 1. Organisational action
2. Goal‐setting
3. Incentives
4. Environmental prompts
Control: usual treatment control condition, including completion of the CDC health‐risk appraisal and monthly newsletters describing the health benefits of physical activity. This provided a minimal treatment comparator for the intervention that has been shown to have modest or no effects on physical activity. Control sites had a programme director who dispensed monthly educational messages after baseline data collection |
|
| Outcomes |
Physical activity
Other outcomes not reported in this review
|
|
| Statistical analysis |
Imputation of missing data: latent growth modelling imputation and latent transition analysis were undertaken using full‐information likelihood procedures for selected variables within those returning at follow‐up. Imputation was not undertaken for those lost to follow‐up. The imputed data were not used in this Cochrane Review Sample size calculation: study authors reported that the sample size provided adequate statistical power for latent growth model tests Adjustment for clustering: as there was no substantive difference in models after covariate adjustment using the Huber–White sandwich estimator procedure, unadjusted models were presented. Hence, raw data presented were not adjusted for clustering |
|
| Notes | Supported by Health Protection Research Initiative grant DP 000111 from the CDC. Study authors stated no other financial interests | |
| Risk of bias | ||
| Bias | Authors' judgement | Support for judgement |
| Random sequence generation (selection bias) | Low risk | "16 work sites agreed to participate and were paired and randomly assigned". "Each of the paired sites was randomly assigned... to the intervention or a health education control condition using computer‐generated random numbers. Based on past work site intervention studies, the expected intervention enrolment and retention rates were approximately 35% and 50%, respectively, so recruitment goals at intervention and control sites were set at a 2:1 ratio" |
| Allocation concealment (selection bias) | Unclear risk | Recruitment of sites occurred before randomisation to enable pairing, although it is unclear if study personnel could have influenced allocation |
| Blinding of participants and personnel (performance bias) All outcomes | High risk | No information was provided and wait‐list for control group was not mentioned. Although work sites were geographically dispersed and contamination was unlikely, knowledge of participation in the study could have influenced behaviour in the control group or led to changes in the usual health‐related interventions offered at control work sites |
| Blinding of outcome assessment (detection bias) PA, sedentary and QoL | High risk | All outcomes were self‐reported by participants. Participants receiving the intervention would have been aware of goals set and the intention of the intervention and may have been likely to overestimate outcomes |
| Incomplete outcome data (attrition bias) All other outcomes | High risk | Intervention: randomised: 885. Analysed for PA: 564 Control: randomised: 557. Analysed for PA: 265. "Percent loss to follow‐up ranged from 25% to 47% at intervention sites and 32% to 56% at control sites." Reasons for loss to follow‐up were not given. Study authors reported that in the control group, participants who were lost to follow‐up had slightly higher baseline physical activity scores than those who remained. This level of missing data places outcomes at high risk of bias |
| Selective reporting (reporting bias) | Unclear risk | All outcomes described in the published papers were reported. Study protocol was not available |
| Other bias | High risk | Following cluster‐randomisation, recruitment of individuals at each work site was voluntary. Volunteers were permitted to join the study after allocation and baseline measurement, at which point the nature of the intervention would have been clear. More participants joined the control group (138) than the intervention group (23) after baseline. Volunteers for the intervention may have been more motivated to change than volunteers for the less active control intervention |
Linde 2012.
| Study characteristics | ||
| Methods | Cluster‐randomised controlled trial Aim: to (a) conduct a simultaneous test of environmental approaches to healthy weight choices (including eating, physical activity, and weight‐monitoring behaviours), and (b) extend the test of these approaches to a more sustained time period than is typically observed |
|
| Participants |
Population description: 6 work sites, including 2 community colleges; a regional insurance office, a beauty industry corporate headquarters with an attached manufacturing and distribution centre, a utility company office, and a national headquarters for a health‐related non‐profit organisation Intervention group: 3 work sites, 752 participants Control group: 3 work sites, 995 participants Location: metropolitan area, USA Inclusion criteria: work sites were eligible if they had between 250 and 1000 employees, within the study location; had food service on site, were located in a building with at least 2 floors (to ensure presence of stairs), with minimal seasonal fluctuation of employees, were expecting stability of location and workforce over the next several years, and were willing to provide employees’ work contact information. Employees were eligible if they were employed at least 50% of the time on‐site during a daytime shift Recruitment: work sites were identified using a business directory and were contacted by phone to ascertain eligibility. A letter was then sent to human resources (HR) personnel (identified in the initial screening call) to provide basic study information and to request contact to further discuss the study and eligibility requirements. The next telephone contact confirmed basic site eligibility criteria and explained the purpose and nature of the study. The principal investigator and the project director then visited sites for 1‐hour visits with site executives and HR staff, to present the study design and aims and field questions. For those sites then agreeing to participate in the trial, HR provided work site contact information (email and telephone) for all eligible employees. Study staff distributed a company‐wide email announcement, via company email address, to all eligible employees. The message described the partnership, gave a brief description of the study, notified employees that a study staff member would contact them within 2 weeks, and gave the option to call study staff in advance to opt out or enrol in the study. Staff followed a protocol of up to 9 contact attempts (by either telephone or email) for each employee during the scheduling process. Following baseline data collection for consenting participants, work sites were paired and randomised to the intervention or control group according to time of study entry Demographics: Age: mean 42.9 years, range 18 to 75 Gender: 37.4% male Marital status: 68.5% married or cohabiting Race: 88.6% white, 2.1% Hispanic |
|
| Interventions | The HealthWorks programme. Participants were compensated $10 for completion of each measurement visit and $10 for completion of each survey Duration: 2 years Intervention: intervention components were primarily targeted at making changes at the work site level:
Control: no contact was made except to engage in evaluation procedures. Following the last round of data collection, control sites were offered a DVD containing intervention materials (e.g. poster templates, newsletter content, descriptions of intervention activity procedures) and an opportunity to ask questions of intervention staff as needed. Although 2 of 3 control sites requested and received materials following study completion, this was not considered a wait‐list control group |
|
| Outcomes |
Physical activity
Sedentary behaviour
Cardiovascular disease and type 2 diabetes risk factors
Adverse events
Other outcomes not reported in this review
|
|
| Statistical analysis |
Imputation of missing data: not reported or not undertaken by study authors Sample size calculation: the primary outcome examined here was BMI change between baseline and follow‐up; based on the known weight gain trajectory of free‐living adults without intervention, the study was powered to detect a 1.5‐kilogram difference in body weight between intervention and control sites at 2 years, accounting for approximately 15% attrition from work sites and adjusted for the work site component of variance (80% power, P < 0.05, 1‐tailed) |
|
| Notes | Funding: National Institutes of Health | |
| Risk of bias | ||
| Bias | Authors' judgement | Support for judgement |
| Random sequence generation (selection bias) | Low risk | "...block randomisation at the work site level (block size = 2), using computer‐generated algorithms and performed by the study data manager, was used to assign work sites to intervention or no‐contact control conditions". Worksites were paired based on time of entry into the study and were randomised in those pairs |
| Allocation concealment (selection bias) | Low risk | Randomisation occurred "after completion of baseline site evaluations and participant data collection within each site pair. Sites were recruited by the principal investigator and project manager and randomised by the data manager…" |
| Blinding of participants and personnel (performance bias) All outcomes | High risk | "There was no blinding of participants or study staff to assignment of work sites to intervention versus control condition." Participants may have modified their usual behaviour in response to knowledge of the study, in particular, participants in the control group, although the impact on behaviour of the control group may not have been sustained over time. Involvement in the study may have led to changes in workplace policies or health‐related interventions at control sites |
| Blinding of outcome assessment (detection bias) PA, sedentary and QoL | High risk | Physical activity and sedentary behaviour were self‐reported based on the IPAQ scale. Participants were aware of the expectation that intervention would increase activity levels. Both groups were likely to exaggerate levels of exercise, but intervention group was more likely to be affected. Participants self‐reporting exercise data were likely to be influenced by knowledge of expectations of the intervention |
| Blinding of outcome assessment (detection bias) Disease risk factors | Low risk | BMI and waist circumference were objectively measured by researchers |
| Blinding of outcome assessment (detection bias) Adverse events | Unclear risk | It is unclear how adverse effects were defined or measured during the study |
| Incomplete outcome data (attrition bias) Adverse events | High risk | As zero events were reported, this outcome was at high risk of bias, given any level of missing data |
| Incomplete outcome data (attrition bias) All other outcomes | High risk |
Intervention: Randomised: 3 sites (752 individuals) Available at 24 months: 611 (115 left workforce or ineligible; 8 declined, 18 no contact) Analysed: physical activity: 573. Sedentary behaviour: 555. Disease risk factors: 611 Control: Randomised: 3 sites (995 individuals) Available at 24 months: 795 (180 left workforce or ineligible, 8 declined, 11 no contact) Analysed: physical activity: 726. Sedentary behaviour: 706. Disease risk factors: 706 Sensitivity analysis based on plausible assumptions about missing data indicated that these outcomes were very susceptible to change |
| Selective reporting (reporting bias) | Low risk | Multiple outcomes were measured but not reported in the main paper (including physical activity and sedentary behaviour), although data were obtained from the study authors. Blood pressure and high cholesterol were measured as self‐reported high levels only and could not be meta‐analysed with other results |
| Other bias | Low risk | Recruitment of participants within clusters was completed before study assignment |
Mansi 2013.
| Study characteristics | ||
| Methods | Randomised controlled trial Aim: to examine whether a pedometer‐driven walking intervention can improve health‐related quality of life and increase ambulatory activity in a population of meat processing workers when compared to a control group receiving educational material alone |
|
| Participants |
Population description: physically inactive but physically able employees in a large, local meat processing plant, with 900 people working in 12 departments Intervention group: 29 participants Control group: 29 participants Location: meat processing plant located in the South Island of New Zealand Inclusion criteria: currently working, male or female aged 18 to 65 years, with a sedentary lifestyle and/or low levels of physical activity (fewer than 7499 steps per day); able to walk continuously for at least 10 minutes; able to read and sign an informed consent form and questionnaires; willing to participate in the full study. The physical ability of the participant to participate in walking programme will be screened using the physical activity readiness questionnaire (PAR‐Q) Recruitment: participants were recruited through advertisements (posters) at different work sites including health clinic, plant administration, cafeterias, and all department notice‐boards until a target sample (n = 60) was achieved Demographics: Age range 18 to 65 years: mean (SD) control 40 (12.2), intervention 43 (14.9) years. Gender (n males (%)): in control 14 (48.3%), in intervention 10 (34.5%) Height (cm) (mean (SD)): in control 165 (10.2), in intervention 164.4 (11.2) Body weight (kg) (mean (SD)): in control 76.9 (13.9), in intervention 80.2 (16.9) |
|
| Interventions |
Duration: 12 weeks Pre‐intervention: all participants received pre‐baseline screening phase by wearing the pedometer (Yamax Digi‐walker SW‐200, Yamax, Tokyo, Japan) for 7 consecutive days. Participants were instructed on how to use the pedometer, to wear the pedometer on the waistband of their clothing for 7 days, and to reset the pedometer to zero at the beginning of each day, and to remove it at the end of each day, record on a step calendar the date and time the pedometer was attached and also removed, and the total number of steps displayed on the pedometer at the end of each day. After randomisation, all participants attended a 30‐minute education session on the health benefits of being physically active and received standardised educational material (physical activity justification booklet of “Walk into Health”, Toronto Public Health; www.toronto.ca/health/walkintohealth) that consists of written and graphical information describing the importance of walking as a physical activity for health benefits and for prevention of disease Intervention: based on the self‐regulation theory (SRT), goal‐setting, feedback, educational material, and use of a step calendar for self‐monitoring were used as measurements 1. Goal‐setting
2. Step count and feedback
3. Step calendar
Control: participants were encouraged to read the educational activity material and were asked to record any exercise performed over the 12 weeks. At completion of 12 weeks, and at follow‐up at 24 weeks, these participants again wore the pedometer for 1 week to establish a weekly step count for comparison to baseline scores |
|
| Outcomes |
Physical activity
Cardiovascular disease and type 2 diabetes risk factors
Quality of life
Other outcomes not reported in this review
|
|
| Statistical analysis |
Imputation of missing data: not reported by study authors Statistical analysis: independent t‐tests were used for nominal data to test for significant differences between experimental and control groups at baseline A repeated‐measure, mixed‐model ANOVA was used to examine pre‐ and post‐ between‐group differences in all outcomes at each follow‐up time point of the study. Bonferroni 95% confidence interval (CI) was used on estimated marginal means at each follow‐up time point to show the range of variation for between‐group interactions. Within‐group changes were assessed using pairwise comparisons for each variable. Effect sizes were calculated using standardised effect sizes for Cohen d values: 0.2 for small effect, 0.5 for medium effect, and 0.8 for large effect. Statistical analysis was performed using SPSS software 20.0 |
|
| Notes | Funded by Mark Steptoe Memorial Trust, School of Physiotherapy, University of Otago, New Zealand | |
| Risk of bias | ||
| Bias | Authors' judgement | Support for judgement |
| Random sequence generation (selection bias) | Unclear risk | “participants will be randomised to one of the two groups”. Method of random sequence generation not described |
| Allocation concealment (selection bias) | Low risk | "After successfully completing the baseline assessment and signing the informed consent form, randomizations to one of the two groups will be performed using sealed envelopes. Participants will be invited to choose an envelope from a basket containing envelopes that allocate 50% of the sample for the intervention and the other 50% for the control groups: each will contain the group name for allocation, and the timetable of the study" |
| Blinding of participants and personnel (performance bias) All outcomes | High risk | “Researchers and participants will be not be blinded to group allocation.” Participants may have modified their usual behavior in response to knowledge of the study, in particular, participants in the control group |
| Blinding of outcome assessment (detection bias) PA, sedentary and QoL | High risk | Physical activity and quality of life were self‐reported and were at risk of bias due to lack of blinding |
| Blinding of outcome assessment (detection bias) Disease risk factors | Low risk | "A registered nurse, blinded to group allocation, performed assessment at baseline, 12 weeks (at the conclusion of the intervention), and three months post‐intervention." Outcomes were objectively measured |
| Blinding of outcome assessment (detection bias) Adverse events | High risk | Adverse effects were self‐reported and were at risk of bias due to lack of blinding |
| Incomplete outcome data (attrition bias) All other outcomes | Low risk | Intervention: randomised: 29. Completed all assessments: 27 Control: randomised: 29. Completed all assessments: 26 All missing participants withdrew due to work commitments. "An intention to treat protocol was performed by replacing missing values with the group mean at 12 and 24‐week follow‐up time points”. All outcomes were robust to sensitivity analysis using plausible assumptions about missing data |
| Selective reporting (reporting bias) | Low risk | Study protocol was published. All outcomes appear to be reported as planned |
| Other bias | Low risk | None was identified |
Maruyama 2010.
| Study characteristics | ||
| Methods | Randomised, cross‐over study ‐ first phase only (second phase not used due to likely carryover effect) Aim: to investigate the effectiveness of a work site‐based intervention, Life Style Modification Program for Physical Activity and Nutrition (LiSM10!®), on metabolic parameters in middle‐aged male Japanese white collar workers requiring health guidance based on regular health check‐up results |
|
| Participants |
Population description: office workers with risk factors for developing metabolic syndrome belonging to the health insurance association of the Nichirei Group Corporation, aged 30 to 59 years Intervention group: 52 participants Control group: 49 participants Location: Tokyo and surrounding area, Japan Inclusion criteria: male, office employees of the Nichirei Group Corporation, aged 30 to 59 years, with risk factors for developing metabolic syndrome, including 1 or more abnormalities involving serum lipoprotein, glucose levels, and blood pressure, with visceral obesity (umbilical circumference: ≥ 85 cm) and/or BMI ≥ 25. Abnormal levels were defined as triglyceride (TG) ≥ 150 mg/dL and/or HDL cholesterol (HDL‐C) ≥ 40 mg/dL, systolic blood pressure ≥ 130 mmHg and/or diastolic blood pressure ≥ 85 mmHg, fasting glucose ≥ 110 mg/dL and/or HbA1c ≥ 5.5%" Recruitment: individuals at risk were identified at regular medical check‐ups conducted by the Tokyo Health Service Association (Shinjuku‐ku, Tokyo, Japan), which was not involved in the study. 800 male employees were informed about the study, 319 showed interest in participating and agreed to use of their data. After receiving a detailed explanation of the intervention, 115 agreed to participate Demographics: Age: range 30 to 59 years, mean (SD) for control 35.5 (8.1), for intervention 43.1 (7.7) years Gender: 100% male |
|
| Interventions |
Duration: 4 months Intervention: LiSM10!® programme was designed to promote healthy dietary habits and physical activity 1. Professional contact/counselling
2. Personal web page
3. Goal‐setting
Control: no intervention. Participants were given pedometers for 2 periods (at baseline and at follow‐up) of 1 week to allow outcome measurement. At the end of the week, pedometers were returned to study staff |
|
| Outcomes |
Physical activity
Cardiovascular disease and type 2 diabetes risk factors Measured by Tokyo Health Service Association (Shinjuku‐ku, Tokyo, Japan), which was not involved in the study
Other outcomes not reported in this review
|
|
| Statistical analysis |
Imputation of missing data: not reported by study authors Sample size calculation: calculated to detect a 10% change within the group and between groups, using 0.05 for the alpha and 0.20 for the beta error. The necessary sample size was 45 participants in each group Statistical analysis: between‐group comparisons at baseline were made using the Mann–Whitney U test for continuous data and the Chi² test for proportional data. The difference from baseline until the end of the study period for each group was examined using the paired t‐test. The difference in the programme's effectiveness was examined as an intergroup difference in intragroup change, using repeated‐measures analysis of variance |
|
| Notes | Funded by a grant from the International Life Sciences Institute Japan. Study authors acknowledged collaborative efforts of the Meiji Dairies Corporation, Suntory Holdings Limited, and Nichirei Foods, Inc. Study authors stated no financial interest in subject matter, materials, or equipment | |
| Risk of bias | ||
| Bias | Authors' judgement | Support for judgement |
| Random sequence generation (selection bias) | Low risk | "A randomization code with equal numbers of alternative groups was generated from a list of all participants, using software SPSS (ver.15) at Waseda University" |
| Allocation concealment (selection bias) | Low risk | "The Nichirei Inc staff members managing the study and contacting participants were not involved in this randomisation process" |
| Blinding of participants and personnel (performance bias) All outcomes | High risk | "…as the participants received detailed explanations of the objectives and other aspects of this study, blinding to group assignments was not possible." No information was given about blinding of personnel, but it is unlikely that this was undertaken. Awareness of the purpose of the study may have led control group participants to behave differently during the study, which may have affected the outcomes |
| Blinding of outcome assessment (detection bias) PA, sedentary and QoL | Low risk | Participants in the intervention group uploaded pedometer data electronically via a website. Control group participants returned the pedometer to study staff, and it is likely that results were electronically recorded. Due to electronic linkable pedometers, uploading of incorrect pedometer steps is unlikely to be influenced by lack of blinding |
| Blinding of outcome assessment (detection bias) Disease risk factors | Low risk | No additional information was given about blinding of outcome assessors. Anthropometric and blood test results were objectively measured and were unlikely to be affected |
| Incomplete outcome data (attrition bias) All other outcomes | High risk |
Intervention: 52 participants randomised 48 completed the study (4 lost to follow‐up) 44 provided pedometer steps at end of intervention. Control: 49 participants randomised 39 completed the study (8 lost to follow‐up, 2 excluded after baseline due to abnormal blood tests indicating possible hyperlipidaemia) 22 provided pedometer steps at end of intervention Study authors did not conduct intention‐to‐treat analysis. Reasons for most missing data were not available. Sensitivity analysis indicated that these outcomes were at high risk based on plausible assumptions about missing data |
| Selective reporting (reporting bias) | Unclear risk | All outcomes described in the published papers were reported. Study protocol was not available |
| Other bias | Low risk | This cross‐over study offered the intervention to the control group as part of a second phase. Due to the likely carryover effect on behaviour of the first phase intervention, these second phase data were not used |
Morgan 2011.
| Study characteristics | ||
| Methods | Cluster‐randomised controlled trial Aim: to evaluate the feasibility and efficacy of a workplace‐based weight loss intervention that targeted overweight and obese male shift workers |
|
| Participants |
Population description: overweight or obese male adult shift workers without a history of major medical problems at Tomago Aluminium, one of Australia's largest producers of aluminium, employing around 1200 staff Intervention group: 2 clusters of multiple crews (15 crews across both groups), 65 participants Control group: 2 clusters of multiple crews, 45 participants Location: the industrial suburb of Tomago, 13 km northwest of Newcastle, New South Wales, Australia Inclusion criteria: overweight or obese (BMI between 25 and 40 kg/m²) men aged 18 to 65 from Tomago Aluminium without a history of major medical problems such as heart disease in the last 5 years, diabetes, orthopaedic or joint problems that would be a barrier to physical activity, recent weight loss ≥ 4.5 kg, or taking medications that might affect body weight. Participants over 40 years of age were required to receive a doctor's clearance to participate Recruitment: individual recruitment via a staff email from the internal Health Service Department and through promotion at crew meetings by crew leaders. Participating crews were allocated to clusters prior to randomisation based on timing and rotation of shifts worked, to avoid contamination within the work site Demographics: Age: range 18 to 65 years, mean (SD) 44.4 years (8.6) years Gender: 100% male Socio‐Economic Indexes for Areas (SEIFA, based on residence postcode): 1 to 2 (lowest category) 7.9%, 3 to 4 18.0%, 5 to 6 52.8%, 7 to 8 18.0%, 9 to 10 (highest) 3.4% |
|
| Interventions |
Duration: 3.5 months (14 weeks) Intervention: The Workplace POWER (Preventing Obesity Without Eating Like a Rabbit) intervention is based on social‐cognitive theory and behaviour change strategies. Adapted from a previous Internet‐based weight loss intervention, 'SHED‐IT' 1. Professional contact/counselling
2. Personal web page
3. Feedback
4. Incentives
Control: received the intervention at 14 weeks (wait‐list control group) |
|
| Outcomes |
Physical activity
Cardiovascular disease and type 2 diabetes risk factors
Quality of life
Adverse effects
Other outcomes not reported in this review
|
|
| Statistical analysis |
Imputation of missing data: not performed by study authors Sample size calculation: based on 90% power to detect significant weight loss (primary outcome) difference between groups of 3 kg, assuming SD = 5 (P = 0.05, 2‐sided), and a correlation between pre‐ and post‐ scores r = 0.80; a sample size of 41 participants for each group was needed Statistical analysis: analyses were performed using PASW Statistics 17 (SPSS Inc. Chicago, Illinois, USA). Linear mixed models were used to assess all outcomes (except injuries at work) for the impact of group (Intervention and Control), time (treated as categorical with levels at baseline and 14 weeks), and group‐by‐time interaction; these 3 terms formed the base model. This approach was preferred to using baseline scores as covariates, as baseline scores for participants who dropped out at 14 weeks were retained, making this an intention‐to‐treat analysis. The intention‐to‐treat analyses reported are used in this Cochrane Review. Injuries at work were modelled using a generalised linear mixed model with a Poisson distribution, rather than a normal distribution, and to identity link function Adjustment for clustering: to examine potential clustering of effects at the crew level, crew was nested within both treatment and treatment‐by‐time terms as fixed effects, and these terms were used in the final models. These adjusted results are used in this Cochrane Review |
|
| Notes | Funded by Tomago Aluminium and the Hunter Medical Research Institute. Tomago had no involvement in study design, analysis and interpretation of data, or the decision to submit the manuscript for publication. Simon Mitchell from Tomago reviewed the drafted manuscript for accuracy and organised the data collection at Tomago. No other potential conflicts of interest were stated by study authors Australian New Zealand Clinical Trials Registry Number: ACTRN12609001003268 |
|
| Risk of bias | ||
| Bias | Authors' judgement | Support for judgement |
| Random sequence generation (selection bias) | Low risk | "The random allocation sequence was generated by a computer‐based random number‐producing algorithm to ensure an equal chance of work crews being allocated to each group, without restriction." "As crews were randomly allocated based on crew shift clusters, we had an uneven number of men in intervention and control conditions" |
| Allocation concealment (selection bias) | Low risk | "To ensure concealment, the sequence was generated by a statistician. Randomization and participant study arm assignment was completed by a researcher who was not involved in the assessment of participants and the allocation sequence was concealed when enrolling participants by work crew. Participants were enrolled by Health Services staff at Tomago" |
| Blinding of participants and personnel (performance bias) All outcomes | Low risk | “Men were randomly allocated to one of two groups: the Workplace POWER (Preventing Obesity Without Eating like a Rabbit) intervention or a 14‐week wait‐list control group. Men worked in crews (n = 15) and were randomly allocated in four crew clusters based on the timing and rotation of shifts worked, to avoid contamination within the worksite.” Participants and assessors were blinded to group allocation at baseline assessment. The wait‐list control and steps to minimise contamination may have reduced the likelihood of blinding being broken |
| Blinding of outcome assessment (detection bias) PA, sedentary and QoL | High risk | Physical activity and quality of life outcomes were self‐reported. It is possible that participants in the intervention group, knowing that the intervention had begun and the direction of expected change, may have more favourable outcomes, although obvious outliers were excluded from the analysis |
| Blinding of outcome assessment (detection bias) Disease risk factors | Low risk | "Participants and assessors were blind to group allocation at baseline assessment." It is unclear who performed these outcome measures, and whether they were blinded at follow‐up; however these outcomes are sufficiently objective to present low risk of bias |
| Blinding of outcome assessment (detection bias) Adverse events | Low risk | "Injury data were sourced from an on‐site incident and injury recording system at Tomago Aluminium for the 12‐month period before and after intervention commencement" |
| Incomplete outcome data (attrition bias) Adverse events | Low risk | Injury data appeared to be complete, as they were sourced from the company's on‐site incident and injury recording system |
| Incomplete outcome data (attrition bias) All other outcomes | High risk |
Intervention: Randomised: 65. Followed up: 54 (10 unavailable for testing, 1 employee termination) Analysed for PA: 47. Missing data were imputed for all other outcomes Control: Randomised: 45. Followed up: 36 (9 unavailable for testing) Analysed for PA: 34. Missing data were imputed for all other outcomes Reasons for unavailability were not described. "Six men were identified as outliers in the total MET minutes variable and were omitted from the physical activity analyses as their reported physical activity levels were not plausible" At least 18.2% of the baseline sample were missing, but in some analyses, up to 31.8% were missing, This level of incomplete data is enough to pose high risk to the results under plausible assumptions about missing data For anthropometric analyses, study authors undertook a mixed‐model approach "as the baseline scores for subjects who dropped out at 14 weeks were retained, making this an intention‐to‐treat analysis." Imputation of follow‐up scores for missing participants was not described. Sensitivity analysis based on plausible assumptions about missing data indicates that these outcomes are highly susceptible to change |
| Selective reporting (reporting bias) | Unclear risk | All relevant outcomes described in the published papers and at trial registration were reported at 3 months, with the exception of pedometer steps, which were planned but not measured due to safety rules preventing pedometers from being worn in some areas of the workplace. Trial registry data stated that outcomes would be measured at 6‐month follow‐up, and that the wait‐list control group would be offered the intervention immediately following that point. However, the study reported that wait‐list control received the intervention at 14 weeks, and no results at 6 months were reported, so we assumed that 6‐month data collection was not undertaken. No information about the analysis plan was available |
| Other bias | High risk | As cluster‐randomisation was utilised for a small number of clusters, there is an increased chance of baseline imbalance between randomised groups in terms of clusters or individuals |
Parry 2013.
| Study characteristics | ||
| Methods | Cluster‐randomised controlled trial Aim: to determine if participatory workplace interventions could reduce total sedentary time, sustained sedentary time (bouts of 30 minutes), increase the frequency of breaks in sedentary time, and promote light‐intensity activity and moderate/vigorous activity (MVPA) during work hours |
|
| Participants |
Population description: sedentary clerical, call centre, and data processing workers (n = 62, aged 25 to 59 years) in 3 large government organisations Intervention group: intervention: 3 clusters, 30 individuals randomised Control group: 6 clusters, 103 individuals Location: Perth, Australia Inclusion criteria: workers participating in office‐bound duties for 6 or more hours per day and working 4 or more days per week were invited to participate in the study Recruitment: it is unclear how the 3 large government organisations were recruited. Potential participants were recruited at regular monthly staff meetings attend by 20 to 30 staff Demographics: Age (mean years (SD)): analysed participants 43.5 (6.4); non‐analysed participants 39.3 (11.8) Gender (n (%) female): analysed participants 50 (80.6); non‐analysed participants 59 (83.1) BMI (mean kg/m² (SD)): analysed participants 28.0 (6.4); non‐analysed participants 28.7 (6.4) Wear time workday (mean minutes (SD)): analysed participants 921.9 (83.8), non‐analysed participants 862.5 (87.3) Wear time work hours (mean minutes (SD)): analysed participants 501.8 (65.3), non‐analysed participants 495.7 (42.8) Gender (proportion male): total 10%, control 5.9%, intervention 13.1% |
|
| Interventions |
Duration: 12 weeks All groups: participants from all 3 interventions were asked to attend 2 structured meetings with members of their own intervention group at their workplace to discuss and develop interventions. A participatory approach to intervention development was used so that workplace interventions could be tailored to the specific needs of the workplace, and employee participants had ownership of the intervention. Structured meetings were run by a facilitator (SP). During the first meeting, participants ‘brain stormed’ options to promote their specific intervention (active office, physical activity, or office ergonomics). Between meetings, participants were encouraged to think about specific strategies. At the second meeting, 2 to 3 weeks following the first meeting, participants shared their ideas and rated potential strategies in terms of feasibility and effectiveness. An action plan was developed, and the facilitator communicated with team leaders and management to help implementation. Within 4 to 6 weeks of the second meeting, strategies to be used were in place, and the intervention phase was considered to have commenced. Throughout the intervention period, to communicate with and motivate participants, tailored emails were sent to each participant by a facilitator every 2 to 3 weeks Intervention: 'traditional physical activity' 1. Pedometer challenge
2. Group‐defined activities:
Alternative physical activity intervention: for the purposes of this review, the following 2 groups were combined as a single active intervention comparison group Control 1: 'active workstation' 1. Active workstation
2. Group‐defined activities
Control 2: 'office ergonomics' 1. Computer workstation setup 2. Active sitting
3. Group‐defined activities
|
|
| Outcomes |
Physical activity
Sedentary behaviour
|
|
| Statistical analysis |
Imputation of missing data: not reported by study authors Statistical analysis • Independent t‐test evaluated differences in participant characteristics and baseline activity levels between participants who completed the study with sufficient data and those who did not • One‐way ANOVA or Chi² tests compared baseline differences between organisations and between intervention groups • Linear regression models (ANCOVA) were used to estimate the magnitude and corresponding 95% confidence intervals of intervention effects, with post‐intervention measures such as the dependent variable, the 3‐level categorical variables ‘organisation’ and ‘intervention’ as independent variables, and the corresponding baseline measure as a covariate |
|
| Notes | "These authors have no support or funding to report" | |
| Risk of bias | ||
| Bias | Authors' judgement | Support for judgement |
| Random sequence generation (selection bias) | Low risk | "Each organisation formed three groups of volunteers based on physical proximity." "Within each organisation the groups of physically proximal volunteers were randomly assigned to one of three interventions". "Simple randomisation with a 1:1:1 allocation ratio was used by drawing a sealed envelope containing the intervention allocation from a hat" |
| Allocation concealment (selection bias) | Low risk | As above, sealed envelopes were used. Participants were recruited and baseline measurements taken before randomisation |
| Blinding of participants and personnel (performance bias) All outcomes | High risk | Blinding was not mentioned, but participants from all 3 intervention groups were asked to attend 2 structured meetings at their workplace to discuss and develop the interventions used. Although each group received an intervention, participants could be unhappy if allocated to an intervention they did not prefer. Participants may have modified their usual behavior in response to knowledge of the study |
| Blinding of outcome assessment (detection bias) PA, sedentary and QoL | Low risk | "The researcher with primary responsibility for collection and analysis of accelerometer data (SP) had conducted the interventions and was not blinded to group allocation. The ActiGraph data were downloaded using the ActiLife 5 software...” Although the researcher was not blinded, physical activity and sedentary behaviour were objectively measured |
| Blinding of outcome assessment (detection bias) Disease risk factors | Low risk | BMI was measured objectively by research staff |
| Blinding of outcome assessment (detection bias) Adverse events | Unclear risk | Definition and method of obtaining information on adverse events used were unclear |
| Incomplete outcome data (attrition bias) Adverse events | High risk | Zero events were reported, making this outcome highly vulnerable to any quantity of missing data |
| Incomplete outcome data (attrition bias) All other outcomes | High risk |
Pedometer intervention:
Randomised: 30 Analysed: BMI: 18 (7 withdrew, 1 data set damaged, 4 did not want to complete follow up). Physical activity and sedentary behaviour: 14 (4 did not have sufficient workdays and non‐workdays recorded for analysis) Alternative exercise intervention (2 groups combined for this review): Control 1: Randomised: 49 Analysed: BMI: 29 (14 withdrew, 2 left workplace, 4 did no want to complete follow‐up). Physical activity and sedentary behaviour: 19 (10 did not have sufficient workdays and non‐workdays recorded for analysis) Control 2: Randomised: 54 Analysed: BMI: 39 (7 withdrew, 2 data sets damaged, 6 did not want to complete follow‐up). Physical activity and sedentary behaviour: 29 (10 did not have sufficient workdays and non‐workdays recorded for analysis) Sensitivity analysis based on plausible assumptions about missing data indicated that results were highly susceptible to change |
| Selective reporting (reporting bias) | High risk | In addition to data measured with an accelerometer, physical activity was measured with the IPAQ questionnaire and was not reported (although this measure would be less objective and would not have been used in this review). Waist circumference data were measured but were not reported. An additional measurement time point at 3 months after the end of the intervention was planned but was not conducted to minimise the burden on participants. Several variations on analysis were presented; no statistical analysis plan was included in the protocol |
| Other bias | Low risk | Cluster‐randomised trial. Individual as well as cluster recruitment took place before randomisation |
Pillay 2014.
| Study characteristics | ||
| Methods | Randomised controlled trial Aim: to examine the feasibility of a 10‐week pedometer‐based intervention complemented by regular motivational messages, to increase ambulatory PA; and to determine the minimum sample size required for a randomised controlled trial (RCT) |
|
| Participants |
Populationdescription: employees without cancer and with physical ability from the Faculty of Health Sciences at a tertiary academic institution in KwaZulu‐Natal Province, South Africa Interventiongroup: 11 participants Controlgroup: 11 participants Location: KwaZulu‐Natal Province, South Africa Inclusioncriteria: all willing participants aged 21 to 49 years were eligible. Employees were excluded in the case of pregnancy, diagnosis or treatment of cancer, any other physical/clinical condition that made physical activity difficult, contract workers whose employment with the company would end before the 12‐week follow‐up measurement, or non‐compliance to a minimum of 3 days of blinded pedometer wear at baseline Recruitment: an advertisement was emailed to all staff members within the Faculty of Health Sciences, inviting participation in the study (convenience sampling) Demographics: Age: mean (SD) for control group 38.3 (7.7), and for intervention group 37.6 (8.6) years Gender: for control group 82% female, for intervention group 88% female |
|
| Interventions | The theoretical model for behavioural change supported the intervention, as it is recommended that the intervention is targeted towards participants at a specific stage of behavioural change Duration: 10 weeks Intervention Pre‐intervention phase: Participants were asked to wear a blinded pedometer (Omron HJ‐750 ITC) throughout the day and to follow their usual routine of daily activities, and to remove the pedometer only when bathing, showering, or swimming. Upon return of the pedometer at baseline, data regarding steps per day were electronically uploaded by the researcher according to the Omron Health Manager Software protocol. This information was provided to participants. The pedometer’s unique feature of providing an hourly representation of steps per day assisted in calculation of the total number of steps, as well as an understanding of times of high and low step count Intervention phase: 1. Pedometer feedback
2. Email
3. Goal‐setting
Control: Control group participants were similarly provided with a general motivational message bi‐weekly but were not provided with a pedometer over the 10 weeks, and therefore received no pedometer feedback. Participants were encouraged to improve their physical activity levels steadily (e.g. by 10% per week) until the recommended 30 minutes of moderate physical activity of at least 5 times a week was achieved |
|
| Outcomes |
Physical activity
Cardiovascular and type 2 diabetes risk factors
|
|
| Statistical analysis |
Imputation of missing data: none reported by study authors Sample size calculation: prospective: a power analysis for a 2‐group, independent sample t‐test was conducted using the GPower data analysis website (reference provided). Based on minimum improvement of 1000 steps/d, as established in this pilot study, a sample size of approximately 85 participants per arm of the study is required to ensure 80% statistical power and a P value < 0.05. Considering this possibility and the likelihood of performing subgroup analyses based on factors such as age and gender, as well as the possibility of loss to follow‐up, we estimate that a sample size of 150 participants in IG and CG, respectively, would be an appropriate target sample Author conclusions: based on improvement of 1000 steps/d (IG), a minimum of 85 participants in IG and CG, respectively, is required for a future RCT (80% power; P < 0.05). We recommend a minimum of 150 participants in each group to account for loss to follow‐up and to allow for subgroup analyses Statistical analysis: performed in STATISTICA version 8 (StatSoft Inc., Tulsa, Oklahoma, USA) with statistical significance set to P < 0.05. Repeated measures analysis was used to compare HR data in each of the walking trials, as a percentage of age‐predicted maximum HR. Regression analysis was used to predict a steps/min rate for MPA using the various trials conducted (i.e. the steps/min rate at which the participant would reach 60% of maximum age‐predicated HR). In the regression analysis, fitness emerged as a primary factor contributing to a difference in results. Data therefore were subsequently grouped by fitness (using the estimated VO₂max from the fitness test) and stratified by upper, middle, and lower tertiles. A multivariate analysis was subsequently used to determine factors that contributed to variance in the stepping rate corresponding to MPA. A post hoc Tukey HSD test was used to determine the trial/s that were similar to the self‐paced brisk walk (based on % maximum HR) The relationship between average number of steps/d and BP, %BF, BMI, WC, and VO₂max was assessed using Pearson‐Product‐Moment Correlation analysis. To differentiate between total steps/d and intensity of health and fitness outcomes, participants were grouped according to the number and intensity of steps: low (< 5000 steps/d, irrespective of intensity), high‐low (5000 steps/d with no aerobic activity), and high‐high (5000 steps/d with aerobic activity). The 5000 steps/d cut‐off is based on current PA classifications that categorise those accumulating fewer than 5000 steps/d as inactive. Analyses of covariance, adjusting for age, gender, and total steps/d, were used to compare groups, with Bonferonni post hoc analyses, to determine the between‐group effect of these categories for BP, %BF, BMI, waist circumference, and VO₂max Adjustment for clustering: none reported by study authors |
|
| Notes | Funded by Durban University of Technology (DUT) and the National Research Foundation (Thuthuka) | |
| Risk of bias | ||
| Bias | Authors' judgement | Support for judgement |
| Random sequence generation (selection bias) | Unclear risk | "participants were randomly allocated to an intervention group (IG) or a wait‐listed control group (CG)." "The allocation of participants into IG and CG was achieved by random selection of participants from a composite participant list (Microsfot Excel)." Method of random sequence generation not described |
| Allocation concealment (selection bias) | Unclear risk | No additional information provided |
| Blinding of participants and personnel (performance bias) All outcomes | High risk | Blinding of study personnel was not described. Blinding of participants unlikely as “two CG participants, upon being allocated to the CG, declined further participation in the study”. Although “the pedometer screen was covered to reduce the likelihood of participants observing their daily steps, which might have influenced habitual levels of physical activity and subsequently the accumulation of daily steps during the baseline measurement”, awareness of allocation may have affected behaviour during the study |
| Blinding of outcome assessment (detection bias) PA, sedentary and QoL | Low risk | Steps per day were electronically recorded and uploaded by researchers from the pedometers. Unlikely to be affected by lack of blinding |
| Blinding of outcome assessment (detection bias) Disease risk factors | Low risk | Objectively measured by researchers and unlikely to be affected by any lack of blinding |
| Incomplete outcome data (attrition bias) All other outcomes | Low risk |
Intervention: Randomised: 11. Analysed: 11 Control: Randomised: 11. Analysed: 8 (2 participants declined further participation after allocation to the control group, 1 participant did not complete the pedometer wear and follow‐up measures) All outcomes appeared robust to sensitivity analysis based on reasonable best and worst case assumptions about missing data |
| Selective reporting (reporting bias) | Low risk | No study protocol was available. Study appeared to report all outcome measures as planned. This was a pilot study not designed to identify statistically significant results, but to assist in calculation of sample sizes for a larger study, so selective reporting of analysis or outcomes is unlikely |
| Other bias | Low risk | None was identified |
Ribeiro 2014.
| Study characteristics | ||
| Methods | Randomised controlled trial Aim: a 4‐group randomised controlled trial evaluated the impact of distinct workplace interventions to increase physical activity (PA) and to reduce anthropometric parameters in middle‐age women |
|
| Participants |
Population description: women aged 40 to 50 years who were physically inactive during their leisure time and employees from a large University Hospital that has more than 15,000 employees who were physically inactive at their leisure time Pedometer intervention: (interventions 2 and 3, PedIC and PedGC): 101 participants Alternative physical activity intervention: (intervention 4, AT): 47 participants Control group: (intervention 1, MTC): 47 participants Location: Brazil Inclusion criteria: participants were middle‐age females, physically inactive during their leisure time (< 30 minutes of physical activity in leisure time, evaluated by the question from the IPAQ long version). Women using pharmacotherapy for weight reduction and those with BMI > 40, with uncontrolled hypertension or diabetes mellitus, or who had functional limitations preventing them from walking, were excluded Recruitment: participants were recruited through pamphlets and posters distributed in the hospital between February 2010 and 2011. Women who were interested in participating in the study contacted the researcher by telephone or by email to schedule an evaluation to verify eligibility Demographics: Age: MTC 45 (3); PedIC 45 (3); PedGC 45 (3); AT 45 (3) Gender: 0% male (included only females) Marital status: married (%) MTC 23 (48); PedIC 26 (49); PedGC 32 (67); AT 25 (52) Education: high school education (%) MTC 43 (91); PedIC 43 (81); PedGC 42 (89); AT 34 (71) Employment: workers at day work shift (%) MTC 40 (85); PedIC 48 (90.5); PedGC 41 (85.5); AT 39 (83) |
|
| Interventions |
Duration: 12 weeks Four health professionals with experience in physical activity counselling volunteered to participate in the MTC, PedIC, and PedGC protocols and received specific training before the study Pedometer intervention (interventions 2 and 3): Combined for this review from 2 study intervention groups
Alternative physical activity intervention (intervention 4, AT):
Control (intervention 1, MTC):
|
|
| Outcomes |
Physical activity
Cardiovascular and type 2 diabetes risk factors
|
|
| Statistical analysis |
Imputation of missing outcomes: last observation carried forward method was used for those classified as lost to follow‐up Statistical analysis: one‐way ANOVA or Chi² tests compared baseline differences between organisations and between intervention groups. The Cohen effect size was calculated, and an intention‐to‐treat approach was performed and was classified as small (0.21 to 0.49), medium (0.50 to 0.79), or large (≥ 0.80) |
|
| Notes | This study was funded by the Fundação de Amparo à Pesquisa do Estado de São Paulo (FAPESP) and by Conselho Nacional de Pesquisa (CNPq) | |
| Risk of bias | ||
| Bias | Authors' judgement | Support for judgement |
| Random sequence generation (selection bias) | Low risk | "Using a Microsoft Excel program, a simple randomization sequence was computer‐generated by one of the investigators of the study who was not directly involved with either the assessments or treatment of the patients" |
| Allocation concealment (selection bias) | Unclear risk | "The allocation was performed using numbered, sealed, and opaque envelopes, and four sealed envelopes were prepared for every participant. Each envelope corresponded to one of the study groups, and an envelope was chosen by the participant after the baseline measurements were performed" Unclear how generation of a random sequence related to selection from among 4 envelopes by the participant, or whether personnel could have known which of the set of 4 corresponded to each group |
| Blinding of participants and personnel (performance bias) All outcomes | High risk | Trial registration information states “open label”. Participants may have modified behaviour in response to knowledge of allocation group, in particular, participants in the control group |
| Blinding of outcome assessment (detection bias) PA, sedentary and QoL | High risk | Self‐reported by participants and may have been influenced in response to knowledge of allocation group |
| Blinding of outcome assessment (detection bias) Disease risk factors | Low risk | Measured objectively and unlikely to be affected by lack of blinding |
| Incomplete outcome data (attrition bias) All other outcomes | Low risk |
Intervention groups (combined for this review): PedIC: randomised: 53. Analysed: 47 (1 did not receive intervention (lack of interest), 2 discontinued intervention (lack of interest), 3 were lost to follow‐up (refuse)) PedGC: randomised: 48. Analysed: 33 (2 did not receive intervention (lack of interest), 12 discontinued (8 lack of time, 3 health problem, 1 lack of interest), 1 lost to follow‐up (refuse)) Alternative exercise control: Randomised: 47. Completed: 26 (1 did not receive intervention (lack of time), 19 discontinued (13 lack of time, 3 health problems, 2 aesthetic surgery, 1 lack of interest), 1 lost to follow‐up (medical license)) Minimal intervention control: Randomised: 47. Completed: 45 (2 discontinued (1 lack of time, 1 health problem)) Follow‐up was completed with participants who did not receive or discontinued the intervention on an intention‐to‐treat basis. Only 4 individuals were lost to follow‐up. Missing data were imputed using the last observation carried forward. Although this assumption is likely to have been overly optimistic, the data were robust to a sensitivity analysis based on plausible assumptions about missing data |
| Selective reporting (reporting bias) | High risk | BMI, blood pressure and blood glucose, and quality of life were measured but follow‐up results were not reported. Study registration at ClinicalTrials.gov indicated that specified planned measures for primary outcome changed from planned steps/week to steps/d |
| Other bias | Low risk | None was identified |
Swartz 2014.
| Study characteristics | ||
| Methods | Randomised controlled trial Aim: to assess change in sitting and physical activity behaviour in response to a workplace intervention to disrupt prolonged sitting time |
|
| Participants |
Populationdescription: full‐time employees (employed ≥ 20 years) engaged in a sedentary occupation/clerical positions at a large, Midwestern American university through the university directory Interventiongroup 1: 40 participants Interventiongroup 2 (control): 38 participants Location: Milwaukee, USA Inclusioncriteria: participants were included if they sat for more than 60% of their workday, as measured through verbal self‐report Recruitment: not reported Demographics: Age (mean (SD)): all 44.3 (11.1), for stand 42.3 (11.6), for step (intervention) 46.1 (10.5) years Gender (proportion male (%)): all 32, for stand 40, for step 25 Ethnicity (proportion white (%)): all 89, stand 90, step 88 Completed college (%): all 92, stand 87, step 97 |
|
| Interventions |
Duration: 1 week (measurements during all working hours on the same 3 consecutive workdays during 2 successive weeks (baseline and intervention weeks)) Pre‐intervention phase: Participants attended a first meeting in a laboratory setting, where they provided consent and height and weight measures and a health history questionnaire. Participants were given instructions on how to wear the activPAL motion and postural assessment monitor (PAL Technologies, Glasgow, UK). The activPAL is a uniaxial piezoresistive accelerometer and inclinometer that is small and lightweight and measures both dynamic and static movements. It was attached to the midline of the front of the right thigh with a manufacturer‐supplied adhesive. The activPAL measures the posture of an activity according to the longitudinal axis of the thigh. Data were collected at a predetermined 10 Hz and at 15‐second intervals. Unit of measurement is steps Intervention group (step):
Intervention group (stand):
|
|
| Outcomes |
Physical activity
Sedentary behaviour
|
|
| Statistical analysis |
Sample size calculation: a sample size of 30 per group was chosen a priori to achieve 80% to detect a minimum pre‐post change of 30 minutes Imputation of missing outcomes: not reported by study authors Statistical analysis: at baseline and post intervention, averages were estimated according to mixed‐effect models with random intercepts and random slopes for time, controlling for mean‐centred age, sex, and BMI. Analyses were performed with STATA 13. Significance was set at α level of P < 0.05 |
|
| Notes | Funding sources include the Clinical and Translational Science Institute of South‐eastern Wisconsin | |
| Risk of bias | ||
| Bias | Authors' judgement | Support for judgement |
| Random sequence generation (selection bias) | Unclear risk | "Random number generation was used to assign participants to either the Stand group or Step group" |
| Allocation concealment (selection bias) | Low risk | "Assignments were written out and placed in sealed, numbered envelopes. The envelopes were opened sequentially by a researcher, participants were informed of group assignment, and a new monitor was issued to each participant." Unclear if envelopes were opaque, but probably done |
| Blinding of participants and personnel (performance bias) All outcomes | High risk | Unclear but unlikely given the nature of the intervention, and participants may have been aware of each other within the same workplace. Participants may have modified their usual behavior in response to knowledge of the study, in particular, participants in the control group |
| Blinding of outcome assessment (detection bias) PA, sedentary and QoL | Low risk | “Recorded output from activPAL monitor was downloaded, processed, and classified into sitting, standing and walking by using manufacturer‐supplied activPAL software” |
| Incomplete outcome data (attrition bias) All other outcomes | High risk |
Pedometer group: 40 randomised 38 participated in intervention (2 dropped out) 31 analysed (3 did not wear monitor for sufficient time, 3 equipment malfunction) Stand group: 38 randomised 37 participated in intervention (1 dropped out) 29 analysed (4 did not wear monitor for sufficient time, 3 equipment malfunction) Sensitivity analysis based on plausible assumptions about missing data indicated that results were highly susceptible to change |
| Selective reporting (reporting bias) | Unclear risk | Protocol not available, although all outcomes appear to have been reported as planned |
| Other bias | Low risk | None was identified |
Talbot 2011.
| Study characteristics | ||
| Methods | Randomised controlled trial Aim: to compare the effects of a pedometer‐based behavioral intervention (Fitness for Life, FFL) and the traditional army physical fitness (TRAD) intervention on physical activity, aerobic fitness, and chronic heart disease risk factors in healthy adult men and women in the Army National Guard (ARNG) who had failed the Army Physical Fitness Test (APFT) |
|
| Participants |
Population description: volunteer, part‐time Army National Guard (ARNG) members, who had failed the 2‐mile run component of the Army Physical Fitness Test and had no history of major medical problems Intervention group: 84 participants Control group: 72 participants Location: Maryland and Washington, DC, USA Inclusion criteria: volunteer part‐time Army National Guard members who had failed the 2‐mile run component of the Army Physical Fitness Test (APFT), with 12 months or longer before re‐enlistment or retirement, and who had no history of CHD or stroke, were not currently taking hypertensive or cholesterol‐lowering medications, had not been pregnant within the previous 6 months, were not postmenopausal or currently taking hormone replacement therapy, and had no major musculoskeletal disorders. Postmenopausal women and women on hormone replacement therapy were excluded owing to their small numbers and potential confounding effects on serum lipoprotein Recruitment: from a pool of 261 ARNG soldiers who failed the run portion of the APFT, 156 met the criteria for inclusion in the study and were randomised into 2 groups Demographics: Age: mean (SD) for intervention 32.7 (10.1); for controls 32.8 (8.3) years Gender: 68.8% male for intervention, 80.4% for controls Race: intervention 50% white, 39% African American, 7% Asian/Pacific Islander. Controls 31% white, 50% African American, 7% Asian/Pacific Islander Education: intervention 27% high school graduate, 50% some college, 7% college graduate, 8% some postgraduate, 8% advanced degree. Controls 31% high school graduate, 50% some college, 2% college graduate, 15% some postgraduate, 2% advanced degree |
|
| Interventions |
Duration: 24 weeks (12 weeks of conditioning and 12 weeks of maintenance) Pedometer intervention: the Fitness for Life (FFL) intervention was designed specifically for the reserve components of ARNG and Reserve to teach soldiers usually working a full‐time civilian job and a part‐time military job to incorporate moderate‐intensity physical activity (PA) into their daily lives 1. Professional contact/counselling
2. Goal‐setting
3. Environmental prompts
4. Feedback
Alternative physical activity intervention: the army physical fitness (TRAD) intervention follows Army Regulation 350‐41, with recommendations detailed in the army’s Field Manual 21‐20. The intervention consists of 12 weeks of high‐intensity conditioning, defined as 75% to 80% of maximum heart rate and 12 weeks of maintenance 1. Professional contact/counselling
2. Goal‐setting
|
|
| Outcomes |
Physical activity
Cardiovascular disease and type 2 diabetes risk factors
Other outcomes not reported in this review
|
|
| Statistical analysis |
Sample size calculation: "based on the predicted effect of the intervention with projected 40% attrition, we estimated a total sample size of 156 ARNG soldiers to demonstrate a 10% improvement in APFT scores (effect size, d = 0.65) and physical activity (effect size d = 0.56) at an α of 0.05 and a power of 0.80" Imputation of missing data: "we used expectation‐maximisation for imputation estimates of missing data in the group of protocol completers, with SPSS Missing Value Analysis 16.0. The missing data for individual variables ranged between 1% and 19%. Missing data were determined to be missing at random, meeting expectation‐maximization assumptions." Hence, expectation‐maximisation was undertaken within those returning at follow‐up. Imputation was not undertaken for those lost to follow‐up Statistical analysis: statistical analyses were completed using PASW Statistics (SPSS) version 17.0. Descriptive statistics were calculated including frequencies, means, SDs, and percentages. Chi² test or Fisher’s exact test was used to examine relationships between group assignment and categorical variables. Independent sample t‐test statistics were used to determine differences between groups at baseline on the primary outcome variables (APFT and PA) and the secondary outcome variable (CHD risk). A repeated‐measures analysis of variance was used to test for main effects of the intervention (FFL vs TRAD) over time (baseline, 12‐week, and 24‐week follow‐up) and for the intervention‐by‐time interaction. The Geisser–Greenhouse correction 26 was applied if the statistical assumption of compound symmetry was not met. We used expectation‐maximisation for imputation estimates of missing data in the group of protocol completers, with SPSS Missing Value Analysis 16.0.27. Missing data for individual variables ranged between 1% and 19%. Missing data were determined to be missing at random, meeting expectation‐maximisation assumptions. A 2‐tailed P value ≤ 0.05 was set for statistical significance Based on the predicted effect of the intervention with projected 40% attrition, we estimated a total sample size of 156 ARNG soldiers to demonstrate 10% improvement in APFT scores (effect size, d = 0.65) and PA (effect size d = 0.56) at an α of 0.05 and a power of 0.80 |
|
| Notes | Study authors acknowledged the Johns Hopkins Bayview General Clinical Research Center (which is funded by Department of Health and Human Services, National Institutes of Health (NIH), National Center for Research Resources, no. 5 M01 RR0279) for providing core laboratory and data management support and equipment, and the Intramural Research Program of the NIH, National Institute on Aging. Funding for the project was provided by Triservice Nursing Research Program, Johns Hopkins Bayview General Clinical Research Center, the Intramural Research Program of NIH, and the National Institute on Aging | |
| Risk of bias | ||
| Bias | Authors' judgement | Support for judgement |
| Random sequence generation (selection bias) | Unclear risk | Study described as a "randomized controlled trial". No further information given on the method used to generate the random sequence |
| Allocation concealment (selection bias) | Unclear risk | No information provided |
| Blinding of participants and personnel (performance bias) All outcomes | High risk | No information provided. It is unlikely that personnel delivering the specific interventions would have been blinded. Participants may have been unaware of the differences between interventions on allocation, but being colleagues in the National Guard, it is possible that communication among participants would have occurred that identified the nature of each intervention. Although both interventions were active physical training interventions, it is possible that participants may have had a preference for the traditional training intervention (control) over the new (pedometer‐based) intervention, perhaps contributing to the higher dropout rate in the pedometer group |
| Blinding of outcome assessment (detection bias) PA, sedentary and QoL | High risk | Physical activity outcomes were self‐reported. It is possible that participants in either study group, knowing that the intervention had begun and the direction of expected change, may have exaggerated activity levels. Although this applies to both groups, it may have applied more to 1 group than another, for example, if participants had stronger belief in the effectiveness of one intervention over another (e.g. traditional vs new intervention), or depending on participants' experience of the intervention. Participants in the pedometer arm may have felt greater pressure to report increased steps per day. Participants in the control arm may have felt greater pressure to report increased periods of higher‐intensity physical activity |
| Blinding of outcome assessment (detection bias) Disease risk factors | Low risk | Measured objectively by study personnel |
| Incomplete outcome data (attrition bias) All other outcomes | High risk |
Intervention: Randomised: 84 Analysed: at 12 weeks: 51, at 24 weeks: 48 Control: Randomised: 72 Analysed: at 12 weeks: 53, at 24 weeks: 46 Reasons lost to follow‐up (not provided by group): military deployment (15), left National Guard (21), personal reasons (22), injury not related to the study (3), passed Army Physical Fitness Test (1) "ARNG soldiers who dropped out of the training intervention programme had lower baseline APFT scores, suggesting that less fit individuals require more motivation to complete such a program", indicating that data were not missing at random. "We used expectation‐maximization for imputation estimates of missing data in the group of protocol completers", but data were not imputed for participants who withdrew This level of incomplete data is enough to pose high risk for the results under plausible assumptions about missing data |
| Selective reporting (reporting bias) | Unclear risk | Study protocol was not available. Heart rate was measured but was not reported, but available outcomes (including additional data provided through personal communication) included a wide range of expected outcomes with a range of significant and non‐significant effects, favouring both interventions. It is unlikely that outcomes were selected based on results |
| Other bias | Low risk | None was identified |
Viester 2012.
| Study characteristics | ||
| Methods | Randomised controlled trial Aim: to evaluate the effectiveness of a tailored intervention for improving lifestyle behaviour and for prevention and reduction of overweight and musculoskeletal disorders (MSDs) among construction workers, and to describe the evaluation study regarding its (cost)‐effectiveness |
|
| Participants |
Population description: blue collar construction site workers and factory workers at a large construction company Intervention group: 162 participants Control group: 152 participants Location: The Netherlands Inclusion criteria: blue‐collar workers of a Dutch construction company who attended the voluntary periodic health screening (PHS) at the occupational health service between February 2010 and October 2011. Workers who had been on sick leave for > 4 weeks at baseline were excluded. Sickness absence data were collected over a 2‐year period, starting 12 months prior to baseline Recruitment: conducted through the usual communication channels of the company at a non‐compulsory periodic health screening (PHS). Together with the invitation for the PHS, all workers received a brochure about the study, an informed consent form, and an additional questionnaire to measure baseline variables not included in the PHS Demographics: Age: total: 46.6 (9.7); intervention: 46.3 (9.9); control: 47.0 (9.5) Gender: 100% male |
|
| Interventions | The 'VIP in Construction' intervention. An extensive development phase was conducted based on a preliminary survey and focus groups with a sample of workers, as well as theoretical models of behaviour change and a review of evidence on effective intervention models. An adoption and implementation plan was also developed to accomplish intervention adoption and implementation by influencing behaviour of individuals who will make decisions about adopting and using the intervention and of individuals who deliver the intervention. This includes engagement of company human resources and management staff and efforts to ensure compliance of participants, including communication via company channels and linking the intervention to the company's existing PHS intervention Duration: 6 months Intervention: the intervention consisted of materials and tailored information on physical activity and diet, personal health coaching, and training instruction. Materials and coaching protocols were developed to enable tailoring of the intervention to individual risk factors and wishes of participants based on baseline measurements and questionnaires
Control: care as usual, including the PHS intervention |
|
| Outcomes |
Physical activity
Sedentary behaviour
Cardiovascular disease and type 2 diabetes risk factors
Other outcomes not to be reported in this review
|
|
| Statistical analysis |
Imputation of missing data: not reported/undertaken by study authors Sample size calculation: sample size was based on detecting a difference in change in body weight between intervention and control groups. In each group (intervention and control), 130 participants will be needed, based on a power of 80% and an alpha of 5%, and an expected weight loss of 1.5 kg (SD 4.3 kg) as a result of the intervention. The standard deviation used was subtracted from previous work by the same research group, studying construction workers. Taking into account loss to follow‐up of 20%, 324 workers should be included in this study |
|
| Notes | This project is part of the research programme, "Vitality in Practice", which is financed by Fonds Nuts Ohra (Nuts Ohra Foundation) | |
| Risk of bias | ||
| Bias | Authors' judgement | Support for judgement |
| Random sequence generation (selection bias) | Low risk | “...participants will be randomly assigned to either the intervention or the control group by a computer generated list using SPSS” |
| Allocation concealment (selection bias) | Low risk | “Following baseline measurement….the randomization was prepared and performed by an independent researcher” |
| Blinding of participants and personnel (performance bias) All outcomes | High risk | “Although participants were not informed of their allocation, participants and intervention providers could not be blinded.” Participants may have modified their usual behaviour in response to knowledge of the study, in particular, participants in the control group |
| Blinding of outcome assessment (detection bias) PA, sedentary and QoL | High risk | Physical activity and quality of life were self‐reported by participants who were not blinded |
| Blinding of outcome assessment (detection bias) Disease risk factors | Low risk | “...data collectors and data analysts were blinded for allocation." “To ensure standardization of measurements, [occupational physicians] and assistants were provided with measurement protocols." BMI, waist circumference, blood pressure, and cholesterol were objectively measured |
| Incomplete outcome data (attrition bias) All other outcomes | Low risk |
Intervention group:
162 randomised 6 months: 139 (9 lost to follow‐up, 10 termination of employment, 1 health problems, 1 deceased, 1 unknown) 12 months: 130 (9 lost to follow‐up, 1 termination of employment, 7 no time/interest, 1 other) Analysed: 128 (complete case analyses – all follow‐up measurements and questionnaires) Exceptions: weight, BMI n = 127; waist circumference n = 119, cholesterol n = 116 Control group: 152 randomised 6 months: 138 (14 lost to follow‐up, 65 termination of employment, 9 no time/interest) 12 months: 130 (8 lost to follow up, 8 no time/interest) Analysed: 129 (complete case analyses – all follow‐up measurements and questionnaires) Exceptions: waist circumference n = 114; cholesterol n = 115 However, these outcomes were found to be at low risk based on plausible assumptions about missing data |
| Selective reporting (reporting bias) | High risk | Protocol was published. Outcome measures for physical activity (PA) changed between protocol (no. days per week with at least 30 minutes moderate physical activity, SQUASH questionnaire) and publication (no days per week with at least 20 minutes of vigorous physical activity, SQUASH physical activity for leisure time only as the full questionnaire was not applied). A statistically significant effect was found for this definition of vigorous activity. Data on moderate and overall physical activity were requested from study authors but were not provided Overall cardiovascular disease risk score was planned in the protocol but was not reported |
| Other bias | Low risk | None was identified |
ALT: alanine aminotransferase.
ANCOVA: analysis of covariance.
ANOVA: analysis of variance.
AST: aspartate aminotransferase.
AT: aerobic training
BMI: body mass index.
BTEC: Business and Technology Education Council.
CDC: Centers for Disease Control and Prevention.
CHD: coronary heart disease.
CI: confidence interval.
cpm: counts per minute.
GCE: general certificate of education.
GCSE: general certificate of secondary education.
GMR: geometric mean ratio.
GTP: gamma‐glutamyltransferase.
HbA1c: glycosylated haemoglobin.
HDL: high‐density lipoprotein.
HDL‐C: high‐density lipoprotein cholesterol.
HOMA‐IR: insulin resistance, homeostasis model assessment.
HR: human resources.
IPAQ: International Physical Activity Questionnaire.
IPAQ‐SF: International Physical Activity Questionnaire‐Short Form.
IRI: immunoreactive insulin.
LDL: low‐density lipoprotein.
MET: metabolic equivalent of task.
MSD: musculoskeletal disorder.
MTC: minimal treatment comparator
MVPA: moderate to vigorous physical activity.
NVQ: national vocational qualification.
OHC: occupational healthcare unit.
OR: odds ratio.
PA: physical activity.
PAR‐Q: physical activity readiness questionnaire.
PEP: performance evaluation and planning.
PG: plasma glucose.
PHS: periodic health screening.
SD: standard deviation.
SF‐36: Short Form‐36.
SRT: self‐regulation theory.
TC: total cholesterol.
TG: triglyceride.
VO2: maximum rate of oxygen consumption.
WLQ: Work Limitations Questionnaire.
Characteristics of excluded studies [ordered by study ID]
| Study | Reason for exclusion |
|---|---|
| Aittasalo 2004 | Pedometers were not used throughout the intervention period |
| Baghianimoghaddam 2016 | Not a randomised controlled trial |
| Barrington 2012 | Pedometers were not used |
| Bassey 1983 | Pedometers were not used throughout the intervention period. Controls also received a pedometer |
| Binoy Mathew 2012 | Pedometers were not used |
| Bort Roig 2012 | Controls also received a pedometer (linked to Puig‐Ribera 2008) |
| Brehm 2011 | Pedometers were not used throughout the intervention period. No physical activity was measured as an outcome |
| Brooke‐Wavell 1996 | Pedometers were not used |
| Buman 2011 | Controls also received a pedometer |
| Butler 2004 | Not a workplace setting |
| Compernolle 2015 | Accelerometers were used |
| Della 2010 | Controls also received a pedometer |
| Erfurt 1991 | Pedometers were not used. No physical activity was measured as an outcome |
| Finkelstein 2015 | Accelerometers were used |
| Furukawa 2003 | Accelerometers were used. Controls also received an accelerometer. Participants could not view step count |
| Gell 2015 | Pedometers were not used |
| Gilson 2007 | Controls also received a pedometer |
| Gilson 2008 | Pedometers were not used throughout the intervention period |
| Hultquist 2005 | Not in a workplace setting. Participants could not view step count |
| Hunter 2012 | Not in a workplace setting. Pedometers were not used |
| Hunter 2012a | Pedometers were not used |
| Härmä 1988a | Pedometers were not used |
| Härmä 1988b | Pedometers were not used |
| Iwane 2000 | Controls also received a pedometer |
| Johannesson 2010 | Controls also received a pedometer. No physical activity was measured as an outcome |
| Kazi 2012 | Controls also received a pedometer |
| Kennedy 2007 | Pedometers were not used |
| Kim 2013 | Not in a workplace setting. Pedometers were not used throughout the intervention period |
| Lara 2016 | Not in a workplace setting (4% retired) |
| Lee 1997 | Pedometers were not used. |
| Leibiger 2012 | Not a randomised controlled trial. Excluded by German native speaker (Dario Sambunjak) |
| Mackey 2011 | Controls also received a pedometer |
| Martin 2013 | No physical activity was measured as an outcome |
| Miller 2015 | Accelerometers were used |
| Molde 2003 | Not in a workplace setting. Pedometers were not used |
| Moreau 2001 | Not in a workplace setting |
| Motl 2005 | Not in a workplace setting. Pedometers were not used |
| Murphy 2006 | Pedometers were not used throughout the intervention period. Controls also received a pedometer |
| Mutrie 2002 | Pedometers were not used |
| Naito 2008 | Pedometers were not used throughout the intervention period |
| Oja 1991 | Not in a workplace setting. Pedometers were not used |
| Petersen 2012 | Not in a workplace setting |
| Polzien 2007 | No physical activity measured as an outcome |
| Prestwich 2012 | Pedometers were not used |
| Puhkala 2011 | Not conducted in a workplace setting |
| Puig‐Ribera 2008 | Controls also received a pedometer |
| Serwe 2011 | Controls also received a pedometer |
| Slootmaker 2009 | Accelerometers were used |
| Speck 2001 | Controls also received a pedometer |
| Sternfeld 2009 | Not in a workplace setting |
| Terry 2010 | Pedometers were not used |
| Thorndike 2012 | Accelerometers were used |
| Thøgersen‐Ntoumani 2010 | Controls also received a pedometer |
| Torstensen 1998 | Not in a workplace setting. Pedometers were not used |
| Tucker 2011 | Participants could not view step count |
| Tudor‐Locke 2004a | Not in a workplace setting |
| Van Berkel 2011 | Pedometers were not used. Accelerometers were used |
| Vincent 2009 | Not in a workplace setting |
| Wing 1996 | Pedometers were not used |
Characteristics of studies awaiting classification [ordered by study ID]
Audrey 2019.
| Methods | Multi‐centre cluster‐randomised controlled trial in 84 workplaces in southwest England and south Wales Aim: the overall aim of the research is to examine the effectiveness and cost‐effectiveness of an employer‐led scheme to increase walking during the commute |
| Participants |
Population description: employed healthy volunteer adults; further description not reported Intervention group: 44 workplaces (31 participants) Control group: 43 workplaces (323 participants) Location: workplaces in southwest England and south Wales Inclusion criteria: employees of any age and gender; in small, medium, and large workplaces; in Bath, Swansea, and South Gloucestershire Exclusion criteria: employees who already always walk or cycle to work; disabled in relation to walking to work; employees whose job required driving to work or regular driving throughout the day (e.g. delivery drivers, sales representatives who set off from home in the work vehicle); workplaces with little direct communication between senior management and employees are not suited to this intervention (unless there is a local supervisor/manager with the authority to agree with the study activities) because of the need for employer support for recruitment of participants and Walk to Work promoters; workplaces with a large proportion of staff on short‐term or zero‐hours contracts are not suited because of the need for 1‐year follow‐up data collection; employees who are retiring before the 1‐year follow‐up data collection; workplaces with firm plans to significantly downsize or relocate during the study period; very small workplaces (< 5 employees) Recruitment: workplaces were identified through business directories and local authority lists of employers; were sent information about the study and an invitation to participate Demographics: Intervention group: 43% male, mean (SD) age 41.2 (11.4) years, 91% white British, 62% tertiary degree or equivalent, 38% income > £50,000 Control group: 43% male, mean (SD) age 42 (11.3) years, 90% white British, 59% tertiary degree or equivalent, 38% income > £50,000 |
| Interventions |
Duration: 10 weeks Intervention: There are 3 main stages of the intervention 1. Workplace ‘Walk to Work promoters’ will be identified (volunteers, or those nominated by participating employers, with an interest in walking and the capacity, within their usual role in the workplace, to promote walking amongst their colleagues). Walk to Work promoters will be trained (at a group external event or onsite, as appropriate to the needs of the workplace) by expert members of the research team about the health, social, economic, and environmental benefits of walking during the daily commute, and how to promote increased walking by walking the entire route (mainly those within 2 miles of the workplace) or by mixing walking with public transport or ‘park and walk’. They will be given resource packs and will be trained to access relevant websites and toolkits 2. Participating employees will be contacted by the Walk to Work promoter and will be given a Walk to Work pack including a booklet and a pedometer. Benefits of increased walking will be discussed, barriers and solutions discussed, and safe, feasible routes identified. Goals for incorporating walking into the journey to and from work will be set 3. Further encouragement will be provided through 4 contacts from the Walk to Work promoter over the following 10 weeks (face‐to‐face, email, or telephone as appropriate). During this time, Walk to Work promoters will also be prompted and encouraged in their role by 4 email/telephone contacts |
| Outcomes |
Physical activity
Also, the study intended to measure other process‐related (e.g. facilitators and barriers to participation in the intervention) and economic evaluation outcomes (e.g. costs to employers, employees, and the public sector of implementing the intervention) |
| Notes |
Statistical analysis: "the treatment effect will be estimated with its 95% confidence interval using regression methods, which will allow any between‐workplace variation in outcome to be incorporated as a random effect (an equivalent approach to multi‐level modelling), and will allow the minimisation variables to be included as covariates. In addition, baseline MVPA and imbalanced baseline measures will be included as covariates, according to a process pre‐specified in the study statistical analysis plan. Linear regression will be employed in the analysis of MVPA, and ordered logistic regression in the analysis of the number of days, over the previous 5 working days, when walking was the major mode of travel to and from work. If there is concern that a skewed MVPA distribution is causing problems for the linear regression, this will be investigated in a sensitivity analysis of log‐transformed MVPA" Sample size calculation: "using findings from the feasibility study, the sample size for the full‐scale trial was based on an average cluster size of 8, an ICC of 0.15, and participant attrition of 25%. With a total sample size of 678, we have 80% power with a 5% significance level to detect a 15% increase in mean MVPA" Trial registration: ISRCTN15009100 |
Bang 2016.
| Methods | Randomised controlled trial Aim: to determine the physical and psychological effects of an urban forest‐walking programme for office workers |
| Participants |
Population description: 54 office workers Location: Korea |
| Interventions |
Duration: 5 weeks, from October to November 2014 Intervention: 5 weeks of walking exercise based on Information‐Motivation‐Behavioural Skills Model Control: not described |
| Outcomes |
Physical activity Cardiovascular disease and type 2 diabetes risk factors
Quality of life Other outcomes:
|
| Notes |
Mattila 2013.
| Methods | Three‐arm randomised controlled trial Aim: overall aim not stated. Based on methods provided, the likely aim is to assess the benefit of an intervention that targets several behavioural health risk factors delivered face‐to‐face vs the intervention with additional technology support (including a pedometer) vs usual care |
| Participants |
Population description: employees of the city of Espoo, Finland. This encompassed a range of workplaces, including teachers, engineers, and healthcare personnel Intervention group: 118 participants Intervention + technology (including a pedometer) group: 118 participants Control group: 118 participants Location: employees of the city of Espoo, Finland Inclusion criteria: aged 30 to 55 years, willing to participate in the intervention, willing to make lifestyle improvements in 1 of the targeted behaviours (i.e. weight management, eating habits, physical activity, sleep habits, smoking, or alcohol consumption) within the following 6 months, rated their work ability as 7, 8, or 9 on a scale of 0 to 10 (10 being their lifetime best work ability), and either increased risk of diabetes (score of 12 to 20 in the diabetes risk test) or at least 1 of (1) overweight (body mass index; BMI = 27 to 34 kg/m²), (2) low physical activity level (not meeting physical activity recommendations), (3) unhealthy eating habits (not eating vegetables daily and/or not eating during the working day), (4) sleeping difficulties (at least 2 hours of self assessed sleep deprivation), (5) risky alcohol consumption (score of 5 or more for men, 4 or more for women in the Alcohol Use Disorders Identification Test), and (6) daily or occasional smoking. Pregnant women were excluded Recruitment: a web‐based health questionnaire was sent to all employees, of whom 37.93% (n = 4134) responded. Of 783 eligible employees, 352 were randomly assigned to the 3 arms Demographics: aged 30 to 55 years. Details available only for the intervention + technology (including a pedometer) group (n = 114): 28.9% male, aged 44.6 + 7.1 SD years, 58.8% college/university or higher education |
| Interventions |
Duration: 3 months, between February and June 2008 Intervention:
Intervention + technology (including a pedometer):
Control:
|
| Outcomes |
Physical activity
Cardiovascular disease and type 2 diabetes risk factors
Risk score
|
| Notes |
Statistical analysis: analysis and findings not reported. Outcomes collected at baseline and at 12 months (even though the intervention duration was only 3 months) Sample size calculation: not reported |
BMI: body mass index.I
cpm: counts per minutes.
MVPA: moderate to vigorous physical activity.
SD: standard deviation.
Characteristics of ongoing studies [ordered by study ID]
ACTRN12617001395325.
| Study name | Activity for Wellbeing |
| Methods | Randomised controlled trial with mixed‐methods design Aim: to study the efficacy of using a need‐supportive, person‐centred physical activity programme for improving and maintaining physical activity participation and psychological wellbeing in front‐line aged care workers |
| Participants |
Population description: target sample size: 30 Inclusion criteria: current employee of ACH Group, able to speak fluent English, at least 18 years of age, able to engage in moderate physical activity (as defined by the American College of Sports Medicine (ACSM)) and complete all outcome measures (including the Six‐Minute Walk), not currently meeting ASCM recommendations for physical activity (≥ 30 minutes of moderate cardiorespiratory exercise per day, 5 days per week) Exclusion criteria: volunteers with previously diagnosed conditions or signs or symptoms of disease as indicated on the Adult Pre‐exercise Screening System who need to provide medical clearance prior to participation in the study |
| Interventions |
Duration: 12 weeks Intervention: active need‐support (support of basic needs of competence, autonomy, and relatedness) delivered by an accredited exercise physiologist, using a self‐determination theory‐based approach and applied through the following strategies
Control: wait‐list control |
| Outcomes | Reported at baseline and at 12 weeks and 6 months post intervention (9 months post baseline) Physical activity
Cardiovascular disease and type 2 diabetes risk factors:
Quality of life
Other outcomes
|
| Starting date | 9 November 2017 |
| Contact information | Ms Merilyn Lock Alliance for Research in Exercise, Nutrition and Activity School of Health Sciences Playford Bldg, City East Campus University of South Australia Adelaide, SA 5001 Australia Telephone: +61 8 8302 1752 merilyn.lock@mymail.unisa.edu.au |
| Notes | Sources of funding: ACH Group; University of South Australia |
ACTRN12618001567213.
| Study name | Not stated |
| Methods | Randomised controlled trial |
| Participants |
Population description: education workforce Location: Hunter New England region, New South Wales, Australia Inclusion criteria: government primary schools that currently use the Skoolbag Communication app Exclusion criteria: schools located outside the Hunter New England Local Health District, with secondary students (central schools), catering exclusively for children requiring specialist care and/or already involved in an obesity prevention intervention trial. Participants younger than 18 years |
| Interventions |
Duration: 6 months Intervention group: the intervention is guided by social‐influence and cognitive‐behavioural theories and utilises the Get Healthy@Work framework to support the school’s implementation of the following existing 2 programs
Control group: not described |
| Outcomes | Measured at baseline and at 6 months Physical activity
Sedentary behaviour
Other outcomes
|
| Starting date | 15 October 2018 |
| Contact information | Dr Nicole Nathan HNE Population Health Longworth Ave Wallsend NSW 2287 Australia +61 2 49 246 257 nicole.nathan@hnehealth.nsw.gov.au |
| Notes | Sources of funding: Teachers Health Fund |
ACTRN12619000173190.
| Study name | Virgin PulsE Global ChAllenge Study (VEGAS) |
| Methods | Randomised controlled trial |
| Participants |
Inclusion criteria: provision of signed and dated informed consent form, stated willingness to comply with all study procedures and availability for the duration of the study, aged 18 and older, in good general health as evidenced by self‐reported medical history, employed by Australian organisations, agreeing to participate in the Virgin Pulse Global Challenge (VPGC) programme, physically able to participate in the VPGC programme (e.g. able to perform step count), agreement to adhere to Lifestyle Consideration (stated below) throughout study duration and to not discuss the VPGC programme with the team assigned to the control arm for the duration of the study and vice versa, fasted before any blood tests collected by participants’ respective physicians or pathologists, abstaining from caffeine, alcohol, or strenuous exercise 4 to 6 hours before each study visit assessment Exclusion criteria: previously enrolled in the VPGC programme, pregnant women or women who plan to conceive during the VPGC programme, weight ≥ 150 kg at baseline screening, unable to follow the VPGC programme due to physical limitations, unable to follow the VPGC programme due to language barriers, unable to commit to the study procedures and visits throughout the study duration |
| Interventions |
Duration: 100 days Intervention group: Virgin Pulse Global Challenge (VPGC) programme, which is a well‐being solution that equips participants with the knowledge, tools, and support required to improve lifestyle behaviour. The VPGC is a holistic health and well‐being platform for participants that is accessible 24/7, 365 days a year. All participants are encouraged to achieve 10,000 steps daily, but this is not mandatory. Participants will be randomised into teams of 7, joining either the intervention group or the control group. As soon as the teams are finalised, all participants will receive the same activity step count tracker. They are then required to set up a login account on the Virgin Pulse website (https://www.virginpulse.com) or via the Virgin Pulse application (app) available at Google Store. Next, participants are asked to sync their tracker with the Virgin Pulse app to enable daily steps to be recorded automatically throughout the 100 days. All activities involving step counts are automatically recorded on the tracker, and options are available to find equivalent steps for activities such as swimming and cycling. The 100‐day VPGC programme is developed by Virgin Pulse; the entire programme is delivered digitally on devices such as personal computer (through the Virgin Pulse website) and the Virgin Pulse app. Also, Virgin Pulse has a built‐in daily email reminder system to remind participants to sync their daily steps. All data captured at the Virgin Pulse website or on the Virgin Pulse app are stored on the Virgin Pulse server in Australia Control group: not described |
| Outcomes | Measured at 20 days and at 3 months post intervention (4 and 6 months post baseline) Cardiovascular disease and type 2 diabetes risk factors:
Quality of life
Other outcomes
|
| Starting date | 22 May 2019 |
| Contact information | Dr Won Sun Chen Swinburne University of Technology Department of Statistics, Data Science and Epidemiology, Level 9 Internal Mail H24, PO Box 218 Hawthorn, VIC, 3122 Australia +61 3 9214 8437 wchen@swin.edu.au |
| Notes |
Aittasalo 2017.
| Study name | Not stated |
| Methods | Cluster‐randomised controlled trial Aim: to promote active commuting to work through environmental, social, and behavioural strategies in 2 urban areas |
| Participants |
Population description: 1144 employees Intervention group: 8 workplaces Control group: 8 workplaces Location: Tampere, Finland Inclusion criteria: workplaces with a minimum of 10 employees were included to ensure that there would still be participants left in each workplace for follow‐up after dropout Exclusion criteria: none stated Recruitment: workplaces were identified using the database of Statistics Finland. After the information was gained, it was checked via Internet searches, visits to the area, and telephone calls to confirm that the workplaces were still operating, located in the area within the reach of the main walking and cycling trail, and employed more than 10 people. At this stage, the many car sales companies in the area were excluded because based on a few initial contacts, their interest towards ACW promotion seemed mild. Management was contacted by email or by telephone to inquire about their preliminary interest to participate in the study. Management determined the extent of each workplace’s participation. In small workplaces, all employees were included, but in larger workplaces, participation was limited to 1 or 2 units or departments to minimise the workload of the contact person in each workplace. Contact persons shared the names and email addresses of included employees with the researcher, who then was able to deliver personal study invitations to the employees. In some workplaces, personal invitations were delivered via the contact person due to a data privacy policy. A kick‐off meeting was organised in all participating workplaces to introduce the study to the employees Demographics: 52.7% of women in Area 1 (11 workplaces) and 54.3% in Area 2 (5 workplaces). Mean (SD) age in Area 1 was 44.5 (32.3) years, and in Area 2 was 44.1 (11.4) years. In Area 1, 42.9% had a university degree, and 65.2 in Area 2 |
| Interventions |
Duration: 6 months, from Fall 2016 to Spring 2017 Intervention: the intervention was based on the SE approach, which integrates multiple life contexts relevant to behaviour change. SE models offer different pathways and levels to reach population groups, which may be underrepresented or unconnected with single‐level interventions. Each workplace in EXP nominated a team to plan and carry out social and behavioural strategies. Each workplace nominated a team to plan and carry out social and behavioural strategies to promote active commuting to work (ACW). The team selected the strategies most suitable for their workplace using a workbook. Selection of strategies (n = 43) was categorised into organisational (n = 24), working unit (n = 9), and individual (n = 10) levels. Teams were obliged to select at least 1 strategy from each level and to make an implementation plan for each strategy. Teams met with researchers 3 times to plan. In the first meeting, teams were given the workbook, examples, and supportive material. In the second meeting, they were assisted to finalise selection of strategies. In the third meeting, teams were helped to agree on practical arrangements such as timing and responsibilities related to implementation Control: workplaces participated only in data collection but were offered the chance to receive the intervention after the study |
| Outcomes | Measured at 6 months post baseline Physical activity
Sedentary behaviour
Adverse effects
Other outcomes
|
| Starting date | September 2014 |
| Contact information | Minna Aittasalo UKK Institute for Health Promotion Research PO Box 30, 33501 Tampere, Finland +358‐3‐282‐9267 minna.aittasalo@uta.fi |
| Notes |
Statistical analysis: generalised linear mixed models will be used to analyse effects of the intervention Sample size calculation: a sample size of 8 individual workplaces per group with 64 participants per workplace achieves 80% power to detect a group‐wise difference of 1 in the change in number of daily walking or cycling sessions to work per week when the standard deviation is 3.0 and the intracluster correlation is 0.05 |
Pillay 2012.
| Study name | Steps That Count! |
| Methods | Randomised controlled trial Based on previous feasibility study (Pillay 2014) Aim: to investigate the effectiveness of a 10‐week pedometer‐based work site health promotion intervention (Steps that Count!) and individualised email‐based feedback to effect physical activity behavioural change (protocol) |
| Participants |
Population description: employed adults (further description not reported) Intervention group: not reported Control group: not reported Location: selected work site settings based in the province of KwaZulu‐Natal, RSA, South Africa Inclusion criteria: employees attending the wellness event and willing to participate were eligible if aged between 21 and 49 years; identified as being in the contemplation stage of the Transtheoretical Model towards improved physical activity; who have a contract with their employer until the end of the 12‐week measurement period. In addition, participants must not be pregnant; must not be under diagnosis or treatment of cancer; must not have any other condition that makes physical activity difficult or impossible; must be non‐compliant for 3 or more days during the pre‐intervention blinded wearing of a pedometer Recruitment: to be undertaken through a Health Risk Appraisal available to all employees attending a corporate wellness event Demographics: Age: mean 32 (SD 8) Gender: 50% male |
| Interventions |
Duration: 3 months Intervention:
Control: no intervention received |
| Outcomes |
Physical activity
Cardiovascular disease and type II diabetes risk factors (specifics not reported)
|
| Starting date | Not reported. Still ongoing as of March 2016 |
| Contact information | Julian David Pillay UCT/MRC Research Unit for Exercise Science and Sports Medicine Faculty of Health Sciences University of Cape Town Cape Town, South Africa Email: pillayjd@dut.ac.za |
| Notes |
Statistical analysis: "linear regression analyses will be performed with the follow‐up value of the outcome measure as the dependent variable and adjustment for the baseline value. Assumptions of linear regression analysis will be verified with residual analysis. To assess whether the differences in the primary outcome between the groups are affected by random differences between them, an analysis of covariance (ANCOVA) will also be undertaken" Imputation of missing data: not reported Adjustment for clustering: not reported Sample size calculation: "a sample size of 30 participants per arm of the study is required to ensure 80% statistical power and with a P value set at < 0.05. However, if a modest improvement of 1500 steps/d is considered, a sample size of approximately 85 participants per arm is required. In order to achieve this, 1200 employees attending wellness events will be targeted. Of these, a minimum of 480 employees (40%) will be identified to be in the contemplation stage of the Transtheoretical Model" |
ACSM: American College of Sports Medicine.
ACW: XXX.
ANCOVA: analysis of covariance.
AQOL‐8D: Assessment of Quality of Life, Eight‐Dimensional.
BF: body fat.
BMI: body mass index.
BREQ‐3: Behavioral Regulation in Exercise Questionnaire.
DASS‐21: Depression Anxiety Stress Scale.
ECOs: Exercise Causality Orientations.
ESS: Epworth Sleepiness Scale.
HEAT: Health Economic Assessment Tool for Cycling and Walking.
MARCA: Multimedia Activity Recall for Children and Adolescents software.
MVPA: moderate to vigorous physical activity.
PNSE: Psychological Need Satisfaction in Exercise.
PSC: Premier's Sporting Challenge.
PSQI: Pittsburgh Sleep Quality Index.
PWI‐A: Personal Well‐being Index ‐ Adult version.
SD: standard deviation.
VPGC: Virgin Pulse Global Challenge.
WAI: Work Ability Index.
WC: waist circumference.
Differences between protocol and review
Intervention duration categories in the Subgroup analysis and investigation of heterogeneity section have been amended to coincide with follow‐up duration categories listed as Primary outcomes. Two categories of time points have been added: follow‐up after completion of the intervention (our primary points of interest, as they indicate sustained effect) and measurements taken immediately at completion of the intervention period. In each category, time points are grouped into short term (< 1 month), medium term (1 month to < 1 year), and long term (1 year or longer). We clarified that reporting of secondary outcomes was not restricted to studies in which a positive effect was observed for physical activity, and we noted that outcomes would not be reported if they were measured only in a selected subgroup of participants.
Several changes were made to the planned Secondary outcomes. As other body composition measures were available, body weight was not assessed as a secondary outcome in Secondary outcomes. Given the opposite direction of benefit for HDL and LDL cholesterol, we decided not to include the additional combined measure of total cholesterol. We also changed our decision to report the physical health component of quality of life measures in the previous version of the review in favour of mental health components, as we felt this was a more important complement to the other measures of physical health reported.
Some outcome descriptors have been changed for clarity and accuracy. Body composition outcomes are now referred to as anthropometric. Hypertension outcomes are now referred to as blood pressure. Biomedical outcomes are now referred to as biochemical.
ClinicalTrials.gov and the WHO International Clinical Trials Registry Platform (ICTRP) trials registers were added as additional electronic sources searched. We had initially planned to search the Cochrane Public Health Group and the Cochrane Heart Group trials registers for relevant studies, but we determined that our search was sufficiently broad (and already included the Cochrane Central Register of Controlled Trials), and that this additional searching was not required. OSH UPDATE was searched up until 1 December 2014, but was not included in subsequent updates due to lack of relevant studies identified. Websites of relevant organisations were included in the first search for the review, and authors of included studies were contacted to identify any additional studies, but these procedures were not repeated in subsequent searches.
As noted in the Excluded studies section, an additional study was excluded because, although random allocation was used, only one workplace cluster was allocated to each of the intervention and control arms, which was not considered adequate to reduce the risk of imbalance of confounders between these two arms (Racette 2009). This was an additional criterion not originally planned at the protocol stage.
In the 2016 update of the search, we used the Cochrane Crowd crowd‐sourcing platform to perform one of the initial screens of titles and abstracts, specifically to identify reports of randomised trials. The resulting reduced set of records was then screened against the other eligibility criteria as normal.
As outlined in the Quality of the evidence section, the quality of evidence was assessed using the GRADE system. We initially planned to conduct GRADE assessments of outcomes for which three or more studies contributed data, but in the final review we conducted GRADE assessments for all pre‐specified main outcomes at the longest available follow‐up after completion of the intervention (as presented in 'Summary of findings' tables).
In the original protocol and in early versions of this review (Freak‐Poli 2011; Freak‐Poli 2013), we specified a threshold for considering studies at high risk of bias ‐ "three or more, excluding blinding". Given advances in our understanding of risk of bias over time, we considered this threshold to be lenient. Although blinding was unlikely to have been met by most of the studies included in the review, lack of blinding can have a serious effect on study outcomes. Hence, the risk of bias criteria have been re‐defined as studies have failed to achieve low risk of bias in three or more domains including blinding of participants and personnel and blinding of outcome assessment.
Contributions of authors
RFP designed and co‐ordinated the review, provided subject matter expertise, conducted additional searching, conducted study selection, contacted study authors, undertook data extraction and risk of bias assessment, conducted analyses, and drafted the review text. MC assisted with co‐ordination; conducted additional searching; participated in study selection; undertook data extraction, risk of bias assessment, and GRADE assessment; and conducted analysis. LAB conducted study selection; undertook data extraction, risk of bias assessment, and GRADE assessment; contacted study authors; and assisted with manuscript amendments. SC conducted study selection and provided subject matter expertise. AP conducted study selection and provided subject matter expertise. All review authors reviewed, amended, and approved the final text.
Sources of support
Internal sources
-
School of Public Health and Preventive Medicine, Monash University, Australia
Salary support for RFP and MC
-
School of Sport, Exercise and Health Sciences, Loughborough University, UK
Salary support for SC
-
Institute for Evidence‐Based Healthcare, Bond University, Gold Coast, Australia
Salary support for LAB
-
Institute for Health Transformation, Deakin University, Geelong, Australia
Salary support for AP
External sources
-
Heart Foundation, Australia
RFP receives support through a Post‐Doctoral Fellowship (101927, from 2018)
-
National Health and Medical Research Council, Australia
AP receives support through a Centre for Research Excellent Grant (from 2018). RFP received support through an Early Career Fellowship (to 2018). Cochrane Australia receives infrastructure funding, which covered in part salary costs for MC (to 2018)
Declarations of interest
None of the researchers have a commercial interest in the outcomes of this review. Two review authors (RFP, AP) would like to disclose that they undertook an independent research study, titled the Global Corporate Challenge® (GCC®) Evaluation Study, which evaluated the impact of a workplace pedometer intervention, which was not included in this review, as it was not a randomised controlled trial. The GCC® study was partially funded by the Australian Research Council (ARC) and the Foundation for Chronic Disease Prevention™ in the Workplace, which is associated with the Global Corporate Challenge®.
New search for studies and content updated (conclusions changed)
References
References to studies included in this review
Aittasalo 2012 {published data only}
- Aittasalo M, Rinne M, Pasanen M, Kukkonen-Harjula K, Vasankari T. Promoting walking among office employees - evaluation of a randomized controlled intervention with pedometers and email messages. BMC Public Health 2012;12:403. [DOI] [PMC free article] [PubMed] [Google Scholar]
- Aittasalo M. Personal communication with RFP. 19 June 2017.
- Aittasalo M. Personal communication with RFP. 25 June 2012.
Audrey 2015 {published and unpublished data}72882329
- *.Audrey S, Procter S, Cooper A, Mutrie N, Hollingworth W, Davis A, et al. Employer schemes to encourage walking to work: feasibility study incorporating an exploratory randomised controlled trial. Public Health Research 2015;3(4). [DOI: 10.3310/phr03040] [DOI] [PubMed]
- Audrey S, Procter S, Cooper AR. The contribution of walking to work to adult physical activity levels: a cross sectional study. International Journal of Behavioral Nutrition and Physical Activity 2014;11:8. [DOI] [PMC free article] [PubMed] [Google Scholar]
- Audrey S. Employer schemes to encourage walking to work: feasibility study incorporating an exploratory randomised controlled trial (protocol). NIHR Public Health Research Programme; version 3, July 2011. www.journalslibrary.nuhr.ac.uk/projects/10300104. [PubMed]
- Audrey S. Personal communication with M Hill. 13 May 2015.
- Audrey S. Personal communication with RFP. 8 March 2017.
- Procter S, Mutrie N, Davis A, Audrey S. Views and experiences of behaviour change techniques to encourage walking to work: a qualitative study. BMC Public Health 2014;14:868. [DOI] [PMC free article] [PubMed] [Google Scholar]
Carr 2013 {published data only}
- Carr LJ, Karvinen K, Peavler M, Smith R, Cangelosi K. Multicomponent intervention to reduce daily sedentary time: a randomised controlled trial. BMJ Open 2013;3(10):e003261. [DOI] [PMC free article] [PubMed] [Google Scholar]
- NCT01371084. Pedal@Work: a worksite wellness program (Pedal@Work). clinicaltrials.gov/show/NCT01371084 (first posted 10 June 2011).
Dishman 2009 {published data only}
- *.Dishman RK, DeJoy DM, Wilson MG, Vandenberg RJ. Move to Improve: a randomized workplace trial to increase physical activity. American Journal of Preventive Medicine 2009;36(2):133-41. [DOI] [PubMed] [Google Scholar]
- Dishman RK, Vandenberg RJ, Motl RW, Wilson MG, DeJoy DM. Dose relations between goal setting, theory-based correlates of goal setting and increases in physical activity during a workplace trial. Health Education Research 2010;25(4):620-31. [DOI] [PubMed] [Google Scholar]
- Dishman RK. Personal communication with RFP. 10 January 2017.
- Dishman RK. Personal communication with RFP. 15 August 2012.
- Wilson MG, Basta TB, Bynum BH, DeJoy DM, Vandenberg RJ, Dishman RK. Do intervention fidelity and dose influence outcomes? Results from the Move to Improve worksite physical activity program. Health Education Research 2010;25(2):294-305. [DOI] [PubMed] [Google Scholar]
Linde 2012 {published data only}
- Gavin KL, Linde JA, Pacanowski CR, French SA, Jeffery RW, Hob YY. Weighing frequency among working adults: cross-sectional analysis of two community samples. Preventive Medicine Reports 2015;2:44-6. [DOI] [PMC free article] [PubMed] [Google Scholar]
- Graham DJ, Linde JA, Cousins JM, Jeffery RW. Environmental modifications and 2-year measured and self-reported stair-use: a worksite randomized trial. Journal of Primary Prevention 2013;34:413-22. [DOI] [PMC free article] [PubMed] [Google Scholar]
- Linde J. Personal communication with M Hill. Btw. 20 Feb and 1 July 2015.
- *.Linde JA, Nygaard KE, MacLehose RF, Mitchell NR, Harnack LJ, Cousins JM, et al. HealthWorks: results of a multi-component group - randomized worksite environmental intervention trial for weight gain prevention. International Journal of Behavioral Nutrition and Physical Activity 2012;9(1):14. [DOI] [PMC free article] [PubMed] [Google Scholar]
- NCT00708461. Environmental intervention for weight gain prevention (HealthWorks). clinicaltrials.gov/ct2/show/NCT00708461. 18 July 2013.
- VanWormer JJ, Linde JA, Harnack LJ, Stovitz SD, Jeffery RW. Is baseline physical activity a determinant of participation in worksite walking clubs? Data from the HealthWorks Trial. Journal of Physical Activity and Health 2012;9(6):849-56. [DOI] [PMC free article] [PubMed] [Google Scholar]
- VanWormer JJ, Linde JA, Harnack LJ, Stovitz SD, Jeffery RW. Self-weighing frequency is associated with weight gain prevention over 2 years among working adults. International Journal of Behavioral Medicine 2012;19(3):351-8. [DOI] [PMC free article] [PubMed] [Google Scholar]
- VanWormer JJ, Linde JA, Harnack LJ, Stovitz SD, Jeffery RW. Weight change and workplace absenteeism in the HealthWorks study. Obesity Facts 2012;5(5):745-52. [DOI] [PMC free article] [PubMed] [Google Scholar]
Mansi 2013 {published data only}
- *.Mansi S, Milosavljevic S, Tumilty S, Hendrick P, Baxter GD. Use of pedometer-driven walking to promote physical activity and improve health-related quality of life among meat processing workers: a feasibility trial. Health and Quality of Life Outcomes 2013;11:185. [DOI] [PMC free article] [PubMed] [Google Scholar]
- Mansi S, Milosavljevic S, Tumilty S, Hendrick P, Higgs C, Baxter DG. Investigating the effect of a 3-month workplace-based pedometer-driven walking programme on health-related quality of life in meat processing workers: a feasibility study within a randomized controlled trial. BMC Public Health 2015;15:410. [DOI] [PMC free article] [PubMed] [Google Scholar]
- Mansi S. Personal communication with RFP. 30 January 2014.
Maruyama 2010 {published data only}
- *.Maruyama C, Kimura M, Okumura H, Hayashi K, Arao T. Effect of a worksite-based intervention program on metabolic parameters in middle-aged male white-collar workers: a randomized controlled trial. Preventive Medicine 2010;51(1):11-7. [DOI] [PubMed] [Google Scholar]
- Maruyama C. Personal communication with RFP. 6 March 2012.
- Moriyasu A. Personal communication with RFP. 3 April 2017.
Morgan 2011 {published data only}
- ACTRN12609001003268. The Workplace POWER trial: feasibility and efficacy of an obesity treatment and healthy lifestyles program for overweight male shift workers. http://www.anzctr.org.au/trial_view.aspx?ID=320595 (first received 16 November 2009).
- *.Morgan PJ, Collins CE, Plotnikoff RC, Cook AT, Berthon B, Mitchell S, et al. Efficacy of a workplace-based weight loss program for overweight male shift workers: the Workplace POWER (Preventing Obesity Without Eating like a Rabbit) randomized controlled trial. Preventive Medicine 2011;52(5):317-25. [DOI] [PubMed] [Google Scholar]
- Morgan PJ, Collins CE, Plotnikoff RC, Cook AT, Berthon B, Mitchell S, et al. The impact of a workplace-based weight loss program on work-related outcomes in overweight male shift workers. Journal of Occupational and Environmental Medicine 2012;54(2):122-7. [DOI] [PubMed] [Google Scholar]
- Morgan PJ. Personal correspondence with RFP. 21 August 2012.
- Young M. Personal correspondence with RFP. 13 Feburary 2017.
Parry 2013 {published data only}
- ACTRN12612000743864. Can a participatory workplace intervention improve sedentary behaviour and physical activity in office workers? (Protocol). http://www.anzctr.org.au/Trial/Registration/TrialReview.aspx?ACTRN=12612000743864 (first received 9 July 2012).
- Parry S, Straker L, Gilson ND, Smith AJ. Can participatory workplace interventions aimed at changing sedentary time also reduce musculoskeletal symptoms in office workers? In: 49th Annual Human Factors and Ergonomics Society of Australia Conference. 2013. [http://hdl.handle.net/20.500.11937/16596]
- Parry S, Straker L, Gilson ND, Smith AJ. Participatory workplace interventions can reduce sedentary time for office workers - a randomised controlled trial. PLoS One 2013;8:e78957. [DOI] [PMC free article] [PubMed] [Google Scholar]
- Parry S. Personal communication with RFP. 28 April 2017.
Pillay 2014 {published data only}
- Pillay J. Personal communication with RFP. 11 January 2017.
- Pillay J. Personal communication with RFP. 24 January 2013.
- Pillay J. Personal communication with RFP. 29 March 2016.
- *.Pillay JD, Kolbe-Alexander TL, Proper KI, Mechelen W, Lambert EV. Steps that count! A feasibility study of a pedometer-based, health promotion intervention in an employed, South African population. South African Journal of Sports Medicine 2014;26(1):15-9. [DOI: 10.7196/SAJSM.500] [DOI] [Google Scholar]
Ribeiro 2014 {published data only}
- NCT01567007. Change in physical activity levels in women at working place. https://clinicaltrials.gov/ct2/show/NCT01567007 (first posted 30 March 2012).
- Ribeiro MA, Martins MA, Carvalho CRF. Interventions to increase physical activity in middle-age women at the workplace: a randomized controlled trial. Medicine and Science in Sports and Exercise 2014;46:1008-15. [DOI] [PubMed] [Google Scholar]
Swartz 2014 {published data only}
- Swartz AM, Rote AE, Welch WA, Maeda H, Hart TL, Cho YI, et al. Prompts to disrupt sitting time and increase physical activity at work, 2011-2012. Preventing Chronic Disease 2014;11:8. [DOI] [PMC free article] [PubMed] [Google Scholar]
- Swartz AM. Personal communication with RFP. 11 January 2017.
Talbot 2011 {published data only}
- *.Talbot LA, Metter EJ, Morrell CH, Frick KD, Weinstein AA, Fleg JL. A pedometer-based intervention to improve physical activity, fitness, and coronary heart disease risk in National Guard personnel. Military Medicine 2011;176(5):592-600. [DOI] [PMC free article] [PubMed] [Google Scholar]
- Talbot LA, Metter J, Fleg JL, Weinstein AA, Frick KD. Cost effectiveness of two army physical fitness programs. Military Medicine 2013;178(12):1353. [DOI] [PubMed] [Google Scholar]
- Talbot LA, Weinstein AA, Fleg JL. Army Physical Fitness Test scores predict coronary heart disease risk in Army National Guard soldiers. Military Medicine 2009;174(3):245-52. [DOI] [PubMed] [Google Scholar]
- Talbot LA. Personal communication with RFP. 13 April 2017.
- Talbot LA. Personal communication with RFP. 17 July 2012.
Viester 2012 {published data only}
- Viester L, Verhagen EA, Bongers PM, Beek AJ. Process evaluation of a multifaceted health program aiming to improve physical activity levels and dietary patterns among construction workers. Journal of Occupational and Environmental Medicine 2014;56(11):1210-7. [DOI] [PubMed] [Google Scholar]
- Viester L, Verhagen EA, Bongers PM, Beek AJ. The effect of a health promotion intervention for construction workers on work-related outcomes: results from a randomized controlled trial. International Archives of Occupational and Environmental Health 2015;88(6):789-98. [DOI] [PubMed] [Google Scholar]
- *.Viester L, Verhagen EA, Proper KI, Dongen JM, Bongers PM, Beek AJ. VIP in construction: systematic development and evaluation of a multifaceted health programme aiming to improve physical activity levels and dietary patterns among construction workers. BMC Public Health 2012;12:89. [DOI] [PMC free article] [PubMed] [Google Scholar]
- Viester L, Verhagen EALM, Bongers PM, Beek AJ. Effectiveness of a worksite intervention for male construction workers on dietary and physical activity behaviors, body mass index, and health outcomes: results of a randomized controlled trial. American Journal of Health Promotion 2017;32(3):795-805. [DOI: 10.1177/0890117117694450] [DOI] [PubMed] [Google Scholar]
- Viester L. Personal communication with RFP. 13 March 2017.
- Dommelen P, Coffeng JK, Ploeg HP, derBeek AJ, Boot CRL, Hendriksen IJM. Objectively measured total and occupational sedentary time in three work settings. PLoS One 2016;11(3):e0149951. [DOI] [PMC free article] [PubMed] [Google Scholar]
References to studies excluded from this review
Aittasalo 2004 {published data only}
- Aittasalo M, Miilunpalo S, Suni J. The effectiveness of physical activity counseling in a work-site setting. A randomized, controlled trial. Patient Education and Counseling 2004;55(2):193-202. [DOI] [PubMed] [Google Scholar]
Baghianimoghaddam 2016 {published data only}
- Baghianimoghaddam MH, Bakhtari-Aghdam F, Asghari-Jafarabadi M, Allahverdipour H, Dabagh-Nikookheslat S, Nourizadeh R. The effect of a pedometer-based program improvement of physical activity in Tabriz University employees. International Journal of Preventive Medicine 2016;1(7):50. [DOI: 10.4103/2008-7802.177897] [DOI] [PMC free article] [PubMed] [Google Scholar]
- Baghianimoghaddam MH. Personal communication. Email. 16 July 2017.
Barrington 2012 {published data only}
- Barrington WE, Ceballos RM, Bishop SK, McGregor BA, Beresford SA. Perceived stress, behavior, and body mass index among adults participating in a worksite obesity prevention program, Seattle, 2005-2007. Preventing Chronic Disease 2012;9:E152. [DOI] [PMC free article] [PubMed] [Google Scholar]
Bassey 1983 {published data only}
- Bassey EJ, Patrick JM, Irving JM, Blecher A, Fentem PH. An unsupervised "aerobics" physical training programme in middle-aged factory workers: feasibility, validation and response. European Journal of Applied Physiology and Occupational Physiology 1983;52(1):120-5. [DOI] [PubMed] [Google Scholar]
Binoy Mathew 2012 {published data only}
- Binoy Mathew KV, Eapen C, Kumar PS. Reliability and concurrent validity of dynamic rotator stability test - a cross sectional study. Indian Journal of Physiotherapy & Occupational Therapy 2012;6(3):76-81. [PMC free article] [PubMed] [Google Scholar]
Bort Roig 2012 {published data only}
- Bort Roig J, Martin Horcajo M, Puig Ribera A, Gonzalez A, Martinez Lemos I. Walk & Work Spain: participants' perspectives and experiences on reducing occupational sitting time. Journal of Science and Medicine in Sport 2012;15(Suppl 1):S303. [Google Scholar]
- *.Bort Roig J, Puig Ribera A, Gilson N, Gonzalez A, Martinez Lemos I, Gine Garriga M, et al. A 5-months workplace pedometer-based intervention: did it change employees' sedentary behaviour 2 months after removal? Journal of Science and Medicine in Sport 2012;15(Suppl 1):S197. [Google Scholar]
- Puig Ribera AM. Personal correspondence with RFP. 29 March 2016.
Brehm 2011 {published data only}
- Brehm BJ, Gates DM, Singler M, Succop PA, D'Alessio DA. Environmental changes to control obesity: a randomized controlled trial in manufacturing companies. American Journal of Health Promotion 2011;25(5):334-40. [DOI] [PubMed] [Google Scholar]
Brooke‐Wavell 1996 {published data only}
- Brooke-Wavell K, Jones PR, Hardman AE. A 1-year programme of brisk walking reduced bone loss in healthy women aged 60-70 [abstract]. Osteoporosis International 1996;6 Suppl 1:137. [Google Scholar]
Buman 2011 {published data only}
- Buman MP, Giacobbi PR, Dzierzewski JM, Aiken Morgan A, McCrae CS, Roberts BL, et al. Peer volunteers improve long-term maintenance of physical activity with older adults: a randomized controlled trial. Journal of Physical Activity & Health 2011;8(Suppl 2):S257-66. [PMC free article] [PubMed] [Google Scholar]
Butler 2004 {published data only}
- Butler L, Dwyer D. Pedometers may not provide a positive effect on walking activity [online]. Health Promotion Journal of Australia 2004;15(2):134-6. [Google Scholar]
Compernolle 2015 {published data only}
- Compernolle S, Vandelanotte C, Cardon G, De Bourdeaudhuij I, De Cocker K. Effectiveness of a web-based, computer-tailored, pedometer-based physical activity intervention for adults: a cluster randomized controlled trial. Journal of Medical Internet Research 2015;17(2):e38. DOI:10.2196/jmir.3402.. [DOI] [PMC free article] [PubMed] [Google Scholar]
Della 2010 {published data only}
- Della LJ, Dejoy DM, Mitchell SG, Goetzel RZ, Roemer EC, Wilson MG. Management support of workplace health promotion: field test of the Leading by Example tool. American Journal of Health Promotion 2010;25(2):138-46. [DOI] [PMC free article] [PubMed] [Google Scholar]
Erfurt 1991 {published data only}
- Erfurt JC, Foote A, Heirich MA. Worksite wellness programs: incremental comparison of screening and referral alone, health education, follow-up counseling, and plant organization. American Journal of Health Promotion 1991;5(6):438-48. [DOI] [PubMed] [Google Scholar]
Finkelstein 2015 {published data only}
- Finkelstein EA, Sahasranaman A, John G, Haaland BA, Bilger M, Sloan RA, et al. Design and baseline characteristics of participants in the Trial of Economic Incentives to Promote Physical Activity (TRIPPA): a randomized controlled trial of a six month pedometer program with financial incentives. Contemporary Clinical Trials 2015;41:238-47. [DOI] [PubMed] [Google Scholar]
- Ouyang P. Personal communication with RFP. 8 June 2017.
Furukawa 2003 {published data only}
- Furukawa F, Kazuma K, Kawa M, Miyashita M, Niiro K, Kusukawa R, et al. Effects of an off-site walking program on energy expenditure, serum lipids, and glucose metabolism in middle-aged women. Biological Research for Nursing 2003;4(3):181-92. [DOI] [PubMed] [Google Scholar]
Gell 2015 {published data only}
- Gell NM, Wadsworth DD. The use of text messaging to promote physical activity in working women: a randomized controlled trial. Journal of Physical Activity & Health 2015;12(6):756-63. [DOI] [PMC free article] [PubMed] [Google Scholar]
Gilson 2007 {published data only}
- Gilson N, McKenna J, Cooke C, Brown W. Walking towards health in a university community: a feasibility study. Preventive Medicine 2007;44(2):167-9. [DOI] [PubMed] [Google Scholar]
Gilson 2008 {published data only}
- Gilson N, McKenna J, Cooke C. Experiences of route and task-based walking in a university community: qualitative perspectives in a randomized control trial. Journal of Physical Activity and Health 2008;5 Suppl 1:176-82. [DOI] [PubMed] [Google Scholar]
Härmä 1988a {published data only}
- Härmä MI, Ilmarinen J, Knauth P, Rutenfranz J, Hänninen O. Physical training intervention in female shift workers: I. The effects of intervention on fitness, fatigue, sleep, and psychosomatic symptoms. Ergonomics 1988;31(1):39-50. [DOI] [PubMed] [Google Scholar]
Härmä 1988b {published data only}
- Härmä MI, Ilmarinen J, Knauth P, Rutenfranz J, Hänninen O. Physical training intervention in female shift workers: II. The effects of intervention on the circadian rhythms of alertness, short-term memory, and body temperature. Ergonomics 1988;31(1):51-63. [DOI] [PubMed] [Google Scholar]
Hultquist 2005 {published data only}
- Hultquist CN, Albright C, Thompson DL. Comparison of walking recommendations in previously inactive women. Medicine and Science in Sports and Exercise 2005;37(4):676-83. [DOI] [PubMed] [Google Scholar]
Hunter 2012 {published data only}
- Hunter GR, Fisher G, Bryan DR, Zuckerman PA. Weight loss and exercise training effect on oxygen uptake and heart rate response to locomotion. Journal of Strength & Conditioning Research 2012;26(5):1366-73. [DOI] [PMC free article] [PubMed] [Google Scholar]
Hunter 2012a {published data only}
- Hunter R, Tully M, Davis M, Stevenson M, Kee F. The 'Physical Activity Loyalty Card Scheme': an RCT investigating the use of incentives to encourage physical activity. Journal of Science and Medicine in Sport 2012;15(Suppl 1):S347-8. [Google Scholar]
Iwane 2000 {published data only}
- Iwane M, Arita M, Tomimoto S, Satani O, Matsumoto M, Miyashita K, et al. Walking 10,000 steps/day or more reduces blood pressure and sympathetic nerve activity in mild essential hypertension. Hypertension Research 2000;23(6):573-80. [DOI] [PubMed] [Google Scholar]
Johannesson 2010 {published data only}
- Johannesson M, Ostling R, Ranehill E. The effect of competition on physical activity: a randomized trial. B.E. Journal of Economic Analysis & Policy 2010;10(1):Article 91. [Google Scholar]
Kazi 2012 {published data only}
- Clemes S. Personal correspondence. 6 May 2016.
- Kazi A, Haslam C, Duncan M, Clemes S, Kerr L, Twumasi R. Physical activity interventions to promote employee health and wellbeing: a stage of change approach. Journal of Science and Medicine in Sport 2012;15 Suppl 1:S234. [Google Scholar]
Kennedy 2007 {published data only}
- Kennedy RA, Boreham CAG, Murphy MH, Young IS, Mutrie N. Evaluating the effects of a low volume stairclimbing programme on measures of health-related fitness in sedentary office workers. Journal of Sports Science and Medicine 2007;6(4):448-54. [PMC free article] [PubMed] [Google Scholar]
Kim 2013 {published data only}
- Kim BH, Glanz K. Text messaging to motivate walking in older African Americans: a randomized controlled trial. American Journal of Preventive Medicine 2013;44(1):71-5. [DOI] [PubMed] [Google Scholar]
Lara 2016 {published data only}
- Lara J, O'Brien N, Godfrey A, Heaven B, Evans EH, Lloyd S, et al. Pilot randomised controlled trial of a web-based intervention to promote healthy eating, physical activity and meaningful social connections compared with usual care control in people of retirement age recruited from workplaces. PLoS One 2016;11(7):e0159703. [DOI] [PMC free article] [PubMed] [Google Scholar]
Lee 1997 {published data only}
- Lee C, White SW. Controlled trial of a minimal-intervention exercise program for middle-aged working women. Psychology and Health 1997;12(3):361-74. [Google Scholar]
Leibiger 2012 {published data only}
- Leibiger A, Weisser B, Grunhagen M, Kohler M. Effect of a measure for workplace health promotion with the use of pedometers to reduce cardiovascular risk factors (pedometer study "DAMP plus 3000!") [Einfluss einer Maßnahme zur betrieblichenGesundheitsförderung mit Einsatz von Schritt-zählern zur Senkung kardiovaskulärer Risikofaktoren (Schrittzählerstudie „DAMP plus 3000!“)]. Journal für Hypertonie 2012;16(4):12-7. [Google Scholar]
Mackey 2011 {published data only}
- Mackey MG, Bohle P, Taylor P, Di Biase T, McLoughlin C, Purnell K. Walking to wellness in an ageing sedentary university community: design, method and protocol. Contemporary Clinical Trials 2011;32(2):273-9. [DOI] [PubMed] [Google Scholar]
Martin 2013 {published data only}
- Martin S, Stichert M, Fischer G, Boschem E, Konner J, Kempf K. Telemedical coaching for weight loss: a randomized controlled trial. Diabetes 2013;62:A2. [DOI] [PMC free article] [PubMed] [Google Scholar]
- Martin S. Personal communication with M Hill. 20 Feburary 2015.
- NCT01837134. Telemedical coaching for weight loss (Fit). ClinicalTrials.gov/show/NCT01837134. 2014.
- NCT01868763. TeleLifestyle coaching for weight loss (FitMeFit). ClinicalTrials.gov/show/NCT01868763. 2013. [Google Scholar]
Miller 2015 {published data only}
- Miller CK, Weinhold K, Marrero DG, Nagaraja HN, Focht BC. A translational worksite diabetes prevention trial improves psychosocial status, dietary intake, and step counts among employees with prediabetes: a randomized controlled trial. Preventive Medicine Reports 2015;2:118-26. [DOI] [PMC free article] [PubMed] [Google Scholar]
Molde 2003 {published data only}
- Molde Hagen E, Grasdal A, Eriksen HR. Does early intervention with a light mobilization program reduce long-term sick leave for low back pain: a 3-year follow-up study. Spine 2003;28(20):2309-15; discussion 16. [DOI] [PubMed] [Google Scholar]
Moreau 2001 {published data only}
- Moreau KL, Degarmo R, Langley J, McMahon C, Howley ET, Bassett DR Jr, et al. Increasing daily walking lowers blood pressure in postmenopausal women. Medicine and Science in Sports and Exercise 2001;33(11):1825-31. [DOI] [PubMed] [Google Scholar]
Motl 2005 {published data only}
- Motl RW, Konopack JF, McAuley E, Elavsky S, Jerome GJ, Marquez DX. Depressive symptoms among older adults: long-term reduction after a physical activity intervention. Journal of Behavioral Medicine 2005;28(4):385-94. [DOI] [PubMed] [Google Scholar]
Murphy 2006 {published data only}
- Murphy MH, Murtagh EM, Boreham CA, Hare LG, Nevill AM. The effect of a worksite based walking programme on cardiovascular risk in previously sedentary civil servants [NCT00284479]. BMC Public Health 2006;6:136. [DOI] [PMC free article] [PubMed] [Google Scholar]
Mutrie 2002 {published data only}
- Mutrie N, Carney C, Blamey A, Crawford F, Aitchison T, Whitelaw A. "Walk in to Work Out": a randomised controlled trial of a self help intervention to promote active commuting. Journal of Epidemiology & Community Health 2002;56(6):407-12. [DOI] [PMC free article] [PubMed] [Google Scholar]
Naito 2008 {published data only}
- Naito M, Nakayama T, Okamura T, Miura K, Yanagita M, Fujieda Y, et al. Effect of a 4-year workplace-based physical activity intervention program on the blood lipid profiles of participating employees: the high-risk and population strategy for occupational health promotion (HIPOP-OHP) study. Atherosclerosis 2008;197(2):784-90. [DOI] [PubMed] [Google Scholar]
Oja 1991 {published data only}
- Oja P, Manttari A, Heinonen A, Kukkonen-Harjula K, Laukkanen R, Pasanen M, et al. Physiological effects of walking and cycling to work. Scandinavian Journal of Medicine and Science in Sports 1991;1(3):151-7. [Google Scholar]
Petersen 2012 {published data only}
- Petersen CB, Severin M, Hansen AW, Curtis T, Gronbaek M, Tolstrup JS. A population-based randomized controlled trial of the effect of combining a pedometer with an intervention toolkit on physical activity among individuals with low levels of physical activity or fitness. Preventive Medicine 2012;54(2):125-30. [DOI] [PubMed] [Google Scholar]
Polzien 2007 {published data only}
- Polzien KM, Jakicic JM, Tate DF, Otto AD. The efficacy of a technology-based system in a short-term behavioral weight loss intervention. Obesity (Silver Spring) 2007;15(4):825-30. [DOI] [PubMed] [Google Scholar]
Prestwich 2012 {published data only}
- Prestwich A, Conner MT, Lawton RJ, Ward JK, Ayres K, McEachan RR. Randomized controlled trial of collaborative implementation intentions targeting working adults' physical activity. Health Psychology 2012;31(4):486-95. [DOI] [PubMed] [Google Scholar]
Puhkala 2011 {published data only}
- Puhkala J, Kukkonen-Harjula K, Aittasalo M, Mansikkamäki K, Partinen M, Hublin C, et al. Lifestyle counseling in overweight truck and bus drivers - Effects on dietary patterns and physical activity. Preventive Medicine Reports 2016;4:435-40. [DOI] [PMC free article] [PubMed] [Google Scholar]
- Puhkala J, Kukkonen-Harjula K, Hublin C, Kärmeniemi P, Mansikkamäki K, Olkkonen S, et al. Lifestyle counselling in promoting obese commercial drivers' health - Design and feasibility of an RCT (NCT00893646). Annals of Nutrition and Metabolism 2011;58(Suppl 3):399-400. [Google Scholar]
- Puhkala J, Kukkonen-Harjula K, Mansikkamäki K, Aittasalo M, Hublin C, Kärmeniemi P, et al. Lifestyle counseling to reduce body weight and cardiometabolic risk factors among truck and bus drivers – A randomized controlled trial. Scandinavian Journal of Work, Environment & Health 2015;41(1):54–64. [DOI] [PubMed] [Google Scholar]
- Puhkala J. Personal communication. 5 March 2015.
Puig‐Ribera 2008 {published data only}
- Puig-Ribera A, McKenna J, Gilson N, Brown WJ. Change in work day step counts, wellbeing and job performance in Catalan university employees: a randomised controlled trial. Promotion & Education 2008;15(4):11-6. [DOI] [PubMed] [Google Scholar]
Serwe 2011 {published data only}
- Serwe KM, Swartz AM, Hart TL, Strath SJ. Effectiveness of long and short bout walking on increasing physical activity in women. Journal of Women's Health 2011;20(2):247-53. [DOI] [PMC free article] [PubMed] [Google Scholar]
Slootmaker 2009 {published data only}
- Slootmaker SM, Chinapaw MJ, Schuit AJ, Seidell JC, Van Mechelen W. Feasibility and effectiveness of online physical activity advice based on a personal activity monitor: randomized controlled trial. Journal of Medical Internet Research 2009;11(3):e27. [DOI] [PMC free article] [PubMed] [Google Scholar]
Speck 2001 {published data only}
- Speck BJ, Looney SW. Effects of a minimal intervention to increase physical activity in women: daily activity records. Nursing Research 2001;50(6):374-8. [DOI] [PubMed] [Google Scholar]
Sternfeld 2009 {published data only}
- Sternfeld B, Block C, Quesenberry CP Jr, Block TJ, Husson G, Norris JC, et al. Improving diet and physical activity with ALIVE: a worksite randomized trial. American Journal of Preventive Medicine 2009;36(6):475-83. [DOI] [PubMed] [Google Scholar]
Terry 2010 {published data only}
- Terry PE, Fowles JB, Harvey L. Employee engagement factors that effect enrollment compared with retention in two coaching programs-the ACTIVATE study. Population Health Management 2010;13(3):115-22. [DOI] [PubMed] [Google Scholar]
Thorndike 2012 {published data only}
- Thorndike AN, Mills S, Sonnenberg L, Regan S. Using an activity monitor to motivate physical activity among healthy employees: a randomized controlled trial. Circulation 2012;125(10):AP145. [Google Scholar]
Thøgersen‐Ntoumani 2010 {published and unpublished data}
- Thøgersen-Ntoumani C, Loughren EA, Duda JL, Fox KR, Kinnafick F-E. “Step by Step”. A feasibility study of a lunchtime walking intervention designed to increase walking, improve mental well-being and work performance in sedentary employees:Rationale and study design. BMC Public Health 2012;10:578. [DOI] [PMC free article] [PubMed] [Google Scholar]
- Thøgersen-Ntoumani C. Personal communication. 4 March 2015.
Torstensen 1998 {published data only}
- Torstensen TA, Ljunggren AE, Meen HD, Odland E, Mowinckel P, Geijerstam S. Efficiency and costs of medical exercise therapy, conventional physiotherapy, and self-exercise in patients with chronic low back pain: a pragmatic, randomized, single-blinded, controlled trial with 1-year follow-up. Spine 1998;23(23):2616-24. [DOI] [PubMed] [Google Scholar]
Tucker 2011 {published data only}
- Tucker SJ, Lanningham-Foster LM, Murphy JN, Thompson WG, Weymiller AJ, Lohse C, et al. Effects of a worksite physical activity intervention for hospital nurses who are working mothers. AAOHN Journal 2011;59(9):377-86. [DOI] [PubMed] [Google Scholar]
Tudor‐Locke 2004a {published data only}
- Tudor-Locke C, Bell RC, Myers AM, Harris SB, Ecclestone NA, Lauzon N, et al. Controlled outcome evaluation of the First Step Program: a daily physical activity intervention for individuals with type II diabetes. International Journal of Obesity and Related Metabolic Disorders 2004;28(1):113-9. [DOI] [PubMed] [Google Scholar]
Van Berkel 2011 {published data only}
- Van Berkel J, Proper KI, Boot CR, Bongers PM, Van der Beek AJ. Mindful "Vitality in Practice": an intervention to improve the work engagement and energy balance among workers; the development and design of the randomised controlled trial. BMC Public Health 2011;11:736. [DOI] [PMC free article] [PubMed] [Google Scholar]
Vincent 2009 {published data only}
- Vincent D. Culturally tailored education to promote lifestyle change in Mexican Americans with type 2 diabetes. Journal of the American Academy of Nurse Practitioners 2009;21(9):520-7. [DOI] [PubMed] [Google Scholar]
Wing 1996 {published data only}
- Wing RR, Jeffery RW, Pronk N, Hellerstedt WL. Effects of a personal trainer and financial incentives on exercise adherence in overweight women in a behavioral weight loss program. Obesity Research 1996;4(5):457-62. [DOI] [PubMed] [Google Scholar]
References to studies awaiting assessment
Audrey 2019 {published data only}
- *.Audrey S, Fisher H, Cooper A, Gaunt D, Garfield K, Metcalfe C, et al. Evaluation of an intervention to promote walking during the commute to work: a cluster randomised controlled trial. BMC Public Health 2019;19:427. [DOI] [PMC free article] [PubMed] [Google Scholar]
- Audrey S, Cooper AR, Hollingworth W, Metcalfe C, Procter S, Davis A, et al. Study protocol: the effectiveness and cost effectiveness of an employer-led intervention to increase walking during the daily commute: the Travel to Work randomised controlled trial. BMC Public Health 2015;15:154. [DOI] [PMC free article] [PubMed] [Google Scholar]
- Gaunt D, Metcalfe C, Garfield K, Hollingworth W, Batista Ferrer H, Cooper A, et al. Travel to Work: Statistical and Health Economics Analysis Plan. University of Bristol, 2017.
Bang 2016 {published data only}
- *.Bang KS, Lee IS, Kim SJ, Song MK, Park SE. The effects of urban forest-walking program on health promotion behavior, physical health, depression, and quality of life: a randomized controlled trial of office-workers. Journal of Korean Academy of Nursing 2016;46(1):140-8. [DOI] [PubMed] [Google Scholar]
Mattila 2013 {published data only}
- Mattila E, Orsama AL, Ahtinen A, Hopsu L, Leino T, Korhonen I. Personal health technologies in employee health promotion: usage activity, usefulness, and health-related outcomes in a 1-year randomized controlled trial. JMIR Mhealth Uhealth 2013;1(2):e16. [DOI] [PMC free article] [PubMed] [Google Scholar]
- Mattila E. Personal communication with RFP. 17 August 2016.
References to ongoing studies
ACTRN12617001395325 {published data only}
- *.ACTRN12617001395325. Activity for wellbeing: promoting wellbeing through physical activity in aged care workers [Activity for wellbeing: a randomised, controlled trial of a need-supportive, person-centred physical activity intervention for aged care workers]. apps.who.int/trialsearch/Trial2.aspx?TrialID=ACTRN12617001395325 (first received 3 October 2017).
ACTRN12618001567213 {published data only}
- *.ACTRN12618001567213. A physical activity and healthy eating program to enhance school staff health [Addressing the health risk behaviours of the education workforce: a program to enhance the wellbeing of primary school staff]. apps.who.int/trialsearch/Trial2.aspx?TrialID=ACTRN12618001567213 (first received 19 September 2018).
ACTRN12619000173190 {published data only}
- *.ACTRN12619000173190. The Virgin PulsE Global ChAllenge Study (VEGAS): a single-blind, randomised controlled trial to evaluate the health outcomes of the Virgin Pulse Global Challenge (VPGC) Programme on quality of life among healthy employees. apps.who.int/trialsearch/Trial2.aspx?TrialID=ACTRN12619000173190 (first received 6 February 2019). [Google Scholar]
Aittasalo 2017 {published data only}
- *.Aittasalo M, Tiilikainen J, Tokola K, Seimela T, Sarjala S-M, Metsapuro P, et al. Socio-ecological intervention to promote active commuting to work: protocol and baseline findings of a cluster randomized controlled trial in Finland. International Journal of Environmental Research and Public Health 2017;14(10):1257. [DOI] [PMC free article] [PubMed] [Google Scholar]
Pillay 2012 {published data only}
- Pillay JD, Kolbe-Alexander T, Proper KI, Mechelen W, Lambert EV. Steps that count! The development of a pedometer-based health promotion intervention in an employed, health insured South African population. BMC Public Health 2012;12(1):880. [DOI] [PMC free article] [PubMed] [Google Scholar]
Additional references
AIHW 2008
- Australian Institute of Health and Welfare (AIHW). Australia’s Health 2008. Vol. Cat. no. AUS 99. Canberra: AIHW, 2008. [Google Scholar]
Ainsworth 2000
- Ainsworth BE, Haskell WL, Whitt MC, Irwin ML, Swartz AM, Strath SJ, et al. Compendium of physical activities: an update of activity codes and MET intensities. Medicine and Science in Sports and Exercise 2000;32:S498–S516. [DOI] [PubMed] [Google Scholar]
Baker 2011
- Baker PRA, Francis DP, Soares J, Weightman AL, Foster C. Community wide interventions for increasing physical activity. Cochrane Database of Systematic Reviews 2011, Issue 4. Art. No: CD008366. [DOI: 10.1002/14651858.CD008366] [DOI] [PubMed] [Google Scholar]
Baker 2015
- Baker PRA, Francis DP, Soares J, Weightman AL, Foster C. Community wide interventions for increasing physical activity. Cochrane Database of Systematic Reviews 2015, Issue 1. Art. No: CD008366. [DOI: 10.1002/14651858.CD008366.pub3] [DOI] [PMC free article] [PubMed] [Google Scholar]
Baker IDI Heart and Diabetes Institute 2008
- Baker IDI Heart and Diabetes Institute, on behalf of the Australian State and Territory Governments, as part of the COAG Initiative to Reduce the Risk of Type 2 Diabetes. The Australian Type 2 Diabetes Risk Assessment Tool (AUSDRISK). Department of Health and Ageing, Australian Government, 2008. [Google Scholar]
Bandura 2001
- Bandura A. Social cognitive theory: an agentive perspective. Annual Review of Psychology 2001;52:1–26. [DOI] [PubMed] [Google Scholar]
Batt 2009
- Batt ME. Physical activity interventions in the workplace: the rationale and future direction for workplace wellness. British Journal of Sports Medicine 2009;43:47-8. [DOI] [PubMed] [Google Scholar]
Behrens 2007
- Behrens TK, Domina L, Fletcher GM. Evaluation of an employer-sponsored pedometer-based physical activity program. Perceptual and Motor Skills 2007;105(3 Pt 1):968-76. [DOI] [PubMed] [Google Scholar]
Bravata 2007
- Bravata DM, Smith-Spangler C, Sundaram V, Gienger AL, Lin N, Lewis R, et al. Using pedometers to increase physical activity and improve health: a systematic review. JAMA 2007;298:2296-304. [DOI] [PubMed] [Google Scholar]
Brownson 2005
- Brownson RC, Boehmer TK, Luke DA. Declining rates of physical activity in the United States: what are the contributors? Annual Review of Public Health 2005;26:421-43. [DOI] [PubMed] [Google Scholar]
Campbell 2004
- Campbell MK, Elbourne DR, Altman DG. CONSORT statement: extension to cluster randomised trials. British Medical Journal 2004;328:702–8. [DOI] [PMC free article] [PubMed] [Google Scholar]
Carlin 1999
- Carlin JB, Hocking J. Design of cross-sectional surveys using cluster sampling: an overview with Australian case studies. Australian and New Zealand Journal of Public Health 1999;23:546–51. [DOI] [PubMed] [Google Scholar]
Chan 2004
- Chan CB, Ryan DA, Tudor-Locke C. Health benefits of a pedometer-based physical activity intervention in sedentary workers. Preventive Medicine 2004;39(6):1215-22. [DOI] [PubMed] [Google Scholar]
Commissaris 2016
- Commissaris DA, Huysmans MA, Mathiassen SE, Srinivasan D, Koppes LLj, Hendriksen IJ. Interventions to reduce sedentary behavior and increase physical activity during productive work: a systematic review. Scandinavian Journal of Work, Environment & Health 2016;42(3):181-91. [DOI] [PubMed] [Google Scholar]
Croteau 2004
- Croteau KA. Strategies used to increase lifestyle physical activity in a pedometer-based intervention. Journal of Allied Health 2004;33(4):278-81. [PubMed] [Google Scholar]
Culos‐Reed 2001
- Culos-Reed C, Gyurcsik NC, Brawley LR. Using theories of motivated behaviour to understand physical activity. In: Singer RN, Hausenblas HA, Janelle CM, editors(s). Handbook of Sport Psychology. New York: John Wiley & Sons, Inc, 2001:695-717. [Google Scholar]
D'Agostino 2008
- D'Agostino RB, Vasan RS, Pencina MJ, Wolf PA, Cobain M, Massaro JM, et al. General cardiovascular risk profile for use in primary care: the Framingham Heart Study. Circulation 2008;117:743-53. [DOI] [PubMed] [Google Scholar]
De Cocker 2010
- De Cocker KA, De Bourdeaudhuij IM, Cardon GM. The effect of a multi-strategy workplace physical activity intervention promoting pedometer use and step count increase. Health Education Research 2010;25(4):608-19. [DOI] [PubMed] [Google Scholar]
Deeks 2011
- Deeks JJ, Higgins JPT, Altman DG (editors). Chapter 9. Analysing data and undertaking meta-analyses. In: Higgins JPT, Green S, editors(s). Cochrane Handbook for Systematic Reviews of Interventions Version 5.1.0 (updated March 2011). The Cochrane Collaboration, 2011. Available from http://training.cochrane.org/handbook. [Google Scholar]
Diener 1985
- Diener E, Emmons RA, Larsen RJ, Griffin S. The Satisfaction With Life Scale. Journal of Personality Assessment 1985;49(1):71-5. [DOI] [PubMed] [Google Scholar]
Dobbins 2013
- Dobbins M, Husson H, De Corby K, LaRocca RL. School-based physical activity programs for promoting physical activity and fitness in children and adolescents aged 6 to 18. Cochrane Database of Systematic Reviews 2013, Issue 2. Art. No: CD007651. [DOI: 10.1002/14651858.CD007651.pub2] [DOI] [PMC free article] [PubMed] [Google Scholar]
Dunkel‐Schetter 1986
- Dunkel-Schetter C, Feinstein L, Call J. UCLA Social Support Inventory. http://health.psych.ucla.edu/cds/files/UCLA%20SSI%201986.doc. 1986 (accessed 12 May 2011).
Egger 1998
- Egger M, Smith GD. Bias in location and selection of studies. BMJ 1998;316(7124):61-6. [DOI] [PMC free article] [PubMed] [Google Scholar]
Faghri 2008
- Faghri PD, Omokaro C, Parker C, Nichols E, Gustavesen S, Blozie E. E-technology and pedometer walking program to increase physical activity at work. Journal of Primary Prevention 2008;29(1):73-91. [DOI] [PubMed] [Google Scholar]
Farag 2010
- Farag NH, Moore WE, Thompson DE, Kobza CE, Abbott K, Eichner JE. Evaluation of a community-based participatory physical activity promotion project: effect on cardiovascular disease risk profiles of school employees. BMC Public Health 2010;10(1):313. [DOI] [PMC free article] [PubMed] [Google Scholar]
Ferro‐Luzzi 1996
Food and Agricultural Organization of the UN 2006
- Food and Agricultural Organization of the UN. The double burden of malnutrition. Case studies from six developing countries. Rome: FAO, 2006 http://www.fao.org/docrep/009/a0442e/a0442e06.htm (accessed 20 February 2013). [PubMed] [Google Scholar]
Foster 2013
- Foster C, Richards J, Thorogood M, Hillsdon M. Remote and web 2.0 interventions for promoting physical activity. Cochrane Database of Systematic Reviews 2013, Issue 9. Art. No.: CD010395. Art. No: CD010395. [DOI: 10.1002/14651858.CD010395.pub2] [DOI] [PMC free article] [PubMed] [Google Scholar]
Freak‐Poli 2010
- Freak-Poli R, Wolfe R, Peeters A. Risk of cardiovascular disease and diabetes in a working population with sedentary occupations. Journal of Occupational and Environmental Medicine 2010;52:1132-7. [DOI] [PubMed] [Google Scholar]
Freak‐Poli 2011a
- Freak-Poli R, Wolfe R, Backholer K, Courten M, Peeters A. Impact of a pedometer-based workplace health program on cardiovascular and diabetes risk profile. Preventive Medicine 2011;53:162-71. [DOI] [PubMed] [Google Scholar]
Freak‐Poli 2012
- Freak-Poli R, Peeters A. The contribution of workplace characteristics to the risk of type 2 diabetes. Current Medical Literature – Diabetes 2012;29(3):65-76. http://www.remedicajournals.com/CML-Diabetes/BrowseIssues/Volume-29-Issue-63/Article-The-Contribution-of-WC-to-the-Risk-of-T62D. [Google Scholar]
Freak‐Poli 2013a
- Freak-Poli R, Wolfe R, Brand M, Courten M, Peeters A. Eight-month postprogram completion: change in risk factors for chronic disease amongst participants in a 4-month pedometer-based workplace health program. Obesity (Silver Spring) 2013;21(9):E360-8. [DOI] [PubMed] [Google Scholar]
Friedrich 2008
- Friedrich JO, Adhikari NKJ, Beyene J. The ratio of means method as an alternative to mean differences for analyzing continuous outcome variables in meta-analysis: a simulation study. BMC Medical Research Methodology 2008;8:32. [DOI: 10.1186/1471-2288-8-32] [DOI] [PMC free article] [PubMed] [Google Scholar]
GCC 2010
- Global Corporate Challenge (GCC). Global Corporate Challenge: at a glance. Available at http://www.gettheworldmoving.com (accessed 14 April 2010).
Gemson 2008
- Gemson DH, Commisso R, Fuente J, Newman J, Benson S. Promoting weight loss and blood pressure control at work: impact of an education and intervention program. Journal of Occupational and Environmental Medicine 2008;50(3):272-81. [DOI] [PubMed] [Google Scholar]
Godin 1985
- Godin G, Shepard RJ. A simple method to assess exercise behaviour in the community. Canadian Journal of Applied Sport Sciences. Journal Canadien des Sciences Appliquées Au Sport 1985;10:141–6. [PubMed] [Google Scholar]
Goetzel 2009
- Goetzel RZ, Baker KM, Short ME, Pei X, Ozminkowski RJ, Wang S, et al. First-year results of an obesity prevention program at the Dow Chemical Company. Journal of Occupational and Environmental Medicine 2009;51(2):125-38. [DOI] [PMC free article] [PubMed] [Google Scholar]
Goetzel 2010
- Goetzel RZ, Roemer EC, Pei X, Short ME, Tabrizi MJ, Wilson MG, et al. Second-year results of an obesity prevention program at the Dow Chemical Company. Journal of Occupational and Environmental Medicine 2010;52(3):291-302. [DOI] [PMC free article] [PubMed] [Google Scholar]
Haines 2007
- Haines DJ, Davis L, Rancour P, Robinson M, Neel-Wilson T, Wagner S. A pilot intervention to promote walking and wellness and to improve the health of college faculty and staff. Journal of American College Health 2007;55(4):219-25. [DOI] [PubMed] [Google Scholar]
Higgins 2003
- Higgins JP, Thompson SG, Deeks JJ, Altman DG. Measuring inconsistency in meta-analyses. BMJ 2003;327(7414):557-60. [DOI] [PMC free article] [PubMed] [Google Scholar]
Higgins 2011a
- Higgins JPT, Deeks JJ (editors). Chapter 7. Selecting studies and collecting data. In: Higgins JPT, Green S, editors(s). Cochrane Handbook for Systematic Reviews of Interventions Version 5.1.0 (updated March 2011). The Cochrane Collaboration, 2011. Available from http://training.cochrane.org/handbook. [Google Scholar]
Higgins 2011b
- Higgins JPT, Altman DG, Sterne JAC (editors). Chapter 8. Assessing risk of bias in included studies. In: Higgins JPT, Green S, editors(s). Cochrane Handbook for Systematic Reviews of Interventions Version 5.1.0 (updated March 2011). The Cochrane Collaboration, 2011. Available from http://training.cochrane.org/handbook. [Google Scholar]
Higgins 2011c
- Higgins JPT, Deeks JJ, Altman DG (editors). Chapter 16. Special topics in statistics. In: Higgins JPT, Green S, editors(s). Cochrane Handbook for Systematic Reviews of Interventions Version 5.1.0 (updated March 2011). The Cochrane Collaboration, 2011. Available from http://training.cochrane.org/handbook. [Google Scholar]
Igarashi 2018
- Igarashi Y, Akazawa N, Maeda S. The required step count for a reduction in blood pressure: a systematic review and meta-analysis. Journal of Human Hypertension 2018;32(12):814-24. [DOI] [PubMed] [Google Scholar]
IPAQ 2011
- International Physical Activity Questionnaire (IPAQ). Available at http://www.ipaq.ki.se/ipaq.htm (accessed 29 April 2011).
Jahangiry 2017
- Jahangiry L, Farhangi MA, Shab-Bidar S, Rezaei F, Pashaei T. Web-based physical activity interventions: a systematic review and meta-analysis of randomized controlled trials. Public Health 2017;152:36-46. [DOI] [PubMed] [Google Scholar]
Kang 2009
- Kang M, Marshall SJ, Barreira TV, Lee JO. Effect of pedometer-based physical activity interventions: a meta-analysis. Research Quarterly for Exercise & Sport 2009;80:648-55. [DOI] [PubMed] [Google Scholar]
Kwak 2010
- Kwak L, Kremers SP, Candel MJ, Visscher TL, Brug J, Van Baak MA. Changes in skinfold thickness and waist circumference after 12 and 24 months resulting from the NHF-NRG In Balance-project. International Journal of Behavioral Nutrition and Physical Activity 2010;7:26. [DOI] [PMC free article] [PubMed] [Google Scholar]
Lemon 2010
- Lemon SC, Zapka J, Li W, Estabrook B, Rosal M, Magner R, et al. Step Ahead: a worksite obesity prevention trial among hospital employees. American Journal of Preventive Medicine 2010;38(1):27-38. [DOI] [PMC free article] [PubMed] [Google Scholar]
Lim 2014
- Lim SS, Vos T, Flaxman AD, Danaei G, Shibuya K, Adair-Rohani H, et al. A comparative risk assessment of burden of disease and injury attributable to 67 risk factors and risk factor clusters in 21 regions, 1990–2010: a systematic analysis for the Global Burden of Disease Study 2010. Lancet 2012;380(9859):2224-60. doi: 10.1016/S0140-6736(12)61766-8. [DOI] [PMC free article] [PubMed] [Google Scholar]
Low 2007
- Low D, Gramlich M, Engram BW. Self-paced exercise program for office workers: impact on productivity and health outcomes. American Association of Occupational Health Nurses Journal 2007;55(3):99-105. [DOI] [PubMed] [Google Scholar]
Lubans 2009
- Lubans DR, Morgan PJ, Collins CE, Warren JM, Callister R. Exploring the mechanisms of weight loss in the SHED-IT intervention for overweight men: a mediation analysis. International Journal of Behavioral Nutrition and Physical Activity 2009;18(6):76. [DOI] [PMC free article] [PubMed] [Google Scholar]
Malik 2014
- Malik SH, Blake H, Suggs LS. A systematic review of workplace health promotion interventions for increasing physical activity. British Journal of Health Psychology 2014;19(1):149-80. [DOI] [PubMed] [Google Scholar]
Marshall 2004
- Marshall AL. Challenges and opportunities for promoting physical activity in the workplace. Journal of Science and Medicine in Sport 2004;7(Suppl 1):60-6. [DOI] [PubMed] [Google Scholar]
Matevey 2006
- Matevey C, Rogers L, Dawson E, Tudor-Locke C. Lack of reactivity during pedometer self-monitoring in adults. Measurement in Physical Education and Exercise Science 2006;10:1-11. [Google Scholar]
Norman 2003
- Norman A, Bellocco R, Vaida F, Wolk A. Age and temporal trends of total physical activity in Swedish men. Medicine & Science in Sports & Exercise 2003;35:617-22. [DOI] [PubMed] [Google Scholar]
Ogilvie 2007
- Ogilvie D, Foster CE, Rothnie H, Cavill N, Hamilton V, Fitzsimons CF, et al. Interventions to promote walking: systematic review. BMJ 2007;334:1204. [DOI] [PMC free article] [PubMed] [Google Scholar]
Prabhakaran 2009
- Prabhakaran D, Jeemon P, Goenka S, Lakshmy R, Thankappan KR, Ahmed F, et al. Impact of a worksite intervention program on cardiovascular risk factors: a demonstration project in an Indian industrial population. Journal of the American College of Cardiology 2009;53(18):1718-28. [DOI] [PubMed] [Google Scholar]
Prodaniuk 2004
- Prodaniuk TR, Plotnikoff RC, Spence JC, Wilson PM. The influence of self-efficacy and outcome expectations on the relationship between perceived environment and physical activity in the workplace. International Journal of Behavioral Nutrition and Physical Activity 2004;15(1):7. [DOI] [PMC free article] [PubMed] [Google Scholar]
Racette 2009
- Racette SB, Deusinger SS, Inman CL, Burlis TL, Highstein GR, Buskirk TD, et al. Worksite Opportunities for Wellness (WOW): effects on cardiovascular disease risk factors after 1 year. Preventive Medicine 2009;49(2-3):108-14. [DOI] [PMC free article] [PubMed] [Google Scholar]
Reed 2017
- Reed JL, Prince SA, Elliott CG, Mullen KA, Tulloch HE, Hiremath S, et al. Impact of workplace physical activity interventions on physical activity and cardiometabolic health among working-age women: a systematic review and meta-analysis. Circulation: Cardiovascular Quality and Outcomes 2017;10(2):e003516. [DOI] [PubMed] [Google Scholar]
RevMan 2011 [Computer program]
- Review Manager (RevMan). Version 5.1. Copenhagen: The Nordic Cochrane Centre, The Cochrane Collaboration, 2011.
Richardson 2008
- Richardson CR, Newton TL, Abraham JJ, Sen A, Jimbo M, Swartz AM. A meta-analysis of pedometer-based walking interventions and weight loss. Annals of Family Medicine 2008;6:69-77. [DOI] [PMC free article] [PubMed] [Google Scholar]
Rongen 2013
- Rongen A, Robroek SJ, Lenthe FJ, Burdorf A. Workplace health promotion: a meta-analysis of effectiveness. American Journal of Preventive Medicine 2013;44(4):406-15. [DOI] [PubMed] [Google Scholar]
Rush 2009
- Rush EC, Cumin MB, Migriauli L, Ferguson LR, Plank LD. One year sustainability of risk factor change from a 9-week workplace intervention. Journal of Environmental and Public Health 2009;2009:569104. [DOI: 10.1155/2009/569104] [DOI] [PMC free article] [PubMed]
Ryan 2016
- Ryan R, Synnot A, Hill S. Describing results. Melbourne: Cochrane Consumers and Communication, La Trobe University, 1 December 2016. Available at http://cccrg.cochrane.org/author-resources (accessed 28 August 2018). [Google Scholar]
Sallis 1985
- Sallis JF, Haskell WF, Wood PD, Fortmann SP, Rogers T, Blair SN, et al. Physical activity assessment methodology in the Stanford Five-City Project. American Journal of Epidemiology 1985;121:91-106. [DOI] [PubMed] [Google Scholar]
Schünemann 2011
- Schünemann HJ, Oxman AD, Vist GE, Higgins JPT, Deeks JJ, Glasziou P, et al. Chapter 12. Interpreting results and drawing conclusions. In: Higgins JPT, Green S, editors(s). Cochrane Handbook for Systematic Reviews of Interventions Version 5.1.0 (updated March 2011). The Cochrane Collaboration, 2011. Available from http://training.cochrane.org/handbook. [Google Scholar]
SF‐36 2011
- SF-36.org: a community for measuring health outcomes using SF tools. Website: www.sf-36.org (accessed 12 May 2011).
Speck 2009
- Speck RM, Hill RK, Pronk NP, Becker MP, Schmitz KH. Assessment and outcomes of HealthPartners 10,000 Steps® program in an academic work site. Health Promotion Practice 2009;11:741-50. [DOI] [PubMed] [Google Scholar]
StataCorp 2015
- StataCorp. Stata(R) 15.1 Statistics/Data Analysis Special Edition. Texas, USA: StataCorp, 2017. [Google Scholar]
Thomas 2006
- Thomas L, Williams M. Promoting physical activity in the workplace: using pedometers to increase daily activity levels. Health Promotion Journal of Australia 2006;17(2):97-102. [DOI] [PubMed] [Google Scholar]
To 2013
- To QG, Chen TT, Magnussen CG, To KG. Workplace physical activity interventions: a systematic review. American Journal of Health Promotion 2013;27(6):e113-23. [DOI] [PubMed] [Google Scholar]
Tudor‐Locke 2002
- Tudor-Locke C. Taking steps toward increased physical activity: using pedometers to measure and motivate. President's Council on Physical Fitness and Sports Research Digest, Washington, DC. 2002;3(17):http://www.fitness.gov/pcpfsdigestjune2002.pdf. [Google Scholar]
Tudor‐Locke 2004b
- Tudor-Locke C, Bassett DR Jr. How many steps/day are enough? Preliminary pedometer indices for public health. Sports Medicine 2004;34(1):1-8. [DOI] [PubMed] [Google Scholar]
Tudor‐Locke 2009
- Tudor-Locke C. Promoting lifestyle physical activity: experiences with the FirstStep program. American Journal of Lifestyle Medicine 2009;1(3 Suppl 1):508-48. [DOI] [PMC free article] [PubMed] [Google Scholar]
Verweij 2011
- Verweij LM, Coffeng J, Mechelen W, Proper KI. Meta-analyses of workplace physical activity and dietary behaviour interventions on weight outcomes. Obesity Reviews 12;6:406-29. [DOI] [PubMed] [Google Scholar]
Warren 2010
- Warren BS, Maley M, Sugarwala LJ, Wells MT, Devine CM. Small steps are easier together: a goal-based ecological intervention to increase walking by women in rural worksites. Preventive Medicine 2010;50(5-6):230-4. [DOI] [PubMed] [Google Scholar]
Wendel‐Vos 2003
- Wendel-Vos G, Schuit A, Saris W, Kromhout D. Reproducibility and relative validity of the short questionnaire to assess health enhancing physical activity. Journal of Clinical Epidemiology 2003;56:1163-9. [DOI] [PubMed] [Google Scholar]
WHO & WEF 2008
- World Health Organization & World Economic Forum (WHO & WEF). Preventing Noncommunicable Diseases in the Workplace Through Diet and Physical Activity: WHO/World Economic Forum Report of a Joint Event. Geneva: World Health Organization, 2008. [Google Scholar]
WHO 2000
- World Health Organization (WHO). Obesity: Preventing and Managing the Global Epidemic. Geneva: World Health Organization, 2000. [PubMed] [Google Scholar]
WHO 2002
- World Health Organization (WHO). Good Practice in Occupational Health Services: A Contribution to Workplace Health. Copenhagen: WHO, 2002. [Google Scholar]
WHO 2004
- World Health Organization (WHO). Global Strategy on Diet, Physical Activity and Health. Switzerland: WHO, 2004. [Google Scholar]
WHO 2009
- World Health Organization (WHO). Global Health Risks: Mortality and Burden of Disease Attributable to Selected Major Risks. Geneva: WHO Press, 2009. [Google Scholar]
WHO 2010
- World Health Organization (WHO). Physical Inactivity: A Global Public Health Problem. http://www.who.int/dietphysicalactivity/factsheet_inactivity/en/index.htm (accessed December 2010).
WHO 2014
- World Health Organization (WHO). Global Status Report on Noncommunicable Diseases 2014. Geneva, Switzerland: WHO, 2014. [Google Scholar]
References to other published versions of this review
Freak‐Poli 2011
- Freak-Poli RLA, Cumpston M, Peeters A, Clemes SA. Workplace pedometer interventions for increasing physical activity. Cochrane Database of Systematic Reviews 2011, Issue 7. Art. No.: CD009209. DOI: 10.1002/14651858.CD009209. Art. No: CD009209. [DOI: 10.1002/14651858.CD009209] [DOI] [PMC free article] [PubMed] [Google Scholar]
Freak‐Poli 2013
- Freak-Poli RLA, Cumpston M, Peeters A, Clemes SA. Workplace pedometer interventions for increasing physical activity. Cochrane Database of Systematic Reviews 2013, Issue 4. Art. No.: CD009209. Art. No: CD009209. [DOI: 10.1002/14651858.CD009209.pub2] [DOI] [PubMed] [Google Scholar]