

Abstract
Background
Accumulating evidence suggests an association between prenatal exposure to antiepileptic drugs (AEDs) and increased risk of both physical anomalies and neurodevelopmental impairment. Neurodevelopmental impairment is characterised by either a specific deficit or a constellation of deficits across cognitive, motor and social skills and can be transient or continuous into adulthood. It is of paramount importance that these potential risks are identified, minimised and communicated clearly to women with epilepsy.
Objectives
To assess the effects of prenatal exposure to commonly prescribed AEDs on neurodevelopmental outcomes in the child and to assess the methodological quality of the evidence.
Search methods
We searched the Cochrane Epilepsy Group Specialized Register (May 2014), Cochrane Central Register of Controlled Trials (CENTRAL) in The Cochrane Library (2014, Issue 4), MEDLINE (via Ovid) (1946 to May 2014), EMBASE (May 2014), Pharmline (May 2014) and Reprotox (May 2014). No language restrictions were imposed. Conference abstracts from the last five years were reviewed along with reference lists from the included studies.
Selection criteria
Prospective cohort controlled studies, cohort studies set within pregnancy registers and randomised controlled trials were selected for inclusion. Participants were women with epilepsy taking AED treatment; the two control groups were women without epilepsy and women with epilepsy who were not taking AEDs during pregnancy.
Data collection and analysis
Three authors (RB, JW and JG) independently selected studies for inclusion. Data extraction and risk of bias assessments were completed by five authors (RB, JW, AS, NA, AJM). The primary outcome was global cognitive functioning. Secondary outcomes included deficits in specific cognitive domains or prevalence of neurodevelopmental disorders. Due to substantial variation in study design and outcome reporting only limited data synthesis was possible.
Main results
Twenty‐two prospective cohort studies were included and six registry based studies. Study quality varied. More recent studies tended to be larger and to report individual AED outcomes from blinded assessments, which indicate improved methodological quality.The developmental quotient (DQ) was lower in children exposed to carbamazepine (CBZ) (n = 50) than in children born to women without epilepsy (n = 79); mean difference (MD) of ‐5.58 (95% confidence interval (CI) ‐10.83 to ‐0.34, P = 0.04). The DQ of children exposed to CBZ (n = 163) was also lower compared to children of women with untreated epilepsy (n = 58) (MD ‐7.22, 95% CI ‐12.76 to ‐ 1.67, P = 0.01). Further analysis using a random‐effects model indicated that these results were due to variability within the studies and that there was no significant association with CBZ. The intelligence quotient (IQ) of older children exposed to CBZ (n = 150) was not lower than that of children born to women without epilepsy (n = 552) (MD ‐0.03, 95% CI ‐3.08 to 3.01, P = 0.98). Similarly, children exposed to CBZ (n = 163) were not poorer in terms of IQ in comparison to the children of women with untreated epilepsy (n = 87) (MD 1.84, 95% CI ‐2.13 to 5.80, P = 0.36). The DQ in children exposed to sodium valproate (VPA) (n = 123) was lower than the DQ in children of women with untreated epilepsy (n = 58) (MD ‐8.72, 95% ‐14.31 to ‐3.14, P = 0.002). The IQ of children exposed to VPA (n = 76) was lower than for children born to women without epilepsy (n = 552) (MD ‐8.94, 95% CI ‐11.96 to ‐5.92, P < 0.00001). Children exposed to VPA (n = 89) also had lower IQ than children born to women with untreated epilepsy (n = 87) (MD ‐8.17, 95% CI ‐12.80 to ‐3.55, P = 0.0005).
In terms of drug comparisons, in younger children there was no significant difference in the DQ of children exposed to CBZ (n = 210) versus VPA (n=160) (MD 4.16, 95% CI ‐0.21 to 8.54, P = 0.06). However, the IQ of children exposed to VPA (n = 112) was significantly lower than for those exposed to CBZ (n = 191) (MD 8.69, 95% CI 5.51 to 11.87, P < 0.00001). The IQ of children exposed to CBZ (n = 78) versus lamotrigine (LTG) (n = 84) was not significantly different (MD ‐1.62, 95% CI ‐5.44 to 2.21, P = 0.41). There was no significant difference in the DQ of children exposed to CBZ (n = 172) versus phenytoin (PHT) (n = 87) (MD 3.02, 95% CI ‐2.41 to 8.46, P = 0.28). The IQ abilities of children exposed to CBZ (n = 75) were not different from the abilities of children exposed to PHT (n = 45) (MD ‐3.30, 95% CI ‐7.91 to 1.30, P = 0.16). IQ was significantly lower for children exposed to VPA (n = 74) versus LTG (n = 84) (MD ‐10.80, 95% CI ‐14.42 to ‐7.17, P < 0.00001). DQ was higher in children exposed to PHT (n = 80) versus VPA (n = 108) (MD 7.04, 95% CI 0.44 to 13.65, P = 0.04). Similarly IQ was higher in children exposed to PHT (n = 45) versus VPA (n = 61) (MD 9.25, 95% CI 4.78 to 13.72, P < 0.0001). A dose effect for VPA was reported in six studies, with higher doses (800 to 1000 mg daily or above) associated with a poorer cognitive outcome in the child. We identified no convincing evidence of a dose effect for CBZ, PHT or LTG. Studies not included in the meta‐analysis were reported narratively, the majority of which supported the findings of the meta‐analyses.
Authors' conclusions
The most important finding is the reduction in IQ in the VPA exposed group, which are sufficient to affect education and occupational outcomes in later life. However, for some women VPA is the most effective drug at controlling seizures. Informed treatment decisions require detailed counselling about these risks at treatment initiation and at pre‐conceptual counselling. We have insufficient data about newer AEDs, some of which are commonly prescribed, and further research is required. Most women with epilepsy should continue their medication during pregnancy as uncontrolled seizures also carries a maternal risk.
Keywords: Child, Female, Humans, Pregnancy, Age Factors, Anticonvulsants, Anticonvulsants/adverse effects, Carbamazepine, Carbamazepine/adverse effects, Developmental Disabilities, Developmental Disabilities/chemically induced, Epilepsy, Epilepsy/drug therapy, Intelligence, Intelligence/drug effects, Pregnancy Complications, Pregnancy Complications/drug therapy, Prenatal Exposure Delayed Effects, Prenatal Exposure Delayed Effects/chemically induced, Prospective Studies, Randomized Controlled Trials as Topic, Valproic Acid, Valproic Acid/adverse effects
Plain language summary
Treatment for epilepsy in pregnant women and the development of the child
Background
For most women who have epilepsy it is important for their health that they continue their medication during pregnancy. Over the last 25 years research has shown that children exposed to these medications in the womb can be at a higher risk of having a birth defect or poorer level of development.
Research question
This review aimed to understand whether exposure to antiepileptic drugs (AEDs) during pregnancy is linked to poorer levels of ability for skills such as IQ, language and memory (neurodevelopment).
Characteristics of the studies
The review included 28 studies. Participants were women with epilepsy taking commonly used AEDs who were compared to either women without epilepsy or women who had epilepsy but who were not treated with AEDs. Comparisons were also made between children exposed to different AEDs in the womb. The evidence presented in this review was up to date to May 2014.
Results
‐ The evidence for younger children exposed to carbamazepine (CBZ) in the womb was conflicting, however this was likely to be due to differences in the way that these studies were carried out. In older children those exposed to CBZ were not poorer in their IQ than children who were not exposed. No link was found between the dose of CBZ and child ability.
‐ Both younger and older children exposed in the womb to sodium valproate (VPA) showed poorer cognitive development in comparison to children not exposed and children exposed to other AEDs. A link between dose of VPA and child ability was found in six studies; with higher doses of the drug linked to a lower IQ ability in the child. The level of this difference was likely to increase the risk of poorer educational levels.
‐ Children exposed to CBZ in the womb did not differ in their skills from children exposed to lamotrigine (LTG), however very few studies investigated this. There were also no differences between children exposed to phenytoin (PHT) in the womb and those exposed to CBZ or those exposed to LTG.
‐ There were very limited data on newer medications such as LTG, levetiracetam or topiramate.
Quality of the studies
The quality of how studies were designed varied. The more recently completed studies tended to have higher quality ratings, which suggests more reliable evidence.
Conclusions
This review found that children exposed to VPA in the womb were at an increased risk of poorer neurodevelopment scores both in infancy and when school aged. The majority of evidence indicates that exposure in the womb to CBZ is not associated with poorer neurodevelopment. Data were not available for all AEDs that are in use or for all aspects of child neurodevelopment. This means decision making for women and their doctors is difficult. Further research is needed so that women and their doctors can make decisions based on research evidence about which medication is right for them in their childbearing years.
Background
Description of the condition
Epilepsy is a common disorder affecting up to 1% of the population (Hauser 1990). Approximately one third of people receiving antiepileptic drugs (AEDs) are women of reproductive age (Yerby 1994), and approximately 1 in 250 pregnancies are exposed to AEDs (Lindhout 1992). There is a growing body of evidence reporting an association between prenatal exposure to AEDs and negative physical and neurodevelopmental outcomes in the child (Bromley 2013; NEAD Study; Tomson 2011). However, the latency between widespread use of an AED in women of childbearing age and knowledge of any teratological risk or safety concerns leads to uncertainty about the best course of action for both women and their treating physicians.
Description of the intervention
AEDs are the most common treatment for epilepsy and treatment continuation during pregnancy is a necessity for most women with epilepsy. AEDs readily cross the placenta from the mother into the foetus (Bossi 1982) and are documented to pose different levels of teratogenic risk (Tomson 2011), which are dependent on the agent, its dose, timing of exposure and the genetic influences of both the mother and the foetus (Brent 2004).
How the intervention might work
Exposure to AEDs during foetal development is noted to be associated with altered neuronal development in animal models. Reported alterations include disruption of neuronal birth, migrations and altered programmed cell death (Bittigau 2003; Miyazaki 2005). These are hypothesised to underpin the reported neurodevelopmental alterations noted in human infants and children (Bittigau 2003).
Early case reports have documented learning disabilities and difficulties, and low IQ or educational difficulties in children with major or minor congential malformations attributed to maternal AED use (Ardinger 1988; Chevallier 1989; Clayton‐Smith 1995; Hanson 1976; Winter 1987). A number of studies completed during the 1980s and 1990s aimed to investigate whether cognitive difficulties were associated with maternal use of AEDs during pregnancy but conflicting results were obtained due, at least in part, to methodological differences (FINNISH Study; Hill 1982; Huth 1982; Steinhausen 1994). Recent prospective studies report a significant association between prenatal exposure to sodium valproate and poorer cognitive functioning, often defined as intellectual quotient (IQ) or developmental quotient (DQ) (Bromley 2010; Cummings 2011; Meador 2009; Nadebaum 2011). The risks associated with other AEDs remain unclear with conflicting results reported for carbamazepine (CBZ) (Cummings 2011; Gaily 2004; Meador 2011) and little evidence in relation to exposure in utero to lamotrigine (LTG) (NEAD Study), levetiracetam (LEV) (Shallcross 2011) or topiramate (TPM).
In addition to adverse neurodevelopmental outcomes in relation to cognitive abilities, a link between maternal use of AEDs during pregnancy and an increased prevalence of neurodevelopmental disorders such as autistic spectrum disorders has been reported (Bromley 2009; Christianson 1994; Christensen 2013; Moore 2000; Rasalam 2005; Williams 1997).
Why it is important to do this review
To continue AED treatment during pregnancy requires a risk‐benefit decision to be taken. On one side there is the risk prenatal exposure to AEDs poses to the physical and neurodevelopment of the child and the lifelong implications associated with such damage to the early developing brain (Dean 2002). On the other side of this decision is the health and wellbeing of the mother who requires treatment for epilepsy. Careful consideration is required with regard to maximising treatment whilst limiting the risks to the foetus.
Although a teratogenic role for certain AEDs is supported by a number of studies, results conflict with regard to the degree of risk, making it difficult to counsel women regarding their choice of treatment during pregnancy. Assessing neurodevelopmental outcomes is complex, long and expensive due to the numbers of patients required and the time required for follow up; resulting in a number of different methodologies being employed. There is, therefore, a clear need for a systematic review of the existing data to aid decision‐making. Although randomised controlled trials (RCTs) would be considered to provide the most reliable evidence about the effects of AEDs taken during pregnancy, RCTs are considered unethical in this area and even if undertaken would pose considerable difficulties in terms of design, recruitment and interpretation. In view of this we have decided to proceed with a systematic review of all available evidence including registry based data, prospective cohort studies and RCTs (if available).
Evidence from this review can aid the decisions clinicians and women with epilepsy are required to make about the treatment of epilepsy in the childbearing years. The final review replaces a previously published Cochrane review entitled 'Common antiepileptic drugs in pregnancy in women with epilepsy' (Adab 2004).
Objectives
To assess the effects of prenatal exposure to commonly prescribed AEDs on neurodevelopmental outcomes in the child and to assess the methodological quality of the evidence.
This review examined neurodevelopmental outcomes following exposure to AEDs during pregnancy compared to unexposed pregnancies in women representative of the general population or unexposed pregnancies in women with epilepsy. Comparisons were also made between specific monotherapy AED exposures.
Methods
Criteria for considering studies for this review
Types of studies
The following types of study were considered.
Randomised controlled trials (RCTs). These are studies which included women with epilepsy requiring treatment who were randomised to a particular AED prior to conception or to a control group. The intervention group were women with epilepsy taking an AED of interest as monotherapy.
Prospective observational cohort studies. These included consecutive participants from single‐ or multi‐centre participating sites, where information regarding the pregnancy and history were collected prior to knowledge of the outcome. The intervention group were women with epilepsy taking an AED of interest as monotherapy.
Registry studies. Registry studies involve the ascertainment of data from a wide region, country or number of countries and recruitment is often based on self referral or clinician referral leading to non‐sequential case ascertainment. Both independent and industry sponsored registry data were considered for inclusion. These included data from pregnant women ascertained retrospectively from prospective malformation registers. The intervention group were women with epilepsy taking an AED of interest as monotherapy.
Types of participants
The following participants were eligible for the treatment group:
pregnant women with epilepsy taking a single AED of interest.
Participants eligible for the control groups were:
pregnant women with epilepsy taking an AED; or
pregnant women with epilepsy taking no AED; or
pregnant women who did not have epilepsy.
Studies reporting AED use solely in pregnant women with other conditions (for example mood disorders, pain etc) were excluded.
Types of interventions
Intervention group
Women with epilepsy receiving AED treatments including but not limited to:
phenobarbitone, phenytoin (PHT), carbamazepine (CBZ), oxcarbazepine, sodium valproate (VPA), lamotrigine (LTG), topiramate (TPM), gabapentin, vigabatrin, tiagabine, zonisamide, levetiracetam (LEV), ethosuximide, clobazam, clonazepam, zonisamide, pregabalin, lacosamide, retigabine, rufinamide, and sulthiame.
Comparisons of different AEDs were explored.
Control groups
Women with a diagnosis of epilepsy who were not taking AEDs and women without epilepsy and who were not taking medication for a chronic condition during pregnancy.
Women with epilepsy taking monotherapy treatment were employed as a 'comparator' group in analyses to enable AED treatment comparisons.
Types of outcome measures
Primary outcomes
Global cognitive functioning or ability
Global cognitive functioning or ability refers to a summary score of key cognitive processes such as reasoning, processing speed, mental flexibility and knowledge (Baron 2004). The most frequently‐reported measure of global cognitive functioning is the intelligence quotient (IQ). Typically in younger children global ability assessments additionally include assessment of motor and social skills, due to their importance at this age, producing an outcome reported as the development quotient (DQ). Two dominant DQ assessments (the Griffith Mental Development Scales and the Bayley Scales of Infant and Toddler Development) differ in their approach to assessing overall cognitive ability. The Griffiths Mental Development Scales include child motor ability along with other cognitive skills to create the overall reported DQ score. In contrast, the Bayley Scales of Infant and Toddler Development explore motor ability separately and therefore data from these two measures could not be combined in a meta‐analysis. Global cognitive ability in school aged children is typically assessed as IQ.
As well as a continuous variable, the primary outcome will be investigated and reported as the prevalence of children who fell below the average range. Typically, standardised measures of IQ and DQ have a mean of 100 and a standard deviation of 15, meaning that scores under 85 would be below the average range.
Secondary outcomes
Neurodevelopmental disorders
The proportion of children who experience the following neurodevelopmental disorders:
autistic spectrum disorders;
attention deficit‐hyperactivity disorder (ADHD);
dyspraxia.
The above disorders were chosen as they are important neurodevelopmental disorders and have been associated with prenatal exposure to AEDs (Adab 2004). These diagnoses were author‐defined but consistent with the Diagnostic and Statistical Manual of Mental (DSM‐IV) criteria for these conditions.
Cognitive domains
The differences between specific cognitive domain scores including:
attention;
executive function;
language;
memory;
visuospatial.
In addition to a global cognitive ability score, neuropsychological assessment often examines more defined or specific cognitive skills which might contribute to lowered levels of global cognitive functioning. For example, the majority of IQ tests will report Verbal IQ (VIQ) (also known as Verbal Comprehension) and Performance IQ (PIQ) (also known as Non‐Verbal IQ). Attention, language and memory abilities are core cognitive skills that influence other cognitive functions and understanding the functioning of these systems following prenatal exposure is key.
Search methods for identification of studies
Electronic searches
We searched the following databases:
Cochrane Epilepsy Review Group Specialized Register using the search terms pregnancy, pregnant, prenatal, teratogen, teratogenic, fetal, fetus, birth maternal and in utero (29 May 2014);
Cochrane Central Register of Controlled trials (CENTRAL) in The Cochrane Library (2014, Issue 4) using the search strategy set out in Appendix 1;
MEDLINE (Ovid) using the search strategy set out in Appendix 2 (from 1946 to 29/05/2014);
EMBASE (29 May 2014) using the search strategy set out in Appendix 3;
Pharmline (30 May 2014); and
Reprotox (30 May 2014).
The MEDLINE search strategy was adapted to meet the requirements of the EMBASE, Pharmline and Reprotox databases.
No language restrictions were employed in the searches.
Searching other resources
Conference abstracts were reviewed for the last seven years (2007 to 2014) from Neurology meetings, including the International League Against Epilepsy meetings (International Epilepsy Congress, European Congress on Epileptology, Asian and Oceanian Epilepsy Congress, and Latin American Congress on Epilepsy) and Teratology meetings (The Teratology Society and European Teratology Society). The Epilepsia Journal supplements from the past seven years (2007 to 2014) were searched for conference proceedings. Where possible, abstracts were linked to published data sets. Authors of abstracts which were not yet published were contacted for further information. When further information was unavailable the abstracts were listed in Characteristics of studies awaiting classification.
Reference lists of original research and review articles were cross‐matched to the studies generated from the electronic searches. Reference lists of recent review articles were searched, and lead and corresponding authors in the area were contacted for any relevant unpublished material.
Data collection and analysis
Selection of studies
Three authors (RB, JW, JG) reviewed the titles and abstracts of articles highlighted by the searches and removed studies that obviously did not meet the inclusion criteria. Full‐text reports were used by two authors (RB, JP) to determine eligibility. Disagreements were discussed and if not resolved the opinion of a third author (JG) was sought and all other authors were consulted if necessary. Multiple reports from single studies are common in this field and reports were linked where possible.
Data extraction and management
Five authors (RB, JW, NA, AS, AJM) undertook data extraction from the included studies by splitting the number of studies into equal parts. Data extraction was cross‐checked. Data were extracted using pre‐standardised electronic data extraction forms. This was initially piloted by members of the review team and amendments were made where necessary (see Appendix 4 for the data extraction form).
Assessment of risk of bias in included studies
Five authors (RB, JW, NA, AS, AJM) assessed risk of bias in the included studies by splitting the number of studies equally. Risk of bias assessments were cross‐checked. Due to the observational design of some of the studies, we decided to utilise a version of the extended Cochrane Collaboration tool for assessing risk of bias, developed by the Cochrane Non‐Randomised Studies Methods Group. The tool examines selection bias (sequence generation, allocation concealment), performance bias (blinding), attrition bias (incomplete outcome data, blinding), detection bias (blinding, other potential threats to validity), reporting bias (selective outcome reporting), and the influence of confounding variables. The domains of blinding, incomplete outcome data, selective outcome reporting, confounding variables and other bias were rated on a five‐point scale, ranging from low in bias to high risk of bias, according to the risk on the outcome (See Appendix 5; Appendix 6 for extended risk of bias tools). The parameters of this scale were determined by the review authors (see Table 1 for the scale parameters).
1. Risk of bias scale parameters.
|
1 Low risk |
2 | 3 | 4 |
5 High risk |
|
| Confounding | All important1 confounders considered2 and suitable method of adjustment3 employed. Outcome unlikely to be affected | Most important4 confounders considered and suitable method of adjustment employed. Outcome unlikely to be affected | Some confounders5 considered and full or partial adjustment employed6. Possible implication on outcome | Some confounders considered and no adjustment employed. Likely to affect outcome | No important confounders considered and no adjustment employed. Likely to affect outcome |
| Blinding | Assessors blinded to participant’s drug regime and participants blinded to drug regime. Outcome unlikely to be affected | Assessors blinded to participants drug regime. Outcome unlikely to be affected | Partial blinding7 involved in study. Possible implication on outcome | Partial or no blinding involved in study. Outcome likely to be affected | No blinding involved in study. Outcome likely to be affected |
| Incomplete outcome data | No missing data and/or appropriate analysis8 used to deal with missing data. Unlikely to affect outcome |
Smaller amount (<25%) of missing data with reasons given, balanced across groups. Unlikely to affect outcome | Larger amount of missing data (>25%) with or without reasons given, balanced across groups. Possible implication on outcome | Larger amount (>25%) of missing data, imbalance across groups. Outcome likely to be affected |
No information provided regarding missing data. Likely to affect outcome |
| Selective outcome reporting | A priori outcomes measured, analysed and reported in main report. Protocol available. Unlikely to affect outcome | A priori outcomes measured, analysed and reported in main report9. Protocol not available. Unlikely to affect outcomes | Limited information regarding a priori outcomes and measures. Possible implication on outcome | Outcomes measured but not analysed or reported | Outcomes measured but not analysed or reported and clinical judgement infers the presence of an unreported measured outcome10 |
| Other bias | No bias identified | Bias identified. Unlikely to affect outcome | Bias identified. Possible implication on outcome | Bias identified. Likely to affect outcome | Bias identified. Extremely likely to affect outcome |
1 Important confounders include maternal IQ, socio‐economic status, epilepsy type, seizure exposure, child age at assessment, child gender, child gestational age at birth or birth weight, polytherapy.
2 Reported demographic information and other confounders.
3 Matching scores, multiple regression, analysis of co‐variance, stratification.
4 At least five out of eight important confounders including maternal IQ and socio‐economic status, gestational age at birth.
5 At least two out of eight important confounders.
6 Full adjustment of confounding variables e.g. see footnote 2 or partial adjustment such as researchers select limited number of variables to adjust for.
7 Assessors of outcome are only blinded to certain groups e.g. blinded to intervention group but not controls.
8 Intention‐to‐treat analysis.
9 An a priori statement is made in methods section of main report regarding measurement and analysis of outcome.
10 For example, failure to report full scale IQ when all other indices are reported.
Measures of treatment effect
The primary outcome of global cognitive ability (DQ and IQ) and secondary outcomes relating to cognitive domains were measured on a continuous scale and the measure of treatment effect was the mean difference (MD). Secondary outcomes relating to the presence of a neurodevelopmental disorder or an IQ below a specified range were categorical data and the measure of treatment effect was the risk ratio (RR). As data were sparse, with some studies reporting zero events in one or both groups, the risk difference (RD) was also calculated.
Unit of analysis issues
Repeated observations were common. This was dealt with through the analysis of separate time points, which limited the likelihood of more than one observation from a single cohort. As children age the complexity of their cognitive functioning improves, requiring different assessment techniques and considerations. The abilities of children under the age of three are typically assessed using a developmental scale where the outcome is reported as a DQ. For school aged children of five years plus, the typical assessment of global cognitive ability would take the form of an intelligence assessment which is reported as the IQ. However, assessments of DQ can extend up to eight years of age with IQ measures extending down to two years of age and authors varied in their selection of DQ or IQ to assess pre‐school aged children.
Another unit of analysis issue in this review was the inclusion in studies of multiple children born to one mother. Studies varied in their inclusion of siblings, however data without the siblings included were rarely reported in full in the original papers and therefore at the review level it was not possible to address this issue.
Dealing with missing data
Missing data were sought through contact with the study authors. Reasons for missing data were sought to determine if they were missing at random, or not, but analyses were undertaken using the available data.
Assessment of heterogeneity
Clinical heterogeneity was assessed by examining the differences in study characteristics in order to inform decisions regarding the combination of study data. An a priori hypothesis of sources of clinical heterogeneity would be: type of population (regional, national or international, single‐ or multi‐centre); loss to follow up; maternal factors including age, duration of AED treatment, IQ, lifestyle factors, monotherapy or polytherapy, socioeconomic status, type of epilepsy, use of other medications and years of education. Child factors included: age of assessment, gestational age at birth, gender, seizure exposure, time of follow up and outcome measurement. Where applicable, we also assessed statistical heterogeneity by examining the I2 statistic and the Chi2 test. In the event heterogeneity was significant, both fixed‐effect and random‐effects model analyses were presented enabling examination of the differences.
Assessment of reporting biases
Outcome reporting bias was investigated using the ORBIT tool categories (Kirkham 2010). All protocols were requested from study authors to enable comparison of the outcomes of interest. Only four protocols were provided.
Publication bias was examined by identifying unpublished data, by carrying out a comprehensive search of multiple sources and requesting any unpublished data from authors. We looked for small‐study effects to establish the likelihood of publication bias. Funnel plots were intended to be examined in the event an appropriate number of studies could be combined, however this was unachievable. The Cochrane Collaboration recommends a minimum of 10 studies to be combined when examining funnel plots (Higgins 2011).
Data synthesis
For each comparison with data available for at least two studies, we performed a meta‐analysis to provide overall estimates of treatment effect. A fixed‐effect model was utilised for the primary data analyses, with exploration of potential explanations for heterogeneity. Secondary analyses, adopting a random‐effects model to incorporate the assumption that the different studies were estimating different yet related treatment effects, was undertaken. Sources of variability between the studies were also investigated. For continuous outcomes the pooled MD was calculated with the 95% CI. For categorical outcomes the pooled RR was calculated with the 95% CI. As data were sparse for many studies a further analysis was undertaken to calculate the RD and 95% CI. As the method of synthesis that is used can impact on the estimate of pooled treatment effect for sparse data, sensitivity analysis was undertaken to explore the robustness of the results with different assumptions regarding the method of analysis. These analyses were not pre‐planned in the protocol as it was not clear at the planning stage that data would be so sparse. Several included studies provided data which were deemed appropriate to be incorporated into a meta‐analysis. Studies were not included in a meta‐analysis if there was only one study contributing to a comparison, the measure used was not a standardised measure (that is a test with published standard norms) or the assessment used to measure the outcome was fundamentally different to others (that is overall data from Griffiths Mental Development Scales assessment and data from assessments conducted with the Bayley Scales of Infant and Toddler Development). These studies were discussed narratively within the results and discussion sections. We also expected to find differences in the definitions of neurodevelopmental disorders as these were author defined. These differences were examined at the analysis stage to ensure the appropriate combination of data.
Comparisons included:
specific monotherapy group versus controls on global cognitive functioning;
specific monotherapy group versus controls on neurodevelopmental disorders;
specific monotherapy group versus controls on specific cognitive domains;
specific monotherapy group versus specific monotherapy group on all above outcomes.
Each comparison was stratified by control group, study design and measurement characteristics to ensure appropriate combination of study data.
Subgroup analysis and investigation of heterogeneity
Heterogeneity across studies was explored by visual inspection of forest plots, interpretation of the I2 statistic and the P value for the test of heterogeneity. If there was evidence of heterogeneity, subgroup analysis was carried out to explore the potential causes of heterogeneity using the factors listed previously. These subgroup analyses were stratified by drug, study design and type of control group. Random‐effects model analyses were carried out in addition to fixed‐effect model analyses to incorporate any unexplained heterogeneity in the calculation of the pooled effect.
Sensitivity analysis
Sensitivity analyses were carried out to explore the effects of the method of analysis for categorical data and to explore the effect of fixed‐effect and random‐effects models (see previous descriptions). See Table 2 for the results of the sensitivity analysis.
2. Sensitivity analysis results for below average performance outcome.
| Analysis | AED | Control/Another AED | Main result: risk ratio | Sensitivity (i): risk difference (MH) | Sensitivity (ii): OR (M‐H) | Sensitivity (iii): OR (Peto) |
| IQ<1SD | VPA | Controls (women with epilepsy, no AED treatment) | 10.33 (2.05, 52.01) P=0.0046 |
0.37 (0.20, 0.54) P<0.0001 |
16.49 (2.86, 95.27) P=0.002 |
8.68 (2.92, 25.80) P=0.001 |
| IQ>1SD | CBZ | LTG | 2.28 (0.63, 8.22) | 0.05 (‐0.03, 0.13) | 2.43 (0.60, 9.77) | 2.35 (0.64, 8.56) |
| IQ>1SD | VPA | LTG | 4.87 (1.50, 15.78) | 0.16 (0.06, 0.27) | 6.35 (1.73, 23.36) | 4.94 (1.79, 13.66) |
| IQ>2SD | CBZ | VPA | 0.26 (0.05, 1.19) P=0.083 |
‐0.04 (‐0.10, 0.01) P=0.12 |
0.24 (0.05, 1.21) P=0.08 |
0.19 (0.04, 0.96) P=0.04 |
In cases where the number of events was 0 or 1, sensitivity analysis was performed using three alternative statistical methods including odds ratio (Mantel‐Haenszel (M‐H) method and Peto method) and risk difference (M‐H method). This was carried out for four comparisons only and the results are displayed in Table 2. The significance of the overall effect estimates was only altered in one comparison where the level of significance changed from non‐significant to significant.
Results
Description of studies
Results of the search
The search identified 10,769 records from the databases outlined in Electronic searches and 55 records were found through handsearching. Following the removal of duplicates, 10,233 records remained; these were screened for inclusion in the review. Of these, 10,157 records were excluded due to irrelevance, leaving 83 full texts to be assessed for eligibility. Twenty‐six were excluded (see Figure 1 and Characteristics of excluded studies for reasons for exclusion). A total of 28 studies were included in the review, from 59 reports; 10 of these were included in the meta‐analyses. We identified one unpublished study (Jackson 2013) and were provided with a draft publication and study data which we have included in the review and meta‐analysis. Unpublished data pertaining to the studies of Bromley 2010; Cummings 2011/2013 and Shallcross 2011 were provided. The 18 studies remaining were discussed in narrative form due to an inability to combine them with other data because of different methodological aspects or failure to report all required outcome data (that is number of included children, means along with standard deviations (SD), CIs or standard errors (SE).
1.
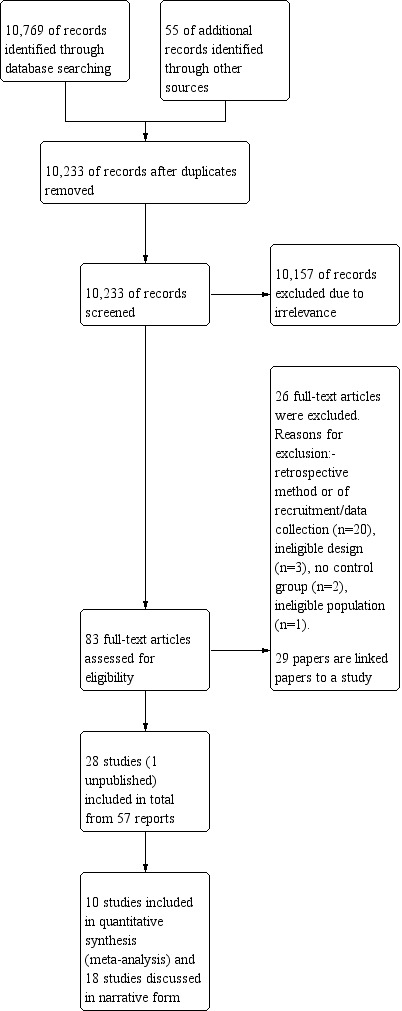
Study flow diagram.
Included studies
From a total of 57 full texts, 28 independent studies were included in this review. No RCTs were found, 22 included studies were prospective cohort studies (Arulmozhi 2006; Bromley 2010; Bromley 2013; D'Souza 1991; FINNISH Study; GERMAN Study; Hanson 1976; Hill 1974; Hirano 2004; Jackson 2013; Leavitt 1992; NEAD Study; Ornoy 1996; Regesta 1996; Rihtman 2012; Rihtman 2013; Rovet 1995; Shallcross 2011; Sobczyz 1977; Thomas 2008; Veiby 2013; Wide 2002) and six were registry studies (Cummings 2011/2013; Eriksson 2005; Gaily 2004; Jones 1989; Nadebaum 2011; Thomas 2007). See Table 3 for a comparison of all study designs and methods. See Characteristics of included studies for details about each included study.
3. Matrix of study quality characteristics.
| Study | Representative Population | Controls From Same Community | Prospective/Registry | Exposure Ascertainment | Reliable Diagnosis | Recruitment Adequate | Different Interventions Compared | Outcomes Investigated Over TIme | Standardised Measure Used | Data on Specific Monotherapy |
Dose Investigated | Siblings Accounted For |
| Arulmozhi 2006 | Yes | Unclear | Prospective | Yes | Yes | Unclear | Unclear | Yes | Yes | No | No | Unclear |
| Bromley 2008 | Yes | Yes | Prospective | Yes | Yes | Yes | Yes | No | Yes | Yes | No | No |
| Bromley 2010 | Yes | Yes | Prospective | Yes | Yes | Yes | Yes | No | Yes | Yes | Yes | Yes |
| Cummings 2011 | Yes | No | Registry | Yes | Yes | Yes | Yes | No | Yes | Yes | No | Yes |
| D'Souza 1991 | Unclear | Yes | Prospective | Yes | Yes | Unclear | No | No | Yes | No | No | Unclear |
| Eriksson 2005 | Yes | Yes | Registry | Yes | Yes | Yes | Yes | No | Yes | Yes | No | Yes |
| FINNISH Study | Yes | Yes | Prospective | Yes | Yes | Yes | Yes | Yes | Yes | Unclear | Yes | Yes |
| Hirano 2004 | Yes | Yes | Prospective | Unclear | Unclear | Unclear | No | No | Yes | No | Yes | Unclear |
| Gaily 2004 | Yes | Yes | Prospective | Yes | Yes | Yes | Yes | No | Yes | Yes | Yes | No |
| GERMAN Study | Yes | Unclear | Prospective | Unclear | Unclear | Unclear | Yes | Unclear | Yes | No | Unclear | Yes |
| Gladstone 1992 | No | Yes | Prospective | No | Unclear | Unclear | Yes | No | No | Yes | No | Unclear |
| Hanson 1974 | Unclear | Yes | Prospective | Unclear | Yes | Unclear | Yes | No | Yes | No | No | Unclear |
| Jackson 2013 | Yes | Yes | Prospectve | Yes | Yes | Yes | Yes | No | Yes | Yes | Yes | Unclear |
| Jones 1989 | No | Yes | Prospective | No | Unclear | Yes | Yes | No | Yes | Yes | No | No |
| Leavitt 1992 | No | Unclear | Prospective | Yes | Unclear | Unclear | Yes | No | Yes | Yes | Unclear | Unclear |
| Nadebaum 2011 | Unclear | Yes | Prospective | Yes | Yes | Unclear | Yes | No | Yes | Yes | Yes | No |
| NEAD Study | Yes | Yes | Prospective | Yes | Yes | Yes | Yes | Yes | Yes | Yes | Yes | Yes |
| Ornoy 1996 | No | Unclear | Prospective | Unclear | No | Unclear | Yes | No | Yes | Yes | Unclear | Unclear |
| Regesta 1996 | Unclear | Yes | Prospective | Unclear | Unclear | Unclear | Yes | Yes | Unclear | No | No | Unclear |
| Rihtman 2012 | No | No | Registry | Unclear | Unclear | Unclear | No | No | Yes | Yes | No | Unclear |
| Rihtman 2013 | No | No | Registry | Unclear | Unclear | Unclear | Yes | No | Yes | Yes | No | Unclear |
| Scolnik 1994 | Unclear | Yes | Prospective | Yes | Yes | Yes | Yes | No | Yes | Yes | yes | No |
| Shallcross 2011 | Yes | Yes | Prospective | Yes | Yes | Yes | Yes | No | Yes | Yes | Yes | No |
| Sobczyk 1977 | Yes | Yes | Prospective | Unclear | Yes | Yes | Yes | No | Yes | Yes | Unclear | Unclear |
| Thomas 2007 | Yes | Yes | Registry | Yes | Yes | Yes | Yes | Yes | Yes | Yes | Yes | No |
| Thomas 2008 | Yes | Yes | Prospective | Yes | Yes | Yes | Yes | No | Yes | Yes | Yes | No |
| Veiby 2013 | Yes | Yes | Prospective | Yes | Unclear | Unclear | Yes | Yes | Yes | Yes | No | Unclear |
| Wide 2002 | Yes | Yes | Prospective | Yes | Yes | Yes | Yes | Yes | Yes | Yes | Yes | No |
There were 29 linked papers, these full texts were related to an included study as they presented information on the same cohort of children.
Excluded studies
Twenty‐six studies were excluded from the review (Annegers 1974; Antiga 2010; Dean 2002; Dessens 2000; Forsberg 2011; Holmes 2000; Holmes 2005; Jakubowska 1981; Kelly 1984; Kozhokaru 2010; Latis 1982; Lekwuwa 1995; Majewski 1981; Meador 2010; Moore 2000; Mortensen 1996; Mortensen 2003; Oyen 2007; Parisi 2003; Perinola 1992; Rasalam 2005; Sereno‐Colo 1984; Steinhausen 1982; Vanoverloop 1992; Vert 1982; Yamatogi 1993). Several of these papers were not written in the English language and therefore were sent for translation and data extraction in order to determine the study design and methodology used. Twenty of the excluded studies employed a retrospective design or they were classed as a record linkage study or case series, not for inclusion within this review. Three studies did not examine the neurodevelopmental outcomes of interest to this review (Lekwuwa 1995; Meador 2010; Yamatogi 1993), two studies had no control group data (Perinola 1992; Vert 1982) and one study examined outcomes in a non‐epilepsy population (Mortensen 1996).
Risk of bias in included studies
All domains of bias were rated on a scale of 1 to 5. The description of the scale parameters for each domain is presented in Table 1.
Allocation
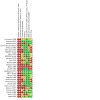
For the domains of sequence generation and allocation concealment all included studies were rated as high risk of bias. Whether carried out prospectively or as a registry study the included studies did not employ rigorous methods (that is randomisation to treatment) as the research questions were not conducive to the design features of these types of study design. However, the non‐randomised risk of bias tool used in this review required the assessment of these two domains on a level playing field in comparison to RCTs. See Figure 2 for a summary of risk of bias judgements.
2.
Blinding
Overall, 17 studies were rated as 2 as the outcome assessors were blinded to the exposure status of the individuals (Bromley 2010; Cummings 2011/2013; D'Souza 1991; Eriksson 2005; FINNISH Study; Gaily 2004; GERMAN Study; Hill 1974; Jackson 2013; Leavitt 1992; Nadebaum 2011; NEAD Study; Ornoy 1996; Rihtman 2013; Rovet 1995; Thomas 2008; Wide 2002) and therefore the risk of bias was low in these studies. Five of the studies were rated as unclear due to the lack of details regarding methods of blinding (Arulmozhi 2006; Hanson 1976; Hirano 2004; Regesta 1996; Rihtman 2012).The remainder of the studies were rated as 4 or 5 meaning that few or no methods were used to blind the outcome assessors or other study team members leaving open the possibility that the outcomes were likely to be affected by knowledge of the outcome or treatment (Bromley 2013; Jones 1989; Shallcross 2011; Sobczyz 1977; Thomas 2007; Veiby 2013).
Incomplete outcome data
Only three studies (Hirano 2004; Rihtman 2012); Rihtman 2013 were rated as 1 (low bias) as there were no missing data. The majority of studies (Arulmozhi 2006; Bromley 2010; Bromley 2013; Cummings 2011/2013; D'Souza 1991; Eriksson 2005; FINNISH Study; Gaily 2004; Hanson 1976; Leavitt 1992; Nadebaum 2011; NEAD Study; Ornoy 1996; Regesta 1996; Rovet 1995; Shallcross 2011; Thomas 2008) were rated 2 as there was only a small amount of missing data from the reports and this was balanced across the groups or appropriate reasons were reported. Three studies (Hill 1974; Thomas 2007; Wide 2002) were rated as 3 suggesting a possible implication on the outcomes due to a larger amount of missing data. Two studies (Jackson 2013; Jones 1989) were rated as 4 as there was a large amount of missing data which was imbalanced across the groups suggesting the outcomes were likely to be affected. Two studies (GERMAN Study; Veiby 2013) were rated 5 suggesting a high risk of bias due to the lack of information provided about a large amount of missing data. One study (Sobczyz 1977) was rated unclear due to the lack of detail regarding missing data.
Selective reporting
Selective outcome reporting was rated on a 1 to 5 scale, one demonstrating low risk of bias and five demonstrating high risk of bias. The majority of studies (GERMAN Study; Hanson 1976; Hirano 2004; Jackson 2013; Nadebaum 2011; Ornoy 1996; Regesta 1996; Rihtman 2012; Rihtman 2013; Rovet 1995; Shallcross 2011; Sobczyz 1977; Thomas 2007; Thomas 2008; Veiby 2013; Wide 2002) were rated 2 as there was no evidence of selective outcome reporting within the publications; however this could not be tested against the protocols for the studies as they were not provided. Three studies were rated 3 as the risk of bias was unclear due to a small amount of non‐reporting (Arulmozhi 2006; D'Souza 1991; FINNISH Study). Four studies were rated 4 due to selective reporting (Cummings 2011/2013; Hill 1974; Jones 1989; Leavitt 1992).
Study protocols were requested from authors who had contact details available. Only five responses were received with protocols being provided (Bromley 2010; Bromley 2013; Eriksson 2005; Gaily 2004; NEAD Study). The protocol for GERMAN Study was unavailable. No other responses were received.
For the four studies where the protocol was made available a rating of 1 for low risk of bias was allocated as there was no evidence of selective outcome reporting following protocol review.
Other potential sources of bias
Any other biases were examined and this domain was rated on a scale of 1 to 5. The main other sources of bias that were identified included data for different AEDs being combined and the use of inappropriate measures for year of recruitment or for age of children at assessment. Taking all studies into account, nine were rated as low risk of bias (Bromley 2010; Bromley 2013; Nadebaum 2011; NEAD Study; Rovet 1995; Shallcross 2011; Thomas 2007; Thomas 2008; Wide 2002), nine were unclear (Arulmozhi 2006; Cummings 2011/2013; Gaily 2004; GERMAN Study; Jackson 2013; Leavitt 1992; Ornoy 1996; Regesta 1996; Veiby 2013) and 10 were rated as at high risk of bias (D'Souza 1991; Eriksson 2005; FINNISH Study; Hanson 1976; Hill 1974; Hirano 2004; Jones 1989; Rihtman 2012; Rihtman 2013; Sobczyz 1977). See the risk of bias tables for the individual studies in the Characteristics of included studies.
Confounding variables
A pre‐specified list of confounding variables was compiled prior to carrying out the review as described in Assessment of risk of bias in included studies. Overall, six studies were rated as at low risk of bias and scored either a 1 or 2 (Bromley 2010; Bromley 2013; Cummings 2011/2013; Nadebaum 2011; NEAD Study; Shallcross 2011) as they examined relevant variables and used an appropriate method of analysis to deal with them. Eleven studies were rated 3 (unclear risk of bias) as they showed evidence of investigating some important confounders but not all that were relevant to the area (Arulmozhi 2006; D'Souza 1991; Gaily 2004; GERMAN Study; Hanson 1976; Hirano 2004; Regesta 1996; Rovet 1995; Thomas 2007; Veiby 2013; Wide 2002). Eleven studies were rated as high risk of bias and scored either a 4 or a 5 (Eriksson 2005; FINNISH Study; Hill 1974; Jackson 2013; Jones 1989; Leavitt 1992; Ornoy 1996; Rihtman 2012; Rihtman 2013; Sobczyz 1977; Thomas 2008). These studies either did not examine the influence of key confounding variables or they did not employ appropriate methods to account for them, or included women taking AEDs for other indications.
Effects of interventions
Neurodevelopmental outcomes of children exposed to carbamazepine (CBZ) in comparison to control children
Eight studies investigated the cognitive abilities of children exposed to CBZ in comparison to a control group where the outcome was measured as DQ with four studies reporting child IQ.
Developmental quotient (DQ)
CBZ versus controls (women without epilepsy)
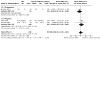
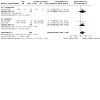
Pooled results from three studies (GERMAN Study; Ornoy 1996; Rovet 1995) using the Bayley Scales of Infant Development reported a significant MD of ‐5.58 (95% CI ‐10.83 to ‐0.34, P = 0.04, I2 = 60%) with the children exposed to CBZ (n = 50) exhibiting poorer earlier performance than control children (n = 79). Due to high heterogeneity a random‐effects model analysis was undertaken and gave an MD of ‐4.35 (95% CI ‐14.04 to 5.34, P = 0.38), which changed the overall estimate to non‐significant (Analysis 1.2).
1.2. Analysis.
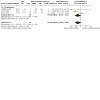
Comparison 1: CBZ versus controls (women without epilepsy), Outcome 2: Development (Bayley)
Leavitt 1992 reported that the group means on the Bayley Scale of Infant and Toddler Development were not significantly different for children exposed to CBZ (mean 122, SD not reported, P = 0.571) in comparison to general population control children (mean 119, SD not reported); however, the specific number of children exposed to CBZ monotherapy was not reported in the paper and this study could not contribute to the meta‐analysis.
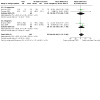
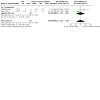
Two studies were identified to have investigated the neurodevelopment of children exposed to CBZ in comparison to control children using the Griffith Mental Development Scales (Bromley 2010; Wide 2002). Bromley 2010 found that the overall DQ of children exposed to CBZ (n = 48) did not differ significantly from control children (n = 230) (CBZ mean 98, 95% CI 94.0 to 102.5 versus control mean 100, 95% CI 98.9 to 102.1, P = 0.342). Consistently, Wide 2002 also failed to find a significant difference between the DQ of the children exposed to CBZ either at nine months of age (n = 35) and control children (n = 81) (CBZ mean (unstandardised) 350, range 324 to 435 versus control mean (unstandardised) 335, range 307 to 396, P = 0.4). Similarly, reassessment at four years of age also found that the children exposed to CBZ (n = 35) were not significantly different in comparison to control children (n = 66) (CBZ mean (unstandardised) 641, 95% CI unclear, P value not reported versus control mean (unstandardised) 641, 95% CI unclear, P value not reported). Meta‐analysis was not possible as data were not provided in one of the publications (Wide 2002) in a format that allowed calculation of mean difference (Analysis 1.1). Finally, Ornoy 1996 found a significant difference in the abilities of children exposed to CBZ (n = 19) (mean 99.4, SD 21) in comparison to controls (n = 12) (mean 113, SD 15, P < 0.05) when measured using the McCarthy Scales of Children's Abilities.
1.1. Analysis.
Comparison 1: CBZ versus controls (women without epilepsy), Outcome 1: Development (Griffiths)
CBZ versus controls (women with epilepsy not taking AEDs)
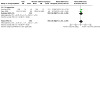
The pooled results from two studies (Jackson 2013; Thomas 2008) measuring neurodevelopment with the Bayley Scales of Infant and Toddler Development and comparing children exposed to CBZ (n = 163) to the offspring of women with untreated epilepsy (n = 58), found a significant MD of ‐7.22 (95% CI ‐12.76 to ‐1.67, P = 0.01, I2 = 56%) indicating poorer developmental abilities for children exposed to CBZ. Due to high heterogeneity a random‐effects model analysis was undertaken and gave an MD of ‐5.60 (95% CI ‐15.40 to 4.20, P = 0.26) changing the result to non‐significant (Analysis 2.2).
2.2. Analysis.

Comparison 2: CBZ versus controls (women with epilepsy, no AED treatment), Outcome 2: Development (Bayley)
Intellectual quotient (IQ)
CBZ versus controls (women without epilepsy)
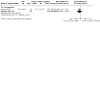
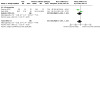
The pooled MD comparing IQ levels of 150 CBZ exposed children to 552 control children across three studies (Bromley 2010; Gaily 2004; Thomas 2007) was not statistically significant (MD ‐0.03, 95% CI ‐3.08 to 3.01, P = 0.98, I2 = 0%) (Analysis 1.3).
1.3. Analysis.
Comparison 1: CBZ versus controls (women without epilepsy), Outcome 3: IQ
CBZ versus controls (women with epilepsy not taking AEDs)
Four studies, two prospective (Bromley 2010; Thomas 2007) and two register studies (Eriksson 2005; Gaily 2004), were pooled in a meta‐analysis. The MD for 163 CBZ exposed children in comparison to 87 control children was non‐significant (MD 1.84, 95% CI ‐2.13 to 5.80, P = 0.36, I2 = 0%) (Analysis 2.3).
2.3. Analysis.
Comparison 2: CBZ versus controls (women with epilepsy, no AED treatment), Outcome 3: IQ
Autistic spectrum disorder
Three studies investigated whether children exposed to CBZ were at greater risk of being diagnosed with an autistic spectrum disorder. Two studies (Bromley 2010; Eriksson 2005), using a prospective and register methodology respectively, identified and investigated rates of autistic spectrum disorder in children exposed to CBZ in comparison to a control group. Bromley 2013 found that in comparison to general population control children there was no increased risk of autistic spectrum disorder (2% versus 1.8%, P value not reported). In the small study by Eriksson 2005 no cases were identified for either the control group (n = 13) or the CBZ exposure group (n = 13) (P value not reported), probably due to small group size. Unpublished data provided in relation to the Cummings 2011/2013 study reported a 6% prevalence within the group exposed to CBZ but control data were not available. Meta‐analysis would not have been reliable due to the difference in methods used to collect the data across these three studies.
Parental reporting regarding infants at the age of 18 months did not find the children exposed to CBZ (n = 41) to be at an increased risk on an autism checklist (CBZ 8.8% versus control 10.0%, OR 1.1, 95% CI 0.3 to 3.6, P > 0.05) or on a questionnaire of autistic traits (CBZ 2.9% versus control 0.5%, OR 3.3, 95% CI 0.5 to 24.8, P > 0.05) in comparison to children born to women without epilepsy (n = 225) (Veiby 2013). In this study, at 36 months, parents were asked to re‐rate their child in terms of autistic traits and the CBZ exposed children (n = 31) again were not found to differ significantly from control children (n = 154) (CBZ 3.4% versus 0.7%, OR 2.5, 95% 0.3 to 19.1, P > 0.05).
Specific cognitive abilities
The pooled estimates for VIQ resulted in an MD of ‐1.81 (95% CI ‐4.94 to 1.33, P = 0.26, I2 = 74%), from 136 CBZ exposed children compared to 351 general population controls (Bromley 2010; Gaily 2004). Due to the high statistical heterogeneity a random‐effects model analysis was undertaken and produced an MD of ‐1.84 (95% CI ‐8.01 to 4.34, P = 0.56) resulting in no change to the level of significance (Analysis 1.5).
1.5. Analysis.
Comparison 1: CBZ versus controls (women without epilepsy), Outcome 5: VIQ
The pooled estimates for PIQ (MD 1.27, 95% CI ‐1.55 to 4.09, P = 0.38, I2 = 0%), calculated from 136 CBZ children compared to 351 general population controls from two studies (Bromley 2010; Gaily 2004), were not statistically significant (Analysis 1.6). Consistently, non‐significant MDs were also found for children exposed to CBZ (n = 149) in comparison to no medication controls (n = 83) for VIQ (MD 0.13, 95% CI ‐3.98, 4.23, P = 0.95, I2 = 0%) and PIQ (MD 3.65, 95% CI ‐0.60 to 7.90, P = 0.09, I2 = 0%) based on three studies (Bromley 2010; Eriksson 2005; Gaily 2004) (Analysis 2.6; Analysis 2.7).
1.6. Analysis.
Comparison 1: CBZ versus controls (women without epilepsy), Outcome 6: PIQ
2.6. Analysis.

Comparison 2: CBZ versus controls (women with epilepsy, no AED treatment), Outcome 6: VIQ
2.7. Analysis.
Comparison 2: CBZ versus controls (women with epilepsy, no AED treatment), Outcome 7: PIQ
In children aged between seven and 85 months of age, the registry study by Rovet 1995 reported that the language development of children exposed to CBZ (n = 28) did not differ significantly from matched controls (n = 28) for either language comprehension or language expression (mean scores unavailable from the paper). Bromley 2010, also measured early language development and failed to find a significant difference between the abilities of children exposed to CBZ (n = 48) under two years of age and control children (both standard (n = 230) and no‐medication (n = 27)). No significant difference was found between the children exposed to CBZ or general population controls (CBZ mean 103, 95% CI 98 to 108 versus control mean 105, 95% CI 103 to 106, P = 0.684) or to children born to women with untreated epilepsy (mean 109, 95% CI 105 to 114, P = 0.307). In an older aged cohort, the language abilities of 14 CBZ (mean 74.9, SD 21, P = 0.87) exposed children did not differ from controls (mean not reported) in the registry study of Thomas 2007 when assessed at school age. Meta‐analysis was a not carried out due to the variation in language measures used and the different language outcomes targeted.
In terms of motor abilities, Thomas 2008 found comparable motor development between children exposed to CBZ (n = 101) (mean 95, 95% CI 90 to 100, P value not reported) and no‐medication control children (n = 32) (mean 94.7, 95% CI 85 to 105). This was consistent with the findings of Ornoy 1996 (CBZ (n = 20) mean 97.5, SD 18 versus controls (n = 34) mean 101, SD 12, P > 0.05), Bromley 2010 (CBZ (n = 48) mean 94, 95% CI 89 to 99 versus controls (n = 230) mean 98, 95% CI 97 to 100, P = 0.059) and also the small study by Arulmozhi 2006 (CBZ (n = 7) mean 101, SD 4 versus controls (n = 30) mean 102, SD 4.7, P value not reported).
CBZ versus controls: prevalence of below average performance
For CBZ there were too few studies with similar methodologies to allow for meta‐analysis in comparison to control children. Cummings 2011/2013 reported a significantly increased prevalence of performance 1 SD below the normative mean based on 49 CBZ exposed children in comparison to 44 controls (10% versus 4.5% respectively, OR 7.7, 95% CI 1.4 to 43.1, P < 0.01), assessed with either the Grifftihs Mental Development Scales or the Bayley Scales of Infant and Toddler Development. With the prevalence of children performing at a level 2 SDs below the mean only the data by Cummings 2011/2013 reported this, and noted that 2% of children exposed to CBZ and only 1% of control children fell below 2 SDs from the mean; a difference which was not significant.
In the study by Veiby 2013 parents completed the Ages and Stages Questionniare for their child at 6, 18 and 36 months of age. No significant level of difference in the prevalence of performance 2 SD from the mean was reported for the children exposed to CBZ (n = 48) in comparison to children born to women without epilepsy (n = 276) for gross motor development (CBZ 12.8% versus control 12.0%, OR 1.3, 95% CI 0.5 to 3.0, P > 0.05), fine motor development (CBZ 10.9% versus control 6.9%, OR 2.3, 95% CI 0.9 to 6.0, P > 0.05) or early social development (CBZ 12.8% versus control 13.4%, OR 1.4, 95% CI 0.6 to 3.3, P > 0.05). At 18 months of age the children exposed to CBZ (n = 41) scored significantly at risk for their fine motor development (CBZ 10.0% versus control 5.1%, OR 3.3, 95% CI 1.1 to 9.2, P < 0.05) and their personal and social skill development (CBZ 12.2% versus control 3.7%, OR 3.2, 95% CI 1.3 to 8.3, P < 0.05) but not for gross motor skills (CBZ 0% versus control 3.2%, OR calculation not possible) in comparison to the control children (n = 221). Reassessment again at 36 months of age failed to find any significant differences between the children exposed to CBZ (n = 31) and control children (n = 154) for gross motor skills (CBZ 6.5% versus control 6.0%, OR 2.3, 95% CI 0.5 to 9.9, P > 0.05), fine motor skills (CBZ 3.3% versus control 5.6%, OR 1.0, 95% CI 0.1 to 7.5, P > 0.05), communication skills (CBZ 0% versus control 1.3%, OR could not be calculated), or sentence skills (CBZ 6.5% versus control 3.9%, OR 1.2, 95% CI 0.3 to 5.1, P > 0.05) (Veiby 2013). Consistently, Bromley 2010 using the Griffiths Mental Development Scales found no significant difference in the prevalence of below average performance for children exposed to CBZ (n = 48, 16%) in comparison to general population control children (n = 230, 8%) or children born to women with an untreated epilepsy (n = 27, 7%) in children aged two years. It was likely that these conflicting results were due to methodological differences.
Dose of CBZ
No relationship between dose of CBZ and neurodevelopmental outcome was reported in five (Bromley 2010; Gaily 2004; Jackson 2013; Ornoy 1996; Rovet 1995) of the six identified studies that had investigated this issue. The sixth study (NEAD Study) failed to find an association between CBZ dose and general cognitive ability (DQ and IQ); however, the study reported a relationship between CBZ dose and verbal abilities when the cohort were three years of age. It was of note, however, that this association was not replicated in this cohort when they were six years of age (NEAD Study).
Neurodevelopmental outcomes of children exposed to lamotrigine (LTG) in comparison to control children
Despite its widespread use in women of childbearing age, only three identified studies (Bromley 2010; Cummings 2011/2013; Rihtman 2013) investigated the cognitive abilities of children exposed to LTG in comparison to a control group. Due to differences in methodologies and data reporting meta‐analysis was not possible.
Developmental quotient (DQ)
LTG versus controls (women without epilepsy)
Using the Griffiths Mental Development Scales, Bromley 2010 investigated the cognitive abilities of children exposed to LTG (n = 34) (mean 99, 95% CI 94 to 103, P = 0.21) in comparison to control children (n = 230) (mean 100, 95% CI 99 to 102); no significant differences were found.
LTG versus controls (women with epilepsy not taking AEDs)
In the study by Bromley 2010, the mean DQ for children exposed to LTG (n = 34) (mean 99, 95% CI 94 to 103, P = 0.470) was not significantly different from that of children born to women with untreated epilepsy (n = 27) (mean 104, 95% CI 101 to 108).
Intellectual quotient (IQ)
LTG versus controls (women without epilepsy)
Consistent with the assessment at the earlier age, Bromley 2010 failed to find a significant difference between the children exposed to LTG (n = 29) (mean 103, SD 11, P = 0.22) in comparison to control children of women without epilepsy (n = 210) (mean 107, SD 12) in their prospective cohort at six years.
Rihtman 2013 compared 41 LTG exposed children to 52 control children. These data could not be combined with that of Bromley 2010 due to the inclusion of children born to women with psychiatric indications who were exposed to LTG (10%). Rihtman 2013 found a non‐significant difference between the children exposed to LTG and control children (LTG mean 105.56, SD 12.49 versus control mean 108.71, SD 10.20, P > 0.05).
LTG versus controls (women with epilepsy not taking AEDs)
Only a single identified study investigated this comparison. Bromley 2010 found comparable mean IQs for children exposed to LTG (n = 29) (mean 103, SD 11, P value not reported) and children born to women with untreated epilepsy (n = 25) (mean 104, SD 13).
Autistic spectrum disorder
The rate of diagnosis of autistic spectrum disorder in children exposed to LTG was only reported in one published study (Bromley 2013). In comparison to a rate of 1.8% in the general population controls (n = 210) the prevalence of 3.3% for the LTG group (n = 30) was not significantly higher in children at six years of age. In unpublished data (linked to Cummings 2011/2013) a 0% prevalence of autistic spectrum disorder in 35 LTG exposed children was reported; no control data were available however.
Investigation of autistic symptomatology was undertaken in one study. Veiby 2013 found that, based on parental ratings, children aged 18 months were not at increased risk based on an autism checklist (LTG 15.6% versus controls 10.0%, OR 1.8, 95% CI 0.9 to 3.8, P > 0.05) or on a questionnaire regarding autistic traits (LTG 3.1% versus 0.5%, OR 1.5, 95% CI 0.2 to 11.0, P > 0.05). At 36 months, however, parental ratings indicated an increased risk in the LTG group (n = 44) of autistic traits (LTG 9.3% versus control 3.4%, OR 5.0, 95% CI 1.7 to 14.4, P < 0.05) in comparison to controls (n = 154) (Veiby 2013).
Specific cognitive abilities
The VIQ (mean 99, SD 13, P = 0.23) and PIQ (mean 103, SD 12, P = 0.34) of children exposed to LTG (n = 29) did not differ significantly in comparison to general population controls (n = 210) (VIQ mean 103, SD 12; PIQ mean 106, SD 13) or untreated epilepsy controls (n = 29) (VIQ mean 99, SD 12, P value not reported; PIQ mean 104, SD 14, P value not reported) in the one identified study to investigate such abilities in school aged children (Bromley 2010). From the same cohort but at a younger age time point (under two years of age) children exposed to LTG were also not found to significantly differ from control children for their early development across language (LTG mean 104, 95% CI 98 to 100 versus control mean 105, 95% CI 103 to 106, P = 0.476), motor (LTG mean 100, 95% CI 94 to 105 versus control mean 98, 95% CI, 97 to 100, P = 0.733), social (LTG mean 100, 95% CI 95 to 106 versus control mean 97, 95% CI 95 to 98, P = 0.379) and non‐verbal skills (LTG mean 97, 95% CI 91 to 103 versus control mean 102, 95% CI 100 to 104, P=0.104). The younger aged LTG exposed children were found to be significantly poorer in their hand and eye co‐ordination (LTG mean 90, 95% CI 84 to 97, P = 0.104) in comparison to general population controls (mean 101, 95% CI 98 to 103); however this difference disappeared when confounders (that is maternal IQ and socioeconomic status) were adjusted for (Bromley 2010). Rihtman 2013 reported poorer fine motor skills for children exposed to LTG (n = 42) in comparison to control children (n = 52) (LTG mean 30.57, SD 22.90 versus control mean 43.08, SD 21.17, P < 0.05) as well as poorer gross motor skills (LTG mean 34.78, SD 24.47 versus control mean 49.92, SD 28.29). Visual perception abilities were also noted to be poorer in the Rihtman 2013 study for the children exposed to LTG (n = 42) in comparison to control children (n = 51) (LTG mean 42.76, SD 31.85 versus control mean 60.46, SD 28.68, P < 0.05) as were motor co‐ordination abilities (LTG mean 31.18, SD 28.62 versus control mean 51.53, SD 25.26, P < 0.05) but not their visual‐motor integration abilities (LTG mean 53.86, SD 25.24 versus control mean 63.90, SD 23.78, P < 0.05).
LTG versus controls: prevalence of below average performance
Two studies compared the prevalence of child DQ performance 1 SD below the mean, but meta‐analysis was not possible. The study by Cummings 2011/2013 found that 2.9% of children exposed to LTG (n = 35) and 4.5% of control children fell 1 SD below the mean, a difference that was not significant. Consistently, Bromley 2010 also found comparable levels of below average performance in 34 LTG exposed children (15%) and 230 control children (8%).
At 6 months of age Veiby 2013 did not find children exposed to LTG (n = 71) to be at an increased risk of 2 SDs below the mean on parental completed measures of gross motor skills (LTG 15.7 versus controls 12%, OR 1.5, 95% CI 0.8 to 2.9, P > 0.05), fine motor skills (LTG 10.1 versus control 6.9, OR 1.8, 95% CI 0.8 to 3.9, P > 0.05) or early social development (LTG 12.7% versus control 13.4%, OR 1.2, 95% CI 0.6 to 2.5, P > 0.05). At 18 months, parents provided further ratings of their child's development and reported no significant levels of difference between the children exposed to LTG (n = 65) and control children (n = 221) for gross motor skills (LTG 7.8% versus control 3.2%, OR 1.7, 95% CI 0.6 to 5.1, P > 0.05), fine motor skills (LTG 3.1% versus control 5.1%, OR 0.9, 95% CI 0.2 to 3.7, P > 0.05) or personal and social skills (LTG 3.1% versus control 3.7%, OR 0.6, 95% CI 0.2 to 2.7, P > 0.05). Reassessment of this group at 36 months found that, based on parent ratings, children exposed to LTG were at an increased risk of poorer sentence skills (LTG 14.3% versus control 3.9%, OR 2.8, 95% CI 1.2 to 6.9, P < 0.05) but not gross motor skills (LTG 9.8% versus control 3.3%, OR 2.4, 95% CI 0.8 to 7.0, P > 0.05), fine motor skills (LTG 7.7% versus control 5.6%, OR 2.1, 95% CI 0.7 to 7.0, P > 0.05) or communication skills (LTG 7.1% versus controls 1.3%, OR 2.0, 95% CI 0.6 to 6.7, P > 0.05).
Dose of LTG
No relationship between dose and child DQ or IQ was found (Bromley 2010; NEAD Study); this was not investigated in the study by Cummings 2011/2013. Rihtman 2013 found a relationship between dose of LTG on fine motor ability and non‐verbal IQ but not for the other cognitive measures.
Neurodevelopmental outcomes of children exposed to levetiracetam (LEV) in comparison to control children
Only one study was identified by the searches to have investigated the neurodevelopment of children exposed to LEV in utero (Shallcross 2011).
Developmental quotient (DQ)
LEV versus controls (women without epilepsy)
One study investigated the neurodevelopment of children exposed to LEV in comparison to children born to women without epilepsy (Shallcross 2011) who were under two years of age. Data collected using the Griffiths Mental Development Scales found that children exposed to LEV (n = 51) (mean 99.9, 95% CI 97 to 103, P = 0.62) did not differ significantly in comparison to general population control children (n = 97) (mean 98.8, 95% CI 96 to 102).
LEV versus controls (women with epilepsy not taking AEDs)
No comparisons comparing the DQ of children exposed to LEV to children born to women with untreated epilepsy were identified.
Intellectual quotient (IQ)
No studies measured this aspect of neurodevelopment in comparison to either control type.
Autistic spectrum disorder
No studies were identified.
Specific cognitive abilities
In the study by Shallcross 2011, children exposed to LEV (n = 51) did not differ from control children on tasks of language (LEV mean 100.5, 95% CI 97 to 104 versus control mean 101.2. 95% CI 98 to 104, P=0.79), hand and eye coordination (LEV mean 101.8, 95% CI 97 to 106 versus control mean 97.4, 95% CI 94 to 101, P = 0.14), non‐verbal reasoning (LEV mean 101.7, 95% CI 98 to 105 versus control mean 101.4, 95% CI 98 to 105, P = 0.92) or social development (LEV mean 98.0, 95% CI 94 to 102 versus control mean 98, 95% CI 95 to 101, P = 0.99).
In a later paper linked to the Shallcross 2011 paper, the research group reported on global cognitive ability of 53 LEV exposed children at between three and four years of age in comparison to children born to women without epilepsy (n = 131); 32% of this LEV group had been assessed under the age of two years and were reported in the Shallcross 2011 publication. Consistent with the outcome at the younger age assessments the children exposed to LEV did not differ in their performance on tasks of motor development (LEV mean 110.4, SD17.2 versus control mean 110.9, SD 20.1, P=0.9), social development (LEV mean 116.5, SD 19.1 versus control mean 119.9, SD 16.3, P = 0.1), hand and eye co‐ordination tasks (LEV mean 104.8, SD 13.9 versus control mean 103.3, SD 15.6, P = 0.8), non‐verbal skills (LEV mean 109.9, SD 15.4 versus control mean 110.5, SD 16.3, P = 0.6) and practical developmental skills (LEV mean 113.4, SD 16.6 versus control mean 113.9, SD 17.0, P = 0.5). The authors also completed the Reynell Scales of Infant and Toddler Development to assess language development in the pre‐school aged LEV exposed children in comparison to the control children. No significant differences were found in terms of language comprehension (LEV mean 49.6, SD 10.3 versus control mean 52.2, SD 9.6, P = 0.2); for language expression skills the children exposed to LEV scored significantly higher than the control children (LEV mean 52.0, SD 13.4 versus control mean 46.6, SD 10.2, P = 0.01).
Dose of LEV
In the study by Shallcross 2011 a linear relationship between daily dose of LEV and the Griffiths Mental Development score was noted to be significant, but it was a weak relationship (r = 0.25).
Neurodevelopmental outcomes of children exposed to phenytoin (PHT) in comparison to control children
Despite its many years of use only five studies investigated the cognitive abilities of children exposed to PHT in isolation from other AEDs. Variance across methodologies limited our ability to perform meta‐analysis.
Developmental quotient
PHT versus controls (women without epilepsy)
The pooled MD estimate from 20 children exposed to PHT in comparison to 44 controls (GERMAN Study; Rovet 1995) was not statistically significant (MD ‐0.12, 95% CI ‐7.54 to 7.30, P = 0.98, I2 = 55%) using the Bayley Scales of Infant and Toddler Development (Analysis 5.1). Leavitt 1992 reported that the mean scores on the Bayley Scales of Infant and Toddler Development were not significantly different for children exposed to PHT in comparison to general population control children (PHT mean 113, SD not reported versus control mean 119, SD not reported, P = 0.173); however, the specific number of PHT monotherapy exposed children was not reported in the paper. Wide 2002 noted no significant difference at nine months of age for 21 children exposed to PHT (mean 635, 95% CI unclear versus control mean 641, 95% CI unclear, P value not reported) in terms of global neurodevelopment on the Griffiths Mental Development Scales. This finding was consistent with later follow up of this cohort at four years (PHT n = 15 mean (unstandarised) 635, 95% CI unclear, P value not reported).
5.1. Analysis.
Comparison 5: PHT versus controls (women without epilepsy), Outcome 1: Development (Bayley)
PHT versus controls (women with epilepsy not taking AEDs)
Thomas 2008 failed to find a significant difference between children exposed to PHT (n = 29) (PHT mean 90.3, 95% CI 77 to 103, P value not reported) and controls (n = 32) (mean 92.3, 95% CI 81 to 103) when children were assessed with an adapted version of the Bayley Scales of Infant and Toddler Development.
Intellectual quotient (IQ)
Two studies investigated the IQ abilities of children exposed to PHT in comparison to control children (FINNISH Study; Thomas 2007), however neither compared PHT monotherapy outcomes to controls in isolation and therefore the data could not be reported for PHT.
Autistic spectrum disorder
No studies were identified.
Specific cognitive abilities
Rovet 1995 demonstrated significantly poorer language abilities in children exposed to PHT compared to controls as measured by the Reynell Language Scales across both comprehension and expressive language (means not reported). Arulmozhi 2006, reported delayed sitting abilities in 18 infants exposed to PHT when compared to 30 control children (means not reported). Wide 2002 also found delayed motor development in 15 PHT exposed children aged between four and five years of age (PHT mean 98, 95% CI unclear versus control mean 106, 95% CI unclear). Finally, a non‐significant OR for PHT (n=12) (OR 1.37, 95% CI 0.38 to 5.0, P value not reported) in comparison to controls was noted for specific cognitive dysfunction in the early FINNISH Study.
Dose of PHT
The studies of Rovet 1995 and NEAD Study investigated but failed to demonstrate a dose effect with PHT.
Neurodevelopmental outcomes of children exposed to phenobarbital (PB) in comparison to control children
Despite its historical use the majority of investigations into children exposed to PB reported outcomes as part of a single AED exposed group rather than as a group in its own right. Therefore, limited data was available on PB exposure and child neurodevelopmental outcomes.
Developmental quotient
PB versus controls (women without epilepsy)
Leavitt 1992 reported that the mean Bayley scores were not significantly different for children exposed to PB (mean 115, SD not reported, P = 0.372) compared to general population control children (mean 119, SD not reported); however the specific number of women with PB monotherapy was not reported in the paper.
PB versus controls (women with epilepsy not taking AEDs)
Thomas 2008 failed to find a significant difference between children exposed to PB (n = 41) (mean 90.3, 95% CI 94 to 97, P value not reported) and control children (n = 32) (mean 92.3, 95% CI 81 to 103).
Intellectual quotient (IQ)
PB versus controls (women without epilepsy)
Thomas 2007 collected IQ data in children exposed to PB (n=14) mean 86.2, SD 11, P value not reported) however they did not make a direct statistical comparison to control children (n= 201) (mean 93, SD 14.4).
Autistic spectrum disorder
No studies were identified.
Specific cognitive abilities
Thomas 2007 reported on the language abilities of 14 children exposed to PB (mean 70.6, SD 9, P = 0.146) however they did not make a direct comparison to control children, whose overall language mean was not reported.
Dose of PB
No studies reported on dose of PB and child DQ or IQ.
Neurodevelopmental outcomes of children exposed to primidone (PRM) in comparison to control children
Few studies reported on exposure to primidone in isolation from other treatments and only one included study assessed cognitive outcomes in children exposed to monotherapy primidone (GERMAN Study).
Developmental quotient (DQ)
Only one study investigated DQ in PRM exposed infants in comparison to controls. The GERMAN Study reported a non‐significant difference between 15 PRM exposed infants (mean 105.7, SD 13, P value not reported) and 15 matched controls (mean 110.1, SD 10).
Intellectual quotient (IQ)
PRM versus controls (women without epilepsy)
In the GERMAN Study, 15 cases exposed to PRM (mean 92.6, SD 2, P = 0.033) did not differ from control children representative of the general population (mean 105.4, SD 11).
Autistic spectrum Disorder
No studies were identified.
Specific cognitive abilities
No studies were identified.
Dose of PRM
No studies investigated dose of PRM and child neurodevelopment.
Neurodevelopmental outcomes of children exposed to topiramate (TPM) in comparison to control children
Only a single article was identified which assessed the neurodevelopment of children exposed to topiramate (Rihtman 2012).
Developmental quotient (DQ)
No studies were identified.
Intellectual quotient (IQ)
TPM versus controls (women without epilepsy)
The article by Rihtman 2012 included just nine TPM exposed children of which only six were offsprings of mothers with epilepsy. Global cognitive ability was assessed using the Stanford‐Binet fifth edition and the authors reported a significant difference between the nine TPM exposed children and 18 control children in terms of global cognitive ability (TPM mean 96.33, SD 10.37 versus control mean 111.39, SD 12.20, P = 0.005).
Autistic spectrum disorder
No studies were identified.
Specific cognitive abilities
In the article by Rihtman 2012 a large number of specific cognitive abilities were assessed. The children exposed to TPM (n = 9) were found to differ significantly from control children (n = 18) on a task of visual perception (TPM mean 92.00, SD 13.73 versus control mean 110.41, SD 15.88, P = 0.010), tasks of motor control (TPM mean 78.56, SD 17.36 versus control mean 101.47, 16.82, P = 0.005), general co‐ordination (TPM mean 20.71, SD 4.15 versus control mean 23.57, SD 2.47, P = 0.035), fine motor performance (TPM mean 6.78, SD 1.86 versus control mean 9.00, SD 2.14, P = 0.016) and also on gross motor performance (TPM mean 7.78, SD 2.44 versus 10.72, SD 3.49, P = 0.043). No significant differences were found on tasks of visual motor integration (TPM mean 95.56, SD 9.79 versus control mean 106.83, SD 16.94, P = 0.067), control during motor movement (TPM 20.14, SD 5.27 versus control mean 22.28, SD 3.56, P = 0.380) or on fine motor perceptual abilities (TPM mean 22.86, SD 2.79 versus control mean 23.86, SD 1.96, P = 0.300).
Neurodevelopmental outcomes of children exposed to sodium valproate (VPA) in comparison to control children
Ten studies investigated the cognitive abilities of children exposed to VPA in comparison to a control group (Bromley 2010; Bromley 2013; Cummings 2011/2013; Gaily 2004; GERMAN Study; Jackson 2013; Rihtman 2013; Shallcross 2011; Thomas 2007; Thomas 2008).
Developmental quotient (DQ)
VPA versus controls (women without epilepsy)
Three studies made comparisons between children exposed to VPA and children born to women who did not have epilepsy (Bromley 2010; Cummings 2011/2013; GERMAN Study). The GERMAN Study measured neurodevelopment with the Bayley Scales of Infant and Toddler Development and found a significant difference between nine VPA exposed (mean 103.5, SD 11, P = 0.01) and nine matched control children (mean 116.8, SD 11). In a larger sample, Bromley 2010 demonstrated a significant difference between the VPA exposed (n = 42) (mean 92, 95% CI 87 to 96, P < 0.001) and control children (n = 230) (mean 100, 95% CI 99 to 102) for early development measured by the Griffiths Mental Development Scales.
VPA versus controls (women with epilepsy not taking AEDs)
The pooled results from two studies measuring neurodevelopment with the Bayley Scales of Infant and Toddler Neurodevelopment (Jackson 2013; Thomas 2008) found VPA exposed children (n = 123) to have a significantly lower development in comparison to children born to mothers with epilepsy not taking AEDs (n = 58) with a MD of ‐8.72 (95% CI ‐14.31 to ‐3.31, P = 0.002, I2 = 0%) (Analysis 4.2).
4.2. Analysis.
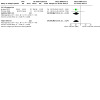
Comparison 4: VPA versus controls (women with epilepsy, no AED treatment), Outcome 2: Development (Bayley)
Using the Griffiths Mental Development Scales, children exposed to VPA (mean 92, 95% CI 87 to 96, P value not reported) had significantly poorer DQ than children born to women with epilepsy untreated (mean 104, 95% CI 101 to 108) (Bromley 2010).
Shallcross 2011, demonstrated significantly poorer neurodevelopment in a VPA (n = 44) (mean 82.2, SE 2.5, P < 0.001) group recruited from the UK Epilepsy and Pregnancy Register in comparison to control children (n = 97) (mean 99.0, SE 1.4). However, this control group overlapped with that of Bromley 2010 and therefore was not included in the meta‐analysis.
Intellectual quotient (IQ)
VPA versus controls (women without epilepsy)
The pooled estimate from three studies, one prospective study (Bromley 2010) and two register studies (Gaily 2004; Thomas 2007), found a significant MD of ‐8.94 (‐11.96 to ‐5.92, P < 0.00001, I2 = 88%) finding VPA exposed children (n = 76) to have poorer levels of neurodevelopment in comparison to control children (n = 552) (Analysis 3.3). Variance was high between the studies included in this meta‐analysis (I2 = 88%) and visual inspection of the plot indicated that this was due to the small study of Thomas 2007 where the results, based on only 12 cases, were in the opposite direction to those of the other included studies, reporting a higher mean for the small VPA group in comparison to the controls. A random‐effects model analysis was undertaken and gave an MD of ‐5.28 (95% CI ‐15.54 to 4.97, P = 0.31), which altered the significance of the results. However, the forest plot clearly indicated that the Thomas 2007 study was in contradiction to the other four studies and therefore a sensitivity analysis without this study showed a significant MD of ‐11.42 (‐14.68 to 8.15, P < 0.00001), altering the I2 statistic to 2% and indicating little variance between the other studies.
3.3. Analysis.
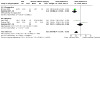
Comparison 3: VPA versus controls (women without epilepsy), Outcome 3: IQ
Rihtman 2013 also compared VPA exposed children to control children using the Standford Binet, fifth Edition, however 21% were not born to women with epilepsy and therefore this data could not be combined in a meta‐analysis. It was of note that the mean dose of VPA was low (546.3 mg daily), probably reflecting its use for a non‐epilepsy indication in this paper. In the comparison of the 30 VPA exposed children to 52 control children Rihtman 2013 reported no significant differences in terms of global IQ (VPA mean 103.93, SD 10.00 versus control mean 108.71, SD 10.20, P > 0.05).
VPA versus controls (women with epilepsy not taking AEDs)
Four studies contributed to the pooled estimates for child IQ in those exposed to VPA compared to the offspring of women with untreated epilepsy (Bromley 2010; Eriksson 2005; Gaily 2004; Thomas 2007). Meta‐analysis found a significant MD of ‐8.17 (95% CI ‐12.80 to ‐3.55, P = 0.0005, I2 = 27%) with VPA (n = 89) exposed children having a lower IQ than controls (n = 87) (Analysis 4.3).
4.3. Analysis.
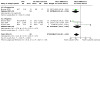
Comparison 4: VPA versus controls (women with epilepsy, no AED treatment), Outcome 3: IQ
Autistic spectrum disorder
Three studies reported on the prevalence of autistic spectrum diagnosis in groups of children exposed to VPA (Bromley 2013; Cummings 2011/2013; Eriksson 2005). In the largest study, the prevalence of autistic spectrum diagnosis was 8% in the VPA exposed group compared to 1.8% in the general population controls (n = 210) (Bromley 2013) in six year olds. Cummings 2011/2013 noted a 12% prevalence of autistic spectrum disorder in the group exposed to VPA. Finally, Eriksson 2005 reported two cases from 15 (15.4%) who had autistic and regressive behavioural features suggestive of low intelligence in children aged 6 to 13 years. Meta‐analysis was not possible due to the variance in the way these data were collected. Veiby 2013 analysed parental reports of autistic symptomology at 18 and 36 months of age. At 18 months the children exposed to VPA (n = 25) were not reported to be at a significantly higher risk based on an autism checklist (VPA 8.3% versus 10.0%, OR 1.0, 95% CI 0.2 to 4.5, P > 0.05) or on a measure of autistic traits (VPA 0% versus 0.5%, OR could not be calculated) in comparison to control children (n = 221). Consistently, at 36 months parents did not report the children exposed to VPA (n = 19) to be at an increased risk of autistic traits (VPA 5.6% versus 0.7%, OR 3.7, 95% CI 0.5 to 28.4, P > 0.05) in comparison to control children (n = 154).
Specific cognitive abilities
The VIQ abilities of VPA exposed children (n = 64) were significantly poorer than general population control children (n = 351) in the pooled estimates from two studies (Bromley 2010; Gaily 2004) with a MD of ‐11.39 (95% CI ‐14.68 to ‐8.10, P < 0.00001, I2 = 0%) (Analysis 3.6). Consistently, in comparison to no treatment controls (n = 83) the VIQ was demonstrated to be significantly lower for children exposed to VPA (n = 77) (MD ‐8.81 95% CI ‐13.32 to ‐4.30, P = 0.0001, I2 = 0%) (Analysis 4.6). For PIQ, children exposed to VPA (n = 64) had significantly poorer abilities (MD ‐10.48, 95% CI ‐13.94 to ‐7.02, P < 0.00001, I2 = 68%) compared to general population controls (n = 392) based on the pooled estimates from these two studies (Bromley 2010; Gaily 2004) (Analysis 3.7). This was consistent with the pooled estimates for PIQ for children exposed to VPA (n = 77) in comparison to no treatment controls (n = 83) (MD ‐7.20, 95% CI ‐12.44 to ‐1.96, P = 0.007, I2 = 12%) based on three studies (Bromley 2010; Eriksson 2005; Gaily 2004) (Analysis 4.7). Due to high heterogeneity a random‐effects model analysis was performed for women on VPA versus women without epilepsy for the PIQ results and gave a significant MD of ‐12.11 (95% CI ‐19.66 to ‐4.55, P = 0.002), which did not alter the significance of the overall estimate. The data from Rihtman 2013 were not included in the meta‐analysis (due to inclusion of psychiatric indications) but the VIQ and PIQ were assessed and reported and were not in agreement with the meta‐analysis results. In the Rihtman 2013 study no significant difference was reported for VIQ (VPA mean 101.38, SD 11.73 versus 105.27, SD 11.76, P < 0.05) or PIQ (VPA mean 106.59, SD 10.32 versus 112.06, SD 11.02, P < 0.05) for the children exposed to VPA (n = 29) in comparison to children born to women without epilepsy (n = 52).
3.6. Analysis.
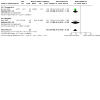
Comparison 3: VPA versus controls (women without epilepsy), Outcome 6: VIQ
4.6. Analysis.
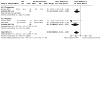
Comparison 4: VPA versus controls (women with epilepsy, no AED treatment), Outcome 6: VIQ
3.7. Analysis.
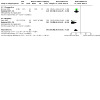
Comparison 3: VPA versus controls (women without epilepsy), Outcome 7: PIQ
4.7. Analysis.

Comparison 4: VPA versus controls (women with epilepsy, no AED treatment), Outcome 7: PIQ
To date few studies have consistently investigated specific cognitive ability types in comparison to a control group or shared a control group (in the case of Bromley 2010 and Shallcross 2011) and therefore meta‐analysis was not possible.
In terms of early gross motor development, Bromley 2010 found that the children exposed to VPA were significantly poorer on motor abilities than general population control children (VPA mean 91, 95% CI 86 to 96 versus control mean 98, 95% CI 97 to 100, P = 0.015). VPA exposed infants taking part in the Kerala Pregnancy Register had high rates of motor delay (38%); however no statistical comparison to the no medication control group was reported (Thomas 2008). At the later assessment of the Shallcross 2011 cohort, children exposed to VPA (n = 45) performed significantly less well on tasks of motor development (VPA mean 96.6, SD 22.1 versus control mean 110.9, SD 20.1, P = 0.001). In school aged children, Rihtman 2013 reported poorer gross motor function (VPA mean 31.30, SD 24.18 versus control mean 49.92, SD 28.29, P < 0.05) and poorer motor control (VPA mean 25.54, SD 26.54 versus control mean 51.53, SD 25.26, P < 0.05) in VPA exposed children (n = 29) in comparison to children born to women without epilepsy (n = 30).
Early language development was assessed by a number of studies in comparison to control children. Bromley 2010 found the language skills of VPA exposed children to be poorer than control children born to women without epilepsy (VPA mean 97, 95% CI 92 to 103 versus control mean 105, 95% CI 103 to 106, P=0.008) and in comparison to children born to women with untreated epilepsy (control mean 109, 95% CI 105 to 114, P value not reported). Consistently, Shallcross 2011 used the same measure and also found poorer language development in children exposed to VPA (VPA 84.9, SE 2.7 versus control mean 101.3, SE 1.6, P ≤ 0.001). When children in the Shallcross 2011 cohort were assessed later at between three and four years of age, the children exposed to VPA were still significantly poorer in terms of language comprehension abilities (VPA mean 44.0, SD 16.1 versus control mean 52.2, SD 9.6, P = 0.003) but did not differ from control children on expressive language abilities (VPA mean 43.1, SD 15.9 versus control mean 46.6, SD 10.2, P = 0.9), although we noted that the language assessment measure was different at this reassessment (Reynell Language Scales). Thomas 2007 investigated the language development of children exposed to VPA in comparison to control children; however, no direct statistical comparison was reported between these groups. Finally, verbal dysfunction was present in three of 15 cases (23%) in the small cohort of Eriksson 2005 in comparison to a single case in the control group (7.7%).
The social abilities of infants were assessed in two studies. Bromley 2010 found that young children exposed to VPA had poorer social abilities (VPA mean 90, 95% CI 85 to 95 versus control mean 97, 95% CI 95 to 98, P = 0.003); with Shallcross 2011 also reporting this association in children under the age of two years (VPA mean 87.9, SE 2.9 versus control mean 98.2, SE 1.6, P = 0.001). Reassessment of the Shallcross 2011 cohort at between three and four years of age showed continuing poorer early social development (VPA mean 108.4, SD 21.4 versus control mean 119.9, SD 16.3, P = 0.002).
One study reported significantly poorer hand and eye co‐ordination in children exposed to VPA (n = 42) (VPA mean 89, 95% CI 84 to 95 versus control mean 101, 95% CI 98 to 103, P < 0.001) (Bromley 2010), which was consistent with the report of increased fine motor difficulties reported by Rihtman 2013 in 30 VPA exposed children (VPA mean 24.57, SD 18.74 versus control mean 43.08, SD 21.17, P < 0.05). However, assessment of the Shallcross 2011 cohort failed to find a significant difference between VPA exposed children (n = 40) and control children (n = 96) for hand and eye co‐ordination at the younger age assessment (under two years of age) (VPA mean 95.4, SE 2.9 versus control mean 97.6, SE 1.9, P = 1.00) or at the older age assessment (VPA mean 102.1, SD 17.7 versus control mean 103.3, SD 15.6, P = 0.9).
Finally, two studies investigated non‐verbal reasoning in children under the age of two years using the Griffths Mental Development Scales (Bromley 2010; Shallcross 2011), with both finding a poorer level of performance for the children exposed to VPA (Bromley 2010: VPA mean 92, 95% CI 87 to 97 versus control mean 102, 95% CI 100 to 104, P < 0.001; Shallcross 2011: VPA mean 93.5, SE 3.3 versus control mean 101.6 SE 1.8, P=0.040). At the reassessment of the Shallcross 2011 cohort later in childhood, however, the non‐verbal abilities of the children exposed to VPA were comparable to the control children (VPA mean 111.4, SD 23.1 versus control mean 110.5, SD 16.3, P = 0.6).
VPA versus controls: prevalence of below average performance
For VPA in comparison to controls, although a number of studies reported the prevalence of DQ performance below the average range, meta‐analysis was limited due to heterogeneity across methodologies. Based on two studies the meta‐analysis demonstrated a significantly increased risk of below average performance (RR 10.33, 95% CI 2.05‐52.01, P = 0.005, I2 = 0%) (Bromley 2010, Eriksson 2005). The study by Cummings 2011/2013 also reported a significant increase in the number of children with below average performance (1 SD) among the 58 valproate exposed children (39.6%) in comparison to 44 controls (4.5%) with a significant OR of 26.1 (95% CI 4.9 to 139; P < 0.001). Consistently, Bromley 2010 demonstrated a significantly increased risk of performance 1 SD below the mean for children exposed to VPA (n = 42, 29%) in comparison to general population controls (n = 230, 8%) and control children born to women with and untreated epilepsy (n = 27, 7%). Using parent completed questionnaires to rate child development at six months, Veiby 2013 reported no significant difference between the children exposed to VPA (n = 27) and control children (n = 276) for the prevalence of below average performance on gross motor development (VPA 7.4% versus control 9.8%, OR 0.7, 95% CI 0.2 to 2.8, P > 0.05), fine motor development (VPA 11.5% versus control 6.9%, OR 2.1, 95% CI 0.6 to 7.3, P > 0.05) or early social development (VPA 3.7% versus control, OR 0.3, 95% CI 0.1 to 2.4, P > 0.05). At 18 months, Veiby 2013 reported significant differences for the VPA exposed children (n = 25) in comparison to control children (n = 221) with regards to rates of impairment in gross motor skills (VPA 16% versus control 3.2%, OR 7.0, 95% CI 2.4 to 21.0, P < 0.05) but not on measures of fine motor skills (VPA 4.0% versus control 5.1%, OR 1.3, 95% CI 0.2 to 9.7, P > 0.05) or personal or social skills (VPA 0% versus control 0.9%, OR could not be calculated). Parents were asked to rate their child again at 36 months when the children exposed to VPA were rated to be at risk of poor sentence skills (VPA 15.8% versus 3.9%, OR 3.4, 95% CI 1.0 to 12.0, P < 0.05) but not for difficulties with gross motor development (VPA 10.5% versus 3.3%, OR 3.4, 95% CI 0.8 to 14.9, P > 0.05), fine motor development (VPA 5.6% versus control 5.6%, OR 1.7, 95% CI 1.7 0.2 to 13.1, P > 0.05) or communication skills (VPA 10.5% versus 1.3%, OR 3.5, 95% CI 0.8 to 15.4, P > 0.05).
Dose of VPA
It was consistently reported that higher levels of VPA were associated with poorer levels of global neurodevelopment (Bromley 2010; Gaily 2004; Jackson 2013; NEAD Study). Most commonly, doses of 800 to 1000 mg daily were reportedly associated with increasing levels of risk. It was of note that the mean dose of VPA in the Rihtman 2013 study (mean dose 546.3 mg daily) was considerably below this level and may have accounted for the differences in findings between this study and the majority of other included studies. In addition to a relationship between dose and global cognitive abilities, the studies of Nadebaum 2011 and the NEAD Study group also demonstrated a dose relationship between higher VPA doses and poorer language skills. Thomas 2008 reported a relationship between dose of VPA and infant motor ability. However, not all studies replicated this association between dose and ability (Shallcross 2011).
AED versus AED comparisons across neurodevelopmental outcomes
CBZ versus VPA
A total of nine studies investigated the abilities of children exposed to CBZ and VPA (Bromley 2010; Cummings 2011/2013; Eriksson 2005; Gaily 2004; GERMAN Study; Jackson 2013; NEAD Study; Thomas 2008; Thomas 2007).
Developmental quotient (DQ)
Four studies were prospective and used the Bayley Scales of Infant and Toddler Development (GERMAN Study; Jackson 2013; NEAD Study; Thomas 2008). The pooled estimates suggested a higher mean score for CBZ (n = 210) compared to VPA (n = 160) but this was not statistically significant (MD 4.16, 95% CI ‐0.21 to 8.54, P = 0.06, I2 = 5%) (Analysis 17.1). Only one identified study used the Griffiths Mental Development Scales (Bromley 2010) and found a significantly poorer outcome for children exposed to VPA (n = 42) (mean 92, 95% CI 87 to 96, P = 0.028) in comparison to those exposed to CBZ (n = 48) (mean 98, 95% CI 94 to 103).
17.1. Analysis.
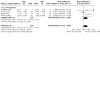
Comparison 17: CBZ versus VPA, Outcome 1: Development (Bayley)
Intellectual quotient (IQ)
Two prospective studies (Bromley 2010; NEAD Study) and three registry studies (Eriksson 2005; Gaily 2004; Thomas 2007) assessed IQ in children exposed to CBZ or VPA. The pooled estimate found a higher mean score for children exposed to CBZ (n = 191) in comparison to VPA exposed children (n = 112) (MD 8.69, 95% CI 5.51 to 11.87, P < 0.00001, I2 = 43%) (Analysis 17.2).
17.2. Analysis.
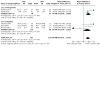
Comparison 17: CBZ versus VPA, Outcome 2: IQ
Autistic spectrum disorders
Three studies investigated the prevalence of autistic spectrum disorder in children exposed to either CBZ or VPA (Bromley 2013; Cummings 2011/2013; Eriksson 2005). In one study the presence of autistic and regressive behavioural features were reported for 2/13 (15.4%) of children exposed to VPA, with no such cases in the CBZ exposed children (Eriksson 2005). Bromley 2013 reported an increased prevalence of autistic spectrum disorders with VPA (4/50, 8%) in comparison to CBZ (0/50, 0%). In this study the diagnoses were made independent of the study team, through routine clinical services. An unpublished data set was provided (Cummings 2011/2013), which reported consistent data in the two studies above (VPA 8/58, 13.7% and CBZ 3/49, 6.1%, P value not available). Meta‐analysis was not carried out due to variations in the methodologies of these studies.
Specific cognitive abilities
The meta‐analysis of VIQ was based on three studies (Bromley 2010; Eriksson 2005; Gaily 2004) as the NEAD Study did not report VIQ isolated from other language measures (Analysis 17.3). A significant MD of 8.44 (95% CI 4.21 to 12.66, P < 0.00001, I2 = 0%) was found favouring the VIQ outcome for children exposed to CBZ (n = 149) in comparison to those exposed to VPA (n = 77). Meta‐analysis using the same studies but regarding the PIQ abilities of children exposed to CBZ (n = 149) and VPA (n = 77) also found a significant MD of 10.48 (95% CI 6.02 to 14.94, P < 0.00001, I2 = 0%) with children exposed to CBZ performing better (Analysis 17.4).
17.3. Analysis.
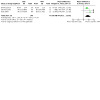
Comparison 17: CBZ versus VPA, Outcome 3: VIQ
17.4. Analysis.
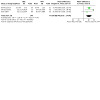
Comparison 17: CBZ versus VPA, Outcome 4: PIQ
Due to heterogeneity in the investigation of specific cognitive abilities a meta‐analysis was not possible.
At three years of age, the NEAD Study reported the specific cognitive abilities of children exposed to CBZ in comparison to children exposed to VPA on a verbal and non‐verbal index. The verbal index included a naming vocabulary task, a verbal comprehension task, an expressive communication task, an auditory comprehension task and a picture naming task. The children exposed to VPA (n = 43) were reported to have a significantly poorer verbal index than the children exposed to CBZ (n = 59) (CBZ mean 93.0, 95% CI 88.6 to 97.3 versus VPA mean 83.9, 95% CI 78.8 to 89.0, P value not reported). On the non‐verbal index, no significant difference was found between the CBZ exposed children and the VPA exposed children (CBZ mean 99.6, 95% CI 95.0 to 104.2 versus VPA mean 98.5, 95% CI 93.1 to 103.8, P value not reported). At six years of age, the NEAD Study noted significant differences between the memory (CBZ (n = 61) mean 104, 95% CI 100 to 108 versus VPA (n = 49) mean 92, 95% CI 87 to 98, P = 0.0010) and language (CBZ mean 104, 95% CI 102 to 107 versus VPA mean 97, 95% CI 94 to 100, P = 0.005) abilities of the children exposed to VPA, with non‐significant differences for CBZ exposed children in comparison to VPA exposed children for non‐verbal abilities (CBZ mean 104, 95% CI 102 to 107 versus VPA mean 101, 95% CI 98 to 104, P = 0.08) and executive abilities (CBZ mean 105, 95% CI 103 to 108 versus VPA mean 101, 95% CI 98 to 104, P = 0.11).
Nadebaum 2011, assessed global language development in 23 VPA exposed children in comparison to 34 children exposed to CBZ. The number of children considered to have language delay varied (30.4% VPA exposed children versus 17.6% in the CBZ exposed children) but a significant difference was not found between the group means.
CBZ versus VPA: prevalence of below average performance
A comparison of below average performance for children exposed to VPA and children exposed to CBZ, from three studies using the Bayley Scales of Infant and Toddler Development (DQ) (Jackson 2013; NEAD Study; Thomas 2008), found a non‐significant RR of 0.83 (95% CI 0.62 to 1.12, P = 0.22, I2 = 0%). This was based on 152 VPA exposed children and 211 CBZ exposed children for performance 1 SD below the mean (Analysis 17.5). The pooled estimate for performance 2 SDs below the mean gave a non‐significant RR of 0.77 (95% CI 0.38 to 1.58, P = 0.47, I2 = 17%) based on 81 VPA exposed children and 110 CBZ exposed children (Jackson 2013; NEAD Study) (Analysis 17.6).
17.5. Analysis.
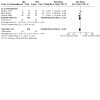
Comparison 17: CBZ versus VPA, Outcome 5: DQ>1SD
17.6. Analysis.

Comparison 17: CBZ versus VPA, Outcome 6: DQ>2SD
In older children whose abilities were measured by IQ the pooled estimate from three studies (Bromley 2010; Eriksson 2005; NEAD Study) provided a statistically significant RR of 0.40 (95% CI 0.19 to 0.83, P = 0.01, I2 = 0%) based on 91 CBZ exposed children and 87 VPA exposed children for prevalence of performance 1 SD from the mean, showing that VPA exposed children had a higher rate of below average performance (Analysis 17.8). The more severe level of IQ impairment (2 SDs from the mean) was reported by four studies (Bromley 2010; Eriksson 2005; Gaily 2004; NEAD Study) with a non‐significant RR of 0.26 (95% CI 0.05 to 1.19, P = 0.08, I2 = 0%) based on 177 CBZ exposed children and 100 VPA exposed children (Analysis 17.7).
17.8. Analysis.
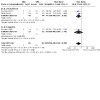
Comparison 17: CBZ versus VPA, Outcome 8: IQ>1SD
17.7. Analysis.
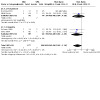
Comparison 17: CBZ versus VPA, Outcome 7: IQ>2SD
CBZ versus LTG
Four studies investigated the abilities of both children exposed to CBZ and to LTG (Bromley 2010; Cummings 2011/2013; Nadebaum 2011).
Developmental quotient (DQ)
Two studies assessed the neurodevelopment of children exposed to either CBZ or LTG using the Bayley Scales of Infant and Toddler Development (Cummings 2011/2013; NEAD Study). Cummings 2011/2013 reported child neurodevelopment scores on the Bayley Scales of Infant and Toddler Development in conjunction with scores collected on the Griffiths Mental Development Scales and therefore meta‐analysis was not possible. The NEAD Study reported that the neurodevelopment of children exposed to CBZ (n = 43, mean 94, SD 15) was not significantly different from those exposed to LTG at two years of age (n = 57, mean 97, SD 17, P value not reported).
Two studies measured infant neurodevelopment with the Griffiths Mental Development Scales (Bromley 2010; Cummings 2011/2013). Bromley 2010 noted no significant difference between the children exposed to CBZ (n = 48, mean 98, 95% CI 94 to 103) and those exposed to LTG (n = 34, mean 99, 95% CI 94 to 103), however these data overlapped in part with the NEAD Study.
Intellectual quotient (IQ)
Two studies assessed the IQ of children exposed to CBZ and LTG (Bromley 2010; NEAD Study). These studies overlapped in part and meta‐analysis was conducted utilising only the additional UK children who had not been reported as part of the NEAD study. Pooled estimates gave a non‐significant MD of ‐1.62 (95% CI ‐5.44 to 2.21, P = 0.41, I2 = 0%) when comparing 78 children exposed to CBZ and 84 LTG exposed children from two studies (Bromley 2010; NEAD Study) (Analysis 12.2).
12.2. Analysis.
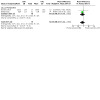
Comparison 12: CBZ versus LTG, Outcome 2: IQ
Autistic spectrum disorders
No significant differences between the rates of autistic spectrum disorder were reported in the study by Bromley 2013. No cases (0%) were found in this study from 50 CBZ exposed children and 30 LTG exposed children at six years of age. Unpublished data provided by Cummings 2011/2013 reported a 6.1% prevalence (3/49) for CBZ in comparison to 0% prevalence for those exposed to LTG (0/35).
Specific cognitive abilities
Only the NEAD Study assessed and reported on specific cognitive abilities of children exposed to CBZ and children exposed to LTG. A verbal index was created by the authors and included a naming vocabulary task, a verbal comprehension task, an expressive communication tasks, an auditory comprehension task and a picture naming task. At three years of age the children exposed to CBZ (n = 59) did not differ significantly from the children exposed to LTG (n = 70) on this verbal index (CBZ mean 93.0, 95% CI 88.6 to 97.3, P value not reported). A non‐verbal index was also created based on a block design task and a task of visual‐motor integration. The children exposed to CBZ did not differ from the children exposed to LTG on this non‐verbal index (CBZ mean 99.6, 95% CI 95.0 to 104.2 versus LTG mean 106.3, 95% CI 101.7 to 110.9, P value not reported). At six years of age a comprehensive assessment of a range of cognitive abilities was undertaken. No differences were found between the CBZ exposed children (n = 61) and the LTG exposed children (n = 74) on tasks of memory (CBZ (n = 61) mean 104, 95% CI 100 to 108 versus LTG (n = 74) mean 106, 95% CI 102 to 110, P value not reported), language (CBZ mean 104, 95% CI 102 to 107 versus LTG mean 105, 95% CI 102 to 107, P value not reported) and executive functioning (CBZ mean 105, 95% CI 103 to 108 versus LTG mean 107, 95% CI 104 to 109, P value not reported).
Rates of language impairment were higher for children exposed to CBZ (n = 34, 17.6%) but were not significantly different from the rates in children exposed to LTG (n = 9, 0%); the numbers were small and the difference was not statistically significant in the study by Nadebaum 2011.
CBZ versus LTG: prevalence of below average performance
The pooled estimate for DQ performance 1 SD below the mean demonstrated no significant difference in the frequency of performance in this range for children exposed to CBZ (n = 76) in comparison to children exposed to LTG (n = 83) (RR 2.28, 0.63 to 8.22, P = 0.21, I2 = 0%) from two studies (Bromley 2010; NEAD Study) (Analysis 12.3).
12.3. Analysis.
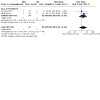
Comparison 12: CBZ versus LTG, Outcome 3: IQ>1SD
CBZ versus PHT
Developmental quotient (DQ)
Pooled results from four identified studies (GERMAN Study; NEAD Study; Rovet 1995; Thomas 2008) using the Bayley Scales of Infant and Toddler Development found a non‐significant MD of 3.02 (95% CI ‐2.41 to 8.46, P = 0.28, I2 = 0%) for 172 CBZ exposed children in comparison to 87 PHT exposed children (Analysis 13.1). Wide 2002 compared the development of 35 children exposed to CBZ (mean 618, 95% CI unclear) to 15 children exposed to PHT (mean 635, 95% CI unclear) and failed to find a significant difference for overall cognitive ability.
13.1. Analysis.
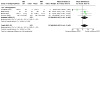
Comparison 13: CBZ versus PHT, Outcome 1: Development (Bayley)
Intellectual quotient (IQ)
A non‐significant MD was noted for CBZ (n = 75) in comparison to PHT (n = 45), with an MD of ‐3.30 (95% CI ‐7.91 to 1.30, P = 0.16, I2 = 0%), with data coming from two studies (NEAD Study; Thomas 2007) (Analysis 13.2).
13.2. Analysis.
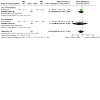
Comparison 13: CBZ versus PHT, Outcome 2: IQ
Autistic spectrum disorders
No studies reported rates of autistic spectrum disorder in these two AED groups simultaneously.
Specific cognitive abilities
The NEAD Study assessed the verbal and non‐verbal cognitive abilities of children exposed to CBZ in comparison to those exposed to PHT. A verbal index was created by the authors which included a number of language tasks. At three years of age the tasks included in this index were a naming vocabulary task, a verbal comprehension task, an expressive communication tasks, an auditory comprehension task and a picture naming task. The children exposed to CBZ (n = 59) were not significantly different from the children exposed to PHT (n = 39) on this verbal index (CBZ mean 93.0, 95% CI 88.6 to 97.3 versus PHT mean 95.9, 95% CI 91.0 to 100.8, P value not reported). A non‐verbal index was created and included a block design task and a task of visuomotor integration. Consistently, the children exposed to CBZ did not differ from the PHT exposed children on the non‐verbal index (CBZ mean 99.6, 95% CI 95.0 to 104.2 versus PHT mean 102.0, 95% CI 96.9 to 107.2, P value not reported). Reassessment of this cohort at six years of age also found no significant differences between children exposed to CBZ and those exposed to PHT on measures of verbal, (CBZ (n = 61) mean 104, 95% CI 102 to 107 versus PHT (n = 40) mean 106, 95% CI 102 to 109), non‐verbal (CBZ mean 104, 95% CI 102 to 107 versus PHT mean 106, 95% CI 103 to 109), memory (CBZ mean 104, 95% CI 100 to 108 versus PHT mean 101, 95% CI 96 to 107) and executive functioning skills (CBZ mean 105, 95% CI 103 to 108 versus PHT 103, 95% CI 100 to 106) at six years of age.
In a linked paper to Rovet 1995, increased rates of expressive language dysfunction in the children exposed to PHT (n = 26, 23%) were reported in comparison to CBZ exposed children (n = 28, 6.7%). Wide 2002 found no significant differences between children exposed to CBZ (n = 35) and children exposed to PHT (n = 15) on tasks of motor (CBZ mean 104, 95% CI unclear versus PHT mean 98, 95% CI unclear, P > 0.05), social (CBZ mean 107, 95% CI unclear versus PHT mean 105, 95% CI unclear, P > 0.05), language (CBZ mean 105, 95% CI unclear versus PHT mean 111, 95% CI unclear, P > 0.05), hand and eye co‐ordination (CBZ mean 100 95% CI unclear versus PHT mean 101, 95% CI unclear, P > 0.05) and practical reasoning ability (CBZ mean 101, 95% CI unclear versus PHT mean 110, 95% CI unclear, P > 0.05).
CBZ versus PHT: prevalence of below average performance
The prevalence of children exposed to CBZ falling below 1 SD from the mean was not significantly increased compared to PHT exposed infants (RR 0.78, 95% CI 0.52 to 1.15, P = 0.21, I2 = 0%) based on 149 CBZ and 149 PHT exposed children (NEAD Study; Thomas 2008) (Analysis 13.3).
13.3. Analysis.
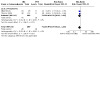
Comparison 13: CBZ versus PHT, Outcome 3: DQ>1SD
VPA versus LTG
Four studies were identified that made comparisons between children exposed to VPA and LTG (NEAD Study; Bromley 2010; Cummings 2011/2013; Rihtman 2013).
Developmental quotient (DQ)
The NEAD Study reported a significant difference between children exposed to VPA (n = 28, mean 85, SD 19) and those exposed to LTG (n = 57, mean 97, SD 17) when neurodevelopment was assessed using the Bayley Scales of Infant and Toddler Development.
Cummings 2011/2013, used both the Bayley and Griffiths Scales and found differing levels of below average performance for those exposed to VPA (39.6%) and those exposed to LTG (2.9%); however, the data were not in a format in which they could be utilised in a meta‐analysis.
Intellectual quotient (IQ)
At six years of age, the NEAD Study found that children exposed to VPA (n = 49, mean 98, SD 10) had significantly poorer scores compared to children exposed to LTG (n = 74, mean 108, SD 13). The pooled estimate from the NEAD Study and Bromley 2010, in six year old children, produced a significant MD of ‐10.79 (95% CI ‐14.41 to ‐7.17, P < 0.00001, I2 = 0%) for 74 VPA exposed children in comparison to 84 LTG exposed children (Analysis 14.2).
14.2. Analysis.

Comparison 14: VPA versus LTG, Outcome 2: IQ
Rihtman 2013 also assessed the IQ of children exposed to VPA and children exposed to LTG, however their study included women taking these medications for indications other than epilepsy and therefore this data was not included in the meta‐analysis. In contrast to the data reported from the NEAD Study, Bromley 2010 and the meta‐analysis, Rihtman 2013 failed to find a significant difference between the IQ of children exposed to VPA (n = 29) and those exposed to LTG (n = 41).
Autistic spectrum disorders
Two identified studies, one published (Bromley 2013) and one with unpublished data (Cummings 2011/2013), reported rates of community diagnoses of autistic spectrum disorders for children exposed to VPA or LTG. In the study by Bromley 2013 no diagnoses of autistic spectrum disorder were reported for the LTG exposed group (n = 30) whilst the prevalence in the VPA exposed group was 8% (4/50). Consistently, there were no cases of autistic spectrum disorder in the group exposed to LTG (n = 35) with the VPA group prevalence at 13.7% (8/58) in the study of Cummings 2011/2013.
Specific cognitive abilities
The NEAD Study undertook a comprehensive assessment of specific cognitive abilities at both three and six years of age. A verbal index was created by the authors which included a number of language tasks. At three years of age the tasks included in this index were a naming vocabulary task, a verbal comprehension task, an expressive communication task, an auditory comprehension task and a picture naming task. The children exposed to VPA (n = 43) had significantly poorer scores on the verbal index (VPA mean 83.9, 95% CI 78.8 to 89.0 versus LTG mean 96.6, 95% CI 92.3 to 100.9, P < 0.0001) in comparison to the children exposed to LTG (n = 70). The non‐verbal index included a block building task and a visuomotor integration task and the children exposed to VPA again had poorer scores than the children exposed to LTG (VPA mean 98.5, 95% CI 93.1 to 103.8 versus LTG mean 106.3, 95% CI 101.7 to 110.9, P value not reported). At this age the magnitude of the difference in verbal abilities (MD 12.7) of the VPA exposed children was more than the non‐verbal abilities (MD 7.8 points) when compared to the LTG group. In NEAD Study, the verbal, non‐verbal, memory and executive functioning abilities of children exposed to VPA or LTG were analysed at six years of age. Children exposed to VPA (n = 49) had significantly poorer scores than children exposed to LTG (n = 74) on verbal (VPA mean 97, 95% CI 94 to 100 versus LTG mean 105, 95% CI 102 to 107, P = 0.003), non‐verbal (VPA mean 101, 95% CI 98 to 104 versus LTG mean 108, 95% CI 105 to 110, P = 0.0015), memory (VPA mean 92, 95% CI 87 to 98 versus LTG mean 106, 95% CI 102 to 110, P = 0.003) and executive functioning (VPA 101, 95% CI 98 to 104 versus LTG mean 107, 95% CI 104 to 109, P = 0.0078) skills.
Nadebaum 2011 reported significantly poorer language abilities in children exposed to VPA (n = 23) in comparison to LTG (n = 9) (VPA 30.4% versus LTG 0%, P = 0.025).
Rihtman 2013 failed to find a significant difference between the children exposed to VPA (n = 29) and those exposed to LTG (n = 42) on tasks of visuomotor integration (VPA mean 42.55, SD 27.68 versus LTG mean 53.86, SD 25.54, P > 0.05), visual perception (VPA mean 49.03, SD 31.42 versus LTG mean 42.76, SD 31.85, P > 0.05), motor co‐ordination (VPA mean 25.54, SD 26.54 versus LTG mean 31.18, SD 28.62, P > 0.05), fine motor abilities (VPA mean 24.57, SD 18.74 versus LTG mean 30.57, SD 22.90, P > 0.05) or gross motor ability (VPA mean 31.30, SD 24.18 versus LTG mean 34.78, SD 24.47, P > 0.05) but did not assess language development.
VPA versus LTG: prevalence of below average performance
The pooled estimate based on two studies (Bromley 2010; NEAD Study) gave a significant RR of 4.87 (95% CI 1.50, 15.78, P = 0.008, I2 = 0%) for performance below 1 SD of the mean based on 74 VPA exposed children and 83 LTG exposed children (Analysis 14.3). Children exposed to VPA were therefore found to be at a higher risk of below average performance.
14.3. Analysis.
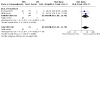
Comparison 14: VPA versus LTG, Outcome 3: IQ>1SD
VPA versus LEV
Only a single study was identified comparing the neurodevelopment of children exposed to VPA in comparison to LEV (Shallcross 2011). Comparisons were made at under two years of age and again at between three and four years of age. However, only 32% of the LEV exposed children and 11% of the VPA exposed children were reassessed at the older age and the remaining proportion of the cohort were newly recruited.
Developmental quotient (DQ)
Using the Griffiths Mental Development Scales, Shallcross 2011 found that children exposed to VPA (n = 44) (mean 87.9, 95% CI 83 to 93, P < 0.001) had a significantly poorer level of global cognitive development in comparison to those exposed to LEV (n = 51) (mean 99.9, 95% CI 97 to 103).
Intellectual quotient (IQ)
No studies were identified.
Autistic spectrum disorders
No studies were identified.
Specific cognitive abilities
In the paper by Shallcross 2011 children exposed to VPA had significantly poorer scores in comparison to LEV exposed children under the age of two years on motor tasks (VPA (n = 44) mean 84.6, 95% CI 79 to 91 versus LEV (n = 51) mean 97.3, 95% CI 94 to 98, P < 0.001), hand and eye co‐ordination (VPA mean 88.2, 95% CI 82 to 94 versus LEV mean 101.8, 95% CI 97 to 106, P = 0.01), non‐verbal skills (VPA mean 88.8, 95% CI 83 to 94 versus LEV mean 101.7, 95% CI 98 to 105, P < 0.001), language (VPA mean 90.4, 95% CI 84 to 97 versus LEV mean 100.5, 95% CI 96 to 104, P = 0.01) and social skills (VPA mean 98.8, 95% CI 84 to 96 versus LEV 98, 95% CI 94 to 102, P = 0.03). Following assessment at between three and four years of age the children exposed to LEV performed significantly better than the children exposed to VPA on tasks of motor development (LEV mean 110.4, SD 17.2 versus VPA mean 96.8, SD 22.1, P = 0.002) and expressive language development (LEV mean 52.0, SD 13.4 versus VPA mean 43.1, SD 15, P = 0.005). No significant differences were found between the LEV exposed and VPA exposed children on social development (LEV mean 116.5, SD 19.1 versus VPA mean 108.4, SD 21.4, P = 0.2), hand and eye co‐ordination skills (LEV mean 104.8, SD 13.9 versus VPA mean 102.1, SD 17.7, P = 0.8), non‐verbal performance skills (LEV mean 109.9, SD 15.4 versus VPA mean 11.4, SD 23.1, P = 0.6), practical reasoning (LEV mean 113.4, SD 16.6 versus VPA mean 108.9, SD 18.8, P = 0.2) and language comprehension ability (LEV mean 49.6, SD 10.3 versus VPA mean 44.0, SD 16.1, P = 0.2) at this older age point.
PHT versus VPA
Four studies investigated the cognitive abilities of children exposed to VPA and PHT (GERMAN Study; NEAD Study; Thomas 2007; Thomas 2008).
Developmental quotient (DQ)
Pooled estimates from the three studies using the Bayley Scales of Infant and Toddler Development (GERMAN Study; NEAD Study; Thomas 2008) found a significant MD of 7.04 (95% CI 0.44 to 13.65, P = 0.04, I2 = 0%), when 80 children exposed to PHT were compared to 108 VPA exposed children. VPA exposed children were found to have significantly poorer early development (Analysis 16.1).
16.1. Analysis.
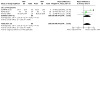
Comparison 16: PHT versus VPA, Outcome 1: Development (Bayley)
Intellectual quotient (IQ)
In school aged children, pooled estimates from two studies (NEAD Study; Thomas 2007) measuring IQ demonstrated a significant MD of 9.25 (95% CI 4.78 to 13.72, P < 0.0001, I2 = 70%), with children exposed to PHT (n = 45) having significantly higher scores than children exposed to VPA (n = 61) (Analysis 16.2). A random‐effects model analysis was carried out for this comparison, due to high heterogeneity, which gave an MD of 6.38 (95% CI ‐4.84 to 17.58, P = 0.27) and the overall estimate became non‐significant.
16.2. Analysis.
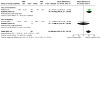
Comparison 16: PHT versus VPA, Outcome 2: IQ
Autistic spectrum disorders
No studies investigated this outcome.
Specific cognitive abilities
In children aged three years of age the NEAD Study reported a significantly poorer verbal ability (as measured by a composite index including a range of language based tasks) for the children exposed to VPA (n = 43) in comparison to those exposed to PHT (n = 39) (VPA mean 83.9, 95% CI 78.8 to 89.0 versus PHT mean 95.9, 95% CI 91.0 to 100.8, P value not reported). In comparison, no significant difference was found between the children exposed to VPA versus those exposed to PHT for their non‐verbal ability (as measured by a non‐verbal index created by the authors) (VPA mean 98.5, 95% CI 93.1 to 103.8 versus PHT mean 102.0, 95% CI 101.7 to 110.9, P value not reported). In the NEAD Study, at six years of age the abilities of children exposed to PHT were found to be superior to those of children exposed to VPA on verbal (PHT (n = 40) mean 106, 95% CI 102 to 109 versus VPA (n = 49) mean 97, 95% CI 94 to 100, P = 0.0005) and memory ability (PHT mean 101, 95% CI 96 to 107 versus VPA mean 92, 95% CI 87 to 98, P = 0.0260) at six years of age. There was no significant difference however in non‐verbal abilities (PHT mean 106, 95% CI 103 to 109 versus VPA mean 101, 95% CI 98 to 104, P = 0.0514) and executive functioning skills (PHT mean 103, 95% CI 100 to 106 versus VPA mean 101, 95% CI 98 to 104, P = 0.28) (NEAD Study).
VPA versus PHT: prevalence of below average performance
A non‐significant RR was demonstrated for VPA exposed children (n = 120) in comparison to PHT exposed children (n = 71) (RR 1.40, 95% CI 0.91 to 2.15, P = 0.12, I2 = 78%) for the prevalence of performance 1 SD below the mean (Analysis 16.3) (NEAD Study; Thomas 2008). Caution is required however, as the findings of these two studies were in the opposite direction, which led to the high I2 statistic.
16.3. Analysis.
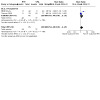
Comparison 16: PHT versus VPA, Outcome 3: DQ>1SD
Sensitivity analysis
There were 44 meta‐analyses that included two or more studies for which heterogeneity could be assessed. There were 34 meta‐analyses containing continuous data measured as the MD. Of these, the I2 was less than 25% in 23 analyses, and 0% in 19 of the analyses. There were three meta‐analyses with an I2 statistic in the range 25% to 50%, seven between 50% and 75%, and one over 75%. Nine meta‐analyses were undertaken on binary data using the RR to investigate the prevalence of below average DQ or IQ. Of these, eight had an I2 statistic less than 25%, all eight were 0%. The remaining I2 statistic was high at 78%. The percentage of DQ and IQ meta‐analyses with I2 statistics under 25% were roughly comparable (63% for DQ and 69% for IQ). Due to the limited data it was not possible to fully explore the heterogeneity. However, the plots were visually inspected and random‐effects model analyses were undertaken, which provided similar results and conclusions in all but three cases (see Table 4).
4. Fixed and random effects analysis.
| Comparison | Measure | No. studies | Effect measure | Fixed‐effect result | Heterogeneity | Random‐effects result | Conclusion change? | ||
| AED | Control/Another AED | I2 | Chi2* | ||||||
| CBZ | Women without epilepsy | Bayley | 3 | MD | ‐5.58 (‐10.83 to ‐0.34), P=0.04 | 60% | P=0.08 | ‐4.35 (‐14.04 to 5.34), P=0.38 | Changed to non‐significant |
| CBZ | Women without epilepsy | VIQ | 2 | MD | 1.81 (‐4.94 to 1.33) P=0.026 | 74% | P=0.05 | ‐1.84 (‐8.01 to 4.34), P=0.56 | No change |
| CBZ | Women with epilepsy, no AED treatment | Bayley | 2 | MD | ‐7.22 (‐12.76 to ‐1.67), P=0.01 | 56% | P=0.13 | ‐5.60 (‐15.40 to 4.20), P=0.26 | Changed to non‐significant |
| VPA | Women without epilepsy | IQ | 3 2 |
MD MD |
‐8.94 (‐11.96 to ‐5.92), P<0.00001 ‐11.42 (‐14.68 to ‐8.15), P<0.00001 |
88% 2% |
P=0.003 P=0.31 |
‐5.28 (‐15.54 to 4.97), P=0.31 | Changed to non‐significant Changed to significant with the removal of Thomas 2007 |
| VPA | Women without epilepsy | PIQ | 2 | MD | ‐10.48 (‐13.94 to ‐7.02), P<0.00001 | 68% | P=0.08 | ‐12.11 (‐19.66 to ‐4.55), P=0.002 | No change |
| PHT | VPA | IQ | 2 | MD | 9.25 (4.78 to 13.72), P<0.0001 | 70% | P=0.07 | 6.38 (‐4.84 to 17.58), P=0.27 | Changed to non‐significant |
| VPA mono | VPA polytherapy | IQ | 3 | MD | 1.96 (‐2.68 to 6.61), P=0.41 | 72% | P=0.03 | 3.67 (‐5.46 to 12.80), P=0.43 | No change |
*Chi2 is significant at 0.1
Studies which met inclusion criteria, results not reported
A number of studies met the inclusion criteria for the review but due to one or more issues with reporting they were not included in the results section (D'Souza 1991; FINNISH Study; Hanson 1976; Hill 1974; Hirano 2004; Jones 1989; Regesta 1996; Sobczyz 1977). The failure to report mean scores or percentages below average scores occurred in two studies (D'Souza 1991; Sobczyz 1977) with the others not reporting exposure types separately (FINNISH Study; Hill 1974; Hirano 2004; Regesta 1996). Some studies did not differentiate between exposure types even at the monotherapy versus polytherapy level (Arulmozhi 2006; FINNISH Study; Hanson 1976; Jones 1989; Regesta 1996; Sobczyz 1977).
Discussion
Summary of main results
Carbamazepine (CBZ)
The most commonly investigated AED was CBZ, both in terms of the frequency of investigations and the total number of children. The pooled estimates from meta‐analyses found that the DQ was poorer for young children exposed to CBZ in comparison to both control group types. However, there were high levels of heterogeneity for both comparisons and sensitivity analysis using a random‐effects model altered the effect estimates so that they became non‐significant, suggesting that the significant finding was linked to the variability within study methodologies. Two relatively large observational studies with better quality ratings also consistently failed to find a significant difference between children exposed to CBZ and control children when they were assessed using the Griffiths Mental Development Scales (Bromley 2010; Wide 2002). In contrast, the data from Cummings 2011/2013 were not included in the meta‐analysis but reported poorer early neurodevelopment for children exposed to CBZ.
Data from school aged children that was collected with IQ measures failed to find a significant difference between children exposed to CBZ and control children. Children exposed to CBZ were not found to differ from control children in terms of either their VIQ or PIQ. Limited evidence was available for specific cognitive abilities, however two studies of pre‐school children and one with school aged children failed to find a significant association between language development and exposure to CBZ. There was little evidence from the studies reviewed here that children exposed to CBZ may be at an increased risk for autistic spectrum disorders; although there is not an adequate level of evidence to refute this. However, the large record linkage study by Christensen 2013 failed to find an association between exposure to CBZ and an increased rate of diagnoses of autistic spectrum disorder.
When compared to children exposed to other AEDs, younger children exposed to CBZ did not perform significantly differently from children exposed to VPA, LTG or PHT. When older children were assessed with an IQ measure, children exposed to CBZ had significantly higher IQ scores than children exposed to VPA and comparable levels to children exposed to PHT and LTG.
Increased dose of CBZ is reportedly associated with an elevated risk of major congential malformation (Tomson 2011). Six studies investigated the relationship between dose of CBZ and child cognitive outcome and all failed to demonstrate a significant association between increasing doses and reduced child global cognitive ability.
It should be noted that the findings of this meta‐analyses are in contradiction to those reported in the review by Banach 2010, who reported, based on more heterogeneous data, that children exposed to CBZ are at an increased risk of poorer PIQ. Our review differed from that of Banach and colleagues due to the inclusion of only prospectively ascertained cohorts and including data from cohorts which uniformly were children born to women with epilepsy.
Valproate (VPA)
Since the early case reports pertaining to prenatal exposure to VPA there have been frequent reports of neurodevelopmental deficits (for example Adab 2004; Ardinger 1988; Chevallier 1989; Dean 2002; Moore 2000). Consistent with this, poorer cognitive abilities for children exposed to VPA were reported by all included studies with just three exceptions (Thomas 2007; Thomas 2008; Rihtman 2013). The outcome of the meta‐analyses reported here are consistent with that of Banach 2010 and suggest an increasing body of evidence reporting an association between VPA exposure and poorer child neurodevelopment. Of note, in one of the meta‐analyses including VPA (VPA versus women without epilepsy on IQ) the I2 statistic was above 75%. This was due to the inclusion of the data (n = 12) from Thomas 2007, which was in contrast to the other larger included studies. Removal of these data reduced the I2 statistic to 2% and the significance remained unchanged, therefore this comparison remains consistent with other evidence.
In our meta‐analyses VPA exposure was associated with significantly lower DQs and IQs in comparison with control children, with the MD ranging from eight to nine DQ or IQ points lower. The DQ and IQ are continuously measured skills with a normal distribution and therefore a mean group reduction of eight to nine points would cause a shift to the left in the normal distribution curve. This would lead to a decrease in the number of children falling within the above average range and an increase in the rate of children falling below the average range. Interestingly, the prevalence of below average performance at 1 SD level was significantly increased in comparison with children born to women with untreated epilepsy, with an RR of 10.33. Meta‐analysis for the prevalence of below average performance compared with general population control children was not possible, however the studies of Bromley 2010 and Cummings 2011/2013 demonstrated an increased rate of below average performance for the VPA exposed children in comparison to this control group population. Data on the number of children falling 2 SD below the mean did not reach significance, which may be accounted for by a lack of power to detect such a rare outcome.
In comparisons with children exposed to other AEDs, children exposed to VPA did not have significantly poorer scores for global cognitive ability than those exposed to CBZ when the outcome was measured in younger children as the DQ. However, a significant difference in IQ ability is reported by the individual studies included here with the pooled estimate from the meta‐analysis demonstrating an eight point lower mean for children exposed to VPA, a figure which was comparable to the poorer outcome for VPA exposed children compared to control children. In a comparison with children exposed to LTG, more limited data suggest that children exposed to VPA have a group mean 10 points lower than for children exposed to LTG, and between seven and nine points lower for DQ and IQ respectively in comparison to children exposed to PHT. It is of note, however, that the pooled estimate for VPA versus PHT was not significant in the random‐effects model analysis which was undertaken due to high levels of heterogeneity.
A consistent finding across comparisons with control groups and other AED exposed groups is a poorer neurodevelopmental outcome for children exposed to VPA. In context, a mean reduction of 8 to 10 IQ points is a substantial decrease when it is considered that the standard deviation for the normative sample is 15 points. Research in typically developing children links IQ test performance to educational outcome. A longitudinal study of 70,000 pupils in the UK demonstrated that 58% of children falling within the average range for their IQ obtained five or more General Certificate of General Education subjects (GCSEs) at A* to C level in comparison to just 16% of children whose IQ was within the below average range (Deary 2007). The poorer levels of IQ observed for groups of children exposed to VPA is therefore likely to convey real life implications for educational attainment. Interestingly, poorer educational abilities have been reported for children exposed to VPA in retrospective cohorts (Adab 2001; Adab 2004b) strengthening this conclusion regarding real life implications.
Investigations into the abilities of children in specific cognitive domains was more limited. In younger children there was evidence of poorer motor and language development (Bromley 2010; Thomas 2008). Previous research has suggested a particular vulnerability of verbal skills in comparison to non‐verbal skills (Nadebaum 2011), but our meta‐analysis demonstrated that VIQ and PIQ were significantly lower than in both control groups, with comparable MDs, and therefore does not support a specific vulnerability limited to the verbal domain.
An increased prevalence of autistic spectrum disorders has been reported in three studies, with prevalence estimates ranging from 8% to 15% (Bromley 2013; Cummings 2011/2013; Eriksson 2005). Cases were limited within the population, due to the relatively rarity of this condition. However, a recent large study utilising electronic healthcare data has also found a significant risk of autistic spectrum disorder associated with VPA (absolute risk of 4.42%, 95% CI, 2.59 to 7.46) based on 508 children exposed to VPA (Christensen 2013). Retrospective data sets not included in this review have also found increased prevalence rates for autistic spectrum diagnoses, ranging from 3% to 9% (Adab 2004b; Rasalam 2005). Finally, there is evidence from animal models that early exposure to VPA is associated with autistic type behavioural presentations (Ardnt 2005).
The majority of studies investigating the relevance of the dose of VPA reported a significant correlation between dose and child IQ, with the majority of studies reporting an increase in risk at doses above 800 to 1000 mg, which is consistent with earlier reports from a large retrospective study (Adab 2004b). The study by Rihtman 2013 used a substantially lower mean daily dose (546.3 mg daily) than the other included studies, which at least in part is likely to be due to the inclusion of women taking VPA for indications other than epilepsy. It is likely that this lower dose accounts for the patchy level of association between the different cognitive outcomes and VPA exposure that were seen in this paper. In addition to a reported relationship between dose of VPA and IQ, Nadebaum 2011 and the NEAD Study group reported a significant association between the dose of VPA and language abilities, with higher doses associated with lower language functioning scores.
In meta‐analysis the influence of other variables is not taken into consideration. For the data included in the meta‐analyses in this review, the studies of Bromley 2010 and NEAD Study were rated as having a low risk of bias because of their statistical control over the a priori identified important confounding factors; the studies by Gaily 2004 and GERMAN Study adjusted for certain but not all identified key confounding variables. The studies by Eriksson 2005, Jackson 2013, Thomas 2007 and Thomas 2008 were given high bias ratings due to their failure to measure and adjust for maternal and paternal IQs. For the studies reviewed in relation to VPA outcomes but not entered into the meta‐analysis, four out of six studies were rated as having a low risk of bias in relation to dealing with potential confounding variables (Bromley 2013; Cummings 2011/2013; Nadebaum 2011; Shallcross 2011). Therefore, the majority of evidence provided in this review in relation to VPA made important adjustments to limit the impact of potential confounding variables. There is, however, a frequently raised concern pertaining to confounding by indication in that VPA is most frequently prescribed for idiopathic generalised epilepsies. Therefore, a possible drug association is never looked for outside of the potential influence of the presence of maternal idiopathic generalised epilepsy. Whilst this is the case, certain studies have made attempts to analyse the neurodevelopmental outcomes of children born to women with idiopathic generalised epilepsy in isolation, comparing VPA treated and non‐VPA treated groups. The most prominent example is the NEAD Study. This study demonstrates that within the group of children born to mothers with idiopathic generalised epilepsy, the mean IQ at six years was 12 points lower than for those children exposed to other AEDs, a level comparable to the discrepancies reported for the VPA group as a whole in comparison to the other AEDs. A further consideration is the wealth of data from animal models, which requires caution but highlights that in the absence of any form of maternal epilepsy VPA is associated with altered neuronal development and functional outcomes (Bittigau 2003; Miyazaki 2005). Research into the outcomes of children born to women taking VPA for other indications will assist to definitively answer this point in the future. Currently, however, the present evidence should be explained to women and their families along with its strengths and limitations.
The risks associated with VPA treatment need to be communicated to women and their families. Cognitive and behavioural functioning is complex and the risk to the individual woman and her child will be dependent on the dose and genetic factors. Therefore, a single risk figure to apply to all women would not be accurate. The differences between VPA and other treatment groups reported here range from eight to 10 points for DQ and IQ, with the poorer developmental trajectory observed from infancy and present at least into the school aged years and possibly beyond (Titze 2008). However, such figures do not take account of the dose of VPA. Data pertaining to dose would suggest that the risk for a women on a lower dose of VPA would be less than the figures reported here, whilst a higher dose would convey an even higher level of risk. The included studies of Bromley 2010, Bromley 2013, Gaily 2004, Nadebaum 2011, NEAD Study and Jackson 2013 report that an increased risk occurs from approximately 800 to 1000 mg daily, but currently there are not enough data to determine risk level at specific dose ranges. Future work needs to address this lack of information.
Lamotrigine (LTG)
Despite its prevalent use in women of childbearing age (Ackers 2009; Meador 2009b), there is limited evidence pertaining to prenatal LTG exposure in terms of neurodevelopmental outcome. Only four identified studies investigated the neurodevelopmental abilities of children exposed to LTG in comparison to control children, and meta‐analysis was not possible. Despite methodological differences, both Bromley 2010 and Cummings 2011/2013 failed to find a significant difference in neurodevelopmental outcome for younger children exposed to LTG compared to control children. In the NEAD Study children exposed to LTG had significantly higher IQs and other cognitive abilities than children exposed to VPA, and these measures were similar to those in children exposed to CBZ and PHT. The pooled estimates reported here incorporated the data from the NEAD Study, with a small number of additional cases from the Liverpool and Manchester Neurodevelopment Group (Bromley 2010), to give a non‐significant MD in comparison to CBZ but a significantly higher mean IQ in comparison to VPA exposed children.
The study by Rihtman 2013 was not included in the meta‐analysis due to the inclusion of women taking LTG for indications other than epilepsy. This study found a significantly poorer level of development on certain aspects of perceptual and motor development for the LTG exposed children in comparison to control children; however, confounding variables were not adjusted for that have been noted to alter the significance levels in relation to LTG exposure and the hand and eye co‐ordination outcome in other studies (Bromley 2010).
No relationship with dose was found by the NEAD Study. Consistent with other AEDs, increasing the dose of LTG has been associated with an increase in major congential malformation risk (Tomson 2011) and further investigations regarding LTG dose and neurodevelopmental outcome are required.
Phenytoin (PHT)
Despite its extensive historical use, few prospective studies have investigated PHT exposure and child neurodevelopmental outcome in isolation from other AEDs. It is noted that a number of older cohort studies did investigate the neurodevelopmental functioning of children exposed to PHT, however, due to their retrospective nature they were not included here (for example.Adab 2004). A meta‐analysis of PHT children in comparison to control children was limited by methodological heterogeneity, however the pooled estimate from two studies found a non‐significant difference for PHT exposed children compared with general population controls. This is consistent with other studies that have been reviewed narratively (Leavitt 1992; Thomas 2008; Wide 2002). In terms of specific abilities, two studies reported poorer motor development (Arulmozhi 2006; Wide 2002) and one reported poorer language abilities (Rovet 1995), but the quality of the study designs was limited. Two studies investigated the dose of PHT and child neurodevelopment (NEAD Study; Rovet 1995) and both failed to demonstrate an association.
In comparison to other AEDs, children exposed to PHT have been demonstrated as a group to have comparable mean DQ and IQ scores when compared to CBZ and significantly higher DQ and IQ levels compared to children exposed to VPA; with MDs ranging from seven to nine DQ or IQ points.
Phenobarbital (PB)
Very few studies reported neurodevelopmental outcomes in children prenatally exposed to PB. Both studies investigating the DQ failed to find an association between exposure to PB and outcome (Leavitt 1992; Thomas 2008). The numbers of exposed children were not reported in one study (Leavitt 1992). Only the study by Thomas 2007 assessed ability in school aged children, measured by IQ, and reported no association between outcome and exposure; however the number of exposed children was small (n = 14). No identified studies investigated an association between dose of PB and child neurodevelopmental outcome.
The evidence pertaining to PB is extremely limited. The absence of evidence should not be regarded as evidence of safety, and women should be counselled regarding the paucity of evidence for this drug.
Levetiracetam (LEV)
There are limited data pertaining to the other monotherapy AEDs. A single study was identified which investigated the neurodevelopment of children exposed to LEV in utero (Shallcross 2011). This study assessed children at two years of age, with reassessment of part of the cohort at between three and four years of age. At both time points this study failed to find a difference between the neurodevelopment of children exposed to LEV and control children, and found that the LEV exposed children were superior in neurodevelopment in comparison to children exposed to VPA. Replication is required. A significant dose dependent effect was noted in the Shallcross 2011 study for LEV but the association was weak.
LEV is in widespread use by women in their childbearing years (Meador 2009b) due to the evidence pertaining to malformation risk, which, based on evidence to date, does not appear to be increased from the background rate (Hernandez‐Diaz 2012; Mawhinney 2013). The use of LEV in women of childbearing age and during pregnancy is not supported from a neurodevelopmental teratological safety point of view due to the lack of evidence. Research is needed to address this lack of evidence and women should be informed about the lack of evidence regarding neurodevelopmental risk and safety.
Topiramate (TPM)
Only one identified study investigated the abilities of children exposed to TPM in utero. Rihtman 2012 reported a significant difference between the children exposed to TPM in comparison to control children but extreme caution is required due to the small number of TPM exposed children (n = 9) and because of the heterogeneous indications for which the mothers were taking TPM.
In the study by Meador 2009b, TPM was a relatively commonly used medication in women of childbearing age. Therefore, more research is needed to provide evidence on which counselling of women and their families can be based. Currently, there is not enough evidence to suggest neurodevelopmental safety or an increased risk of harm.
Monotherapy and polytherapy
Historically there was a frequent analysis of monotherapy data as a single unitary group. The variation between treatment types, reported above, indicates that such practice should not be continued as it will lead to unreliable conclusions. As well as differences in risk levels across exposure types, groups of monotherapy and polytherapy cases will vary from cohort to cohort due to the documented differences in prescribing across countries (for example Meador 2009b), meaning that the characteristics of the two groups are unlikely to be the same. A number of older retrospective papers reported that monotherapy outcomes were better than for polytherapy, however data reviewed from the cohorts of Bromley 2010 and Nadebaum 2011 highlight that the important driver in this conclusion may be the presence of absence of VPA. More data are required.
Due to the above noted variability in monotherapy and polytherapy groups across studies systematic review and meta‐analysis was not undertaken as were likely to contain large variation and high bias.
Other antiepileptic drugs (AEDs)
No studies were identified which investigated the neurodevelopment of children born to women with epilepsy and exposed to any other AED in monotherapy. Whilst there is unavoidably a latency between the onset of a medication use and adequate data, a number of these drugs have been utilised for a decade or more (for example TPM, zonisamide, ethosuximide and gabapentin), suggesting that prescribing for women with epilepsy is not currently based on evidence of neurodevelopmental safety. Prescribers are without the evidence on which to base their counselling of women.
Overall completeness and applicability of evidence
The complexity of this area has brought a number of challenges for completing this review within the Cochrane framework. Heterogeneity across study methodologies and varied reporting methods have greatly limited the number of studies included in the meta‐analyses. The dynamic nature of child neurodevelopment means that different assessments are required to assess ability at different ages and for different outcomes. Therefore, the results section and meta‐analyses needed to be divided to give consideration to the type of assessment that was completed and the cognitive outcome in question.
This systematic review is to our knowledge the most comprehensive review completed to date in this area. The creation and advance publication of the review protocol, the clear inclusion criteria, the extensive searches, the acquisition of unpublished data, and the assessment of risk of bias and quality in the non‐randomised evidence are strengths of this review. Under the Cochrane guidelines this review will be updated every two years, or following the publication of a significant amount of new data, to ensure it remains up to date.
This review is limited by heterogeneity across study methods and in terms of study quality, although more recent studies tended to demonstrate higher quality methods. The largest limitation placed on this review relates to the lack of evidence pertaining to the newer AEDs. No evidence was found for AEDs such as tiagabine, gabapentin, zonisamide, oxcarbazepine and ethosuximide. A further limitation is that due to limited data and heterogeneity. The potential impact of confounding variables could not be explored and therefore the results need to be interpreted with a degree of caution. However, the majority of included studies did investigate the impact of confounding variables and several found a significant association with prenatal exposure to VPA even after controlling for confounders (Bromley 2010; Gaily 2004; Nadebaum 2011; NEAD Study; Shallcross 2011) therefore producing results consistent with the findings of this review. The dose of the AED is likely to be a key variable in the level of risk. At this time, this review is not able to analysis data stratified by dose.
It should be considered that in a few of the comparisons the number of children that were included was low (for example comparisons including LTG). Determining power is influenced by the level of discrepancy present between the groups. For example, 45 children in each group would be required to detect a difference of 1.5 SDs between two groups with 80% power at a 95% CI, , however larger levels of difference could be detected reliably with smaller groups. Those comparisons with a low number of children may be at risk of imprecision and therefore the results may be subject to change in light of new data. It should also be considered that smaller levels of difference may not be detectable in the group sizes included in this review, and that some non‐significant findings may change in light of new data.
This review is also limited by its failure to include study methodologies which utilise large national electronic data sets taken from hospital and pharmacy records. Since the review protocol was written and published there has been a proliferation of studies using this methodology (for example Christensen 2013) and future updates of this review will include these data types.
Quality of the evidence
Randomised controlled trials are thought to be unethical in this area due to the permanence of potential adverse effects for the foetus. Gold standard evidence for this area would therefore comprise data coming from a prospective, blinded cohort study using standardised measures to assess neurodevelopment and utilising statistical methods to limit the influence of confounding variables. The methodological quality for each study is displayed in Table 3. By their nature, all studies were rated as high risk on the randomisation sequence and allocation concealment domains as they were non‐randomised trials. The included studies varied in their approach to controlling confounding variables, a key issue in non‐randomised studies. The majority of studies scored well for blinding of the outcome assessors; however blinding was unclear in five studies and did not occur in six. By the nature of longitudinal follow‐up studies, participant attrition is likely; however the majority of studies reported this clearly, providing reasons for the losses. Selective reporting was difficult to rate for most studies due to the absence of the study protocols. Other bias was a category created to reflect bias in other domains such as the neuropsychological test measure or principles, or failure to report specific AED treatments separately; this led to high ratings of bias for 11 studies.
More recent studies tend to be prospective, blinded, include a reliable approach to control for confounders and have improved reporting, indicating methodological improvement over time. For recommendations on the conduct of future research see Implications for research.
Potential biases in the review process
The review author RB was a study author on four of the included data sets (Bromley 2010; Bromley 2013; NEAD Study; Shallcross 2011). This potential bias was reduced by delegating data extraction and risk of bias assessments to two other review authors.
Authors' conclusions
Implications for practice.
There is converging evidence that prenatal exposure to VPA is associated with an increased risk of a range of neurodevelopmental deficits, including poorer early development, lower IQ in school aged children, and an increased risk of autistic spectrum disorders. In comparison to other treatments, VPA was associated with reduced IQ compared to CBZ, LTG and PHT. It remains to be seen, however, whether the levels of discrepancy between the children exposed to VPA and controls or other AED exposed groups increase or diminishe with time. Children exposed to CBZ were not found to have reduced global cognitive development in comparison to control children, but less is known about any potential impact of exposure on specific cognitive skills. There is a lack of evidence pertaining to the commonly prescribed treatments of LTG, LEV and TPM, amongst others, and therefore current practices are not underpinned by evidence of foetal safety.
Women should be provided with information about the evidence on the risks and safety of particular AED treatments. Preconceptual counselling should be available and should cover both teratological risk and considerations of the efficacy of treatments for controlling seizures. A significant number of pregnancies are unplanned and health professionals should ensure that women are routinely informed about the risks and benefits of their medication, and prescribers should take the risk of unplanned pregnancy into account when prescribing AEDs.
For those in paediatric services, poorer neurodevelopmental trajectories are in evidence for children below the age of two years that have been exposed to VPA. Routine monitoring should occur for these children to ensure that, if required, early intervention occurs to maximise child neurodevelopmental outcomes.
Implications for research.
This area is complex and it is no wonder that knowledge about the risks associated with AED teratogenicity is low amongst prescribers (Roberts 2011) and women with epilepsy (Metcalfe 2012). Historical methods of surveillance are obviously not suitable to detect neurodevelopmental impairment in a time‐efficient manner and therefore a different approach is required (Friedman 2012). There has been a proliferation in the application of electronic healthcare records in this area (for example Christensen 2013), which may provide some progress. This methodology is unlikely to offer a complete solution, however, as there is evidence that the records may under‐report malformation rates (Charlton 2011) and in most cases they are unlikely to be suitable for IQ and other cognitive data.
The neurodevelopmental risks reviewed here are likely to be lifelong and, as noted by Friedman 2012, signals of harm are important in this area and should not be dismissed due to poor methodologies but investigated with urgency. The prominence of these issues needs to be appraised and future work needs to ensure that research occurs in a more timely and almost automatic manner to ensure that the delays in establishing risk or safety data are reduced to optimise the health of both the mother and the child. No clear dominant method for investigation in this area has led to a variety of methodologies, cohorts, control groups, child assessment and reporting analysis methods being adopted. More coherence across investigations will help to make the risk‐benefit information more clear. Below are some suggested guidelines for methodologies. Whilst there are always differences in opinion about how to design a study these points aim to create more cohesion in this area.
Design
Both truly prospective and registry based neurodevelopmental studies have an important place. The dominance of pregnancy registers for the collection of data pertaining to major congenital malformations should not be ignored and their adaptation for the collection of neurodevelopment data offers a timely and cost‐effective method. However, the retrospective nature of recruitment into the neurodevelopmental follow up means that estimates may be seen as biased. Prospective studies where women enrol into the study prior to knowing the child's outcome offer less biased recruitment, however losses to follow up over the childhood years may mean that the biases for those who complete the final follow‐up assessment may not be that different from those who enrol into a registry follow up. In this review no differences were found between the outcomes of these methodologies and therefore both these methods have a place.
Follow‐up age
Neurodevelopment is dynamic which presents a number of challenges. It has been argued that follow up to school age is required to understand the neurodevelopment of an exposed child (Adab 2004b), and the present findings pertaining to CBZ emphasise this point. This review demonstrates that whilst assessment at an early age may detect stable levels of impairment (that is in the case of VPA) it may also lead to premature conclusions about exposures to other AEDs as by school age improvements may have occurred. Follow up into the school age years is therefore required to ensure reliable conclusions. However, the development of the brain does not stop in the primary years and it could be argued that without follow up into adulthood we run the risk of failing to document reliable levels of risk to cognitive functioning.
Control groups
The offspring of women with epilepsy who were not taking AEDs, or women without epilepsy whose children represent the general population are two common control groups in the studies reviewed here. The preference of one control group over the other has been debated (for example Nicolai 2008). In this review no differences were found between the pattern of results across control group types, which is expected based on direct comparisons by other authors (for example Bromley 2010; GERMAN Study; Holmes 2000). Decisions around control groups should also be based on additional considerations including recruitment sources. The offspring of women with untreated epilepsy might convey benefits in terms of reducing ascertainment bias as often pregnancy and epilepsy registers do not recruit women without epilepsy.
Test selection
Over 15 different measurements were used to assess the different aspects of neurodevelopment in the studies included in this review. Whilst the manuals for these assessments will report correlations between measures it would be inappropriate to pool outcomes from all of these measures, and therefore direct comparisons across cohorts were not always possible.
A measure of global cognitive ability (measured as IQ or DQ) was the most commonly assessed domain. Whilst this is a useful way to gauge cognitive development it may mask specific difficulties in one or more cognitive domains. For example, the full scale IQ score of a test comprises a number of subtests which measure a variety of skills from processing speed to verbal knowledge. The most common measure of neurodevelopment in younger children was Bayley Scales of Infant and Toddler Development, with the Wechsler IQ series being most commonly utilised for IQ measurement. Whilst the research question and author preference may dictate test selection, authors are urged to consider selecting measures which will allow direct comparisons across published cohorts.
Outcome reporting
Across the papers reviewed here there were varied reporting practices with regards to the outcomes across the studies. The majority of studies report an overall mean and standard deviation or confidence intervals for all the exposed children together, however, as noted above this is likely to mask differences in outcomes across the groups. The reporting of outcomes of children exposed to monotherapy and polytherapy is also common but again carries a risk of masking effects which may be associated with an individual drug. Differences in prescribing practices across countries have been widely documented (Meador 2009b) and therefore one monotherapy or polytherapy group is unlikely to be directly comparable to another. Outcomes by specific AEDs should always be reported and studies should be powered to detect differences between different AED exposed groups.
In addition to reporting at a group level there was considerable variation in how individual neurodevelopmental domains were reported. The reporting, at least in table form, of global and all individual domain standard (age adjusted) scores would assist with comparisons across cohorts and will aid future meta‐analysis.
The reporting of numbers of children who fall below the average range may offer a more clinically meaningful representation of the data. However, reduction of global cognitive ability from the above average range to the average range should not be underestimated in terms of its importance to the individual, family and society.
Dose
By their nature, dose is key to the effects of a teratogen (Brent 2004), yet this is not considered by all studies. Just like treating all AEDs as a unified treatment group, treating all doses in the same manner may lead to the masking of effects on cognitive development. Doses should be investigated and reported. Dose exploration should at least undertake correlational analysis between the dose of AED and child score (for example IQ, DQ or specific language score).
What's new
| Date | Event | Description |
|---|---|---|
| 8 June 2020 | Amended | Clarification message from the Co‐ordinating Editor added to the Declarations of interest statement about the review’s compliance with the Cochrane conflict of interest policy, which includes the relevant parts of the Cochrane Commercial Sponsorship Policy. |
History
Protocol first published: Issue 11, 2012 Review first published: Issue 10, 2014
Acknowledgements
We would like to acknowledge Jacqui Vinten, Paula Williamson and Janine Winterbottom for their input as part of the previous review.
We would also like to acknowledge Rumona Dickson for the design of the current review, Juliet Hockenhull for support with the development of an electronic database and Deirde Beecher, Sarah Klingenberg, Daria Makarova, Sarah Nolan and Jolanta Sabbat for assisting with translations of foreign language study papers. The authors would also like to acknowledge Rebekah Shallcross for her piloting and comments on the data extraction forms.
Appendices
Appendix 1. CENTRAL search strategy
#1 MeSH descriptor Pregnancy explode all trees
#2 MeSH descriptor Pregnancy Complications explode all trees
#3 MeSH descriptor Prenatal Exposure Delayed Effects explode all trees
#4 (fetal OR foetal OR fetus OR foetus OR prenatal)
#5 (newborn OR infant)
#6 MeSH descriptor Teratogens explode all trees
#7 (teratogen*)
#8 (in NEXT utero)
#9 (intra uterine) or (intrauterine)
#10 MeSH descriptor Fetal Development explode all trees
#11 MeSH descriptor Infant, Newborn explode all trees
#12 (#1 OR #2 OR #3 OR #4 OR #5 OR #6 OR #7 OR #8 OR #9 OR #10 OR #11)
#13 MeSH descriptor Fetal Diseases explode all trees
#14 MeSH descriptor Fetal Death explode all trees
#15 MeSH descriptor Infant Mortality explode all trees
#16 MeSH descriptor Birth Weight explode all trees
#17 MeSH descriptor Abnormalities, Drug‐Induced explode all trees
#18 MeSH descriptor Congenital Abnormalities explode all trees
#19 (congenital NEXT defec*)
#20 (congenital NEXT malformation*)
#21 (congenital NEXT anomal*)
#22 (birth NEXT defec*)
#23 (minor NEXT anomal*)
#24 (dysmorph*)
#25 (maternal NEXT mortality)
#26 MeSH descriptor Intellectual Disability explode all trees
#27 (intellectual* NEXT impair*)
#28 (IQ)
#29 (intellectual NEXT ability)
#30 neurodevelopment
#31 (mental* NEXT retard*)
#32 "educational needs"
#33 "longer term outcome"
#34 MeSH descriptor Child Development explode all trees
#35 "child development"
#36 MeSH descriptor Autistic Disorder explode all trees
#37 (autism OR autistic)
#38 MeSH descriptor Attention Deficit Disorder with Hyperactivity explode all trees
#39 "attention deficit"
#40 MeSH descriptor Apraxias explode all trees
#41 dyspraxia
#42 MeSH descriptor Memory explode all trees
#43 (memory)
#44 MeSH descriptor Language Disorders explode all trees
#45 language
#46 MeSH descriptor Executive Function explode all trees
#47 (executive NEXT function*)
#48 cognitive
#49 MeSH descriptor Neuropsychology explode all trees
#50 neuropsycholog*
#51 (#13 OR #14 OR #15 OR #16 OR #17 OR #18 OR #19 OR #20 OR #21 OR #22 OR #23 OR #24 OR #25 OR #26 OR #27 OR #28 OR #29 OR #30 OR #31 OR #32 OR #33 OR #34 OR #35 OR #36 OR #37 OR #38 OR #39 OR #40 OR #41 OR #42 OR #43 OR #44 OR #45 OR #46 OR #47 OR #48 OR #49 OR #50)
#52 MeSH descriptor Phenytoin explode all trees
#53 MeSH descriptor Carbamazepine explode all trees
#54 MeSH descriptor Valproic Acid explode all trees
#55 MeSH descriptor Phenobarbital explode all trees
#56 MeSH descriptor Ethosuximide explode all trees
#57 MeSH descriptor Clonazepam explode all trees
#58 MeSH descriptor Anticonvulsants explode all trees
#59 (phenytoin) or (carbamazepine) or (valproate) or (valproic) or (phenobarb*)
#60 (lamotrigine) or (gabapentin) or (vigabatrin) or (levetiracetam) or (topiramate)
#61 (tiagabine) or (zonisamide) or (pregabalin) or (lacosamide) or (rufinamide)
#62 (retigabine) or (ezogabine) or (oxcarbazepine) or (ethosuximide) or (sulthiame)
#63 (clonazepam) or (clobazam) or (anti‐epilep*) or (antiepilep*)
#64 MeSH descriptor Epilepsy explode all trees
#65 MeSH descriptor Seizures explode all trees
#66 (seizure*) or (epilep*) or (convuls*)
#67 (#52 OR #53 OR #54 OR #55 OR #56 OR #57 OR #58 OR #59 OR #60 OR #61 OR #62 OR #63 OR #64 OR #65 OR #66)
#68 (#12 AND #51 AND #67)
Appendix 2. MEDLINE search strategy
1. exp Pregnancy/
2. exp Pregnancy Complications/
3. exp Prenatal Exposure Delayed Effects/
4. (fetal or foetal or fetus or foetus or prenatal).tw.
5. (newborn or infant).tw.
6. exp Teratogens/
7. teratogen$.tw.
8. (in adj utero).tw.
9. (intra uterine or intrauterine).tw.
10. exp Fetal Development/
11. exp Infant, Newborn/
12. or/1‐11
13. exp Fetal Diseases/
14. exp Fetal Death/
15. exp Infant Mortality/
16. exp Birth Weight/
17. exp Abnormalities, Drug‐Induced/ or exp Congenital Abnormalities/
18. (congenital adj defec$).tw.
19. (congenital adj malformation$).tw.
20. (congenital adj anomal$).tw.
21. (birth adj defec$).tw.
22. (minor adj anomal$).tw.
23. dysmorph$.tw.
24. (maternal adj mortality).tw.
25. exp Intellectual Disability/
26. (intellectual$ adj impair$).tw.
27. IQ.tw.
28. (intellectual adj ability).tw.
29. neurodevelopment.tw.
30. (mental$ adj retard$).tw.
31. educational needs.tw.
32. longer term outcome.tw.
33. exp Child Development/
34. child development.tw.
35. exp Autistic Disorder/
36. (autism or autistic).tw.
37. exp Attention Deficit Disorder with Hyperactivity/
38. attention deficit.tw.
39. exp Apraxias/
40. dyspraxia.tw.
41. exp Memory/
42. memory.tw.
43. exp Language Disorders/
44. language.tw.
45. exp Executive Function/
46. executive function$.tw.
47. cognitive.tw.
48. exp Neuropsychology/
49. neuropsycholog$.tw.
50. or/13‐49
51. phenytoin.tw.
52. exp Carbamazepine/
53. carbamazepine.tw.
54. exp Valproic Acid/
55. (valproic or valproate).tw.
56. exp Phenobarbital/
57. phenobarb$.tw.
58. lamotrigine.tw.
59. gabapentin.tw.
60. vigabatrin.tw.
61. levetiracetam.tw.
62. topiramate.tw.
63. tiagabine.tw.
64. zonisamide.tw.
65. pregabalin.tw.
66. lacosamide.tw.
67. (retigabine or ezogabine).tw.
68. rufinamide.tw.
69. oxcarbazepine.tw.
70. exp Ethosuximide/
71. ethosuximide.tw.
72. sulthiame.tw.
73. exp Clonazepam/
74. clonazepam.tw.
75. clobazam.tw.
76. antiepilep$.tw.
77. anti‐epilep$.tw.
78. exp Anticonvulsants/
79. exp Epilepsy/
80. exp Seizures/
81. (seizure$ or epilep$ or convuls$).tw.
82. or/51‐81
83. 12 and 50 and 82
84. exp animals/ not humans.sh.
85. 83 not 84
Appendix 3. EMBASE search strategy
EMBASE search strategy
1. exp pregnancy/
2. exp pregnancy disorder/
3. exp prenatal exposure/
4. prenatal development/
5. prenatal drug exposure/
6. exp teratogenic agent/
7. exp teratogenicity/
8. exp drug toxicity/
9. exp embryotoxicity/
10. reproductive toxicity/
11. exp fetotoxicity/
12. exp congenital malformation/
13. exp infant mortality/
14. exp maternal mortality/
15. exp “parameters concerning the fetus, newborn and pregnancy”/
16. exp infant disease/
17. teratogen:.tw.
18. congenital defec:.tw.
19. congenital anomal:.tw.
20. congenital malformation:.tw.
21. birth defec:.tw.
22. minor anomal:.tw.
23. dysmorph:.tw.
24. exp Intellectual Disability/
25. (intellectual$ adj impair$).tw.
26. IQ.tw.
27. (intellectual adj ability).tw.
28. neurodevelopment.tw.
29. (mental$ adj retard$).tw.
30. education.tw.
31. longer term outcome.tw.
32. exp Child Development/
33. child development.tw.
34. exp Autistic Disorder/
35. (autism or autistic).tw.
36. exp Attention Deficit Disorder with Hyperactivity/
37. attention deficit.tw.
38. exp Apraxias/
39. dyspraxia.tw.
40. exp Memory/
41. memory.tw.
42. exp Language Disorders/
43. language.tw.
44. exp Executive Function/
45. executive function$.tw.
46. 1 or 2 or 3 or 4 or 5 or 6 or 7 or 8 or 9 or 10 or 11 or 12 or 13 or 14 or 15 or 16 or 17 or 18 or 19 or 20 or 21 or 22 or 23 or 24 or 24 or 26 or 27 or 28 or 29 or 30 or 31 or 32 or 33 or 34 or 35 or 36 or 37 or 38 or 39 or 40 or 41 or 42 or 43 or 44 or 45 or 46
47. epilepsy
48. seizures
49. antiepileptic
50. exp hydantoin/
51. hydantoin:.tw.
52. exp phenobarbital/
53. phenobarbit:.tw.
54. exp carbamazepine/
55. carbamazepine:.tw.
56. exp valproic acid/
57. valpr:.tw.
58. exp lamotrigine/
59. lamotrigine:.tw.
60. exp gabapentin/
61. gabapentin:.tw.
62. exp topiramate/
63. topiramat:.tw.
64. exp vigabatrin/
65. vigabatrin:.tw.
66. exp tiagabin/
67. tiagabin:.tw.
68. exp zonisamide/
69. zonisamid:.tw.
70. exp ethosuximide/
71. ethosuximide:.tw.
72. exp lacosamide/
73. lacosamide:.tw.
74. exp rufinamide/
75. rufinamide:.tw
76. 46 and 47 or 48 or 49 or 50 or 51 or 52 or 53 or 54 or 55 or 56 or 57 or 58 or 59 or 60 or 61 or 62 or 63 or 64 or 65 or 66 or 67 or 68 or 69 or 70 or 71 or 72 or 73 or 74 or 75
Appendix 4. Data extraction form
Cochrane Epilepsy Review Group Reviewer Initials...............
Study Selection, Quality Assessment & Data Extraction Form
| Study ID | Authors | Journal/Conference | Year |
Linked Studies
(Check Endnote Library for any other studies linked to this study and list below)
| Study ID | Authors | Journal/Conference | Year |
References to Other Trials
(Check article for any other studies mentioned within the paper or in reference list which may potentially be included within the review)
| Authors | Journal | Year |
Participant and Study Characteristics
| Study Design (prospective cohort, retrospective cohort, RCT, registry) | |
| Study Setting (community, hospital, etc.) | |
| Single/Multicentre | |
| City, Country/Countries | |
| Source of Funding | |
| Ascertainment of Exposure Info (hospital records/interview etc.) | |
| Where was intervention group recruited from? | |
| Where was control group recruited from? | |
| Which AEDs under study? (list all) | |
| Were AEDs analysed separately? | |
| Number of mothers initially recruited? | Intervention Control |
| Any dose information reported? (list doses for each AED if available) | |
| How was participant eligibility defined? | |
| Maternal Type of Epilepsy (epilepsy type and seizure types reported) | |
| Control Group Details (who formed control group) | |
| Duration of follow‐up | |
| Assessment Intervals (time assessed and age of participants when assessed) | |
| Assessments (list all cognitive, developmental tests used) | |
| Blinding (participants, assessors, other study personnel) | |
| Missing Data (is loss to follow‐up reported, are reasons reported) |
Details of Children
| Age (mean, median, range) | Intervention Controls |
| Gender (numbers, %) | Intervention Controls |
|
Number of Children Initially Recruited (for each AED if available) |
Intervention Controls |
| Number of Children Completed Assessments? (for each AED if available) | Intervention Controls |
| Number of Children analysed? (for each AED if available) | Intervention Controls |
Abbreviations of AEDs
Carbamazepine CBZ Sulthiame SUL
Clobazam COZ Tiagabine TGB
Clonazepam CZP Topiramate TPM
Diazepam DZP Vigabatrin VGB
Ethosuximide ESM Zonisamide ZNS
Gabapentin GBP
Lacosamide LCM
Lamotrigine LTG
Levetiracetam LEV
Lorazepam LZP
Oxcarbazepine OXC
Phenytoin PHT
Phenobaritone/tal PB
Primidone PRM
Retigabine RTB
Rufinamide RFM
Sodium Valproate SVP
Outcomes
| Measurements | Reported |
| Mean Scores (all groups) | Yes/No |
| Standard Deviations (all groups) | Yes/No |
| Percentage of children below average | Yes/No |
| Percentage of children receiving clinical intervention (educational support, psychologist, physiotherapy, etc.) | Yes/No |
| Cases of neurodevelopmental disorder (autism, ADHD, dyspraxia etc.) | Yes/No |
| Others Reported in Paper (list below) |
Data (Continuous) Total or global scores and scores on each domain
| Neuro Assessment (name) | Total or Global (list all domains reported in paper) | AED (name both AEDs if comparing two) | AED Group | Control Group (or other AED | Details of findings if only described in text | ||
| No. of ps | Mean (SD or 95% CI) | No. of ps | Mean (SD or 95% CI) | ||||
Data (Dichotomous) Percentage of children below average
| AED Group | Control Group (or other AED) | |||||
| Name of Drug (name both if comparing two) | Number of events | Number of children in group | % of children <84 by AED | Number of events | Number of children in group | % of children <84 by AED |
Confounding Variables
Assuming a pre‐specified list of potential confounders defined in the review protocol
Is the method for identifying relevant confounders or imbalance between study groups described? Yes or No
If yes, describe the method used.
Is confounding controlled for at the design stage of the study by matching characteristics of subjects? Yes or No
If yes, list the variables on which subjects were matched.
Is one of the following statistical methods* used to control or adjust for confounding at the analysis stage?
Univariate regression
Multivariate regression
Stratification
Propensity scores (regression)
Propensity scores (matching / strata)
Other method (specify)
Please describe the method used (e.g. strata selected, regression model used etc.)
Pre‐specified confounders for the pregnancy review
For each individual factor tick ‘Considered’ if the researchers identify the factor as a confounder and tick ‘Adjusted’ if the factor has been controlled for in a careful and appropriate manner (based on the above questions)
General factors
Population (regional, national/international, single/multicentre) Considered Adjusted
Proportion of subjects lost to follow up Considered Adjusted
Maternal Factors
Age Considered Adjusted
Duration of AED treatment Considered Adjusted
IQ Considered Adjusted
Lifestyle factors Considered Adjusted
Monotherapy or polytherapy Considered Adjusted
Socioeconomic status Considered Adjusted
Type of epilepsy Considered Adjusted
Use of other medications Considered Adjusted
Years of education Considered Adjusted
Child factors
Age of assessment Considered Adjusted
Gestational age at birth Considered Adjusted
Gender Considered Adjusted
Seizure exposure Considered Adjusted
Time of follow‐up Considered Adjusted
Outcome measurement Considered Adjusted
Appendix 5. Extended risk of bias tool for non‐randomised studies
| Item | Judgement1 | Description (quote from paper, or describe key information) | |
| 1. Sequence generation | |
||
| 2. Allocation concealment | |
||
| 3a. Confounding2 | Outcome 1 | |
|
| 3b. Confounding2 | Outcome 2 | |
|
| 4a. Blinding? | Outcome 1 | |
|
| 4b. Blinding? | Outcome 2 | |
|
| 5a. Incomplete outcome data addressed? | Outcome 1 | |
|
| 5b. Incomplete outcome data addressed? | Outcome 2 | |
|
| 6a. Free of selective reporting? | Outcome 1 | |
|
| 6b. Free of selective reporting? | Outcome 2 | |
|
| 7. Free of other bias? | |
||
| 8. A priori protocol?3 | |
||
| 9. A priori analysis plan?4 | |
||
Footnotes
1 Some items on low/high risk/unclear scale (double‐line border), some on 5 point scale/unclear (single line border), some on yes/no/unclear scale (dashed border). For all items, record “unclear” if inadequate reporting prevents a judgement being made.
2 Based on list of confounders considered important at the outset and defined in the protocol for the review (and assessment against worksheet)
3 Did the researchers write a protocol defining the study population, intervention and comparator, primary and other outcomes, data collection methods, etc. in advance of starting the study? N.B. May be outcome specific.
4 Did the researchers have an analysis plan defining the primary and other outcomes, statistical methods, subgroup analyses, etc. in advance of starting the study?
Studies for which the risk of bias tool is intended
Only suitable for ‘cohort‐like’ studies, individually or cluster‐allocated. This can include secondary analyses of clinical databases providing the analysis is clearly structured as a comparison of control and intervention participants (XXXXX):
Individually allocated study designs
Randomised controlled trial
Quasi randomised controlled trial
Non‐randomised controlled trial
Controlled before and after study (not common use of this label, see controlled cohort before and after study below)
Prospective cohort study
Retrospective cohort study
Cluster allocated study designs
Cluster randomised controlled trial
Cluster quasi randomised controlled trial
Cluster non‐randomised controlled trial
Controlled interrupted time series
Controlled cohort before and after study
Assessment of risk of bias
Issues when using the modified risk of bias tool to assess cohort‐like non‐randomised studies:
follow principle for existing Cochrane Collaboration's tool for risk of bias: score judgement and provide information (preferably direct quote) to support judgement
modified risk of bias tool include an additional item on confounding.
five‐point scale for some items (distinguish "unclear" from intermediate risk of bias).
keep in mind the general philosophy – assessment is not about whether researchers could have done better but about risk of bias; the assessment tool must be used in a standard way whatever the difficulty/circumstances of investigating the research question of interest and whatever study design features were used.
use of a five‐point scale is uncharted territory; very interested to know whether this makes things easier or more difficult for reviewers.
anchors for five‐point scale: "1/No/low risk" of bias should correspond to a high quality RCT. "5/high risk" of bias should correspond to a risk of bias that means the findings should not be considered (too risky, too much bias, more likely to mislead than inform).
Sequence generation
Low/high/unclear risk of bias item
Always high risk of bias (not random) for a non‐randomised study
Might argue that this item is redundant for non‐randomised studies since they are always of high risk of bias – but important to include in risk of bias table ('level playing field' argument)
Allocation concealment
Low/high/unclear risk of bias item
Potentially low risk of bias for a non‐randomised study, e.g. quasi‐randomised (high risk of bias due to sequence generation) but concealed (author judges that the people making decisions about including participants didn’t know how allocation was being done, e.g. odd/even date of birth/hospital number)
Risk of bias from confounding (additional item for non‐randomised studies; assess for each outcome)
Assumes a prespecified list of potential confounders defined in the protocol for the systematic review
Low(1) / 2 / 3 / 4 / high(5) / unclear risk of bias item
-
Judgement needs to factor in (see 'worksheet'):
proportion of confounders (from pr‐especified list) that were considered
whether most important confounders (from pre‐specified list) were considered
resolution/precision with which confounders were measured
extent of imbalance between groups at baseline
care with which adjustment was done (typically a judgement about the statistical modelling carried out by authors)
-
Low risk of bias requires that all important confounders are balanced at baseline, i.e.:
not primarily / not only a statistical judgement; or
measured 'well' and 'carefully' controlled for in the analysis.
We have provided an optional 'worksheet' to help reviewers to focus on the task (rows = confounders and columns = factors to consider). Authors should make a risk of bias judgement about each factor first and then combine these (by eyeballing rather than quantitatively) to make the judgement in the main risk of bias table.
Risk of bias from lack of blinding (assess for each outcome, as per the existing risk of bias tool)
Low(1) / 2 / 3 / 4 / high(5) / unclear risk of bias item
-
Judgement needs to factor in:
nature of outcome (subjective / objective; source of information);
who was/was not blinded and the risk that those who were not blinded could introduce performance or detection bias.
Risk of bias from incomplete outcome data (assess for each outcome, as per the existing risk of bias tool)
Low(1) / 2 / 3 / 4 / high(5) / unclear risk of bias item
-
Judgement needs to factor in:
reasons for missing data;
whether amount of missing data balanced across groups, with similar reasons;
whether group comparison appropriate (e.g. 'analysed in allocated group' issue).
Risk of bias from selective reporting (assess for each outcome)
More wide ranging than existing assessment recommendation. Key issue is whether outcomes were clearly defined, and methods of analysis, were pre‐specified and adhered to
Low(1) / 2 / 3 / 4 / high(5) /unclear risk of bias item
-
Judgement needs to factor in:
existing risk of bias guidance on selective outcome reporting;
also, extent to which analyses (and potentially other choices) could have been manipulated to bias the findings reported, e.g. choice of method of model fitting, potential confounders considered/included;
look for evidence that there was a protocol in advance of doing any analysis/obtaining the data (difficult unless explicitly reported); non‐randomised studies are very different from RCTs. RCTs must have a protocol in advance of starting to recruit (for research ethics committee/institutional review board/other regulatory approval); non‐randomised studies need not (especially older studies);
Hence, separate yes/no items asking reviewers whether they think the researchers had a prespecified protocol and analysis plan?
Appendix 6. Assessment of confounding variables
|
Assessment of how researchers dealt with confounding Method for identifying relevant confounders described by researchers: yes no If yes, describe the method used: Relevant confounders described: yes no List confounders described below |
|
Method used for controlling for confounding At design stage: matching by characteristics of subjects (see below for matching by propensity score) Variables on which subjects matched: …………………………………. …………………………………. …………………………………. …………………………………. At analysis stage: stratification multivariable regression propensity scores (matching) propensity scores (multivariable regression) Describe confounders controlled for below |
|
Confounders described by researchers Enter / preprint prespecified list of confounders (rank order in importance? Important in bold?) Tick (yes/no judgement) if confounder considered by the researchers [Cons’d?] Score (1 to 5) precision with which confounder measured Score (1 to 5) imbalance between groups Score (1 to 5) care with which adjustment for confounder was carried out. |
| Confounder | Considered | Precision | Imbalance | Adjustment |
| o | o | o | o | |
| o | o | o | o | |
| o | o | o | o |
Data and analyses
Comparison 1. CBZ versus controls (women without epilepsy).
| Outcome or subgroup title | No. of studies | No. of participants | Statistical method | Effect size |
|---|---|---|---|---|
| 1.1 Development (Griffiths) | 1 | Mean Difference (IV, Fixed, 95% CI) | Subtotals only | |
| 1.1.1 Prospective | 1 | 278 | Mean Difference (IV, Fixed, 95% CI) | ‐2.00 [‐6.44, 2.44] |
| 1.2 Development (Bayley) | 3 | 129 | Mean Difference (IV, Fixed, 95% CI) | ‐5.58 [‐10.83, ‐0.34] |
| 1.2.1 Prospective | 3 | 129 | Mean Difference (IV, Fixed, 95% CI) | ‐5.58 [‐10.83, ‐0.34] |
| 1.3 IQ | 3 | 702 | Mean Difference (IV, Fixed, 95% CI) | ‐0.03 [‐3.08, 3.01] |
| 1.3.1 Prospective | 1 | 260 | Mean Difference (IV, Fixed, 95% CI) | ‐2.00 [‐6.46, 2.46] |
| 1.3.2 Registry | 2 | 442 | Mean Difference (IV, Fixed, 95% CI) | 1.68 [‐2.49, 5.85] |
| 1.4 IQ <2SD | 1 | Risk Ratio (M‐H, Fixed, 95% CI) | Subtotals only | |
| 1.5 VIQ | 2 | 487 | Mean Difference (IV, Fixed, 95% CI) | ‐1.81 [‐4.94, 1.33] |
| 1.5.1 Prospective | 2 | 487 | Mean Difference (IV, Fixed, 95% CI) | ‐1.81 [‐4.94, 1.33] |
| 1.6 PIQ | 2 | 487 | Mean Difference (IV, Fixed, 95% CI) | 1.27 [‐1.55, 4.09] |
| 1.6.1 Prospective | 2 | 487 | Mean Difference (IV, Fixed, 95% CI) | 1.27 [‐1.55, 4.09] |
1.4. Analysis.
Comparison 1: CBZ versus controls (women without epilepsy), Outcome 4: IQ <2SD
Comparison 2. CBZ versus controls (women with epilepsy, no AED treatment).
| Outcome or subgroup title | No. of studies | No. of participants | Statistical method | Effect size |
|---|---|---|---|---|
| 2.1 Development (Griffiths) | 1 | Mean Difference (IV, Fixed, 95% CI) | Subtotals only | |
| 2.1.1 Prospective | 1 | 75 | Mean Difference (IV, Fixed, 95% CI) | ‐6.00 [‐11.35, ‐0.65] |
| 2.2 Development (Bayley) | 2 | 221 | Mean Difference (IV, Fixed, 95% CI) | ‐7.22 [‐12.76, ‐1.67] |
| 2.2.1 Prospective | 2 | 221 | Mean Difference (IV, Fixed, 95% CI) | ‐7.22 [‐12.76, ‐1.67] |
| 2.3 IQ | 4 | 250 | Mean Difference (IV, Fixed, 95% CI) | 1.84 [‐2.13, 5.80] |
| 2.3.1 Prospective | 2 | 93 | Mean Difference (IV, Fixed, 95% CI) | 1.27 [‐5.08, 7.63] |
| 2.3.2 Registry | 2 | 157 | Mean Difference (IV, Fixed, 95% CI) | 2.20 [‐2.87, 7.28] |
| 2.4 VPA below vs CBZ below IQ > 1SD | 1 | Risk Ratio (M‐H, Fixed, 95% CI) | Subtotals only | |
| 2.4.1 Registry | 1 | 26 | Risk Ratio (M‐H, Fixed, 95% CI) | 5.00 [0.26, 95.02] |
| 2.5 IQ > 2SD | 1 | Risk Ratio (M‐H, Fixed, 95% CI) | Subtotals only | |
| 2.5.1 Registry | 1 | 131 | Risk Ratio (M‐H, Fixed, 95% CI) | 0.26 [0.02, 2.81] |
| 2.6 VIQ | 3 | 232 | Mean Difference (IV, Fixed, 95% CI) | 0.13 [‐3.98, 4.23] |
| 2.6.1 Prospective | 1 | 75 | Mean Difference (IV, Fixed, 95% CI) | ‐1.00 [‐7.28, 5.28] |
| 2.6.2 Registry | 2 | 157 | Mean Difference (IV, Fixed, 95% CI) | 0.97 [‐4.47, 6.40] |
| 2.7 PIQ | 3 | 232 | Mean Difference (IV, Fixed, 95% CI) | 3.65 [‐0.60, 7.90] |
| 2.7.1 Prospective | 1 | 75 | Mean Difference (IV, Fixed, 95% CI) | 4.00 [‐2.72, 10.72] |
| 2.7.2 Registry | 2 | 157 | Mean Difference (IV, Fixed, 95% CI) | 3.42 [‐2.07, 8.91] |
2.1. Analysis.
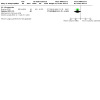
Comparison 2: CBZ versus controls (women with epilepsy, no AED treatment), Outcome 1: Development (Griffiths)
2.4. Analysis.

Comparison 2: CBZ versus controls (women with epilepsy, no AED treatment), Outcome 4: VPA below vs CBZ below IQ > 1SD
2.5. Analysis.
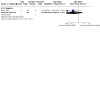
Comparison 2: CBZ versus controls (women with epilepsy, no AED treatment), Outcome 5: IQ > 2SD
Comparison 3. VPA versus controls (women without epilepsy).
| Outcome or subgroup title | No. of studies | No. of participants | Statistical method | Effect size |
|---|---|---|---|---|
| 3.1 Development (Griffiths) | 1 | Mean Difference (IV, Fixed, 95% CI) | Subtotals only | |
| 3.1.1 Prospective | 1 | 272 | Mean Difference (IV, Fixed, 95% CI) | ‐8.00 [‐12.79, ‐3.21] |
| 3.2 Development (Bayley) | 1 | Mean Difference (IV, Fixed, 95% CI) | Subtotals only | |
| 3.2.1 Prospective | 1 | 18 | Mean Difference (IV, Fixed, 95% CI) | ‐13.30 [‐23.51, ‐3.09] |
| 3.3 IQ | 3 | 628 | Mean Difference (IV, Fixed, 95% CI) | ‐8.94 [‐11.96, ‐5.92] |
| 3.3.1 Prospective | 1 | 261 | Mean Difference (IV, Fixed, 95% CI) | ‐12.22 [‐15.84, ‐8.60] |
| 3.3.2 Registry | 2 | 367 | Mean Difference (IV, Fixed, 95% CI) | ‐1.48 [‐6.94, 3.98] |
| 3.4 IQ <2SD | 1 | Risk Ratio (M‐H, Fixed, 95% CI) | Subtotals only | |
| 3.4.1 Registry | 1 | 154 | Risk Ratio (M‐H, Fixed, 95% CI) | 2.71 [0.33, 22.51] |
| 3.5 IQ <1SD | 1 | Risk Ratio (M‐H, Fixed, 95% CI) | Subtotals only | |
| 3.5.1 Prospective | 1 | 236 | Risk Ratio (M‐H, Fixed, 95% CI) | 16.88 [6.27, 45.44] |
| 3.6 VIQ | 2 | 415 | Mean Difference (IV, Fixed, 95% CI) | ‐11.39 [‐14.68, ‐8.10] |
| 3.6.1 Prospective | 1 | 261 | Mean Difference (IV, Fixed, 95% CI) | ‐11.39 [‐15.02, ‐7.76] |
| 3.6.2 Registry | 1 | 154 | Mean Difference (IV, Fixed, 95% CI) | ‐11.40 [‐19.21, ‐3.59] |
| 3.7 PIQ | 2 | 456 | Mean Difference (IV, Fixed, 95% CI) | ‐10.48 [‐13.94, ‐7.02] |
| 3.7.1 Prospective | 1 | 261 | Mean Difference (IV, Fixed, 95% CI) | ‐8.94 [‐12.79, ‐5.09] |
| 3.7.2 Registry | 1 | 195 | Mean Difference (IV, Fixed, 95% CI) | ‐16.80 [‐24.61, ‐8.99] |
3.1. Analysis.
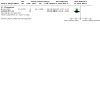
Comparison 3: VPA versus controls (women without epilepsy), Outcome 1: Development (Griffiths)
3.2. Analysis.

Comparison 3: VPA versus controls (women without epilepsy), Outcome 2: Development (Bayley)
3.4. Analysis.
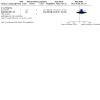
Comparison 3: VPA versus controls (women without epilepsy), Outcome 4: IQ <2SD
3.5. Analysis.
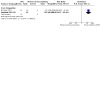
Comparison 3: VPA versus controls (women without epilepsy), Outcome 5: IQ <1SD
Comparison 4. VPA versus controls (women with epilepsy, no AED treatment).
| Outcome or subgroup title | No. of studies | No. of participants | Statistical method | Effect size |
|---|---|---|---|---|
| 4.1 Development (Griffiths) | 1 | Mean Difference (IV, Fixed, 95% CI) | Subtotals only | |
| 4.1.1 Prospective | 1 | 69 | Mean Difference (IV, Fixed, 95% CI) | ‐12.00 [‐17.73, ‐6.27] |
| 4.2 Development (Bayley) | 2 | 181 | Mean Difference (IV, Fixed, 95% CI) | ‐8.72 [‐14.31, ‐3.14] |
| 4.2.1 Prospective | 2 | 181 | Mean Difference (IV, Fixed, 95% CI) | ‐8.72 [‐14.31, ‐3.14] |
| 4.3 IQ | 4 | 176 | Mean Difference (IV, Fixed, 95% CI) | ‐8.17 [‐12.80, ‐3.55] |
| 4.3.1 Prospective | 1 | 76 | Mean Difference (IV, Fixed, 95% CI) | ‐9.30 [‐15.34, ‐3.26] |
| 4.3.2 Registry | 3 | 100 | Mean Difference (IV, Fixed, 95% CI) | ‐6.58 [‐13.77, 0.62] |
| 4.4 IQ < 1SD | 2 | 76 | Risk Ratio (M‐H, Fixed, 95% CI) | 10.33 [2.05, 52.01] |
| 4.4.1 Prospective | 1 | 50 | Risk Ratio (M‐H, Fixed, 95% CI) | 10.00 [1.38, 72.39] |
| 4.4.2 Registry | 1 | 26 | Risk Ratio (M‐H, Fixed, 95% CI) | 11.00 [0.67, 180.65] |
| 4.5 IQ <2SD | 1 | Risk Ratio (M‐H, Fixed, 95% CI) | Subtotals only | |
| 4.5.1 Registry | 1 | 58 | Risk Ratio (M‐H, Fixed, 95% CI) | 1.73 [0.17, 17.61] |
| 4.6 VIQ | 3 | 160 | Mean Difference (IV, Fixed, 95% CI) | ‐8.81 [‐13.32, ‐4.30] |
| 4.6.1 Prospective | 1 | 76 | Mean Difference (IV, Fixed, 95% CI) | ‐7.45 [‐13.02, ‐1.88] |
| 4.6.2 Registry | 2 | 84 | Mean Difference (IV, Fixed, 95% CI) | ‐11.42 [‐19.13, ‐3.72] |
| 4.7 PIQ | 3 | 160 | Mean Difference (IV, Fixed, 95% CI) | ‐7.20 [‐12.44, ‐1.96] |
| 4.7.1 Prospective | 1 | 76 | Mean Difference (IV, Fixed, 95% CI) | ‐7.30 [‐13.71, ‐0.89] |
| 4.7.2 Registry | 2 | 84 | Mean Difference (IV, Fixed, 95% CI) | ‐7.01 [‐16.13, 2.11] |
4.1. Analysis.
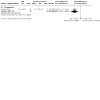
Comparison 4: VPA versus controls (women with epilepsy, no AED treatment), Outcome 1: Development (Griffiths)
4.4. Analysis.
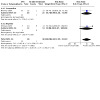
Comparison 4: VPA versus controls (women with epilepsy, no AED treatment), Outcome 4: IQ < 1SD
4.5. Analysis.
Comparison 4: VPA versus controls (women with epilepsy, no AED treatment), Outcome 5: IQ <2SD
Comparison 5. PHT versus controls (women without epilepsy).
| Outcome or subgroup title | No. of studies | No. of participants | Statistical method | Effect size |
|---|---|---|---|---|
| 5.1 Development (Bayley) | 2 | 64 | Mean Difference (IV, Fixed, 95% CI) | ‐0.12 [‐7.54, 7.30] |
| 5.1.1 Prospective | 2 | 64 | Mean Difference (IV, Fixed, 95% CI) | ‐0.12 [‐7.54, 7.30] |
| 5.2 IQ | 1 | Mean Difference (IV, Fixed, 95% CI) | Subtotals only | |
| 5.2.1 Registry | 1 | 206 | Mean Difference (IV, Fixed, 95% CI) | 4.80 [‐4.10, 13.70] |
5.2. Analysis.
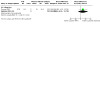
Comparison 5: PHT versus controls (women without epilepsy), Outcome 2: IQ
Comparison 6. PHT versus controls (women with epilepsy, no AED treatment).
| Outcome or subgroup title | No. of studies | No. of participants | Statistical method | Effect size |
|---|---|---|---|---|
| 6.1 Developmental (Bayley) | 1 | Mean Difference (IV, Fixed, 95% CI) | Subtotals only | |
| 6.1.1 Prospective | 1 | 61 | Mean Difference (IV, Fixed, 95% CI) | ‐2.00 [‐18.26, 14.26] |
| 6.2 IQ | 1 | Mean Difference (IV, Fixed, 95% CI) | Subtotals only | |
| 6.2.1 Registry | 1 | 9 | Mean Difference (IV, Fixed, 95% CI) | 11.00 [‐12.60, 34.60] |
6.1. Analysis.
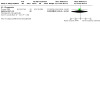
Comparison 6: PHT versus controls (women with epilepsy, no AED treatment), Outcome 1: Developmental (Bayley)
6.2. Analysis.
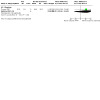
Comparison 6: PHT versus controls (women with epilepsy, no AED treatment), Outcome 2: IQ
Comparison 7. PB versus controls (women without epilepsy).
| Outcome or subgroup title | No. of studies | No. of participants | Statistical method | Effect size |
|---|---|---|---|---|
| 7.1 IQ | 1 | Mean Difference (IV, Fixed, 95% CI) | Subtotals only | |
| 7.1.1 Registry | 1 | 215 | Mean Difference (IV, Fixed, 95% CI) | ‐6.80 [‐12.90, ‐0.70] |
7.1. Analysis.
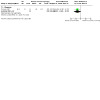
Comparison 7: PB versus controls (women without epilepsy), Outcome 1: IQ
Comparison 8. PB versus controls (women with epilepsy, no AED treatment).
| Outcome or subgroup title | No. of studies | No. of participants | Statistical method | Effect size |
|---|---|---|---|---|
| 8.1 Developmental (Bayley) | 1 | Mean Difference (IV, Fixed, 95% CI) | Subtotals only | |
| 8.1.1 Prospective | 1 | 73 | Mean Difference (IV, Fixed, 95% CI) | ‐2.00 [‐14.33, 10.33] |
| 8.2 IQ | 1 | Mean Difference (IV, Fixed, 95% CI) | Subtotals only | |
| 8.2.1 Registry | 1 | 18 | Mean Difference (IV, Fixed, 95% CI) | ‐0.60 [‐23.30, 22.10] |
8.1. Analysis.
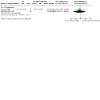
Comparison 8: PB versus controls (women with epilepsy, no AED treatment), Outcome 1: Developmental (Bayley)
8.2. Analysis.
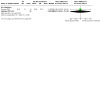
Comparison 8: PB versus controls (women with epilepsy, no AED treatment), Outcome 2: IQ
Comparison 9. LTG versus controls (women without epilepsy).
| Outcome or subgroup title | No. of studies | No. of participants | Statistical method | Effect size |
|---|---|---|---|---|
| 9.1 Developmental (Griffiths) | 1 | Mean Difference (IV, Fixed, 95% CI) | Subtotals only | |
| 9.1.1 Prospective | 1 | 264 | Mean Difference (IV, Fixed, 95% CI) | ‐1.00 [‐5.75, 3.75] |
| 9.2 IQ | 1 | Mean Difference (IV, Fixed, 95% CI) | Subtotals only | |
| 9.2.1 Prospective | 1 | 239 | Mean Difference (IV, Fixed, 95% CI) | ‐4.00 [‐8.32, 0.32] |
9.1. Analysis.
Comparison 9: LTG versus controls (women without epilepsy), Outcome 1: Developmental (Griffiths)
9.2. Analysis.
Comparison 9: LTG versus controls (women without epilepsy), Outcome 2: IQ
Comparison 10. LTG versus controls (women with epilepsy, no AED treatment).
| Outcome or subgroup title | No. of studies | No. of participants | Statistical method | Effect size |
|---|---|---|---|---|
| 10.1 Developmental (Griffiths) | 1 | Mean Difference (IV, Fixed, 95% CI) | Subtotals only | |
| 10.1.1 Prospective | 1 | 61 | Mean Difference (IV, Fixed, 95% CI) | ‐5.00 [‐10.70, 0.70] |
| 10.2 IQ | 1 | Mean Difference (IV, Fixed, 95% CI) | Subtotals only | |
| 10.2.1 Prospective | 1 | 54 | Mean Difference (IV, Fixed, 95% CI) | ‐1.00 [‐7.48, 5.48] |
10.1. Analysis.
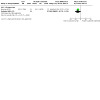
Comparison 10: LTG versus controls (women with epilepsy, no AED treatment), Outcome 1: Developmental (Griffiths)
10.2. Analysis.

Comparison 10: LTG versus controls (women with epilepsy, no AED treatment), Outcome 2: IQ
Comparison 11. LEV versus control (women without epilepsy).
| Outcome or subgroup title | No. of studies | No. of participants | Statistical method | Effect size |
|---|---|---|---|---|
| 11.1 Developmental (Griffiths) | 1 | Mean Difference (IV, Fixed, 95% CI) | Subtotals only | |
| 11.1.1 Prospective | 0 | 0 | Mean Difference (IV, Fixed, 95% CI) | Not estimable |
| 11.1.2 Registry | 1 | 148 | Mean Difference (IV, Fixed, 95% CI) | 1.09 [‐2.81, 4.99] |
11.1. Analysis.
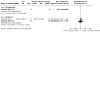
Comparison 11: LEV versus control (women without epilepsy), Outcome 1: Developmental (Griffiths)
Comparison 12. CBZ versus LTG.
| Outcome or subgroup title | No. of studies | No. of participants | Statistical method | Effect size |
|---|---|---|---|---|
| 12.1 Development (Bayley) | 1 | Mean Difference (IV, Fixed, 95% CI) | Subtotals only | |
| 12.1.1 Prospective | 1 | 100 | Mean Difference (IV, Fixed, 95% CI) | ‐3.00 [‐9.29, 3.29] |
| 12.2 IQ | 2 | 162 | Mean Difference (IV, Fixed, 95% CI) | ‐1.62 [‐5.44, 2.21] |
| 12.2.1 Prospective | 2 | 162 | Mean Difference (IV, Fixed, 95% CI) | ‐1.62 [‐5.44, 2.21] |
| 12.3 IQ>1SD | 2 | 159 | Risk Ratio (M‐H, Fixed, 95% CI) | 2.28 [0.63, 8.22] |
| 12.3.1 Prospective | 2 | 159 | Risk Ratio (M‐H, Fixed, 95% CI) | 2.28 [0.63, 8.22] |
12.1. Analysis.
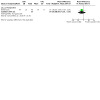
Comparison 12: CBZ versus LTG, Outcome 1: Development (Bayley)
Comparison 13. CBZ versus PHT.
| Outcome or subgroup title | No. of studies | No. of participants | Statistical method | Effect size |
|---|---|---|---|---|
| 13.1 Development (Bayley) | 4 | 259 | Mean Difference (IV, Fixed, 95% CI) | 3.02 [‐2.41, 8.46] |
| 13.1.1 Prospective | 4 | 259 | Mean Difference (IV, Fixed, 95% CI) | 3.02 [‐2.41, 8.46] |
| 13.2 IQ | 2 | 120 | Mean Difference (IV, Fixed, 95% CI) | ‐3.30 [‐7.91, 1.30] |
| 13.2.1 Prospective | 1 | 101 | Mean Difference (IV, Fixed, 95% CI) | ‐3.00 [‐7.86, 1.86] |
| 13.2.2 Registry | 1 | 19 | Mean Difference (IV, Fixed, 95% CI) | ‐5.90 [‐20.20, 8.40] |
| 13.3 DQ>1SD | 2 | 220 | Risk Ratio (M‐H, Fixed, 95% CI) | 0.78 [0.52, 1.15] |
| 13.3.1 Prospective | 2 | 220 | Risk Ratio (M‐H, Fixed, 95% CI) | 0.78 [0.52, 1.15] |
Comparison 14. VPA versus LTG.
| Outcome or subgroup title | No. of studies | No. of participants | Statistical method | Effect size |
|---|---|---|---|---|
| 14.1 Development (Bayley) | 1 | Mean Difference (IV, Fixed, 95% CI) | Subtotals only | |
| 14.1.1 Prospective | 1 | 85 | Mean Difference (IV, Fixed, 95% CI) | ‐12.00 [‐20.31, ‐3.69] |
| 14.2 IQ | 2 | 158 | Mean Difference (IV, Fixed, 95% CI) | ‐10.80 [‐14.42, ‐7.17] |
| 14.2.1 Prospective | 2 | 158 | Mean Difference (IV, Fixed, 95% CI) | ‐10.80 [‐14.42, ‐7.17] |
| 14.3 IQ>1SD | 2 | 157 | Risk Ratio (M‐H, Fixed, 95% CI) | 4.87 [1.50, 15.78] |
| 14.3.1 Prospective | 2 | 157 | Risk Ratio (M‐H, Fixed, 95% CI) | 4.87 [1.50, 15.78] |
14.1. Analysis.
Comparison 14: VPA versus LTG, Outcome 1: Development (Bayley)
Comparison 15. LEV versus VPA.
| Outcome or subgroup title | No. of studies | No. of participants | Statistical method | Effect size |
|---|---|---|---|---|
| 15.1 Development (Griffiths) | 1 | Mean Difference (IV, Fixed, 95% CI) | Subtotals only | |
| 15.1.1 Registry | 1 | 95 | Mean Difference (IV, Fixed, 95% CI) | 12.03 [6.24, 17.82] |
15.1. Analysis.
Comparison 15: LEV versus VPA, Outcome 1: Development (Griffiths)
Comparison 16. PHT versus VPA.
| Outcome or subgroup title | No. of studies | No. of participants | Statistical method | Effect size |
|---|---|---|---|---|
| 16.1 Development (Bayley) | 3 | 188 | Mean Difference (IV, Fixed, 95% CI) | 7.04 [0.44, 13.65] |
| 16.1.1 Prospective | 3 | 188 | Mean Difference (IV, Fixed, 95% CI) | 7.04 [0.44, 13.65] |
| 16.2 IQ | 2 | 106 | Mean Difference (IV, Fixed, 95% CI) | 9.25 [4.78, 13.72] |
| 16.2.1 Prospective | 1 | 89 | Mean Difference (IV, Fixed, 95% CI) | 11.00 [6.15, 15.85] |
| 16.2.2 Registry | 1 | 17 | Mean Difference (IV, Fixed, 95% CI) | ‐0.70 [‐12.26, 10.86] |
| 16.3 DQ>1SD | 2 | 191 | Risk Ratio (M‐H, Fixed, 95% CI) | 1.40 [0.91, 2.15] |
| 16.3.1 Prospective | 2 | 191 | Risk Ratio (M‐H, Fixed, 95% CI) | 1.40 [0.91, 2.15] |
Comparison 17. CBZ versus VPA.
| Outcome or subgroup title | No. of studies | No. of participants | Statistical method | Effect size |
|---|---|---|---|---|
| 17.1 Development (Bayley) | 4 | 370 | Mean Difference (IV, Fixed, 95% CI) | 4.16 [‐0.21, 8.54] |
| 17.1.1 Prospective | 4 | 370 | Mean Difference (IV, Fixed, 95% CI) | 4.16 [‐0.21, 8.54] |
| 17.2 IQ | 5 | 303 | Mean Difference (IV, Fixed, 95% CI) | 8.69 [5.51, 11.87] |
| 17.2.1 Prospective | 2 | 152 | Mean Difference (IV, Fixed, 95% CI) | 9.19 [5.49, 12.88] |
| 17.2.2 Registry | 3 | 151 | Mean Difference (IV, Fixed, 95% CI) | 7.29 [1.06, 13.53] |
| 17.3 VIQ | 3 | 226 | Mean Difference (IV, Fixed, 95% CI) | 8.44 [4.21, 12.66] |
| 17.4 PIQ | 3 | 226 | Mean Difference (IV, Fixed, 95% CI) | 10.48 [6.02, 14.94] |
| 17.5 DQ>1SD | 3 | 363 | Risk Ratio (M‐H, Fixed, 95% CI) | 0.83 [0.62, 1.12] |
| 17.5.1 Prospective | 3 | 363 | Risk Ratio (M‐H, Fixed, 95% CI) | 0.83 [0.62, 1.12] |
| 17.6 DQ>2SD | 2 | 191 | Risk Ratio (M‐H, Fixed, 95% CI) | 0.77 [0.38, 1.58] |
| 17.6.1 Prospective | 2 | 191 | Risk Ratio (M‐H, Fixed, 95% CI) | 0.77 [0.38, 1.58] |
| 17.7 IQ>2SD | 4 | 277 | Risk Ratio (M‐H, Fixed, 95% CI) | 0.26 [0.05, 1.19] |
| 17.7.1 Prospective | 2 | 152 | Risk Ratio (M‐H, Fixed, 95% CI) | 0.40 [0.04, 4.30] |
| 17.7.2 Registry | 2 | 125 | Risk Ratio (M‐H, Fixed, 95% CI) | 0.18 [0.02, 1.46] |
| 17.8 IQ>1SD | 3 | 178 | Risk Ratio (M‐H, Fixed, 95% CI) | 0.40 [0.19, 0.83] |
| 17.8.1 Prospective | 2 | 152 | Risk Ratio (M‐H, Fixed, 95% CI) | 0.40 [0.17, 0.93] |
| 17.8.2 Registry | 1 | 26 | Risk Ratio (M‐H, Fixed, 95% CI) | 0.40 [0.09, 1.70] |
Comparison 18. PHT versus LTG.
| Outcome or subgroup title | No. of studies | No. of participants | Statistical method | Effect size |
|---|---|---|---|---|
| 18.1 Developmental (Bayley) | 1 | Mean Difference (IV, Fixed, 95% CI) | Subtotals only | |
| 18.1.1 Prospective | 1 | 95 | Mean Difference (IV, Fixed, 95% CI) | ‐7.00 [‐14.48, 0.48] |
| 18.2 IQ | 1 | Mean Difference (IV, Fixed, 95% CI) | Subtotals only | |
| 18.2.1 Prospective | 1 | 114 | Mean Difference (IV, Fixed, 95% CI) | 1.00 [‐3.87, 5.87] |
18.1. Analysis.
Comparison 18: PHT versus LTG, Outcome 1: Developmental (Bayley)
18.2. Analysis.
Comparison 18: PHT versus LTG, Outcome 2: IQ
Comparison 19. CBZ versus PB.
| Outcome or subgroup title | No. of studies | No. of participants | Statistical method | Effect size |
|---|---|---|---|---|
| 19.1 Developmental (Bayley) | 1 | Mean Difference (IV, Fixed, 95% CI) | Subtotals only | |
| 19.1.1 Prospective | 1 | 142 | Mean Difference (IV, Fixed, 95% CI) | 2.80 [‐5.61, 11.21] |
| 19.2 IQ | 1 | Mean Difference (IV, Fixed, 95% CI) | Subtotals only | |
| 19.2.1 Registry | 1 | 28 | Mean Difference (IV, Fixed, 95% CI) | 5.70 [‐7.04, 18.44] |
| 19.3 DQ >1SD | 1 | Risk Ratio (M‐H, Fixed, 95% CI) | Subtotals only | |
| 19.3.1 Prospective | 1 | 142 | Risk Ratio (M‐H, Fixed, 95% CI) | 1.11 [0.62, 1.99] |
19.1. Analysis.
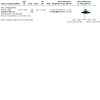
Comparison 19: CBZ versus PB, Outcome 1: Developmental (Bayley)
19.2. Analysis.
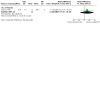
Comparison 19: CBZ versus PB, Outcome 2: IQ
19.3. Analysis.
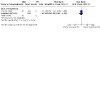
Comparison 19: CBZ versus PB, Outcome 3: DQ >1SD
Comparison 20. VPA versus PB.
| Outcome or subgroup title | No. of studies | No. of participants | Statistical method | Effect size |
|---|---|---|---|---|
| 20.1 Developmental (Bayley) | 1 | Mean Difference (IV, Fixed, 95% CI) | Subtotals only | |
| 20.1.1 Prospective | 1 | 112 | Mean Difference (IV, Fixed, 95% CI) | ‐3.40 [‐13.45, 6.65] |
| 20.2 IQ | 1 | Mean Difference (IV, Fixed, 95% CI) | Subtotals only | |
| 20.2.1 Registry | 1 | 26 | Mean Difference (IV, Fixed, 95% CI) | 12.30 [2.73, 21.87] |
20.1. Analysis.
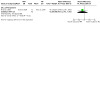
Comparison 20: VPA versus PB, Outcome 1: Developmental (Bayley)
20.2. Analysis.
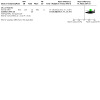
Comparison 20: VPA versus PB, Outcome 2: IQ
Comparison 21. PHT versus PB.
| Outcome or subgroup title | No. of studies | No. of participants | Statistical method | Effect size |
|---|---|---|---|---|
| 21.1 Developmental (Bayley) | 1 | Mean Difference (IV, Fixed, 95% CI) | Subtotals only | |
| 21.1.1 Prospective | 1 | 70 | Mean Difference (IV, Fixed, 95% CI) | 0.00 [‐14.03, 14.03] |
| 21.2 IQ | 1 | Mean Difference (IV, Fixed, 95% CI) | Subtotals only | |
| 21.2.1 Prospective | 1 | 19 | Mean Difference (IV, Fixed, 95% CI) | 11.60 [1.18, 22.02] |
| 21.3 DQ >1SD | 1 | Risk Ratio (M‐H, Fixed, 95% CI) | Subtotals only |
21.1. Analysis.
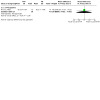
Comparison 21: PHT versus PB, Outcome 1: Developmental (Bayley)
21.2. Analysis.

Comparison 21: PHT versus PB, Outcome 2: IQ
21.3. Analysis.
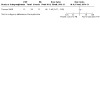
Comparison 21: PHT versus PB, Outcome 3: DQ >1SD
Comparison 22. Monotherapy versus controls (women without epilepsy).
| Outcome or subgroup title | No. of studies | No. of participants | Statistical method | Effect size |
|---|---|---|---|---|
| 22.1 Developmental (Griffiths) | 1 | Mean Difference (IV, Fixed, 95% CI) | Subtotals only | |
| 22.1.1 Prospective | 1 | 368 | Mean Difference (IV, Fixed, 95% CI) | ‐4.00 [‐6.86, ‐1.14] |
| 22.2 Developmental (Bayley) | 1 | Mean Difference (IV, Fixed, 95% CI) | Subtotals only | |
| 22.2.1 Prospective | 1 | 92 | Mean Difference (IV, Fixed, 95% CI) | ‐2.10 [‐7.82, 3.62] |
| 22.3 IQ | 3 | 573 | Mean Difference (IV, Fixed, 95% CI) | ‐1.30 [‐4.12, 1.51] |
| 22.3.1 Prospective | 1 | 80 | Mean Difference (IV, Fixed, 95% CI) | ‐5.70 [‐11.53, 0.13] |
| 22.3.2 Registry | 2 | 493 | Mean Difference (IV, Fixed, 95% CI) | 0.04 [‐3.18, 3.26] |
22.1. Analysis.

Comparison 22: Monotherapy versus controls (women without epilepsy), Outcome 1: Developmental (Griffiths)
22.2. Analysis.
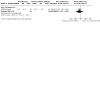
Comparison 22: Monotherapy versus controls (women without epilepsy), Outcome 2: Developmental (Bayley)
22.3. Analysis.
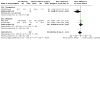
Comparison 22: Monotherapy versus controls (women without epilepsy), Outcome 3: IQ
Comparison 23. Monotherapy versus controls (women with epilepsy, no AED treatment).
| Outcome or subgroup title | No. of studies | No. of participants | Statistical method | Effect size |
|---|---|---|---|---|
| 23.1 Development (Griffiths) | 1 | Mean Difference (IV, Fixed, 95% CI) | Subtotals only | |
| 23.1.1 Prospective | 1 | 165 | Mean Difference (IV, Fixed, 95% CI) | ‐8.00 [‐12.16, ‐3.84] |
| 23.2 Developmental (Bayley) | 1 | Mean Difference (IV, Fixed, 95% CI) | Subtotals only | |
| 23.2.1 Prospective | 1 | 278 | Mean Difference (IV, Fixed, 95% CI) | ‐1.70 [‐12.80, 9.40] |
| 23.3 IQ | 2 | 196 | Mean Difference (IV, Fixed, 95% CI) | 1.30 [‐4.19, 6.80] |
| 23.3.1 Prospective | 1 | 44 | Mean Difference (IV, Fixed, 95% CI) | ‐2.10 [‐13.22, 9.02] |
| 23.3.2 Registry | 1 | 152 | Mean Difference (IV, Fixed, 95% CI) | 2.40 [‐3.92, 8.72] |
23.1. Analysis.
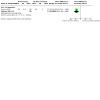
Comparison 23: Monotherapy versus controls (women with epilepsy, no AED treatment), Outcome 1: Development (Griffiths)
23.2. Analysis.
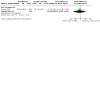
Comparison 23: Monotherapy versus controls (women with epilepsy, no AED treatment), Outcome 2: Developmental (Bayley)
23.3. Analysis.
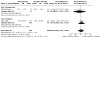
Comparison 23: Monotherapy versus controls (women with epilepsy, no AED treatment), Outcome 3: IQ
Comparison 24. Polytherapy versus controls (women without epilepsy).
| Outcome or subgroup title | No. of studies | No. of participants | Statistical method | Effect size |
|---|---|---|---|---|
| 24.1 Developmental (Griffiths) | 1 | Mean Difference (IV, Fixed, 95% CI) | Subtotals only | |
| 24.1.1 Prospective | 1 | 260 | Mean Difference (IV, Fixed, 95% CI) | ‐6.00 [‐13.27, 1.27] |
| 24.2 Developmental (Bayley) | 1 | Mean Difference (IV, Fixed, 95% CI) | Subtotals only | |
| 24.2.1 Prospective | 1 | 82 | Mean Difference (IV, Fixed, 95% CI) | ‐7.50 [‐12.32, ‐2.68] |
| 24.3 IQ | 4 | 707 | Mean Difference (IV, Fixed, 95% CI) | ‐8.57 [‐11.77, ‐5.38] |
| 24.3.1 Prospective | 2 | 312 | Mean Difference (IV, Fixed, 95% CI) | ‐8.24 [‐12.39, ‐4.09] |
| 24.3.2 Registry | 2 | 395 | Mean Difference (IV, Fixed, 95% CI) | ‐9.06 [‐14.07, ‐4.06] |
24.1. Analysis.

Comparison 24: Polytherapy versus controls (women without epilepsy), Outcome 1: Developmental (Griffiths)
24.2. Analysis.
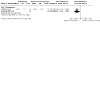
Comparison 24: Polytherapy versus controls (women without epilepsy), Outcome 2: Developmental (Bayley)
24.3. Analysis.

Comparison 24: Polytherapy versus controls (women without epilepsy), Outcome 3: IQ
Comparison 25. Polytherapy versus controls (women with epilepsy, no AED treatment).
| Outcome or subgroup title | No. of studies | No. of participants | Statistical method | Effect size |
|---|---|---|---|---|
| 25.1 Developmental (Griffiths) | 1 | Mean Difference (IV, Fixed, 95% CI) | Subtotals only | |
| 25.1.1 Prospective | 1 | 57 | Mean Difference (IV, Fixed, 95% CI) | ‐10.00 [‐17.92, ‐2.08] |
| 25.2 Developmental (Bayley) | 1 | Mean Difference (IV, Fixed, 95% CI) | Subtotals only | |
| 25.2.1 Prospective | 1 | 154 | Mean Difference (IV, Fixed, 95% CI) | ‐8.50 [‐20.31, 3.31] |
| 25.3 IQ | 3 | 165 | Mean Difference (IV, Fixed, 95% CI) | ‐5.70 [‐10.31, ‐1.08] |
| 25.3.1 Prospective | 2 | 90 | Mean Difference (IV, Fixed, 95% CI) | ‐5.42 [‐11.42, 0.58] |
| 25.3.2 Registry | 1 | 75 | Mean Difference (IV, Fixed, 95% CI) | ‐6.10 [‐13.33, 1.13] |
25.1. Analysis.

Comparison 25: Polytherapy versus controls (women with epilepsy, no AED treatment), Outcome 1: Developmental (Griffiths)
25.2. Analysis.
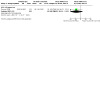
Comparison 25: Polytherapy versus controls (women with epilepsy, no AED treatment), Outcome 2: Developmental (Bayley)
25.3. Analysis.

Comparison 25: Polytherapy versus controls (women with epilepsy, no AED treatment), Outcome 3: IQ
Comparison 26. Monotherapy versus polytherapy.
| Outcome or subgroup title | No. of studies | No. of participants | Statistical method | Effect size |
|---|---|---|---|---|
| 26.1 Developmental (Griffiths) | 1 | Mean Difference (IV, Fixed, 95% CI) | Subtotals only | |
| 26.1.1 Prospective | 1 | 168 | Mean Difference (IV, Fixed, 95% CI) | 2.00 [‐4.08, 8.08] |
| 26.2 Developmental (Bayley) | 2 | 433 | Mean Difference (IV, Fixed, 95% CI) | 8.80 [3.44, 14.17] |
| 26.2.1 Prospective | 2 | 433 | Mean Difference (IV, Fixed, 95% CI) | 8.80 [3.44, 14.17] |
| 26.3 IQ | 3 | 257 | Mean Difference (IV, Fixed, 95% CI) | 8.84 [4.35, 13.32] |
| 26.3.1 Prospective | 2 | 120 | Mean Difference (IV, Fixed, 95% CI) | 9.41 [2.04, 16.77] |
| 26.3.2 Registry | 1 | 137 | Mean Difference (IV, Fixed, 95% CI) | 8.50 [2.85, 14.15] |
26.1. Analysis.
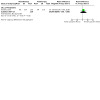
Comparison 26: Monotherapy versus polytherapy, Outcome 1: Developmental (Griffiths)
26.2. Analysis.
Comparison 26: Monotherapy versus polytherapy, Outcome 2: Developmental (Bayley)
26.3. Analysis.
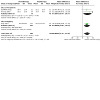
Comparison 26: Monotherapy versus polytherapy, Outcome 3: IQ
Comparison 27. VPA monotherapy versus VPA polytherapy.
| Outcome or subgroup title | No. of studies | No. of participants | Statistical method | Effect size |
|---|---|---|---|---|
| 27.1 Developmental (Bayley) | 1 | Mean Difference (IV, Fixed, 95% CI) | Subtotals only | |
| 27.1.1 Prospective | 1 | 57 | Mean Difference (IV, Fixed, 95% CI) | 12.28 [‐10.68, 35.24] |
| 27.2 IQ | 3 | 138 | Mean Difference (IV, Fixed, 95% CI) | 1.96 [‐2.68, 6.61] |
| 27.2.1 Prospective | 1 | 70 | Mean Difference (IV, Fixed, 95% CI) | ‐3.30 [‐9.88, 3.28] |
| 27.2.2 Registry | 2 | 68 | Mean Difference (IV, Fixed, 95% CI) | 7.20 [0.64, 13.76] |
27.1. Analysis.
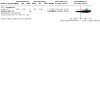
Comparison 27: VPA monotherapy versus VPA polytherapy, Outcome 1: Developmental (Bayley)
27.2. Analysis.
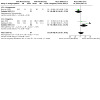
Comparison 27: VPA monotherapy versus VPA polytherapy, Outcome 2: IQ
Comparison 28. VPA polytherapy versus non‐VPA polytherapy.
| Outcome or subgroup title | No. of studies | No. of participants | Statistical method | Effect size |
|---|---|---|---|---|
| 28.1 IQ | 2 | 64 | Mean Difference (IV, Fixed, 95% CI) | ‐8.74 [‐15.70, ‐1.78] |
| 28.1.1 Prospective | 1 | 30 | Mean Difference (IV, Fixed, 95% CI) | ‐5.00 [‐14.65, 4.65] |
| 28.1.2 Registry | 1 | 34 | Mean Difference (IV, Fixed, 95% CI) | ‐12.80 [‐22.86, ‐2.74] |
28.1. Analysis.
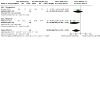
Comparison 28: VPA polytherapy versus non‐VPA polytherapy, Outcome 1: IQ
Characteristics of studies
Characteristics of included studies [ordered by study ID]
Arulmozhi 2006.
| Study characteristics | ||
| Methods | An open prospective cohort controlled study (India). Duration: 2 year period. Follow‐up: 1 year period | |
| Participants | Women with epilepsy taking AED monotherapy (n=33 enrolled, 30 babies examined); women without epilepsy n=30) | |
| Interventions | Intervention group were taking either: 1) PHT 2) CBZ 3) VPA as monotherapy |
|
| Outcomes | 1) Physical growth 2) Psychomotor development ‐ assessed by Griffith Scale |
|
| Notes | Women recruited when they became pregnant Loss to follow‐up: 3 babies were not examined (2 exposed to PHT, 1 exposed to CBZ) |
|
| Risk of bias | ||
| Bias | Authors' judgement | Support for judgement |
| Random sequence generation (selection bias) | High risk | High in bias due to non‐randomised design |
| Allocation concealment (selection bias) | High risk | High in bias due to non‐randomised design |
| Confounding variables | Unclear risk | Rated 3 as two important confounders were matched between groups |
| Blinding | Unclear risk | Rated unclear as no details present |
| Incomplete outcome data (attrition bias) All outcomes | Low risk | Rated 2 as only small amount of missing data, unlikely to affect outcome |
| Selective reporting (reporting bias) | Unclear risk | Rated 3 as most data reported but some missing from report due to non‐significant findings |
| Other bias | Unclear risk | Rated 3 as drug data was collected separately but analysed together |
Bromley 2010.
| Study characteristics | ||
| Methods | A single blinded multi‐centre prospective cohort controlled study (UK). Duration: 6 year period, with data reported at two time points: 2 years and 6 years of age | |
| Participants | 530 children enrolled in the study 2 years: 428 children completed the first assessment (81%) 1) Offspring of women with epilepsy (198 children completed assessment; 194 children analysed)
2) Offspring of women without epilepsy (287 enrolled, 230 examined) 6 years: 408 children completed the assessment 1) Offspring of women with epilepsy (198 children completed assessment; 187 analysed)
2) Offspring of women without epilepsy (287 enrolled, 210 examined and analysed) |
|
| Interventions | Intervention group were taking either: 1) VPA 2) CBZ 3) LTG 4) Other (including PHT, TPM, GBP, VGB, OXC) 5) Polytherapy |
|
| Outcomes | 1) Neurodevelopment ‐ assessed by Griffiths Mental Develiopment Scales at 2 years and the Differential Ability Scales at 6 years 2) Physical growth (reported in separate paper) 3) Dysmorphic features (reported in separate paper) |
|
| Notes | Loss to follow‐up: 102 did not complete the first assessment therefore not included in the analysis; 122 children did not complete the 6 year assessment. This study included 92 children who were also enrolled into the Meador 2009 series where the primary outcome was measured against children exposed to other AEDs and not control children. This data was not combined within this review or the meta‐analysis. Where possible the data which was independent from the Meador study was extracted and utilised |
|
| Risk of bias | ||
| Bias | Authors' judgement | Support for judgement |
| Random sequence generation (selection bias) | High risk | High in bias due to non‐randomised design |
| Allocation concealment (selection bias) | High risk | High in bias due to non‐randomised design |
| Confounding variables | Low risk | Rated 2 as important confounders were considered and adjusted for appropriately |
| Blinding | Low risk | Rated 2 as outcome assessor blinded |
| Incomplete outcome data (attrition bias) All outcomes | Low risk | Rated 2 as only small amount of missing data, unlikely to affect outcome |
| Selective reporting (reporting bias) | Low risk | Rated 1 as protocol available and no evidence of selective reporting bias |
| Other bias | Low risk | Rated 1 as no other bias identified |
Bromley 2013.
| Study characteristics | ||
| Methods | A single blinded multi‐centre prospective cohort controlled study (UK). Duration: 6 year period | |
| Participants | 501 women with 528 children were recruited between 2000 and 2004. 415 children examined: 1) Offspring of women with epilepsy
2) Women without epilepsy (214 children examined) |
|
| Interventions | Intervention group were taking either: 1) VPA 2) CBZ 3) LTG 4) Other monotherapy 5) Polytherapy |
|
| Outcomes | Diagnosis of an autism spectrum disorder (ASD) | |
| Notes | 113 children (42 children of women with epilepsy and 71 control children were dropouts, reasons given) Diagnosis of autistic spectrum disorder was made independently of the study team |
|
| Risk of bias | ||
| Bias | Authors' judgement | Support for judgement |
| Random sequence generation (selection bias) | High risk | High in bias due to non‐randomised design |
| Allocation concealment (selection bias) | High risk | High in bias due to non‐randomised design |
| Confounding variables | Low risk | Rated 1 as all important confounders investigated and appropriate analysis employed |
| Blinding | High risk | Rated as 4 as clinician making diagnosis probably not blinded, question of AED exposure may not have been asked |
| Incomplete outcome data (attrition bias) All outcomes | Low risk | Rated as 2 as small amount of missing data unlikely to affect outcome |
| Selective reporting (reporting bias) | Low risk | Rated 1 as protocol available and no evidence of selective reporting bias |
| Other bias | Low risk | Rated as 2 as different clinicians made diagnosis of outcome |
Cummings 2011/2013.
| Study characteristics | ||
| Methods | A single blinded prospective registry study (UK). Duration: 3 year period | |
| Participants | 150 women with epilepsy taking AED treatment, 12 women excluded as they did not meet the inclusion criteria, 11 women withdrew 53 women without epilepsy consented to participate in the control group |
|
| Interventions | Intervention group were taking either: 1) Sodium Valproate (n=58) 2) Carbamazepine (n=49) 3) Lamotrigine (n=35) Control group (n=44) |
|
| Outcomes | 1) Neurodevelopmental performance measured either by the Bayley Scales of Infant Development (children aged 42 months and younger) or by the Griffiths Scale of Infant Development (children older than 42 months) | |
| Notes | 127 women in intervention group attended appointments, 19 were excluded with reasons given (24 children excluded). Due to the method of reporting in the paper this data could not be utilised in meta‐analysis. Additional information requested about prevalence of autistic spectrum diagnosis and means by assessment type (i.e. Bayley or Griffiths) | |
| Risk of bias | ||
| Bias | Authors' judgement | Support for judgement |
| Random sequence generation (selection bias) | High risk | High in bias due to non‐randomised design |
| Allocation concealment (selection bias) | High risk | High in bias due to non‐randomised design |
| Confounding variables | Low risk | Rated 2 as most important confounders considered and adjusted for appropriately |
| Blinding | Low risk | Rated 2 as outcome assessor blinded |
| Incomplete outcome data (attrition bias) All outcomes | Low risk | Rated 2 as small amount of missing data, unlikely to affect outcome |
| Selective reporting (reporting bias) | High risk | Rated 4 as no details of mean scores which would have been measured, no sub‐scale or overall continuous outcomes reported |
| Other bias | Unclear risk | Rated 3 as older versions of measures used for year of recruitment |
D'Souza 1991.
| Study characteristics | ||
| Methods | A single‐centre (UK) prospective cohort controlled study. Duration: 2 year period. Follow up: 3.5 years | |
| Participants | 61 women with epilepsy taking AED treatment and 62 control women without epilepsy 123 children assessed and 121 children included in the analysis |
|
| Interventions | Intervention group were taking either: 1) Carbamazepine (n=3) 2) Phenobarbital (n=6) 3) Phenytoin (n=23) 4) Sodium valproate (n=2) 5) Clonazepam (n=1) 5) Polytherapy (n=18) Control group: 1) No AED exposed group (n=8) 2) Women without epilepsy (n=62) |
|
| Outcomes | 1) Developmental delay measured by Griffiths mental development scales | |
| Notes | Drug groups not analysed separately, median and range reported in paper so inclusion in meta‐analysis was not possible. Intervention group included women with epilepsy not taking AED treatment during pregnancy (n=8) | |
| Risk of bias | ||
| Bias | Authors' judgement | Support for judgement |
| Random sequence generation (selection bias) | High risk | High in bias due to non‐randomised design |
| Allocation concealment (selection bias) | High risk | High in bias due to non‐randomised design |
| Confounding variables | Unclear risk | Rated 3 as some confounders considered and adjusted for |
| Blinding | Low risk | Rated 2 as outcome assessors were blinded |
| Incomplete outcome data (attrition bias) All outcomes | Low risk | Rated as 2 due to small amount of missing data, unlikely to affect outcome |
| Selective reporting (reporting bias) | Unclear risk | Rated 3 as domain specific sub‐scales were not reported though very likely to have been measured |
| Other bias | High risk | Rated 4 as unclear description of recruitment details and dose information |
Eriksson 2005.
| Study characteristics | ||
| Methods | A single centre (Finland) registry study. Duration: 11 years | |
| Participants | 39 women with epilepsy initially recruited. 26 taking AED treatment and 13 taking no AED treatment. 38 children completed assessments and analysed | |
| Interventions | Intervention group were taking either: 1) Sodium valproate (n=13) 2) Carbamazepine (n=13) Control group: 1) No AED exposed (n=13) |
|
| Outcomes | 1) Neurodevelopment measured by WISC‐III and NEPSY 2) Rates of autistic spectrum diagnosis |
|
| Notes | 1 child missing from analysis Linked to Viinikainen 2006 paper Protocol provided by authors |
|
| Risk of bias | ||
| Bias | Authors' judgement | Support for judgement |
| Random sequence generation (selection bias) | High risk | High in bias due to non‐randomised design |
| Allocation concealment (selection bias) | High risk | High in bias due to non‐randomised design |
| Confounding variables | High risk | Rated 4 due to lack of consideration for important confounders |
| Blinding | Low risk | Rated 2 as outcome assessor blinded |
| Incomplete outcome data (attrition bias) All outcomes | Low risk | Rated 2 as small amount of missing data, unlikely to affect outcome |
| Selective reporting (reporting bias) | Unclear risk | Rated 3 as certain sub‐tests selected for reporting, no indication given as to why certain sub‐scales chosen, possible implication on outcome |
| Other bias | High risk | Rated 4 as FSIQ scores were estimated from six sub‐tests and VIQ and PIQ from two, rather from core battery. Children's ages ranged widely, used more than one measure for maternal abilities |
FINNISH Study.
| Study characteristics | ||
| Methods | A single‐centre (Finland) prospective cohort controlled study. Follow‐up: 5.5 years | |
| Participants | 253 children enrolled in the study At 5.5 years 220 children completed assessments
|
|
| Interventions | Intervention group were taking either: 1) Sodium Valproate 2) Phenobarbital 3) Carbamazepine 4) Phenytoin Numbers for individual monotherapies are not reported Control group (n=104) Non‐exposed children (n=12) |
|
| Outcomes | 1) IQ measured by WPPSI (3 subtests used) 2) Non‐verbal IQ measured by LIPS |
|
| Notes | 32 children lost to follow from time of enrolment Protocol provided by authors. Study linked to Gaily 1990 |
|
| Risk of bias | ||
| Bias | Authors' judgement | Support for judgement |
| Random sequence generation (selection bias) | High risk | High in bias due to non‐randomised design |
| Allocation concealment (selection bias) | High risk | High in bias due to non‐randomised design |
| Confounding variables | High risk | Rated 5 as no confounding variables considered or adjusted for |
| Blinding | Low risk | Rated 2 as assessor blinded |
| Incomplete outcome data (attrition bias) All outcomes | Low risk | Rated 2 as only small amount of missing data, unlikely to affect outcome |
| Selective reporting (reporting bias) | Low risk | Rated 1 as protocol inspected and no selective outcome reporting identified |
| Other bias | High risk | Rated 5 as study analysed monotherapy and polytherapy together, estimated the intelligence of 2 children, controls were not all from the same source and the study did not consider dose factors |
Gaily 2004.
| Study characteristics | ||
| Methods | A single centre (Finland) registry study. Duration: 5 year period | |
| Participants | 149 women (189 children) with epilepsy were recruited and 121 women (141 children) without epilepsy | |
| Interventions | Intervention group were taking either: 1) Sodium valproate (Mean 1200mg/day) (n=13) 2) Carbamazepine (Mean 600mg/day) (n=86) 3) Other monotherapy (n=8) 4) Polytherapy (n=30) Control groups: 1) Women without epilepsy (n=141) 2) Women with epilepsy taking no AED (n=45) |
|
| Outcomes | 1) Full scale IQ 2) Verbal IQ 3) Non‐verbal IQ Outcomes measured with WISC‐R and WPPSI‐R |
|
| Notes | Linked to Kantola‐Sorsa 2007 | |
| Risk of bias | ||
| Bias | Authors' judgement | Support for judgement |
| Random sequence generation (selection bias) | High risk | High in bias due to non‐randomised design |
| Allocation concealment (selection bias) | High risk | High in bias due to non‐randomised design |
| Confounding variables | Unclear risk | Rated 3 as some confounders matched at design stage however several important confounders not considered and adjusted for |
| Blinding | Low risk | Rated 2 as assessor blinded |
| Incomplete outcome data (attrition bias) All outcomes | Low risk | Rated 2 as small amount of missing data unlikely to affect outcome |
| Selective reporting (reporting bias) | Low risk | Rated 1 as protocol inspected and no selective outcome reporting identified |
| Other bias | Unclear risk | Rated 3 as IQ scores were estimated from Bayley Scales of Development for two children |
GERMAN Study.
| Study characteristics | ||
| Methods | A multi‐centre (German) prospective cohort controlled study | |
| Participants | Women with epilepsy were recruited and women without epilepsy | |
| Interventions | For DQ assessment Intervention group were taking either: 1) Monotherapy (n=44) 2) Polytherapy (n=15) Control group (n=67) *Numbers taken from Steinhausen 1994 For school age assessment Intervention groups were taking either: 1) Monotherapy (n=52) 2) Polytherapy (n=26) Control group (n=67) *Numbers taken from Losche 1994 |
|
| Outcomes | 1) DQ measured by Bayley Scales 2) IQ measured by WPPSI 3) Motor performance measured by McCarthy Scales 4) Visual perception measured by FTVP 5) Psycholinguistic abilities |
|
| Notes | Study linked to Steinhausen 1994, Koch 1996/1999, Hattig 1897/1987b, Titze 2008, Rating 1982. Specific monotherapy data was only available for part of this cohort as reported in Hattig and Steinhausen 1987 | |
| Risk of bias | ||
| Bias | Authors' judgement | Support for judgement |
| Random sequence generation (selection bias) | High risk | High in bias due to non‐randomised design |
| Allocation concealment (selection bias) | High risk | High in bias due to non‐randomised design |
| Confounding variables | Unclear risk | Rated 3 as several factors considered i.e. groups matched for SES, maternal age, smoking during pregnancy and number of abortions. Results analysed using multivariate analysis using polytherapy, SES and gender. Then multiple correlation analyses used for each psychological test exploring the contribution of mono/polytherapy, gender, SES, sibling rank, age of mother, nicotine use, seizure frequency during pregnancy and obstetric score |
| Blinding | Low risk | Rated 2 as outcomes assessors blinded |
| Incomplete outcome data (attrition bias) All outcomes | High risk | Rated 5 as large amount of missing data, only graphs are shown. Numbers of participants recruited were not stated in the methods |
| Selective reporting (reporting bias) | Low risk | Rated 2 as no evidence of selective reporting, no protocol available |
| Other bias | Unclear risk | Rated 3 as age range of children is large, monotherapy and polytherapy analysed together |
Hanson 1976.
| Study characteristics | ||
| Methods | A single centre (US) prospective cohort controlled study. Study period: 7 years | |
| Participants | 104 women with epilepsy, 100 women without epilepsy enrolled | |
| Interventions | Intervention group were taking either: 1) Hydantoin monotherapy 2) Hydantoin polytherapy Combined intervention group (n=83) analysed Contol group (n=83) analysed |
|
| Outcomes | 1) Full scale IQ measured by WISC | |
| Notes | Monotherapy and polytherapy analysed together | |
| Risk of bias | ||
| Bias | Authors' judgement | Support for judgement |
| Random sequence generation (selection bias) | High risk | High in bias due to non‐randomised design |
| Allocation concealment (selection bias) | High risk | High in bias due to non‐randomised design |
| Confounding variables | Unclear risk | Rated 3 as controls matched for SES and maternal age |
| Blinding | Unclear risk | Rated 3 as unclear whether any blinding was employed |
| Incomplete outcome data (attrition bias) All outcomes | Low risk | Rated 2 as small amount of missing data, unlikely to affect outcome |
| Selective reporting (reporting bias) | Low risk | Rated 2 as no evidence of selective reporting bias, no protocol available |
| Other bias | High risk | Rated as 5 did not analyse drugs separately, did not examine dose and little information about recruitment of women and representativeness of the sample |
Hill 1974.
| Study characteristics | ||
| Methods | A prospective multi‐centre (USA) cohort study. Duration: 3 year period | |
| Participants | 23 women with epilepsy, 165 women formed the control group. 28 children examined and analysed in intervention group and 165 in control group | |
| Interventions | Intervention group were taking either: 1) Ethosuximide 2) Phenobarbital 3) Primidone 4) Diphenylhydantoin 5) Polytherapy Drug groups combined in analysis |
|
| Outcomes | 1) Mental retardation measured by the Gesell developmental quotients | |
| Notes | Linked to Hill et al 1982. Study did not report monotherapy and polytherapy separately and therefore could not be reported | |
| Risk of bias | ||
| Bias | Authors' judgement | Support for judgement |
| Random sequence generation (selection bias) | High risk | High in bias due to non‐randomised design |
| Allocation concealment (selection bias) | High risk | High in bias due to non‐randomised design |
| Confounding variables | High risk | Rated 4 as no important confounding variables accounted for in analysis or at design stage |
| Blinding | Low risk | Rated 2 as outcome assessor blinded |
| Incomplete outcome data (attrition bias) All outcomes | Unclear risk | Rated 3 as certain amount of missing data, possible implication on outcome |
| Selective reporting (reporting bias) | High risk | Rated 4 as some outcome measures over certain time‐points are not reported |
| Other bias | High risk | Rated 5 as drug groups not analysed separately, dose not examined, lack of detail regarding recruitment of mothers |
Hirano 2004.
| Study characteristics | ||
| Methods | A single‐centre (Japan) prospective cohort controlled study. Study period: 5 years | |
| Participants | 170 children enrolled in the study Intervention Group: 71 children born to women with epilepsy (unknown number exposed to AEDs) Control group: 99 children born to women without epilepsy |
|
| Interventions | Intervention group were taking: 1) Polytherapy |
|
| Outcomes | 1) DQ measured by Enjohi's Test 2) Neurological status |
|
| Notes | Study linked to Nomura 1984 and Fujioka 1984. Study did not report monotherapy and polytherapy separately and therefore could not be reported | |
| Risk of bias | ||
| Bias | Authors' judgement | Support for judgement |
| Random sequence generation (selection bias) | High risk | High in bias due to non‐randomised design |
| Allocation concealment (selection bias) | High risk | High in bias due to non‐randomised design |
| Confounding variables | Unclear risk | Rated 3 as some confounders controlled for |
| Blinding | Unclear risk | Rated as unclear whether any blinding was employed |
| Incomplete outcome data (attrition bias) All outcomes | Low risk | Rated 1 as no missing data |
| Selective reporting (reporting bias) | Low risk | Rated 2 as no evidence of selective reporting bias, no protocol available |
| Other bias | High risk | Rated 5 as analysed AEDs together |
Jackson 2013.
| Study characteristics | ||
| Methods | A single‐centre (UK) prospective cohort controlled study. Duration: 2 year follow up | |
| Participants | 288 women with epilepsy had completed questionnaires during pregnancy, 176 children were assessed and 149 were included in the analysis | |
| Interventions | Intervention group were taking either: 1) Carbamazepine (n=62) 2) Sodium valproate (n=52) 3) Phenytoin (n=11) 4) Phenobarbital (n=1) 5) Polytherapy (n=24) Control group: 1) Women with epilepsy not taking AED treatment (n=26) |
|
| Outcomes | 1) Neurodevelopment measured by the Bayley's Scales of Infant Development | |
| Notes | Large amount of missing data primarily due to excluding for age of children. Data from this study is unpublished and was provided by the authors for the purpose of this review | |
| Risk of bias | ||
| Bias | Authors' judgement | Support for judgement |
| Random sequence generation (selection bias) | High risk | High in bias due to non‐randomised design |
| Allocation concealment (selection bias) | High risk | High in bias due to non‐randomised design |
| Confounding variables | High risk | Rated 4 as controlled for maternal education and maternal deprivation only. Considered additional: maternal age, birth weight etc |
| Blinding | Low risk | Rated 2 as outcome assessor blinded |
| Incomplete outcome data (attrition bias) All outcomes | High risk | Rated 4 as larger amount of missing data, likely to affect outcome |
| Selective reporting (reporting bias) | Low risk | Rated 2 as no evidence of selective reporting bias, no protocol available |
| Other bias | Unclear risk | Rated 3 as the control group is underpowered |
Jones 1989.
| Study characteristics | ||
| Methods | A single‐centre registry study (USA). Duration: 5‐6 year period. Follow up: yearly intervals | |
| Participants | 72 women with epilepsy prospectively recruited via the California Teratogen Registry. 73 control women recruited. Number of children assessed for neurodevelopment is unclear | |
| Interventions | Intervention group were taking either: 1) Carbamazepine (n=50) 2) Carbamazepine polytherapy (n=22) Control group consisted of women without epilepsy (n=73) |
|
| Outcomes | 1) Neurodevelopment measured by the Bayley Scales or the Stanford‐Binet Intelligence Scale | |
| Notes | 18 children not included in the analysis due to terminations or loss to follow up. Study did not report CBZ monotherapy and polytherapy separately and therefore could not be reported | |
| Risk of bias | ||
| Bias | Authors' judgement | Support for judgement |
| Random sequence generation (selection bias) | High risk | High in bias due to non‐randomised design |
| Allocation concealment (selection bias) | High risk | High in bias due to non‐randomised design |
| Confounding variables | High risk | Rated 4 as no adjustment employed for confounders in the analysis |
| Blinding | High risk | Rated 5 as no blinding employed for neurodevelopmental outcomes |
| Incomplete outcome data (attrition bias) All outcomes | High risk | Rated 4 as the control group were not assessed, a large amount of missing data |
| Selective reporting (reporting bias) | High risk | Rated 4 as individual sub‐scales were not reported and developmental delay not assessed or reported in control group |
| Other bias | High risk | Rated 5 as dose not examined, a number of retrospectively recruited children were combined with the prospectively recruited children, age ranges of children were wide |
Leavitt 1992.
| Study characteristics | ||
| Methods | A prospective single‐centre (USA) cohort controlled study. Duration: 3 year period | |
| Participants | 107 women recruited in total | |
| Interventions | Intervention group (n=43) were taking either: 1) Carbamazepine 2) Phenobarbital 3) Phenytoin Control group: 1) Women without epilepsy (n=41) |
|
| Outcomes | 1) Neurodevelopment measured by the Bayleys Scales of Infant Development | |
| Notes | Unclear how many children were exposed to individual drugs therefore could not be included in meta‐analysis | |
| Risk of bias | ||
| Bias | Authors' judgement | Support for judgement |
| Random sequence generation (selection bias) | High risk | High in bias due to non‐randomised design |
| Allocation concealment (selection bias) | High risk | High in bias due to non‐randomised design |
| Confounding variables | High risk | Rated 4 as no adjustment employed for important confounders |
| Blinding | Low risk | Rated 2 as outcome assessor was blinded |
| Incomplete outcome data (attrition bias) All outcomes | Low risk | Rated 2 as 90% of sample were assessed but unclear in report if all were included in the analysis |
| Selective reporting (reporting bias) | High risk | Rated 4 as Bayley scales of development Performance indices not reported for monotherapy group only MDI Rated D using ORBIT tool as measure analysed but not reported |
| Other bias | High risk | Rated 3 as limited data on specific monotherapy drug and numbers exposed, old test used, inflated means mean should be 100 but mean 122 for CBZ groups, shows inaccurate measure used out of date |
Nadebaum 2011.
| Study characteristics | ||
| Methods | A multi‐centre (Australia) registry study: Duration: 2 year period | |
| Participants | Paper one (2011a) 59 children of women with epilepsy were initially enrolled, 57 children were assessed and included in the analysis Paper two (2011b) 108 recruited and 102 children analysed |
|
| Interventions | Nadebaum 2011a paper Intervention group were taking either: 1) Sodium valproate (n=23) 2) Sodium valproate polytherapy (n=15) 3) Non‐valproate polytherapy (n=19) Nadebaum 2011b Intervention group were taking either: 1) Sodium valproate (n=23) 2) Carbamazepine (n=34) 3) Lamotrigine (n=9) 4) Polytherapy (n=34) |
|
| Outcomes | 1) IQ measured by the Weschler Intelligence Scale for Children 2) Language development as measured by the Clinical Evaluation of Language Fundamentals (reported in linked paper) |
|
| Notes | Linked to Nadebaum 2011b | |
| Risk of bias | ||
| Bias | Authors' judgement | Support for judgement |
| Random sequence generation (selection bias) | High risk | High in bias due to non‐randomised design |
| Allocation concealment (selection bias) | High risk | High in bias due to non‐randomised design |
| Confounding variables | Low risk | Rated 2 as most important confounders considered and adjusted for appropriately |
| Blinding | Low risk | Rated 2 as outcome assessor blinded |
| Incomplete outcome data (attrition bias) All outcomes | Low risk | Rated 2 as only small amount of missing data, unlikely to affect outcome |
| Selective reporting (reporting bias) | Low risk | Rated 2 as no evidence of selective reporting bias, no protocol available |
| Other bias | Low risk | Rated 2 as siblings were included within the analysis |
NEAD Study.
| Study characteristics | ||
| Methods | Single‐blinded non‐randomised prospective multi‐centre study (USA/UK) | |
| Participants | Offspring of women with epilepsy (n=311). 224 children were assessed at age 6 year, 224 were analysed. Additional, intention‐to‐treat analysis contained 311 outcomes | |
| Interventions | Intervention group were taking either (6 year completers): 1) Carbamazepine (n=61) 2) Sodium valproate (n=49) 3) Phenytoin (n=40) 4) Lamotrigine (n=74) |
|
| Outcomes | 1) Differential Ability Scales at 3, 4.5 and 6 years of age 2) Children's Memory Scale at 6 years of age 3) NEPSY: Neurodevelopmental Assessment at 6 years of age 4) Expressive One Word Vocabulary Test at 6 years 5) Behaviour Rating Inventory of Executive Function at 6 years 6) Developmental Test of Visual‐Motor Integration at 3years and 6 years 7) Bayley Scales of Infant and Child Development at 2 years and 3 years 8) Peadbody Picture Vocabulary Test at 3 years 9) Preschool Language Scale at 3 years 10) Bracken Basic Concept Scale at 4.5 years 11) Torrance Thinking and Creativity in Action and Movement at 3 years 12) Adaptive Behaviour System 3, 4.5 and 6 years 13) Behavioural Assessment System for Children 3, 4.5 and 6 years |
|
| Notes | Linked papers: Meador 2006 (abstract), 2009, 2011, 2011b, 2012, Cohen 2011, McVearry 2009 This series utilised intention‐to‐treat analysis. This series contained 92 participants from the UK who were also enrolled in the Bromley series |
|
| Risk of bias | ||
| Bias | Authors' judgement | Support for judgement |
| Random sequence generation (selection bias) | High risk | High in bias due to non‐randomised design |
| Allocation concealment (selection bias) | High risk | High in bias due to non‐randomised design |
| Confounding variables | Low risk | Rated 1 as all important confounders considered and adjusted for appropriately |
| Blinding | Low risk | Rated 2 as assessors blinded |
| Incomplete outcome data (attrition bias) All outcomes | Low risk | Rated 2 as only small amount of missing data and ITT used |
| Selective reporting (reporting bias) | Low risk | Rated 1 as protocol available and no evidence of selective outcome reporting |
| Other bias | Low risk | Rated 1 as no other bias identified |
Ornoy 1996.
| Study characteristics | ||
| Methods | A single‐centre (Israel) prospective cohort controlled study. Duration: 6 year period | |
| Participants | 37 women with epilepsy enrolled in the study and 49 children were examined. 57 children completed assessments | |
| Interventions | Intervention group were taking: 1) Carbamazepine (n=41) Control group: 1) Matched controls, women without epilepsy (n=47) |
|
| Outcomes | 1) Neurodevelopment measured by the Bayley's Scales of Infant Development or McCarthy's Developmental Scales depending on age of child | |
| Notes | 2 children excluded from the analysis. Total number included in the analysis differs on each measure used | |
| Risk of bias | ||
| Bias | Authors' judgement | Support for judgement |
| Random sequence generation (selection bias) | High risk | High in bias due to non‐randomised design |
| Allocation concealment (selection bias) | High risk | High in bias due to non‐randomised design |
| Confounding variables | High risk | Rated 4 as groups were matched for birth weight, gestational age and SES outcome. Later explored age at assessment, birthweight, SES by showing mean results for each group and dose effect and exposure to convulsions by reporting the proportion with low scores in stratified groups |
| Blinding | Low risk | Rated 2 as outcome assessor was blinded |
| Incomplete outcome data (attrition bias) All outcomes | Low risk | Rated 2 as small amount of missing data, unlikely to affect outcome |
| Selective reporting (reporting bias) | Low risk | Rated 2 as no evidence of selective reporting bias, no protocol available |
| Other bias | Unclear risk | Rated 3 as results were combined for McCarthy and Bayley as the main outcome, smaller numbers for a given developmental score. Not clear where the control group from |
Regesta 1996.
| Study characteristics | ||
| Methods | A single‐centre (Italy) prospective cohort controlled study. Study period: 3 years | |
| Participants | 125 women with epilepsy and 113 control women enrolled 118 children analysed in intervention group, 107 analysed in control group |
|
| Interventions | Intervention group were taking either: 1) Phenobarbital 2) Carbamazepine 3) Phenytoin 4) Sodium valproate |
|
| Outcomes | 1) DQ measured by Egan Criteria | |
| Notes | All AEDs analysed as either monotherapy or polytherapy | |
| Risk of bias | ||
| Bias | Authors' judgement | Support for judgement |
| Random sequence generation (selection bias) | High risk | High in bias due to non‐randomised design |
| Allocation concealment (selection bias) | High risk | High in bias due to non‐randomised design |
| Confounding variables | Unclear risk | Rated 3 as some confounders considered and accounted for i.e. polytherapy, SES, epilepsy type, age of child at assessment |
| Blinding | Unclear risk | Rated as unclear whether any blinding was employed |
| Incomplete outcome data (attrition bias) All outcomes | Low risk | Rated 2 as small amount of missing data unlikely to affect outcome |
| Selective reporting (reporting bias) | Low risk | Rated 2 as no evidence of selective reporting bias, no protocol available |
| Other bias | Unclear risk | Rated 3 as unclear if any other bias affecting outcome |
Rihtman 2012.
| Study characteristics | ||
| Methods | A single‐centre (Israel) register cohort controlled study. Duration: 7 year period | |
| Participants | Nine children of women taking topiramate for epilepsy or other disorders | |
| Interventions | Intervention group: Topiramate (n=9) |
|
| Outcomes | 1) IQ measured by Stanford‐Binet Intelligence Scales (5th Ed) 2) Motor coordination measured by Developmental Coordination Questionnaire 3) Visual motor skills measured by Beery‐Buktenica Developmental Test of Visual‐Motor Integration (5th Ed) 4) Motor skills measured by Miller Function and Participant Scales 5) Sensory processing abilities measured by Sensory Profile and Short Sensory Profile 6) Executive functioning measured by Behavior Rating Inventory of Executive Function and Preschool Version 7) Problem behaviours and attention measured by Conners' Ratign Scales‐Revised |
|
| Notes | 33% of the mothers were not taking topiramate for epilepsy. Excluded the children with a full scale IQ less than 70 | |
| Risk of bias | ||
| Bias | Authors' judgement | Support for judgement |
| Random sequence generation (selection bias) | High risk | High in bias due to non‐randomised design |
| Allocation concealment (selection bias) | High risk | High in bias due to non‐randomised design |
| Confounding variables | High risk | Rated as 4 due to limited control for confounding variables |
| Blinding | Unclear risk | Rated as unclear whether any blinding was employed |
| Incomplete outcome data (attrition bias) All outcomes | Low risk | Rated as 1 no missing data reported |
| Selective reporting (reporting bias) | Low risk | Rated 2 as no evidence of selective reporting bias, no protocol available |
| Other bias | High risk | Rated as 4 due to the inclusion of women taking topiramate for other indications, multiple testing on small sample |
Rihtman 2013.
| Study characteristics | ||
| Methods | A single‐centre (Israel) registry cohort controlled study. Duration: 7 years | |
| Participants | 69 women with epilepsy and 51 control women enrolled 72 children analysed in intervention group, 52 analysed in control group |
|
| Interventions | Intervention group were taking either: 1) Sodium valproate (n=30) 2) Lamotrigine (n=42) Control group: 1) Children not exposed to AEDs (n=52) Linked paper (2012) 1) Topirmate (n=9) 2) Children not exposed to AEDS (n=18) |
|
| Outcomes | 1) IQ measured by Stanford‐Binet Intelligence Scales (5th Ed) 2) Motor coordination measured by Developmental Coordination Questionnaire 3) Visual motor skills measured by Beery‐Buktenica Developmental Test of Visual‐Motor Integration (5th Ed) 4) Motor skills measured by Miller Function and Participant Scales 5) Sensory processing abilities measured by Sensory Profile and Short Sensory Profile 6) Executive functioning measured by Behavior Rating Inventory of Executive Function and Preschool Version 7) Problem behaviours and attention measured by Conners' Ratign Scales‐Revised |
|
| Notes | Linked to Rihtman 2012 (although investigating different AEDs) paper investigating topiramate in which over 30% of women did not have a diagnosis of epilepsy | |
| Risk of bias | ||
| Bias | Authors' judgement | Support for judgement |
| Random sequence generation (selection bias) | High risk | High in bias due to non‐randomised design |
| Allocation concealment (selection bias) | High risk | High in bias due to non‐randomised design |
| Confounding variables | High risk | Rated 4 as some confounders were considered but not adjusted for |
| Blinding | Low risk | Rated 2 as outcome assessor was blinded |
| Incomplete outcome data (attrition bias) All outcomes | Low risk | Rated 1 as no missing data |
| Selective reporting (reporting bias) | Low risk | Rated 2 as no evidence of selective reporting bias, no protocol available |
| Other bias | High risk | Rated 4 as due to the inclusion of women taking AEDs for non‐epilepsy indications, due to exclusion of children with an IQ less than 70 |
Rovet 1995.
| Study characteristics | ||
| Methods | A single‐centre (Canada) prospective cohort controlled study. Duration: 5 year period | |
| Participants | 58 women with epilepsy were recruited, 58 children were assessed and included in the analysis | |
| Interventions | Intervention group were taking either: 1) Carbamazepine (n=29) 2) Phenytoin (n=29) Control group: 1) Matched controls of women without epilepsy (n=58) |
|
| Outcomes | 1) Neurodevelopment measured by the Bayley Scales of Infant Development or McCarthy Scales depending on age of child 2) Language measured by the Reynell Development Language Scales |
|
| Notes | Linked to Scolnik 1994 paper | |
| Risk of bias | ||
| Bias | Authors' judgement | Support for judgement |
| Random sequence generation (selection bias) | High risk | High in bias due to non‐randomised design |
| Allocation concealment (selection bias) | High risk | High in bias due to non‐randomised design |
| Confounding variables | Unclear risk | Rated 3 as adjusted for maternal IQ, SES and maternal age only |
| Blinding | Low risk | Rated 2 as outcomes assessors blinded |
| Incomplete outcome data (attrition bias) All outcomes | Low risk | Rated 2 as small amount of missing data, unlikely to affect outcome |
| Selective reporting (reporting bias) | Low risk | Rated 2 as separate developmental test results were not reported, although unlikely to affect outcome |
| Other bias | Low risk | Rated 2 as different age ranges of children, but unlikely to affect outcome due to appropriate tests used |
Shallcross 2011.
| Study characteristics | ||
| Methods | A single centre (UK) prospective cohort controlled study. Duration: 3 year period | |
| Participants | 197 children were assessed and included in the analysis. 22 women with epilepsy and 98 women without epilepsy were recruited from a previous cohort | |
| Interventions | Intervention group were taking either: 1) Levitiracetam (n=55) 2) Sodium valproate (n=44) Control group: 1) Women without epilepsy (n=98) |
|
| Outcomes | 1) Neurodevelopment measured by the Griffiths Mental Devlopment Scale | |
| Notes | Of 87 women who agreed, 10 were not included in the analysis, reasons given. The control group from this paper is the same as Bromley 2010. Unpublished data from the doctoral thesis of R Shallcross was provided for this review Linked to Shallcross 2014 paper |
|
| Risk of bias | ||
| Bias | Authors' judgement | Support for judgement |
| Random sequence generation (selection bias) | High risk | High in bias due to non‐randomised design |
| Allocation concealment (selection bias) | High risk | High in bias due to non‐randomised design |
| Confounding variables | Low risk | Rated 2 as controlled for: seizures in pregnancy (not type of seizures), gestational age, maternal full‐scale IQ, maternal age, child age at assessment, SES, exposure to nicotine, exposure to alcohol, and drug used in pregnancy |
| Blinding | High risk | Rated 5 as no methods of blinding employed |
| Incomplete outcome data (attrition bias) All outcomes | Low risk | Rated 2 as small amount of missing data, unlikely to affect outcome |
| Selective reporting (reporting bias) | Low risk | Rated 2 as no evidence of selective reporting bias, no protocol available |
| Other bias | Low risk | Rated 2 as some data were collected retrospectively |
Sobczyz 1977.
| Study characteristics | ||
| Methods | A single‐centre (Poland) prospective cohort controlled study. Duration: Unclear | |
| Participants | 27 mothers with epilepsy recruited. 59 pregnancies exposed to AEDs occurred, 40 children were studied | |
| Interventions | Intervention group were taking either: 1) Phenytoin (n=4) 2) Phenobarbital (n=2) 3) Polytherapy (n=33) |
|
| Outcomes | 1) Psychomotor and speech retardation 2) Developmental abnormalities 3) IQ measured by the Weschler Intelligence Scale for Children |
|
| Notes | Not reported specific AED outcomes | |
| Risk of bias | ||
| Bias | Authors' judgement | Support for judgement |
| Random sequence generation (selection bias) | High risk | High in bias due to non‐randomised design |
| Allocation concealment (selection bias) | High risk | High in bias due to non‐randomised design |
| Confounding variables | High risk | Rated 5 as no confounding variables considered or controlled for appropriately |
| Blinding | High risk | Rated 5 as no method of blinding employed |
| Incomplete outcome data (attrition bias) All outcomes | Unclear risk | Rated as unclear due to lack of information regarding missing data |
| Selective reporting (reporting bias) | Unclear risk | Rated 2 as no evidence of selective reporting, no protocol available |
| Other bias | High risk | Rated 5 as data combined from three different measures and a large variation in age of children assessed |
Thomas 2007.
| Study characteristics | ||
| Methods | A single‐centre (India) registry study | |
| Participants | 74 children born to mothers with epilepsy were enrolled in the study and completed assessments, 71 were analysed | |
| Interventions | Intervention group were taking either: 1) Monotherapy (n=44) 2) Polytherapy (n=23) Control group: 1) Women without epilepsy (n=201) 2) Women with epilepsy not taking AED treatment (n=4) |
|
| Outcomes | 1) Development measured by the Development Assessment Scale in Indian Infants, adaptation of the Bayley's Scales of Infant Development 2) Intelligence measured by the Malin's Intelligence Scale for Indian Children, adaptation of the Weschler Intelligence Scale 3) Language measured by the Malayalam Language Test, adaptation of the Language Proficiency Test |
|
| Notes | Women with epilepsy not taking AED treatment included in intervention group. It is unclear whether data from this data are completely independent from the Thomas 2008 study | |
| Risk of bias | ||
| Bias | Authors' judgement | Support for judgement |
| Random sequence generation (selection bias) | High risk | High in bias due to non‐randomised design |
| Allocation concealment (selection bias) | High risk | High in bias due to non‐randomised design |
| Confounding variables | Unclear risk | Rated 3 as maternal IQ and SES were adjusted for by age matched controls |
| Blinding | High risk | Rated 5 as no methods of blinding employed |
| Incomplete outcome data (attrition bias) All outcomes | Unclear risk | Rated 3 as maternal IQ only measured for 23 mothers, and development assessment at one year data was available for 62 of 71 children |
| Selective reporting (reporting bias) | Low risk | Rated 2 as no evidence of selective reporting, no protocol available |
| Other bias | Low risk | Rated 1 as no other bias detected |
Thomas 2008.
| Study characteristics | ||
| Methods | A single‐centre (India) prospective study | |
| Participants | 395 children with epilepsy were assessed | |
| Interventions | Intervention group were taking either: 1) Carbamazepine (n=101) 2) Sodium valproate (n=71) 3) Phenobarbitone (n=41) 4) Phenytoin (n=29) 5) Clonazepam (n=2) 6) Lamotrigine (n=1) 7) Other (n=1) 7) Polytherapy (n=122 ) Control group: 1) Women with epilepsy not taking AED treatment (n=32) |
|
| Outcomes | 1) Mental development 2) Motor development, both outcomes measured by the Assessment Scale for Indian Infants, adaptation of the Bayley's Scales of Infant Development |
|
| Notes | It is unclear whether the data are completely independent from the Thomas 2007 study | |
| Risk of bias | ||
| Bias | Authors' judgement | Support for judgement |
| Random sequence generation (selection bias) | High risk | High in bias due to non‐randomised design |
| Allocation concealment (selection bias) | High risk | High in bias due to non‐randomised design |
| Confounding variables | High risk | Rated 4 as most important variables not adjusted for in the analysis (only looking at cumulative drug scores and number of AEDs) |
| Blinding | Low risk | Rated 2 as outcomes assessors blinded |
| Incomplete outcome data (attrition bias) All outcomes | Low risk | Rated 2 as small amount of missing data, unlikely to affect outcome |
| Selective reporting (reporting bias) | Low risk | Rated 2 as no evidence of selective reporting, no protocol available |
| Other bias | Low risk | Rated 1 as no other bias detected |
Veiby 2013.
| Study characteristics | ||
| Methods | Nested study within larger multi‐centre study | |
| Participants | Women with epilepsy and their offspring (n= 333) | |
| Interventions | Intervention groups were taking either: 1) Lamotrigine (n=71) 2) Carbamazepine (n=48) 3) Sodium valproate (n=27) 4) Monotherapy (n=182) 5) Polytherapy (n=41) Control group (n=276) |
|
| Outcomes | 1) Ages and Stages Questionnaire 2) Social Communication Checklist 3) Modified Checklist for Autism in Toddlers 4) Early Screening of Autistic Traits Questionnaire 5) MoBa‐specific questionniares |
|
| Notes | Outcomes reported across main and linked papers | |
| Risk of bias | ||
| Bias | Authors' judgement | Support for judgement |
| Random sequence generation (selection bias) | High risk | High in bias due to non‐randomised design |
| Allocation concealment (selection bias) | High risk | High in bias due to non‐randomised design |
| Confounding variables | Unclear risk | Rated as 3 as some but not all important confounders were adjusted for |
| Blinding | High risk | Rated as 5 as the assessors (the parents) were not blinded |
| Incomplete outcome data (attrition bias) All outcomes | High risk | Rated as 5 due to large amount of missing data at the older assessment time points (reasons not given) |
| Selective reporting (reporting bias) | Unclear risk | Rated 3 as evidence of selective reporting or selection of items from outcomes, no protocol available |
| Other bias | Unclear risk | Rated as 3 as bias identified due to parental ratings, implication for the results unclear |
Wide 2002.
| Study characteristics | ||
| Methods | A single‐centre (Sweden) prospective cohort controlled study. Duration: | |
| Participants | 76 children to mothers with epilepsy were eligible and recruited into the study, 71 children were assessed at birth and 67 entered were examined at follow up and compared to 66 children unexposed to AED treatment | |
| Interventions | Intervention group were taking either: 1) Carbamazepine (n=35) 2) Phenytoin (n=16) 3) Sodium valproate (n=3) 4) Phenobarbital/primidone (n=2) 5) Clonazepam (n=2) 6) Polytherapy (n=9) Control group: 1) Women without epilepsy (n=66) |
|
| Outcomes | 1) Psychomotor development measured the Griffiths test | |
| Notes | Smaller drug groups combined in analysis. Linked to Wide 2000 | |
| Risk of bias | ||
| Bias | Authors' judgement | Support for judgement |
| Random sequence generation (selection bias) | High risk | High in bias due to non‐randomised design |
| Allocation concealment (selection bias) | High risk | High in bias due to non‐randomised design |
| Confounding variables | Unclear risk | Rated 3 as Griffiths' test corrected for gestational age,and maternal education and gender were used as independent variable in the regression model |
| Blinding | Low risk | Rated 2 as outcomes assessors blinded |
| Incomplete outcome data (attrition bias) All outcomes | Unclear risk | Rated 3 as medium amount of missing data, possible implication on the outcome |
| Selective reporting (reporting bias) | Low risk | Rated 2 as no evidence of selective reporting, no protocol available |
| Other bias | Low risk | Rated 2 as old measures were used however only developmental test standardised for small children in Sweden was used |
Characteristics of excluded studies [ordered by study ID]
| Study | Reason for exclusion |
|---|---|
| Annegers 1974 | Record linkage study, not prospective cohort control study |
| Antiga 2010 | Non‐prospective comparative study |
| Dean 2002 | Retrospective design |
| Dessens 2000 | Retrospective design |
| Forsberg 2011 | Record linkage study, not prospective cohort control study |
| Holmes 2000 | Retrospective design |
| Holmes 2005 | Retrospective design |
| Jakubowska 1981 | Retrospective case control study |
| Kelly 1984 | Extended case series |
| Kozhokaru 2010 | Retrospective case control study |
| Latis 1982 | Extended cases series |
| Lekwuwa 1995 | No examination of cognitive outcomes |
| Majewski 1981 | Retrospective recruitment |
| Meador 2010 | No examination of cognitive outcomes |
| Moore 2000 | Retrospective recruitment |
| Mortensen 1996 | Epilespy cohort not examined, adults examined not children |
| Mortensen 2003 | Record linkage study, not prospective cohort control study. Not solely women with epilepsy included |
| Oyen 2007 | Record linkage study, not prospective cohort control study |
| Parisi 2003 | Extended case series |
| Perinola 1992 | No assessed control group |
| Rasalam 2005 | Retrospective recruitment |
| Sereno‐Colo 1984 | Case series |
| Steinhausen 1982 | Retrospective recruitment |
| Vanoverloop 1992 | Retrospective design |
| Vert 1982 | No comparator or control group |
| Yamatogi 1993 | No examination of neurodevelopmental outcomes |
Characteristics of studies awaiting classification [ordered by study ID]
Adams 2000 Abstract.
| Methods | No details |
| Participants | No details |
| Interventions | No details |
| Outcomes | No details |
| Notes |
Jovic 2011 Abstract.
| Methods | Prospective study |
| Participants | 28 offspring of women with juvenile myoclonic epilepsy |
| Interventions | VPA (n=8) LTG (n=12) Polytherapy VPA and LTG (n=8) |
| Outcomes | Children were assessed using the WISC at 6 years of age. Children exposed to LTG were reported to have a significantly higher IQ than the children exposed to monotherapy VPA or polytherapy VPA and LTG Daily doses of VPA above 1000mg was associated with lower IQ |
| Notes |
Nadebaum 2011 Abstract.
| Methods | Prospective study |
| Participants | 106 children of women with epilepsy |
| Interventions | VPA (n=26) VPA polytherapy (n=15) Others unknown |
| Outcomes | Diagnosis of learning disorder 7/26 for VPA, 8/15 for VPA polytherapy |
| Notes |
Wood 2011 Abstract.
| Methods | Registry study |
| Participants | 103 offspring of women with epilepsy |
| Interventions | VPA (n=26) CBZ (n=32) VPA polytherapy (n=15) Others unknown |
| Outcomes | Children were assessed between 6 and 8 years on the Conners Autism Rating Scale 2/26 (7.7%) of children exposed to VPA monotherapy scored above the threshold on the Conners Autism Rating Scale 2/32 (6.3%) of children exposed to CBZ monotherapy scored above the threshold on the Conners Autism Rating Scale 7/15 (46.7%) of children exposed to polytherapy including VPA scored above the threshold on the Conners Autism Rating Scale A significant correlation between dose of VPA and Conners Autism Rating Scale is reported |
| Notes | Contact from authors report that this is in preparation for publication |
Differences between protocol and review
In the protocol it was stated that we would report standardised mean differences. Due to careful selection of the measures that we combined in meta‐analysis and across study type and control groups, mean difference was instead utilised due to the ease with which it can convey levels of difference to the reader. Further, in the protocol it stated that, where possible, we would conduct meta‐analysis at the monotherapy and polytherapy group level. However, given the bias likely to be included in such an analysis and on recommendation of one of the peer reviewers we have not included these comparisons.
Within the protocol it was stated that, if appropriate, summary of findings tables using the GRADE approach would be presented. However, due to the inclusion of more than one AED across a number of outcomes, the creating and presenting of all data would be difficult to produce in a manner that could be understood and used appropriately.
In the protocol it was also stated that both fixed‐effect and random‐effects model analyses would be implemented, however the authors did not state exactly how these would be utilised and therefore we have elaborated on the methods here to clarify the situation. It was always the intention that fixed‐effect models would be carried out primarily, with random‐effects model analysis to explore potential heterogeneity. In addition, due to data being sparse in some comparisons, and with some studies reporting zero events in one or both groups, the risk difference (RD) was calculated and this was not stipulated within the protocol as we were not expecting to find such sparse data.
Contributions of authors
Rebecca Bromley and Jennifer Weston wrote this review with input from NA, JG, AJM, CT, AM and RD. Data extraction and risk of bias assessments were undertaken by RB, JW, NA, AS and AJM.
Sources of support
Internal sources
No sources of support supplied
External sources
-
National Institute for Health Research, UK
This review presents independent research commissioned by the National Institute for Health Research (NIHR). The views expressed in this publication are those of the author(s) and not necessarily those of the NHS, the NIHR or the Department of Health.
-
National Institute for Health Research, UK
This report is independent research supported by the National Institute for Health Research (Post Doctoral Fellowship, Dr Rebecca Bromley, PDF‐2013‐06‐041). The views expressed in this publication are those of the author(s) and not necessarily those of the NHS, the National Institute for Health Research or the Department of Health.
Declarations of interest
RB has provided expert opinion regarding child outcomes following prenatal exposure to AEDs and has contributed to studies funded by Sanofi Aventis and UCB Pharma. NA has been sponsored to attend educational meetings and conferences in epilepsy over the last five years by UCB Pharma, GSK and Boehringer Ingelheim, and has participated in regional advisory Board meetings for Eisai on their products eslicarbazepine and zonisamide. AM has been sponsored to attend a conference and has had research funding from Pfizer Ltd. Also a consortium of pharmaceutical companies (GSK, EISAI, UCB Pharma) funded the National Audit of Seizure Management in Hospitals (NASH) through grants paid to University of Liverpool. No further conflicts of interests declared.
Clarification statement added from the Co‐ordinating Editor on 8 June 2020: This review was found by the Cochrane Funding Arbiters, post‐publication, to be noncompliant with the Cochrane conflict of interest policy, which includes the relevant parts of the Cochrane Commercial Sponsorship Policy. It will be updated within 12 months. The update will have a majority of authors and lead author free of conflicts
Edited (no change to conclusions)
References
References to studies included in this review
Arulmozhi 2006 {published data only}
- Arulmozhi T, Dhanaraj M, Rangaraj R, Vengatesan A. Physical growth and psychomotor development of infants exposed to antiepileptic drugs in utero. Neurology India 2006;54(1):42-6. [DOI] [PubMed] [Google Scholar]
Bromley 2010 {published and unpublished data}
- *.Bromley R, Mawer G, Love J, Kelly J, Purdy L, McEwan L et al. Early cognitive development in children born to women with epilepsy: a prospective report. Epilepsia 2010;51(10):2058-65. [DOI] [PubMed] [Google Scholar]
- Bromley R. Personal communication with R. Bromley. 2013.
Bromley 2013 {published data only}
- *.Bromley R, Mawer G, Briggs M et al. The prevalence of neurodevelopmental disorders in children prenatally exposed to antiepileptic drugs. Journal of Neurology, Neurosurgery, and Psychiatry 2013;84(6):637-43. [DOI] [PMC free article] [PubMed] [Google Scholar]
- Bromley R. Autism spectrum disorders following in utero exposure to antiepileptic drugs. Neurology 2008;71:1923-5. [DOI] [PubMed] [Google Scholar]
Cummings 2011/2013 {published data only (unpublished sought but not used)}
- *.Cummings C, Stewart M, Stevenson M, Morrow M, Nelson J. Neurodevelopment of children exposed in utero to lamotrigine, sodium valproate and carbamazepine. Archives of Disease in Childhood 2011;96:643-7. [DOI] [PubMed] [Google Scholar]
- Cummings C. Personal communication with C Cummings. 2013.
D'Souza 1991 {published data only}
- D'Souza S, Robertson I, Donnai D, Mawer G. Fetal phenytoin exposure, hypoplastic nails, and jitteriness. Archives of Disease in Childhood 1990;65:320-4. [DOI] [PMC free article] [PubMed] [Google Scholar]
Eriksson 2005 {published data only}
- *.Eriksson K, Viinikainen K, Monkkonen A, Aikia M, Nieminen P, Heinonen et al. Children exposed to valproate in utero-population based evaluation of risks and confounding factors for long-term neurocognitive development. Epilepsy Research 2005;65:189-200. [DOI] [PubMed] [Google Scholar]
- Viinikainen K. The effects of valproate exposure in utero on behavior and the need for educational support in school-aged children. Epilepsy and Behavior 2006;9:636-40. [DOI] [PubMed] [Google Scholar]
FINNISH Study {published data only}
- *.Gaily E, Kantola-Sorsa E, Granstrom M. Intelligence of children of epileptic mothers. The Journal of Pediatrics 1988;113(4):677-84. [DOI] [PubMed] [Google Scholar]
- Gaily E, Kantola-Sorsa E, Granstrom M. Specific cognitive dysfunction in children with epileptic mothers. Developmental Medicine and Child Neurology 1990;32:403-14. [DOI] [PubMed] [Google Scholar]
- Granstrom M. In: Development of the children of epileptic mothers: Preliminary results from the prospective Helskiinki Study. Epilepsy, Pregnancy, and the Child. 1982 edition. New York: Raven Press. [Google Scholar]
Gaily 2004 {published data only}
- *.Gaily E, Kantola-Sorsa E, Hiilesmaa V et al. Normal intelligence in children with prenatal exposure to carbamazepine. Neurology 2004;62:28-32. [DOI] [PubMed] [Google Scholar]
- Kantola-Sorsa E, Gaily E, Isoaho M, Korkman M. Neuropsychological outcomes in children of mothers with epilepsy. Journal of the International Neuropsychological Society 2007;13:642-52. [DOI] [PubMed] [Google Scholar]
GERMAN Study {published data only}
- Hattig H, Helge H, Steinhausen HC. Infants of epileptic mothers: Developmental scores at 18 months. Advances in Epileptology. Vol. 16. New York: Raven Press, 1987. [Google Scholar]
- Hattig H, Steinhausen HC. Psychobiology and Early Development. North Holland: Elsevier Science Publishers, 1987. [Google Scholar]
- Jager Roman S, Fating D, Koch et al. Somatic parameters, diseases and psychomotor development in the offspring of epileptic parents. In: Pregnancy, Epilepsy, and the Child. New York: Raven Press, 1982:425-32. [Google Scholar]
- Koch S, Jager-Roman E, Losche G, Nau H, Rating D, Helge H. Antiepileptic drug treatment in pregnancy: drug side effects in the neonate and neurological outcome. Acta Paediatrica 1996;84:739-46. [DOI] [PubMed] [Google Scholar]
- Koch S, Titze K, Zimmerman R, Schroder M, Lehmkuhl U, Rauh H. Long-term neuropsychological consequences of maternal epilepsy and anticonvulsant treatment during pregnancy for school-age children and adolescents. Epilepsia 1999;40(9):1237-43. [DOI] [PubMed] [Google Scholar]
- *.Losche G, Steinhausen HC, Koch S, Helge H. The psychological development of children of epileptic parents. II. The differential impact of intrauterine exposure to anticonvulsant drugs and further influential factors. Acta Paediatrica 1994;83:961-6. [DOI] [PubMed] [Google Scholar]
- Rating D, Nau H, Jager-Roman E, Gopfert-Geyer I, Kock S, Beck-Mannagetta G et al. Teratogenic and pharmacokinetic studies of primidone during pregnancy and in the offspring of epileptic women. Acta Paediatrica Scandinavica 1982;71(2):301-11. [DOI] [PubMed] [Google Scholar]
- Steinhausen HC, Losche G, Kock S, Helge H. The psychological development of children of epileptic parents. 1. Study design and comparative findings. Acta Paediatrica 1994;83:955-60. [DOI] [PubMed] [Google Scholar]
- Titze K, Koch S, Helge H, Lehmkuhl U, Rauh H, Steinhausen HC. Prenatal and family risks of children born to mothers with epilepsy: effects on cognitive development. Developmental Medicine and Child Neurology 2008;50:117-22. [DOI] [PubMed] [Google Scholar]
Hanson 1976 {published data only}
- Hanson J, Myrianthopoulos N, Harvey M, Smith D. Risks to offspring of women treated with hydantoin anticonvulsants, with emphasis on the fetal hydantoin syndrome. Journal of Pediatrics 1976;89(4):662-8. [DOI] [PubMed] [Google Scholar]
Hill 1974 {published data only}
- *.Hill R, Verniaud W, Horning M, McCulley L, Morgan N. Infants exposed in utero to antiepileptic drugs: A prospective study. American Journal of Diseases in Childhood 1974;127:645-53. [DOI] [PubMed] [Google Scholar]
- Hill R, Verniaud W, Rettig G, Tennyson L, Craig J. Relationship between antiepileptic drug exposure of the infant and developmental potential. In: Janz et al, editors(s). Epilepsy, Pregnancy, and the Child. New York: Raven Press, 1982:409-17. [Google Scholar]
Hirano 2004 {published data only}
- Fujioka K, Kaneko S, Hirano T et al. A study of the psychomotor development of the offspring of epileptic mothers. 1984. [Google Scholar]
- *.Hirano T, Fujioka K, Okada M, Iwasa H, Kaneko S. Physical and psychomotor development in the offspring born to mothers with epilepsy. Epilepsia 2004;45 Suppl 8:53-7. [DOI] [PubMed] [Google Scholar]
- Nomura Y, Takebe Y, Nomura Y, Shinagawa S, Kaneko S, Sato T. The physical and mental development of infants born to mothers treated with antiepileptic drugs. 1984.
Jackson 2013 {unpublished data only}
- James F, Walshaw D, Kelly T, Lynch S, Jackson M. Neurodevelopmental outcome of infants born to mothers taking antiepileptic drugs in pregnancy: Results of a prospective population based study in the North of England.
Jones 1989 {published data only}
- Jones K, Lacro R, Johnson K, Adams J. Patern of malformations in the children of women treated with carbamazepine during pregnancy. The New England Journal of Medicine 1989;320(25):1661-6. [DOI] [PubMed] [Google Scholar]
Leavitt 1992 {published data only}
- Leavitt A, Yerby M, Robinson N, Sells C, Erickson D. Epilepsy in pregnancy: developmental outcome of offspring at 12 months. Neurology 1992;42(5):141-3. [PubMed] [Google Scholar]
Nadebaum 2011 {published data only}
- Nadebaum C, Anderson V, Vajda F, Reutens D, Barton S, Wood A. Language skills of school-aged children prenatally exposed to antiepileptic drugs. Neurology 2011;76:719-26. [DOI] [PubMed] [Google Scholar]
- *.Nadebaum C, Anderson V, Vajda F, Reutens D, Barton S, Wood A. The Australian brain and cognition and antiepileptic drugs study: IQ in school-aged children exposed to sodium valproate and polytherapy. Journal of the International Neuropsychological Society 2011;17:133-42. [DOI] [PubMed] [Google Scholar]
NEAD Study {published and unpublished data}
- Cohen M, Meador K, Browning N et al. Fetal antiepileptic drug exposure: motor, adaptive, and emotional/behavioral functioning at age 3 years. Epilepsy and Behavior 2011;22:240-6. [DOI] [PMC free article] [PubMed] [Google Scholar]
- McVearry K, Gaillard W, VanMeter J, Meador K. A prospective study of cognitive fluency and originality in children exposed in utero to carbamazepine, lamotrigine, or valproate monotherapy. Epilepsy and Behavior 2009;16:609-16. [DOI] [PMC free article] [PubMed] [Google Scholar]
- Meador K, Baker G, Browning N et al. Cognitive function at 3 years of age after fetal exposure to antiepileptic drugs. The New England Journal of Medicine 2009;360(16):1597-605. [DOI] [PMC free article] [PubMed] [Google Scholar]
- *.Meador K, Baker G, Browning N et al. Fetal antiepileptic drug exposure and cognitive outcomes at age 6 years (NEAD study): a prospective observational study. Lancet Neurology 2013;12:244-52. [DOI] [PMC free article] [PubMed] [Google Scholar]
- Meador K, Baker G, Browning N et al. Foetal antieplieptic drug exposure and verbal versus non-verbal abilities at three years of age. Brain 2011;134:396-404. [DOI] [PMC free article] [PubMed] [Google Scholar]
- Meador K, Baker G, Browning N et al. Relationship of child IQ and education in children with fetal antiepileptic drug exposure. Epilepsy and Behavior 2011;21:147-52. [DOI] [PMC free article] [PubMed] [Google Scholar]
- Meador K, Browning N, Cohen M et al. In utero antiepileptic drugs: differential cognitive outcomes in children of women with epilepsy. American Epilepsy Society. 2006.
Ornoy 1996 {published data only}
- Ornoy A, Cohen E. Outcome of children born to epileptic mothers treated with carbamazepine during pregnancy. Archives of Disease in Childhood 1996;75:517-20. [DOI] [PMC free article] [PubMed] [Google Scholar]
Regesta 1996 {published data only}
- *.Regesta T. The risk of malformations and developmental disturbances in children exposed to antiepileptic drugs: a prospective controlled study. Bollettino Lega Italiana Epilessia 1996;95(96):351-4. [Google Scholar]
- Tanganelli P, Regesta G. Epilepsy, pregnancy, and major birth anomalies: An Itialian prospective controlled study. Neurology 1992;42 Suppl 5:89-93. [PubMed] [Google Scholar]
Rihtman 2012 {published data only}
- Rihtman T, Parush S, Ornoy A. Preliminary findings of the developmental effects of in utero exposure to topiramate. Reproductive Toxicology 2012;34(3):308-11. [DOI] [PubMed] [Google Scholar]
Rihtman 2013 {published data only}
- *.Rihtman T, Parush S, Ornoy A. Developmental outcomes at preschool age after fetal exposure to valproic acid and lamotrigine: Cognitive, motor, sensory and behavioral function. Reproductive Toxicology 2013;41:115-25. [DOI] [PubMed] [Google Scholar]
Rovet 1995 {published data only}
- Gladstone D, Bologa M, Maguire C, Pastuszak A, Koren G. Course of pregnancy and fetal outcome following maternal exposure to carbamazepine and phenytoin; a prospective study. Reproductive Toxicology 1992;6:257-61. [DOI] [PubMed] [Google Scholar]
- Rovet J, Cole S, Nulman I, Scolnik D, Altmann D, Koren G. Effects of maternal epilepsy on children's neurodevelopment. Child Neuropsychology 1995;1(2):150-7. [Google Scholar]
- *.Scolnik D, Nulman I, Rovet J, Gladstone D, Czuchta D et al. Neurodevelopment of children exposed in utero to phenytoin and carbamazepine monotherapy. JAMA 1994;271(10):767-70. [PubMed] [Google Scholar]
Shallcross 2011 {published and unpublished data}
- *.Shallcross R, Bromley R, Irwin B, Bonnett L, Morrow J, Baker G. Child development following in utero exposure: levetiracetam vs sodium valproate. Neurology 2011;76:383-9. [DOI] [PMC free article] [PubMed] [Google Scholar]
- Shallcross R, Bromley RL, Cheyne CP et al. In utero exposure to levetiracetam vs valproate: Development and language at 3 years of age. Neurology 2014;82:213-21. [DOI] [PubMed] [Google Scholar]
- Shallcross R. Child development following In utero exposure: A comparison of novel and established antiepileptic drug treatment. Thesis: University of Liverpool 2011.
Sobczyz 1977 {published data only}
- Sobczyk W, Dowzenko A, Krasicka J. Investigation of children of mothers treated in pregnancy with anticonvulsants. Neurologia i Neurochirurgia Polska 1977;11(1):59-63. [PubMed] [Google Scholar]
Thomas 2007 {published data only}
- Thomas S, Sukumaran S, Lukose N, George A, Sarma P. Intellectual and language functions in children of mothers with epilepsy. Epilepsia 2007;48(12):2234-40. [DOI] [PubMed] [Google Scholar]
Thomas 2008 {published data only}
- Thomas S, Ajaykumar B, Singhu K, Nair M, George B, Sarma P. Motor and mental development of infants exposed to antiepileptic drugs in utero. Epilepsy and Behavior 2008;13:229-36. [DOI] [PubMed] [Google Scholar]
Veiby 2013 {published data only}
- *.Veiby G, Daltveit A, Schjolberg S, Stoltenberg C, Oyen A-S, Vollset S et al. Exposure to antiepileptic drugs in utero and child development: a prospective population-based study. Epilepsia 2013;54(8):1462-72. [DOI] [PMC free article] [PubMed] [Google Scholar]
Wide 2002 {published data only (unpublished sought but not used)}
- *.Wide K, Henning E, Eomson T, Winbladh B. Psychomotor development in preschool children exposed to antiepileptic drugs in utero. Acta Paediatrica 2002;91:409-14. [DOI] [PubMed] [Google Scholar]
- Wide K, Winbladh B, Tomson T, Sars-Zimmer K, Berggren E. Psychomotor development and minor anomalies in children exposed to antiepileptic drugs in utero: a prospective population-based study. Developmental Medicine and Child Neurology 2000;42:87-92. [DOI] [PubMed] [Google Scholar]
References to studies excluded from this review
Annegers 1974 {published data only}
- Annegers J, Elveback L, Hauser A, Kurland L. Do anticonvulsants have a teratogenic effect? Archives of Neurology 1974;31:364-73. [DOI] [PubMed] [Google Scholar]
Antiga 2010 {published data only}
- Antiga E, Monetti V, Fallica E et al. Cognitive development in children born to mothers with epilepsy [Epilessia e gravidanza: valutazione dello sviluppo cognitivo nei bambini nati da donne con epilessia]. Bollettino Lega Italiana Epilessia 2010;140:154-5. [Google Scholar]
Dean 2002 {published data only}
- Dean J, Hailey H, Moore S, Lloyd D, Turnpenny P, Little J. Long term and health and neurodevelopment in children exposed to antiepileptic drugs before birth. Journal of Medical Genetics 2002;36:251-9. [DOI] [PMC free article] [PubMed] [Google Scholar]
Dessens 2000 {published data only}
- Dessens A, Cohen-Kettenis P, Mellenbergh G, Koppe J, de Poll N, Boer K. Association of prenatal phenobarbital and phenytoin exposure with small head size at birth with learning problems. Acta Paediatrica 2000;89:533-41. [DOI] [PubMed] [Google Scholar]
Forsberg 2011 {published data only}
- Forsberg L, Wide K, Kallen B. School performance at age 16 in children exposed to antiepileptic drugs in utero - A population-based study. Epilepsia 2011;52(2):364-9. [DOI] [PubMed] [Google Scholar]
Holmes 2000 {published data only}
- Holmes L, Rosenberger P, Harvey E, Khoshbin S, Ryan L. Intelligence and physical features of children of women with epilepsy. Teratology 2000;61:196-202. [DOI] [PubMed] [Google Scholar]
Holmes 2005 {published data only}
- Holmes L, Coull B, Dorfman J, Rosenberger P. The correlation of deficits in IQ with midface and digit hypoplasia in children exposed in utero to anticonvulsant drugs. Journal of Pediatrics 2005;146:118-22. [DOI] [PubMed] [Google Scholar]
Jakubowska 1981 {published data only}
- Jakubowska T, Koziak M, Lipczynska-Lojkowska W, Niedzielska K, Witkowska-Olearska K, Zielinski J. Health status of children born to mothers with epilepsy [Ocena stanu zdrowia dzieci matek chorych na padaczke]. Neurologia i Neurochirurgia Polska 1981;15(3):303-8. [PubMed] [Google Scholar]
Kelly 1984 {published data only}
- Kelly T, Edwards P, Rein M, Miller J, Dreifuss F. Teratogenicity of anticonvulsant drugs 2: a prospective study. American Journal of Medical Genetics 1984;19:435-43. [DOI] [PubMed] [Google Scholar]
Kozhokaru 2010 {published data only}
- Kozhokaru A, Karlov V, Zhydkova I, Serkina A. Intellectual, psychomotor and speech development of children born to mothers with epilepsy. Zhurnal Nevropatologii i Psikhiatrii Imeni 2010;110(2):25-30. [PubMed] [Google Scholar]
Latis 1982 {published data only}
- Latis G, Battino D, Boldi B et al. Preliminary data of a neuropediatric follow-up of infants born to epileptic mothers. In: Janz et al, editors(s). Epilepsy, Pregnancy and the Child. New York: Raven Press, 1982:419-23. [Google Scholar]
Lekwuwa 1995 {published data only}
- Lekwuwa G, Adewole I, Thompson M. Antiepileptic drugs and teratogenicity in Nigerians. Transanction of the Royal Society of Tropical Medicine and Hygiene 1995;89:227. [DOI] [PubMed] [Google Scholar]
Majewski 1981 {published data only}
- Majewski F, Steger M, Richter B, Gill J, Rabe F. The teratogenicity of hydantoins and barbiturates in humans, with considerations on the etiology of malformations and cerebral disturbances in the children of epileptic parents. Biological Research in Pregnancy 1981;2(1):94-102. [PubMed] [Google Scholar]
Meador 2010 {published data only}
- Meador K, Baker G, Browning N et al. Effects of breastfeeding in children of women taking antiepileptic drugs. Neurology 2010;75:1954-60. [DOI] [PMC free article] [PubMed] [Google Scholar]
Moore 2000 {published data only}
- Moore S, Turnpenny P, Quinn A et al. A clinical study of 57 children with fetal anticonvulsant syndromes. Journal of Medical Genetics 2000;37:489-97. [DOI] [PMC free article] [PubMed] [Google Scholar]
Mortensen 1996 {published data only}
- Mortensen E, Reinisch J, Sanders S, Rubin D. Intelligensdefekter som senfølge af praenatal eksposition for phenobarbital fenemal. [Delayed effects of prenatal exposure to phenobarbital on intelligence Phenemal]. Ugeskrift for Laeger 1996;158(46):6589-94. [PubMed] [Google Scholar]
- Reinisch J, Sanders S, Mortensen E, Rubin D. In utero exposure to phenobarbital and intelligence deficits in adult men. JAMA 1995;274(19):1518-25. [PubMed] [Google Scholar]
Mortensen 2003 {published data only}
- Mortensen J, Olsen J, Larsen H, Bendsen, Obel C, Sorensen H. Psychomotor development in children exposed in utero to benzodiazepines, antidepressants, neuroleptics, and anti-epileptics. European Journal of Epidemiology 2003;18:769-71. [DOI] [PubMed] [Google Scholar]
Oyen 2007 {published data only}
- Oyen N, Vollset S, Eide M, Bjerkedal T, Skjaerven R. Maternal epilepsy and offsprings' adult intelligence: A population-based study from Norway. Epilepsia 2007;48(9):1731-8. [DOI] [PubMed] [Google Scholar]
Parisi 2003 {published data only}
- Parisi P, Francia A, Vanacore N, Fiore S, Gillonardo A, Manfredi M. Psychomotor development and general movements in offspring of women with epilepsy and anticonvulsant therapy. Early Human Development 2003;74:97-108. [DOI] [PubMed] [Google Scholar]
Perinola 1992 {published data only}
- Perinola T, Buttiglione M, Margari L. Antiepileptic drugs in pregnancy: late effects on the children's cognitive abilities. Acta Neurologia 1992;14(4-6):543-6. [PubMed] [Google Scholar]
Rasalam 2005 {published data only}
- Rasalam A, Hailey H, Williams J et al. Characteristics of fetal anticonvulsant syndrome associated autistic disorder. Developmental Medicine and Child Neurology 2005;47:551-5. [DOI] [PubMed] [Google Scholar]
Sereno‐Colo 1984 {published data only}
- Sereno-Colo J, Dominguez F, Gutierrez J. Tratamiento de la gestante epileptica con carbamacepina. Ginecologia y Obstetricia de Mexico 1984;52(329):231-5. [PubMed] [Google Scholar]
Steinhausen 1982 {published data only}
- Steinhausen HC, Nestler V, Huth H. Psychopathology and mental functions in the offspring of alcoholic and epileptic mothers. Journal of the American Academy of Child Psychiatry 1982;21(3):268-73. [DOI] [PubMed] [Google Scholar]
Vanoverloop 1992 {published data only}
- Vanoverloop D, Schnell R, Harvey E, Holmes L. The effects of prenatal exposure to phenytoin and other anticonvulsants on intellectual function at 4 to 8 years of age. Neurotoxicology and Teratology 1992;14:329-35. [DOI] [PubMed] [Google Scholar]
Vert 1982 {published data only}
- Deblay M, Vert P, Andre M. Children of epileptic mothers [L'enfant de mere epileptique]. La Nouvelle Presse Mediciale 1982;11(3):173-6. [PubMed] [Google Scholar]
- Vert P, Deblay M, Andre M. Follow-up study on growth and neurologic development of children born to epileptic mothers. In: Janz et al, editors(s). Epilepsy, Pregnancy, and the Child. New York: Raven Press, 1982:433-6. [Google Scholar]
Yamatogi 1993 {published data only}
- Yamatogi Y, Oka E, Satoh M, Kobayashi K, Yoshinaga H, Ohtahara S. A prospective follow-up of the offspring of epileptic patients. The Japanese Journal of Psychiatry and Neurology 1993;47(2):309-11. [DOI] [PubMed] [Google Scholar]
References to studies awaiting assessment
Adams 2000 Abstract {unpublished data only}
- Adams JHE, Holmes LB. Cognitive deficits following gestational monotherapy with phenobarbital and carbamazepine. Neurotoxicology and Teratology 2000;22:466. [Google Scholar]
Jovic 2011 Abstract {unpublished data only}
- Jovic N, Knezevic-Pogancev M, Ignjatovic MP. Cognitive functions at 6 years of age after fetal exposure to antiepileptic drugs used in mothers with juvenile myoclonic epilepsy. European Neuropsychopharmacology 2011;21(2):169. [Google Scholar]
Nadebaum 2011 Abstract {unpublished data only}
- Nadebaum C, Anderson V, Vajda F, Wood A. Academic achievement of Australian children prenatally exposed to antiepileptic drugs. International Epilepsy Congress. 2011. [DOI] [PubMed] [Google Scholar]
Wood 2011 Abstract {unpublished data only}
- Wood AG, Nadebaum C, Anderson VA, Reutens D, Barton S, O'Brien T, Vajda FV. Valproate dose is an independent risk factor for autism spectrum disorder: Evidence from prospective assessments in the Australian brain, cognition and antiepileptic drugs study. 29th International Epilepsy Congress . [Google Scholar]
Additional references
Ackers 2009
- Ackers R, Besag FM, Wade A, Murray ML, Wong IC. Changing trends in antiepileptic drug prescribing in girls of child-bearing potential. Archive of Disease in Childhood 2009;94(6):443-7. [DOI] [PubMed] [Google Scholar]
Adab 2001
- Adab N, Jacoby A, Smith D, Chadwick D. Additional educational needs in children born to mothers with epilepsy. Journal of Neurology, Neurosurgery, and Psychiatry 2001;70(1):15-21. [DOI] [PMC free article] [PubMed] [Google Scholar]
Adab 2004
- Adab N, Tudur Smith C, Vinten J, Williamson PR, Winterbottom JB. Common antiepileptic drugs in pregnancy in women with epilepsy. Cochrane Database of Systematic Reviews 2004, Issue 3. [DOI: 10.1002/14651858.CD004848] [DOI] [PubMed] [Google Scholar]
Adab 2004b
- Adab N, Kini U, Vinten J, Ayres J, Baker G, Clayton-Smith J et al. The longer term outcome of children born to mothers with epilepsy. Journal of Neurology, Neurosurgery, and Psychiatry 2004;75(11):1575-83. [DOI] [PMC free article] [PubMed] [Google Scholar]
Ardinger 1988
- Ardinger H, Atkin J, Blackston R, Elsas L, Clarren S, Livingstone S et al. Verification of the fetal valproate syndrome phenotype. American Journal of Medical Genetics 1988;29(1):171-85. [DOI] [PubMed] [Google Scholar]
Ardnt 2005
- Arndt TL, Stodgell CJ, Rodier PM. The teratology of autism. International Journal of Developmental Neuroscience 2005;23(2-3):189-99. [DOI] [PubMed] [Google Scholar]
Banach 2010
- Banach R, Boskovic R, Einarson T, Koren G. Long-term developmental outcome of children of women with epilepsy, unexposed or exposed prenatally to antiepileptic drugs. A meta-analysis of cohort studies. Drug Safety 2010;33(1):73-9. [DOI] [PubMed] [Google Scholar]
Baron 2004
- Baron I. Neuropsychological Evaluation of the Child. Oxford: Oxford University Press, 2004. [Google Scholar]
Bittigau 2003
- Bittigau P, Sifringer M, Ikonomidou C. Antiepileptic drugs and apoptosis in the developing brain. Annals of the New York Academy of Sciences 2003;993:103-14. [DOI] [PubMed] [Google Scholar]
Bossi 1982
- Bossi L. Neonatal period including drug disposition in new borns: Review of the literature. In: Janz D, Dam M, Richens A, Bossi L, Helge H, Schmidt D, editors(s). Epilepsy, Pregnancy and the Child. New York: Ravens press, 1982:327-42. [Google Scholar]
Brent 2004
- Brent R. Environmental causes of human congenital malformations: the pediatrician's role in dealing with these complex clinical problems caused by a multiplicity of environmental and genetic factors. Pediatrics 2004;13(4):957-68. [PubMed] [Google Scholar]
Bromley 2009
- Bromley RL, Baker GA, Meador KJ. Cognitive abilities and behaviour of children exposed to antiepileptic drugs in utero. Current Opinion in Neurology 2009;22:162-6. [DOI] [PMC free article] [PubMed] [Google Scholar]
Bromley 2010
- Bromley RL, Mawer G, Love J, Kelly J, Purdy L, McEwan L et al. Early cognitive development in children born to women with epilepsy: A prospective report. Epilepsia 2010;51(10):2058-65. [DOI] [PubMed] [Google Scholar]
Charlton 2011
- Charlton RA, Weil JG, Cunnington MC, Ray S, Vries CS. Comparing the General Practice Research Database and the UK Epilepsy and Pregnancy Register as tools for postmarketing teratogen surveillance: anticonvulsants and the risk of major congenital malformations. Drug Safety 34;2:157-71. [DOI] [PubMed] [Google Scholar]
Chevallier 1989
- Chevallier B, Negre V, Bidat E, Lagardere B. Fetal valproate syndrome and somatic and psychomotor development. Archives Francaises Pediatrie 1989;46:627-30. [PubMed] [Google Scholar]
Christensen 2013
- Christensen J, Gronborg TK, Sorensen MJ, Schendel D, Parner ET, Pedersen LH, Vestergaard M. Prenatal valproate exposure and risk of autism spectrum disorders and childhood autism. JAMA 2013;309(16):1696-703. [DOI] [PMC free article] [PubMed] [Google Scholar]
Christianson 1994
- Christianson A, Chesler N, Kromberg J. Fetal valproate syndrome: Clinical and neurodevelopmental features in two sibling pairs. Developmental Medicine and Child Neurology 1994;36:357-69. [DOI] [PubMed] [Google Scholar]
Clayton‐Smith 1995
- Clayton-Smith J, Donnai D. Fetal valproate syndrome. Journal of Medical Genetics 1995;32:724-7. [DOI] [PMC free article] [PubMed] [Google Scholar]
Cummings 2011
- Cummings C, Stewart M, Stevenson M, Morrow J, Nelson J. Neurodevelopment of children exposed in utero to lamotrigine, sodium valproate and carbamazepine. Archives of Disease in Childhood 2011;96:943-7. [DOI] [PubMed] [Google Scholar]
Dean 2002
- Dean JCS, Hailey H, Moore SJ, Lloyd DJ, Turnpenny PD, Litttle J. Long term health and neurodevelopment in children with prenatal exposure to antiepileptic drugs before birth. Journal of Medical Genetics 2002;39:251-9. [DOI] [PMC free article] [PubMed] [Google Scholar]
Deary 2007
- Deary IJ, Stran S, Smith P, Fernandes C. Intelligence and educational achievement. Intelligence 2007;35:13-21. [Google Scholar]
Friedman 2012
- Friedman JM. ABCDXXX: The obscenity of postmarketing surveillance for teratogenic effects. Birth Defects Research A. Clinical and Molecular Teratology 2012;94(8):670-6. [DOI] [PubMed] [Google Scholar]
Gaily 2004
- Gaily E, Kantola-Sorsa E, Hiilesmaa V, Isoaho M, Matila R, Kotila M. Normal intelligence in children with prenatal exposure to carbamazepine. Neurology 2004;62:28-32. [DOI] [PubMed] [Google Scholar]
Guyatt 2008
- Guyatt GH, Oxman AD, Vist G, Kunz R, Falck-Ytter Y, Alonso-Coello P et al, for the GRADE Working Group. Rating quality of evidence and strength of recommendations GRADE: an emerging consensus on rating quality of evidence and strength of recommendations. BMJ 2008;336:924-6. [DOI] [PMC free article] [PubMed] [Google Scholar]
Hanson 1976
- Hanson JW, Myrianthopoulos NC, Sedgwick-Harvey MA, Smith DW. Risks to the offspring of women treated with hydantoin anticonvulsants, with emphasis on the fetal hydantoin syndrome. The Journal of Pediatrics 1976;89:662-8. [DOI] [PubMed] [Google Scholar]
Hauser 1990
- Hauser W, Hesdorffer D. Epilepsy: Frequency, causes and consequences. New York: Demos Publications, 1990. [Google Scholar]
Hernandez‐Diaz 2012
- Hernandez-Diaz S, Smith CR, Shen A, Mittendorf R, Hauser WA, Yerby M. Comparative safety of antiepileptic drugs during pregnancy. Neurology 2012;78(21):1692-9. [DOI] [PubMed] [Google Scholar]
Higgins 2011
- Higgins JPT, Green S (editors). Cochrane Handbook for Systematic Reviews of Interventions Version 5.1.0 [updated March 2011]. The Cochrane Collaboration, 2011. Available from www.cochrane-handbook.org.
Hill 1982
- Hill RM, Verniaud WM, Rettig GM, Tennyson LM, Craig JP. Relationship between antiepileptic drug exposure of the infant and developmental potential. In: Janz D, Dam M, Richens A, Bossi L, Helge H, Schmidt D, editors(s). Epilepsy, Pregnancy and the Child. New York: Ravens Press, 1982:409-17. [Google Scholar]
Huth 1982
- Huth H, Steinhausen HC, Helge H. Mental development in children of epileptic parents. In: Janz D, Dam M, Richens A, Bossi L, Helge H, Schmidt D, editors(s). Epilepsy, Pregnancy and the Child. New York: Ravens Press, 1982:437-41. [Google Scholar]
Kantola‐Sorsa 2007
- Kantola-Sorsa E, Gaily E, Isoaho M, Korkman M. Neuropsychological outcomes in children of mothers with epilepsy. Journal of the International Neuropsychological Society 2007;13(4):642-52. [DOI] [PubMed] [Google Scholar]
Kirkham 2010
- Kirkham J, Dwan K, Altman D et al. The impact of outcome reporting bias in randomised controlled trials on a cohort of systematic reviews. BMJ 2010;340:c365. [DOI] [PubMed] [Google Scholar]
Lindhout 1992
- Lindhout D, Meinardi H, Meijer J, Nau H. Antiepileptic drugs and teratogenesis in two consecutive cohorts: Changes in prescription policy paralleled by changes in pattern of malformations. Neurology 1992;42:94-110. [PubMed] [Google Scholar]
Mawhinney 2013
- Mawhinney E, Craig J, Morrow J, Russell A, Smithson WH, Parsons L et al. Levetiracetam in pregnancy: results from the UK and Ireland epilepsy and pregnancy registers. Neurology 2013;80(4):400-5. [DOI] [PubMed] [Google Scholar]
Meador 2008
- Meador K, Reynolds MW, Crean S, Fahrbach K, Probst C. Pregnancy outcomes in women with epilepsy: A systematic review and meta-analysis of published pregnancy registries and cohorts. Epilepsy Research 2008;81:1-13. [DOI] [PMC free article] [PubMed] [Google Scholar]
Meador 2009
- Meador K, Baker GA, Browning N, Clayton-Smith J, Combs-Cantrell D, Cohen M et al. Cognitive function at 3 years of age after fetal exposure to antiepileptic drugs. The New England Journal of Medicine 2009;360:1597-605. [DOI] [PMC free article] [PubMed] [Google Scholar]
Meador 2009b
- Meador KJ, Penovich P, Baker GA, Pennell PB, Bromfield E, Pack A. Antiepileptic drug use in women of childbearing age. Epilepsy and Behavior 2009;15(3):339-43. [DOI] [PMC free article] [PubMed] [Google Scholar]
Meador 2011
- Meador KJ, Baker GA, Browning N, Cohen M, Clayton-Smith J, Kalayjian LA et al. Foetal antiepileptic drug exposure and verbal versus non-verbal abilities at three years of age. Brain 2011;134:396-404. [DOI] [PMC free article] [PubMed] [Google Scholar]
Metcalfe 2012
- Metcalfe A, Roberts JI, Abdulla F, Wiebe S, Hanson A, Federico P, Jette N. Patient knowledge about issues related to pregnancy in epilepsy: a cross-sectional study. Epilepsy and Behavior 2012;24(1):65-69. [DOI] [PubMed] [Google Scholar]
Miyazaki 2005
- Miyazaki K, Narita N, Narita M. Maternal administration of thalidomide or valproic acid causes abnormal serotonergic neurons in the offspring: Implications for pathogenesis of autism. International Journal of Developmental Neuroscience 2005;23:287-97. [DOI] [PubMed] [Google Scholar]
Moore 2000
- Moore SJ, Turnpenny, PD, Quinn A, Glover S, Lloyd DJ, Montgomery T et al. A clinical study of 57 children with fetal anticonvulsant syndromes. Journal of Medical Genetics 2000;37:489-97. [DOI] [PMC free article] [PubMed] [Google Scholar]
Nadebaum 2011
- Nadebaum C, Anderson V, Vajda F, Reutens D, Barton S, Wood A. The Australian brain and cognition and antiepileptic drugs study: IQ in school-aged children exposed to sodium valproate and polytherapy. Journal of International Neuropsychological Society 2011;17:1-10. [DOI] [PubMed] [Google Scholar]
Nicolai 2008
- Nicolai J, Vles JSH, Aldenkamp AP. Neurodevelopmental delay in children exposed to antiepileptic drugs in utero: A critical review directed at structural study-bias. Journal of the Neurological Sciences 2008;271(1-2):1-14. [DOI] [PubMed] [Google Scholar]
Rasalam 2005
- Rasalam AD, Hailey H, Williams JH, Moore SJ, Turnpenny PD, Lloyd DJ et al. Charateristics of fetal anticonvulsant syndrome associated autistic disorder. Developmental Medicine and Child Neurology 2005;47(8):551-5. [DOI] [PubMed] [Google Scholar]
Roberts 2011
- Roberts JI, Metcalfe A, Abdulla F, Wiebe S, Hanson A, Federico P, Jette N. Neurologists' and neurology residents' knowledge of issues related to pregnancy for women with epilepsy. Epilepsy and Behavior 2011;22(2):358-63. [DOI] [PubMed] [Google Scholar]
Steinhausen 1994
- Steinhausen HC, Losche G, Koch S, Helge H. The psychological development of children of epileptic parents. I. Study design and comparative findings. Acta Paediatrica 1994;83:955-60. [DOI] [PubMed] [Google Scholar]
Titze 2008
- Titze K, Koch S, Helge H, Lehmkuhl U, Rauh H, Steinhausen H-C. Prenatal and family risks of children born to mothers with epilepsy: effects on cognitive development. Developmental Medicine and Child Neurology 2008;50(2):117-22. [DOI] [PubMed] [Google Scholar]
Tomson
- Tomson T, Battino D, Bonizzoni E, Craig J, Lindhout D, Sabers A et al. Dose-dependent risk of malformations with antiepileptic drugs: An analysis of data from the EURAP epilepsy and pregnancy registry. Lancet Neurology 2011;10(7):609-17. [DOI] [PubMed] [Google Scholar]
Tomson 2011
- Tomson T, Battino D, Bonizzoni E, Craig J, Lindhout D, Sabers A et al. Dose-dependent risk of malformation with antiepileptic drugs: An analysis of data from the EURAP epilepsy and pregnancy registry. Lancet Neurology 2011;10(7):609-17. [DOI] [PubMed] [Google Scholar]
Veiby 2013
- Veiby G, Engelsen BA, Gilhus NE. Early child development and exposure to antiepileptic drugs prenatally and through breastfeeding: a prospective cohort study on children of women with epilepsy. JAMA Neurology 2013;70(11):1367-74. [DOI] [PubMed] [Google Scholar]
Williams 1997
- Williams P, Hersh J. A male with fetal valproate syndrome and autism. Developmental Medicine and Child Neurology 1997;39:632-4. [DOI] [PubMed] [Google Scholar]
Winter 1987
- Winter R, Donnai D, Burn J, Tucker S. Fetal valproate syndrome: Is there a recognisable phenotype? Journal of Medical Genetics 1987;24:692-5. [DOI] [PMC free article] [PubMed] [Google Scholar]
Yerby 1994
- Yerby MS. Pregnancy, teratogenesis and epilepsy. Neurological Clinics 1994;12:749-71. [PubMed] [Google Scholar]
References to other published versions of this review
Abab 2004
- Adab N, Tudur Smith C, Vinten J, Williamson PR, Winterbottom JB. Common antiepileptic drugs in pregnancy in women with epilepsy (Review). Cochrane Database of Systematic Reviews 2004, Issue 3. [DOI: 10.1002/14651858.CD004848] [DOI] [PubMed] [Google Scholar]