

Abstract

Hg2+ has a significant hazardous impact on the environment and ecosystem. There is a great demand for new methods with high selectivity and sensitivity to determine mercury in life systems and environments. In this paper, a novel turn-on Hg2+ fluorescent probe has been reported with a naphthalimide group. The Hg2+ fluorescent probe was designed by the inspiration of the well-known specific Hg2+-triggered thioacetal deprotection reaction. A 1,2-dithioalkyl group was chosen as the specific recognition site of Hg2+. The probe showed weak fluorescence without Hg2+, and the color of the solution was light yellow. In the presence of Hg2+, the probe reacted specifically with the mercury ion to produce an aldehyde and emitted strong fluorescence, and the color of the solution also turned light green, thus realizing the monitoring of the mercury ion. The Hg2+ fluorescent probe showed outstanding sensitivity and selectivity toward Hg2+. Furthermore, the Hg2+ fluorescent probe could work in a wide pH range. The linear relationship between the fluorescence intensity at 510 nm and the concentration of Hg2+ was obtained in a range of Hg2+ concentration from 2.5 × 10⁻⁷ to 1.0 × 10⁻⁵ M. The detection limit was found to be 4.0 × 10⁻⁸ M for Hg2+. Furthermore, with little cell toxicity, the probe was successfully applied to the confocal image of Hg2+ in PC-12 cells.
Introduction
In recent years, heavy metals have been widely used in people’s production and daily life. However, the significant biological toxicity and nonbiodegradability of heavy metals cause serious pollution to the environment and threaten human health.1 Thus, detection of heavy metals has attracted extensive attention of researchers. Among them, mercury as a common toxic heavy metal is easily enriched by food chain bioamplification and eventually enters the human body.2 Mercury ions cause cell dysfunction due to their strong affinity for enzymes and thiols in proteins.3 Exposure to high levels of mercury in a long term can cause irreversible damage to the nervous system,4,5 endocrine system,6 immune system,7 and digestive system.8 Therefore, there is a great demand for new methods with high sensitivity and selectivity to monitor mercury in life systems and environments.
At present, many analytical methods have been developed to determine mercury ions, including high-performance liquid chromatography (HPLC),8 inductively coupled plasma mass spectrometry (ICP-MS),9 atomic absorption spectrometry (AAS),10 atomic emission spectrometry (AES),11 cold atomic fluorescence spectrometry,12 surface-enhanced Raman spectroscopy,13 ultraviolet–visible spectrophotometry (UV–vis),14 and electrochemical method.15−17 Although these methods are sensitive, selective, and precise for Hg2+ detection, most of them are pretty sophisticated, time-consuming, and expensive as well as unsuited for real-time and on-site detection. Because of their superiority of simplicity, high sensitivity, and low price, most of the Hg2+ fluorescent probes have been reported. It is reported that Hg2+ can quench the fluorescence of the fluorescent probe molecule by coupling with the spin orbital of the fluorescent molecule,18 which is a common fluorescence quenching agent. Therefore, most fluorescent probes for the determination of mercury ions are designed by the inspiration of the fluorescence quenching mechanism19−21 and their sensitivity is lower than that of enhanced probes. However, only part of the measurement is based on the fluorescence enhancement principle for mercury ions.22−28 Therefore, the design of a fluorescence-enhanced Hg2+ probe with high selectivity and sensitivity has great prospects and challenges.
Naphthalimide and its derivatives have been extensively applied in optical sensing owing to their favorable spectroscopic properties including superior light stability, high luminescence efficiency, and large Stokes shifts.29−31 Recently, naphthalimide-based probes have been reported to detect various substances including Hg2+,32−37 Zn2+,38 Cu2+,39 Ag+,36,40 Cd2+,41 Pd2+,42 Al3+,43 Cr3+,44 glutathione S-transferase,45 and endoplasmic reticulum aminopeptidase 1.46 However, some of these naphthalimide-based fluorescent probes for Hg2+ were constructed by utilizing the fluorescence quenching mechanism and their sensitivity was poor.35,36 In this article, a novel turn-on Hg2+ fluorescent probe 1 has been developed with a naphthalimide group (Scheme 1). The Hg2+ fluorescent probe was constructed and reported by applying the well-known specific Hg2+-triggered thioacetal deprotection reaction to generate the formyl group.47−49 A 1,2-dithioalkyl group was chosen as the specific recognition site of Hg2+. When there was no mercury ion, the probe showed weak fluorescence and the color of the solution was light yellow. When the mercury ion was added, the probe reacted specifically with the mercury ion to produce an aldehyde and emitted strong fluorescence, and the color of the solution turned light green, thus realizing the monitoring of the mercury ion. The probe had high selectivity and sensitivity and was expected to be a fast, simple, and precise tool for mercury ion detection.
Scheme 1. Synthetic Route for Probe 1.

Reagents and conditions: (a) N-butylamine, CH3CH2OH, reflux, 6 h, 82%; (b) K2CO3, CH3OH, reflux, 14 h, 79%; (c) HI (57%), reflux, 8 h, 77%; (d) trifluoroacetic acid, urotropine, reflux, 21 h, 70%; and (e) 1,2-ethanedithiol, CH3CH2OH, p-toluene sulfonic acid monohydrate, reflux, 24 h, 79%.
Results and Discussion
Spectroscopic Analytical Performance of Probe 1 toward Hg2+
To evaluate the fluorescence recognition ability of probe 1 for detection of Hg2+ in 0.01 M PBS buffer (ethanol/water = 2:8, v/v; pH = 7.40), the probe (5.0 μM) was dealt with various concentrations of Hg2+, and the fluorescence spectra were obtained (as shown in Figure 1). With the increase of the concentration of Hg2+ (0–10 μM), the fluorescence emission intensity at 510 nm was enhanced, which constituted the base for the detection of Hg2+ using probe 1 in the work. In the presence of 10 μM Hg2+, the probe showed the most significant fluorescence change and about 20-fold fluorescence enhancement at 510 nm was detected, which might be owing to the Hg2+-triggered thioacetal deprotection reaction to generate the formyl group. Additionally, linear relationships in the range of Hg2+ concentration from 2.5 × 10⁻⁷ to 1.0 × 10⁻⁵ M were obtained by plotting between the fluorescence intensity of probe 1 at 510 nm and Hg2+ concentrations (Figure 2). The linear regression equation was F = 96.5841 + 107.0940 × 10⁶ × C (r = 0.9972). Here, F denotes the fluorescence intensity of probe 1 at 510 nm, C stands for the concentration of Hg2+, and r indicates the linear correlation coefficient. The detection limit was determined to be 3SB/m (where SB represents the standard deviation of 10 blank measurements and m is the slope of the calibrated line).50,51 The detection limit was found to be 4.0 × 10⁻⁸ M, which is smaller than that of previous Hg2+ fluorescent probes.19,22,35,52−54 The above results prove that probe 1 can be applied for quantitative determination of Hg2+.
Figure 1.

Fluorescence emission spectra of probe 1 (5.0 μM) after the addition of different concentrations of Hg2+: 0, 0.25, 0.50, 0.75, 1.0, 2.5, 3.5, 5.0, 7.5, 9.0, and 10 μM from 1 to 11 (λex = 414 nm).
Figure 2.

Plot of the fluorescence intensity of probe 1 (5.0 μM) as a function of the concentration of Hg2+ from 0.25 to 10 μM.
Time-Dependent Response of Probe 1 to Hg2+
To study the detection kinetics, the fluorescence intensity of probe 1 was recorded with time under the condition with and without Hg2+ (Figure 3). As seen in Figure 3, when 10 μM Hg2+ is added, the fluorescence intensity of the probe at 510 nm changes rapidly with the incubation time, reaching equilibrium after 10 min in the buffer of 0.01 M PBS (ethanol/water = 2:8, v/v; pH = 7.40). The response time of the probe to Hg2+ was much faster than that of the previously developed Hg2+ fluorescent probe.49,55,56 Without Hg2+, the fluorescence intensity at 510 nm did not change in the system, indicating that the probe was steady under the experimental conditions. The experimental results indicate that the probe 1 can be applied for rapid determination of Hg2+. In this work, the assay time was optimized to 10 min.
Figure 3.

Time course of the fluorescence intensity of probe 1 (5.0 μM) in the absence (solid circles) and presence of 10 μM Hg2+ (open circles). Time points represent 0, 1, 2, 3, 4, 5, 6, 8, 10, 12, 14, 16, 18, 20, 22, 24, 26, 28, and 30 min.
Effect of pH
To detect Hg2+ sensitively, the pH effects were studied on probe 1’s fluorescence intensity under the conditions with and without Hg2+ (Figure 4). From Figure 4, in the pH range of 2.00–11.00, without Hg2+, the fluorescence intensity of probe 1 (5.0 μM) is stable. Meanwhile, in the pH range of 3.00–11.00, the fluorescence intensity of probe 1 showed significant emission enhancement with Hg2+ (10 μM). When the pH value is higher than 10.0, the fluorescence intensity of probe 1 is weak in the presence of Hg2+, which might be because Hg2+ was combined with OH– to be Hg(OH)2. The experimental results indicate that the Hg2+ probe can work in a wide pH range. The pH range of the physiological environment was covered in this range, resulting that the probe 1 can be applied for biological detection.
Figure 4.

pH effect on the fluorescence intensity at 510 nm of probe 1 (5.0 μM) in the absence (solid circles) and presence (open circles) of Hg2+ (10 μM). All data were obtained at various pH values (pH 2.00–11.00).
Selectivity
High selectivity is an important factor in the preparation of excellent fluorescent probes. To study the specificity of the probe 1 to Hg2+, the fluorescence response of the probe 1 was investigated with various metal ions (Figure 5A). Hg(NO3)2 supplied mercury ions. Na+, K+, Ca2+, Ba2+, Mn2+, Ni2+, Fe3+, Al3+, and Cr3+ were supplied with their chlorides. Mg2+, Cd2+, Co2+, Cu2+, and Fe2+ were supplied with their sulfates. Zn2+, Pb2+, and Ag+ were supplied with their nitrates. As shown in Figure 5A, the fluorescence intensity of probe 1 significantly strengthened after adding Hg2+ and slightly increased in the presence of Ag+, while no significant fluorescence enhancement was observed after adding other metal ions. In biological and environmental analyses, the possible interference of Ag+ on the determination of Hg2+ could be successfully shielded by introducing an appropriate concentration of KBr solution. In addition, the selectivity of probe 1 for Hg2+ with the existence of other metal ions was also investigated (Figure 5B). From Figure 5B, when different metal ions and mercury ions coexisted, the fluorescence intensity of probe 1 exhibited little or almost no change. These results indicated that the probe had a good selectivity for Hg2+.
Figure 5.

(A) Fluorescence response of probe 1 (5.0 μM) in the presence of the mercury ion (10 μM) and other metal ions at pH 7.40. The reaction substances are as follows: (1) blank, (2) Na+, (3) K+, (4) Ca2+, (5) Mg2+, (6) Ba2+, (7) Cd2+, (8) Mn2+, (9) Co2+, (10) Ni2+, (11) Cu2+, (12) Zn2+, (13) Pb2+, (14) Fe3+, (15) Fe2+, (16) Al3+, (17) Cr3+, (18) Ag+, and (19) Hg2+. (B) Fluorescence response of probe 1 to Hg2+ in the presence of other metal ions at pH 7.40. The reaction substances are as follows: (1) Na+, (2) K+, (3) Ca2+, (4) Mg2+, (5) Ba2+, (6) Cd2+, (7) Mn2+, (8) Co2+, (9) Ni2+, (10) Cu2+, (11) Zn2+, (12) Pb2+, (13) Fe3+, (14) Fe2+, (15) Al3+, (16) Cr3+, (17) Ag+, and (18) Hg2+. The concentration of Hg2+ and Ag+ is 10 μM, and the concentration of all other metal ions is 100 μM.
Proposed Mechanism
On the basis of the deprotection reaction of the dithioacetal triggered by Hg2+,47−49 it is supposed that the 1,2-disulfide group in probe 1 was deprotected to aldehyde by Hg2+, thus transforming probe 1 into compound 5 (Scheme 2). To validate the reaction mechanism of probe 1 for Hg2+, ultraviolet–visible absorption spectroscopy (Figure 6) and high-performance liquid chromatography (Figure 7) were employed to provide direct evidence. As depicted in Figure 6, without Hg2+, the probe exhibited an absorption peak at around 461 nm, and compound 5 has a major absorption peak at around 417 nm. In the presence of Hg2+ (50 μM), the probe showed an evidently blueshift from 461 to around 417 nm. Meanwhile, the color of the solution changed from pale yellow to light green and probe 1 could be applied as a visual tool to determine Hg2+. So, it may be attributed to the formation of the compound 5 produced via the reaction of probe 1 to Hg2+. Furthermore, from Figure 7, the probe 1 showed a peak at 16.14 min and the compound 5 exhibited a peak at 12.18 min. The retention time (12.15 min) of the probe with Hg2+ (1 mM) was equal to that of compound 5. The HPLC result also indicated that the newly emerging substance in probe 1 with Hg2+ was compound 5. A peak at m/z 296.0930 (Figure S12, Supporting Information) from the ESI-MS spectrum indicated a new product formed after mixing the probe 1 and Hg2+ for 10 min. As shown in Figure S1, the peak at m/z 296.0930 matched with the structure [compound 5 – H]−. The above results confirmed our hypothesis in Scheme 2.
Scheme 2. Proposed Possible Mechanism of the Response of Probe 1 to Hg2+.

Figure 6.
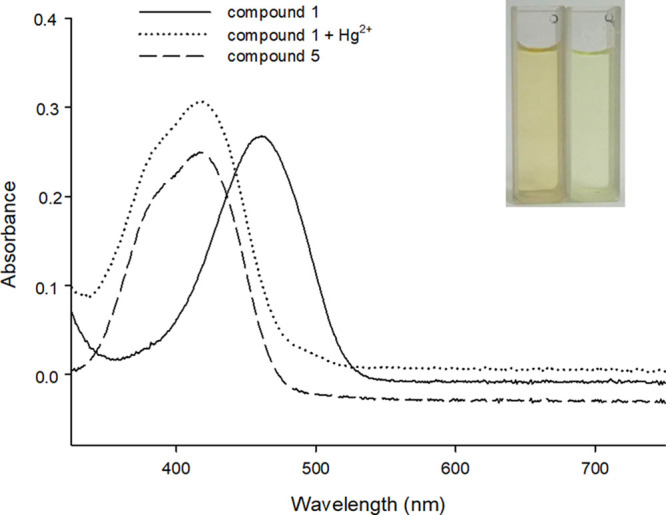
Absorption spectra of probe 1 (20 μM), the reaction products of probe 1 (20 μM) with Hg2+ (50 μM), and compound 5 (20 μM). The solid line, dotted line, and medium dashed line represent probe 1 (20 μM), the reaction product of probe 1 (20 μM) with Hg2+ (50 μM), and compound 5 (20 μM), respectively. The inset shows the visual fluorescence color of probe 1 (20 μM) before (left) and after (right) incubation with 50 μM Hg2+ in natural light.
Figure 7.

(A–C) HPLC of (A) probe 1 (50 μM), (B) reaction mixture of probe 1 (50 μM) with Hg2+ (1 mM), and (C) compound 5 (50 μM). HPLC conditions: total flow rate, 1.0 mL/min; Agela Technologies Venusil XBP C18: 5 μm, 4.6 × 250 mm; methanol/water = 70:30 (v/v); and detection wavelength at 440 nm.
Cytotoxicity Assays and Confocal Imaging in Living Cells
To investigate the potential application in practical biological samples, the cytotoxicity of the probe and compound 5 was determined by the 3-(4,5-dimethyl-2-thiazolyl)-2,5-diphenyl-2H-tetrazolium bromide (MTT) assay. As shown in Figure 8, the survival rate of PC-12 cells was more than 90% when different concentrations (0, 2, 4, 8, and 16 μM) of probe 1 and compound 5 were added. These results indicate that probe 1 and compound 5 are noncytotoxic and can be applied for living cell image.
Figure 8.

(A, B) MTT assay of PC-12 cells in the presence of different concentrations of (A) probe 1 and (B) compound 5 (0, 2, 4, 8, and 16 μM) for 24 h at 37 °C.
To prove that the probe can be utilized to sense mercury ions in living cells, we carried out the experiment of laser confocal fluorescence imaging in PC-12 cells (Figure 9). In the control experiment, PC-12 cells were cultured in the medium including fluorescent probe 1 (5.0 μM) for 30 min, and as indicated in Figure 9b, it shows weak fluorescence. In the experimental group, after addition of the mercury ion (10 μM) to the PC-12 cells pretreated with probe 1, a strong green fluorescence could be detected (Figure 9d). The above results show that probe 1 can emit strong fluorescence in the complex environment of exogenous mercury ions and realize the fluorescence imaging of mercury ions in living cells.
Figure 9.

Images of PC-12 cells treated with the presented probe 1. (a) Bright-field transmission image of PC-12 cells incubated with 5.0 μM probe 1 for 30 min at 37 °C. (b) Fluorescence image of the cells shown in panel (a). (c) Bright-field transmission image of PC-12 cells incubated with 5.0 μM probe 1 for 30 min and then treated with 10 μM Hg2+ for another 30 min. (d) Fluorescence image of cells shown in panel (c).
Conclusions
In summary, a new turn-on Hg2+ fluorescent probe was designed and synthesized with a 1,8-naphthalimide group. A 1,2-dithioalkyl group was chosen as a recognition group. Without Hg2+, the probe exhibited weak fluorescence. With Hg2+, the probe reacted specifically with the mercury ion to produce an aldehyde and showed strong green fluorescence. The probe can work in a wide pH range with high selectivity and specificity for Hg2+. Meanwhile, the probe showed excellent biocompatibility and had been successfully used to the confocal imaging of Hg2+ in PC-12 cells.
Experimental Section
Materials and Instruments
4-Bromo-1,8-naphthalic anhydride, trifluoroacetic acid, and 1,2-ethanedithiol were bought from Heowns Biochemical Technology Company. Anhydrous potassium carbonate was purchased from Tianjin Ruijinte Chemical Company. HI (55%) was provided by Energy Chemical (Shanghai, China). Urotropine was bought from Tianjin Sailboat Chemical Reagent Technology Company. The reagents needed for high-performance liquid chromatography experiments were all chromatographically pure, which were bought from Tianjin Siyou Fine Chemical Company. All of chemicals used in synthesis were analytical reagent grade and used as obtained unless otherwise indicated. Ultrapure water has been utilized throughout, and water was purified using the distilling instrument of an SZ-93 automatic double pure water distiller from Shanghai Yarong Biochemical Instrument Factory. Silica gel 60 F254 was used in TLC analysis, and silica gel (200–300 mesh) was applied in column chromatography. Both of them were bought from Qingdao Ocean Chemicals (Qingdao, China).
1H NMR and 13C NMR spectra were collected by employing a Bruker DRX-500 NMR spectrometer using tetramethylsilane (TMS) as the internal standard. Mass spectra were obtained using an Agilent 6420 Triple Quadrupole LC–MS high-resolution mass spectrometer. The fluorescence spectra were measured using a Hitachi F-7000 fluorescence spectrophotometer with a 1 cm quartz cell (Tokyo, Japan). UV–vis absorption spectra were determined using an Evolution 260 Bio UV–vis spectrophotometer with a 1 cm quartz cell. High-performance liquid chromatograms were recorded using a Waters 1525 HPLC with an XBP C18 column (5.0 μm, 4.6 × 250 mm). The pH values were measured using a pH meter from the Mettler Toledo Company. Fluorescence imaging of living cells was performed using an FV1200 single-photon laser confocal microscope from Olympus Company. A PBS (0.01 M, pH 7.40) buffer solution with EtOH as the cosolvent (EtOH/H2O = 2:8, v/v) was applied for all spectroscopic measurements. The fluorescence spectrum was acquired under the condition of the excitation wavelength at 414 nm and the range of the emission wavelength from 424 to 650 nm. The values of the excitation and emission slits were both 5.0 nm. Data processing was performed by using SigmaPlot software. Furthermore, except for the fluorescence data acquired by time scanning, all other data were obtained at 10 min after adding the mercury ion at 25 °C.
Syntheses
The synthesis pathway of fluorescence probe 1 is depicted in Scheme 1.
Synthesis of Compound 2
Compound 2 was prepared based on the previous paper.57,58 4-Bromo-1,8-naphthalic anhydride (0.70 g, 2.5 mmol) and N-butylamine (0.37 g, 5 mmol) were added in 25 mL of pure ethanol and heated to reflux for 6 h. Then, the reaction solution was cooled down to 25 °C. The solvent was removed via vacuum, and the crude product underwent silica gel column chromatography for purification utilizing petroleum ether/ethyl acetate = 8:1 (v/v). Compound 2 was found to be a light yellow solid (0.68 g, 82%). 1H NMR (500 MHz, CDCl3) δ (ppm): 8.64 (1H, d, J = 7.3 Hz), 8.55 (1H, d, J = 8.5 Hz), 8.40 (1H, d, J = 7.9 Hz), 8.02 (1H, d, J = 7.9 Hz), 7.82 (1H, t, J = 7.9 Hz), 4.16 (2H, t, J = 7.5 Hz), 1.73–1.67 (2H, m), 1.47–1.41 (2H, m), 0.96 (3H, t, J = 7.4 Hz) (Figure S2, Supporting Information). MS (ESI) m/z: [M + 1]+ 332.0287, [M + 2]+ 334.0262 (Figure S3, Supporting Information).
Synthesis of Compound 3
Compound 3 was synthesized in a previous paper.57 Compound 2 (0.66 g, 2 mmol) and anhydrous potassium carbonate (1.40 g, 10 mmol) were added to 20 mL of CH3OH, stirred, and heated to reflux for 14 h. Then, the solvent was removed and subjected to silica gel column chromatography with petroleum ether/ethyl acetate = 6:1 (v/v) as the eluent to obtain 3 as a gray solid (0.45 g, 79%). 1H NMR (500 MHz, CDCl3) δ (ppm): 8.58–8.52 (3H, m), 7.69–7.65 (1H, m), 7.01 (1H, d, J = 8.3 Hz), 4.14 (2H, d, J = 7.5 Hz), 4.10 (3H, s), 1.72–1.66 (2H, m), 1.42 (2H, q, J = 7.5 Hz), 0.95 (3H, t, J = 7.4 Hz) (Figure S4, Supporting Information). MS (ESI) m/z: [M + H]+ 284.1284 (Figure S5, Supporting Information).
Synthesis of Compound 4
Compound 4 was obtained referring to the report.57 Compound 3 (0.43 g, 1.5 mmol) was added to 30 mL of HI (57%), stirred, and heated to reflux for 8 h. The mixed solution was cooled to 25 °C and adjusted the pH value to neutral to obtain a precipitate. The precipitate was filtered, washed, and dried. Then, the solvent was removed under negative pressure and the resultant crude material underwent silica gel column chromatography for purification utilizing petroleum ether/ethyl acetate = 3:1 (v/v) to obtain compound 4 as a yellow solid (0.31 g, 77%). 1H NMR (500 MHz, DMSO-d6) δ (ppm): 11.86 (1H, s), 8.53–8.45 (2H, m), 8.34 (1H, d, J = 8.2 Hz), 7.75 (1H, t, J = 7.6 Hz), 7.14 (1H, d, J = 8.2 Hz), 4.00 (2H, t, J = 7.5 Hz), 1.61–1.55 (2H, m), 1.32 (2H, q, J = 7.5 Hz), 0.91 (3H, t, J = 7.5 Hz) (Figure S6, Supporting Information). MS (ESI) m/z: [M – H]− 268.0976 (Figure S7, Supporting Information).
Synthesis of Compound 5
Compound 5 was prepared from the methods of a reported paper.57 A mixture of compound 4 (0.27 g, 1 mmol) and urotropine (0.28 g, 1 mmol) in trifluoroacetic (10 mL) was heated to reflux for 21 h. Then, the mixed solution was cooled to 25 °C, neutralized with sodium bicarbonate, and then extracted by dichloromethane. The organic layer was purified with water, dried over anhydrous Na2SO4, filtered, and concentrated. The crude product underwent silica gel column chromatography for purification utilizing dichloromethane/methanol = 50:1, v/v to obtain compound 5 as a brown-yellow solid (0.21 g, 70%). 1H NMR (500 MHz, CDCl3) δ (ppm): 13.16 (1H, s), 10.10 (1H, s), 8.72–8.70 (3H, m), 7.79 (1H, t, J = 7.5 Hz), 4.15 (2H, t, J = 7.4 Hz), 1.70 (2H, q, J = 7.4 Hz), 1.43 (2H, q, J = 7.5 Hz), 0.96 (3H, t, J = 7.4 Hz) (Figure S8, Supporting Information). MS (ESI) m/z: [M – 1]− 296.0927 (Figure S9, Supporting Information).
Synthesis of Probe 1
The p-toluene sulfonic acid monohydrate (0.50 g, 1 mmol) and compound 5 (0.15 g, 0.5 mmol) were dissolved in 10 mL of pure ethanol, and 1,2-ethanedithiol (0.05 g, 0.55 mmol) was added dropwise. The mixed solution was heated to reflux for 24 h. The solvent was then removed under negative pressure. The crude product underwent silica gel column chromatography for purification utilizing petroleum ether/ethyl acetate = 5:2 (v/v) as the eluent to obtain an orange solid probe 1 (0.15 g, 79%). 1H NMR (500 MHz, DMSO-d6) δ (ppm): 11.49 (s, 1H), 8.76 (1H, s), 8.66 (1H, d, J = 8.5 Hz), 8.45 (1H, d, J = 7.3 Hz), 7.80 (1H, t, J = 7.8 Hz), 6.33 (1H, s), 4.01 (2H, t, J = 7.3 Hz), 3.59–3.54 (2H, m), 3.46–3.40 (2H, m), 1.62–1.56 (2H, m), 1.37–1.29 (2H, m), 0.91 (3H, t, J = 7.3 Hz) (Figure S10, Supporting Information). 13C NMR (125 MHz, DMSO-d6) δ (ppm): 163.6, 162.8, 156.1, 132.7, 130.9, 129.1, 128.3, 126.2, 123.6, 122.9, 122.1, 113.7, 48.3, 39.8, 39.2, 29.7, 19.8, 13.7 (Figure S11, Supporting Information). MS (ESI) m/z: [M + H]+ 374.0000, [M + Na]+ 396.0000 (Figure S12, Supporting Information).
Cytotoxicity Assay
The tetrazolium-based colorimetric assay (MTT assay) was applied to evaluate the cytotoxicity of the probe. First, PC-12 cells were grown in an incubator containing 5% CO2 at 37 °C with the Dulbecco’s modified Eagle’s medium (DMEM). Approximately 1 × 10⁴ cells were placed in each well of 96-well plates for 24 h. After the loading media was removed, different concentrations of probe 1 (0, 2, 4, 8, and 16 μM) and compound 5 (0, 2, 4, 8, and 16 μM) were added, respectively. The cells were cultured at 37 °C in an atmosphere of 5% CO2 for 3 h. Then, the drug-containing medium was removed and the cells were fed with the new culture medium for 24 h. Whereafter, 10 μL of MTT (5 mg·mL–1) was introduced and cultured for another 4 h. Finally, 150 μL of dimethyl sulfoxide (DMSO) was added to dissolve the formazan crystals and the 96-well plate was placed on a shaker for 10 min. The absorbance was recorded at 490 nm using a microplate reader (Synergy 2, BioTek Instruments Inc.), and A/A0 × 100% was used to calculate the survival rate (A and A0 stand respectively for the absorbance of the experimental group and control group).
Confocal Imaging in Living Cells
One day before imaging, PC-12 cells were seeded in 20 mm laser confocal dishes for about 24 h to assure that they were well cultured and fully adherent. PC-12 cells were treated with a medium including fluorescent probe 1 (5.0 μM) alone for 30 min; after which, the cells were cleaned with Dulbecco’s phosphate-buffered saline (DPBS) three times and imaged. In a control experiment, PC-12 cells were treated with a medium including fluorescent probe 1 (5.0 μM) for 30 min, cleaned three times with DPBS buffer to eliminate spare extracellular probe 1, and then cultured with Hg2+ (10 μM) for 30 min. Finally, PC-12 cells were cleaned with DPBS three times and imaged again. Confocal fluorescence images were recorded on an Olympus FV1200MPE single-photon confocal microscope with a 60× objective lens.
Acknowledgments
This work was supported by National Natural Science Foundation of China (grant no. 21807027), the Natural Science Foundation of Henan Educational Committee (17A510004), Henan Science and Technology projects (18210221011), the Zhongjing Scholars Research Funding of Henan University of Chinese Medicine, and Graduate Innovation Fund in Henan College of Chinese Medicine (2019KYCX031).
Supporting Information Available
The Supporting Information is available free of charge at https://pubs.acs.org/doi/10.1021/acsomega.0c01790.
1H NMR and 13C NMR spectra of compounds 1–5 and the ESI-MS spectrum of the reaction mixture of probe 1 with Hg2+ for 10 min (PDF)
Author Present Address
○ Henan Research Center for Special Processing Technology of Traditional Chinese Medicine, Zhengzhou 450046, PR China.
The authors declare no competing financial interest.
Supplementary Material
References
- Xu Z.; Han S. J.; Lee C.; Yoon J.; Spring D. R. Development of off-on fluorescent probes for heavy and transition metal ions. Chem. Commun. 2010, 46, 1679–1681. 10.1039/b924503k. [DOI] [PubMed] [Google Scholar]
- Saleem M.; Rafiq M.; Hanif M. Organic material based fluorescent sensor for Hg2+: a brief review on recent development. J. Fluoresc. 2017, 27, 31–58. 10.1007/s10895-016-1933-x. [DOI] [PubMed] [Google Scholar]
- Stacchiotti A.; Morandini F.; Bettoni F.; Schena I.; Lavazza A.; Grigolato P. G.; Apostoli P.; Rezzani R.; Aleo M. F. Stress proteins and oxidative damage in a renal derived cell line exposed to inorganic mercury and lead. Toxicology 2009, 264, 215–224. 10.1016/j.tox.2009.08.014. [DOI] [PubMed] [Google Scholar]
- Kim B. M.; Choi A. L.; Ha E. H.; Pedersen L.; Nielsen F.; Weihe P.; Hong Y. C.; Budtz-Jørgensen E.; Grandjean P. Effect of hemoglobin adjustment on the precision of mercury concentrations in maternal and cord blood. Environ. Res. 2014, 132, 407–412. 10.1016/j.envres.2014.04.030. [DOI] [PMC free article] [PubMed] [Google Scholar]
- Azevedo B. F.; Furieri L. B.; Peçanha F. M.; Wiggers G. A.; Vassallo P. F.; Simões M. R.; Fiorim J.; de Batista P. R.; Fioresi M.; Rossoni L.; Stefanon I.; Alonso M. J.; Salaices M.; Vassallo D. V. Toxic effects of mercury on the cardiovascular and central nervous systems. J. Biomed. Biotechnol. 2012, 949048. 10.1155/2012/949048. [DOI] [PMC free article] [PubMed] [Google Scholar]
- Rice K. M.; Walker E. M. Jr.; Wu M.; Gillette C.; Blough E. R. Environmental mercury and its toxic effects. J. Prev. Med. Public Health 2014, 47, 74–83. 10.3961/jpmph.2014.47.2.74. [DOI] [PMC free article] [PubMed] [Google Scholar]
- Hui L. L.; Chan M. H. M.; Lam H. S.; Chan P. H. Y.; Kwok K. M.; Chan I. H. S.; Li A. M.; Fok T. F. Impact of fetal and childhood mercury exposure on immune status in children. Environ. Res. 2016, 144, 66–72. 10.1016/j.envres.2015.11.005. [DOI] [PubMed] [Google Scholar]
- Vallant B.; Kadnar R.; Goessler W. Development of a new HPLC method for the determination of inorganic and methylmercury in biological samples with ICP-MS detection. J. Anal. At. Spectrom. 2007, 22, 322–325. 10.1039/b615463h. [DOI] [Google Scholar]
- Li Y.; Chen C.; Li B.; Sun J.; Wang J.; Gao Y.; Zhao Y.; Chai Z. Elimination efficiency of different reagents for the memory effect of mercury using ICP-MS. J. Anal. At. Spectrom. 2006, 21, 94–96. 10.1039/B511367A. [DOI] [Google Scholar]
- Tseng C. M.; de Diego A.; Martin F. M.; Amouroux D.; Donard O. F. X. Rapid determination of inorganic mercury and methylmercury in biological reference materials by hydride generation, cryofocusing, atomic absorption spectrometry after open focused microwave-assisted alkaline digestion. J. Anal. At. Spectrom. 1997, 12, 743–750. 10.1039/a700956i. [DOI] [Google Scholar]
- Anthemidis A. N.; Zachariadis G. A.; Michos C. E.; Stratis J. A. Time-based on-line preconcentration cold vapour generation procedure for ultra-trace mercury determination with inductively coupled plasma atomic emission spectrometry. Anal. Bioanal. Chem. 2004, 379, 764–769. 10.1007/s00216-004-2593-2. [DOI] [PubMed] [Google Scholar]
- Chen Y. W.; Tong J.; D’Ulivo A.; Belzile N. Determination of mercury by continuous flow cold vapor atomic fluorescence spectrometry using micromolar concentration of sodium tetrahydroborate as reductant solution. Analyst 2002, 127, 1541–1546. 10.1039/B207896A. [DOI] [PubMed] [Google Scholar]
- Kang Y.; Wu T.; Liu B.; Wang X.; Du Y. Selective determination of mercury (II) by self-referenced surface-enhanced Raman scattering using dialkyne-modified silver nanoparticles. Microchim. Acta 2014, 181, 1333–1339. 10.1007/s00604-014-1259-9. [DOI] [Google Scholar]
- Tan J.; Yan X. P. 2,1,3-Benzoxadiazole-based selective chromogenic chemosensor for rapid naked-eye detection of Hg2+ and Cu2+. Talanta 2008, 76, 9–14. 10.1016/j.talanta.2008.01.056. [DOI] [PubMed] [Google Scholar]
- Pérez-Marín L.; Otazo-Sánchez E.; Macedo-Miranda G.; Avila-Pérez P.; Alonso Chamaro J.; López-Valdivia H. Mercury(II) ion-selective electrode. Study of 1,3-diphenylthiourea as ionophore. Analyst 2000, 125, 1787–1790. 10.1039/b003502p. [DOI] [PubMed] [Google Scholar]
- Yantasee W.; Lin Y.; Zemanian T. S.; Fryxell G. E. Voltammetric detection of lead(II) and mercury(II) using a carbon paste electrode modified with thiol self-assembled monolayer on mesoporous silica (SAMMS). Analyst 2003, 128, 467–472. 10.1039/b300467h. [DOI] [PubMed] [Google Scholar]
- Caballero A.; Lloveras V.; Curiel D.; Tárrage A.; Espinosa A.; Garcia R.; Vidal-Gancedo J.; Rovira C.; Wurst K.; Molina P.; Veciana J. Electroactive thiazole derivatives capped with ferrocenyl units showing charge-transfer transition and selective ion-sensing properties: a combined experimental and theoretical study. Inorg. Chem. 2007, 46, 825–838. 10.1021/ic061803b. [DOI] [PubMed] [Google Scholar]
- McClure D. S. Spin-orbit interaction in aromatic molecules. J. Chem. Phys. 1952, 20, 682–686. 10.1063/1.1700516. [DOI] [Google Scholar]
- Dong M.; Tang J.; Lv Y.; Liu Y.; Wang J.; Wang T.; Bian J.; Li C. A dual-function fluorescent probe for Hg (II) and Cu (II) ions with two mutually independent sensing pathways and its logic gate behavior. Spectrochim. Acta, Part A 2020, 226, 117645. 10.1016/j.saa.2019.117645. [DOI] [PubMed] [Google Scholar]
- Gharami S.; Aich K.; Ghosh P.; Patra L.; Murmu N.; Mondal T. K. A fluorescent ″ON-OFF-ON″ switch for the selective and sequential detection of Hg2+ and I–with applications in imaging using human AGS gastric cancer cells. Dalton Trans. 2020, 49, 187–195. 10.1039/C9DT04245H. [DOI] [PubMed] [Google Scholar]
- Lee S. W.; Lee S. Y.; Lee S. H. Self-assembly of pyrene boronic acid-based chemodosimeters for highly efficient mercury(II) ion detection. Tetrahedron Lett. 2019, 60, 151048. 10.1016/j.tetlet.2019.151048. [DOI] [Google Scholar]
- Wang Y.; Hou X.; Li Z.; Liu C.; Hu S.; Li C.; Xu Z.; Wang Y. A novel hemicyanine-based near-infrared fluorescent probe for Hg2+ions detection and its application in living cells imaging. Dyes Pigm. 2020, 173, 107951. 10.1016/j.dyepig.2019.107951. [DOI] [Google Scholar]
- Bu F.; Zhao B.; Kan W.; Ding L.; Liu T.; Wang L.; Song B.; Wang W.; Deng Q. An ESIPT characteristic ″turn-on″ fluorescence sensor for Hg2+ with large Stokes shift and sequential ″turn-off″ detection of S2– as well as the application in living cells. Spectrochim. Acta, Part A 2020, 387, 112165. 10.1016/j.jphotochem.2019.112165. [DOI] [Google Scholar]
- Zhao H.; Ding H.; Kang H.; Fan C.; Liu G.; Pu S. A solvent-dependent chemosensor for fluorimetric detection of Hg2+ and colorimetric detection of Cu2+ based on a new diarylethene with a rhodamine B unit. RSC Adv. 2019, 9, 42155–42162. 10.1039/C9RA08557B. [DOI] [PMC free article] [PubMed] [Google Scholar]
- Huang Y.; Li C.-F.; Shi W.-J.; Tan H.-Y.; He Z.-Z.; Zheng L.; Liu F.; Yan J.-W. A near-infrared BODIPY-based fluorescent probe for ratiometric and discriminative detection of Hg2+ and Cu2+ ions in living cells. Talanta 2019, 198, 390–397. 10.1016/j.talanta.2019.02.012. [DOI] [PubMed] [Google Scholar]
- Fan Y.; Wang S.; Zhang F. Optical multiplexed bioassays for improved biomedical diagnostics. Angew. Chem., Int. Ed. 2019, 58, 13208–13219. 10.1002/anie.201901964. [DOI] [PubMed] [Google Scholar]
- Li S.; Huang D.; Wan J.; Yan S.; Jiang J.; Xiao H. A two-photon fluorescent probe derived from spirobifluorene for fast sensing of hypochlorite and mercury ions. Sens. Actuators B 2018, 275, 101–109. 10.1016/j.snb.2018.08.035. [DOI] [Google Scholar]
- Li D.; Li C. Y.; Li Y. F.; Li Z.; Xu F. Rhodamine-based chemodosimeter for fluorescent determination of Hg2+ in 100% aqueous solution and in living cells. Anal. Chim. Acta 2016, 934, 218–225. 10.1016/j.aca.2016.05.050. [DOI] [PubMed] [Google Scholar]
- Duke R. M.; Veale E. B.; Pfeffer F. M.; Kruger P. E.; Gunnlaugsson T. Colorimetric and fluorescent anion sensors: an overview of recent developments in the use of 1,8-naphthalimide-based chemosensors. Chem. Soc. Rev. 2010, 39, 3936–3953. 10.1039/b910560n. [DOI] [PubMed] [Google Scholar]
- Gopikrishna P.; Meher N.; Iyer P. K. Functional 1,8-naphthalimide AIE/AIEEgens: recent advances and prospects. ACS Appl. Mater. Interfaces 2018, 10, 12081–12111. 10.1021/acsami.7b14473. [DOI] [PubMed] [Google Scholar]
- Panchenko P. A.; Fedorova O. A.; Fedorov Y. V. Fluorescent and colorimetric chemosensors for cations based on 1,8-naphthalimide derivatives: design principles and optical signalling mechanisms. Russ. Chem. Rev. 2014, 83, 155–182. 10.1070/RC2014v083n02ABEH004380. [DOI] [Google Scholar]
- Muzey B.; Naseem A. An AIEE active 1, 8-naphthalimide- sulfamethizole probe for ratiometric fluorescent detection of Hg2+ ions in aqueous media. J. Photochem. Photobiol., A 2020, 391, 112354. 10.1016/j.jphotochem.2020.112354. [DOI] [Google Scholar]
- Shinohara Y.; Tsukamoto K.; Maeda H. A fluorescent turn-on probe for Hg2+ with a high contrast designed by manipulating functional groups tethered to naphthalimide. J. Photochem. Photobiol., A 2019, 371, 407–413. 10.1016/j.jphotochem.2018.11.034. [DOI] [Google Scholar]
- Chen L.; Park S. J.; Wu D.; Kim H. M.; Yoon J. A two-photon fluorescent probe for colorimetric and ratiometric monitoring of mercury in live cells and tissues. Chem. Commun. 2019, 55, 1766–1769. 10.1039/C8CC08608G. [DOI] [PubMed] [Google Scholar]
- Dong J.; Hu J.; Baigude H.; Zhang H. A novel ferrocenyl-naphthalimide as a multichannel probe for the detection of Cu(II) and Hg(II) in aqueous media and living cells. Dalton Trans. 2018, 47, 314–322. 10.1039/C7DT03982D. [DOI] [PubMed] [Google Scholar]
- Ye F.; Liang X. M.; Xu K. X.; Pang X. X.; Chai Q.; Fu Y. A novel dithiourea-appended naphthalimide ″on-off″ fluorescent probe for detecting Hg2+ and Ag+ and its application in cell imaging. Talanta 2019, 200, 494–502. 10.1016/j.talanta.2019.03.076. [DOI] [PubMed] [Google Scholar]
- Wu X. F.; Ma Q. J.; Wei X. J.; Hou Y. M.; Zhu X. A selective fluorescent sensor for Hg2+ based on covalently immobilized naphthalimide derivative. Sens. Actuators, B 2013, 183, 565–573. 10.1016/j.snb.2013.04.024. [DOI] [Google Scholar]
- Liu D.; Zhang T.; Zhang M.; Shi J.; Yin L.; Shang Z.; Zhu H.; Yang G.; He H. Water-soluble fluorescent sensor for Zn2+ with high selectivity and sensitivity imaging in living cells. Bioorg. Med. Chem. Lett. 2020, 30, 127073. 10.1016/j.bmcl.2020.127073. [DOI] [PubMed] [Google Scholar]
- Liu Y.-L.; Yang L.; Li P.; Li S.-J.; Li L.; Pang X.-X.; Ye F.; Fu Y. A novel colorimetric and ″turn-off″ fluorescent probe based on catalyzed hydrolysis reaction for detection of Cu2+ in real water and in living cells. Spectrochim. Acta, Part A 2020, 227, 117540. 10.1016/j.saa.2019.117540. [DOI] [PubMed] [Google Scholar]
- Wu H.; Jia J.; Xu Y.; Qian X.; Zhu W. A reusable bifunctional fluorescent sensor for the detection and removal of silver ions in aqueous solutions. Sens. Actuators, B 2018, 265, 59–66. 10.1016/j.snb.2018.01.241. [DOI] [Google Scholar]
- Zhang Y.; Chen X.; Liu J.; Gao G.; Zhang X.; Hou S.; Wang H. A highly selective and sensitive fluorescent chemosensor for distinguishing cadmium(II) from zinc(II) based on amide tautomerization. New J. Chem. 2018, 42, 19245–19251. 10.1039/C8NJ03465F. [DOI] [Google Scholar]
- Zhou L.; Hu S.; Wang H.; Sun H.; Zhang X. A novel ratiometric two-photon fluorescent probe for imaging of Pd2+ ions in living cells and tissues. Spectrochim. Acta, Part A 2016, 166, 25–30. 10.1016/j.saa.2016.05.013. [DOI] [PubMed] [Google Scholar]
- Li Z.; Chen W.; Dong L.; Song Y.; Li R.; Li Q.; Qu D.; Zhang H.; Yang Q.; Li Y. A novel ratiometric and reversible fluorescent probe based on naphthalimide for the detection of Al3+ and pH with excellent selectivity. New J. Chem. 2020, 44, 3261–3267. 10.1039/C9NJ06309A. [DOI] [Google Scholar]
- Adhikari S.; Ta S.; Ghosh A.; Guria S.; Pal A.; Ahir M.; Adhikary A.; Hira S. K.; Manna P. P.; Das D. A 1,8 naphthalimide anchor rhodamine B based FRET probe for ratiometric detection of Cr3+ ion in living cells. J. Photochem. Photobiol., A 2019, 372, 49–58. 10.1016/j.jphotochem.2018.12.010. [DOI] [Google Scholar]
- Zhang J.; Jin Z.; Hu X.-X.; Meng H.-M.; Li J.; Zhang X.-B.; Liu H.-W.; Deng T.; Yao S.; Feng L. Efficient two-photon fluorescent probe for glutathione S-transferase detection and imaging in drug-induced liver injury sample. Anal. Chem. 2017, 89, 8097–8103. 10.1021/acs.analchem.7b01659. [DOI] [PubMed] [Google Scholar]
- Xu S.; Liu H.-W.; Hu X.-X.; Huan S.-Y.; Zhang J.; Liu Y.-C.; Yuan L.; Qu F.-L.; Zhang X.-B.; Tan W. Visualization of endoplasmic reticulum aminopeptidase 1 under different redox conditions with a two-photon fluorescent probe. Anal. Chem. 2017, 89, 7641–7648. 10.1021/acs.analchem.7b01561. [DOI] [PubMed] [Google Scholar]
- Lu F.; Yamamura M.; Nabeshima T. A highly selective and sensitive ratiometric chemodosimeter for Hg2+ ions based on an iridium (III) complex via thioacetal deprotection reaction. Dalton Trans. 2013, 42, 12093–12100. 10.1039/c3dt50807b. [DOI] [PubMed] [Google Scholar]
- Wang C.; Wang L.; Fang S.; Qin D.; Zhou J.; Yang G.; Jin S.; Duan H. Two novel fluorescent probes based on phenothiazine: synthesis and ″naked-eye″ colorimetric recognition of Hg2+. Res. Chem. Intermed. 2019, 45, 2045–2063. 10.1007/s11164-018-03715-x. [DOI] [Google Scholar]
- Huang L.; Yang Z.; Zhou Z.; Li Y.; Tang S.; Xiao W.; Hu M.; Peng C.; Chen Y.; Gu B.; Li H. A dual colorimetric and near-infrared fluorescent turn-on probe for Hg2+ detection and its applications. Dyes Pigm. 2019, 163, 118–125. 10.1016/j.dyepig.2018.11.047. [DOI] [Google Scholar]
- Zhao X.; Wang C.; Yuan G.; Ding H.; Zhou L.; Liu X.; Lin Q. A dual-site modulated FRET-based two-photon ratiometric fluorescent probe for tracking lysosomal pH changes in living cells, tissues and zebrafish. Sens. Actuators, B 2019, 290, 79–86. 10.1016/j.snb.2019.03.122. [DOI] [Google Scholar]
- Xie J. Y.; Li C. Y.; Li Y. F.; Fu Y. J.; Nie S. X.; Tan H. Y. A near-infrared chemosensor for determination of trivalent aluminum ions in living cells and tissues. Dyes Pigm. 2017, 136, 817–824. 10.1016/j.dyepig.2016.09.046. [DOI] [Google Scholar]
- Wang Y.; Ding H.; Zhu Z.; Fan C.; Tu Y.; Liu G.; Pu S. Selective rhodamine-based probe for detecting Hg2+ and its application as test strips and cell staining. J. Photochem. Photobiol., A 2020, 390, 112302. 10.1016/j.jphotochem.2019.112302. [DOI] [Google Scholar]
- Liu D.; Zhu H.; Shi J.; Deng X.; Zhang T.; Zhao Y.; Qi P.; Yang G.; He H. A 1,8-naphthalimide-based fluorescent sensor with high selectivity and sensitivity for Hg2+ in aqueous solution and living cells. Anal. Methods 2019, 11, 3150–3154. 10.1039/C9AY00711C. [DOI] [Google Scholar]
- Wang Y.; Ding H.; Wang S.; Fan C.; Tu Y.; Liu G.; Pu S. A ratiometric and colorimetric probe for detecting Hg2+ based on naphthalimide-rhodamine and its staining function in cell imaging. RSC Adv. 2019, 9, 11664–11669. 10.1039/C9RA01459D. [DOI] [PMC free article] [PubMed] [Google Scholar]
- Xu J.; Li H.; Chen Y.; Yang B.; Jiao Q.; Yang Y.; Zhu H.-L. A novel fluorescent probe for Hg2+ detection in a wide pH range and its application in living cell imaging. Anal. Methods 2018, 10, 5554–5558. 10.1039/C8AY01887A. [DOI] [Google Scholar]
- Prabhu J.; Velmurugan K.; Nandhakumar R. A highly selective and sensitive naphthalene-based chemodosimeter for Hg2+ ions. J. Lumin 2014, 145, 733–736. 10.1016/j.jlumin.2013.08.056. [DOI] [Google Scholar]
- Guo B.; Nie H.; Yang W.; Tian Y.; Jing J.; Zhang X. A highly sensitive and rapidly responding fluorescent probe with a large Stokes shift for imaging intracellular hypochlorite. Sens. Actuators, B 2016, 236, 459–465. 10.1016/j.snb.2016.06.004. [DOI] [Google Scholar]
- Long L.; Han Y.; Yuan X.; Cao S.; Liu W.; Chen Q.; Wang K.; Han Z. A novel ratiometric near-infrared fluorescent probe for monitoring cyanide in food samples. Food Chem. 2020, 331, 127359. 10.1016/j.foodchem.2020.127359. [DOI] [PubMed] [Google Scholar]
Associated Data
This section collects any data citations, data availability statements, or supplementary materials included in this article.