

Abstract
Glucagon-like peptide-1 (GLP-1) is an incretin hormone with a number of functions to maintain energy homeostasis and contribute to motivated behavior, both peripherally and within the central nervous system (CNS). These functions, which include insulin secretion, gastric emptying, satiety, and the hedonic aspects of food and drug intake, are primarily mediated through stimulation of the GLP-1 receptor. While this receptor plays an important role in a variety of physiological outcomes, data regarding its CNS expression has been primarily limited to regional receptor binding and single-label transcript expression studies. We thus developed a bacterial artificial chromosome transgenic mouse, in which expression of a red fluorescent protein (mApple) is driven by the GLP-1R promoter. Using this reporter mouse, we characterized the regional and cellular expression patterns of GLP-1R expressing cells in the CNS, using double-label immunohistochemistry and in situ hybridization. GLP-1R-expressing cells were enriched in several key brain regions and circuits, including the lateral septum, hypothalamus, amygdala, bed nucleus of the stria terminalis, hippocampus, ventral midbrain, periaqueductal gray and cerebral cortex. In most regions, GLP-1R primarily colocalized with GABAergic neurons, except within some regions such as the hippocampus, where it was co-expressed in glutamatergic neurons. GLP-1R-mApple cells were highly co-expressed with 5-HT3 receptor-containing neurons within the cortex and striatum, as well as with dopamine receptor- and calbindin-expressing cells within the lateral septum, the brain region in which GLP-1R is most highly expressed. In this manuscript, we provide detailed images of GLP-1R-mApple expression and distribution within the brain and characterization of these neurons.
Keywords: GLP-1, GLP-1R, incretin, striatum, hypothalamus, lateral septum, transgenic, RRID:AB_10000347, RRID:AB_10000320, RRID:AB_10617228, RRID:AB_2079751, RRID:AB_2811192, RRID:AB_2088494, RRID:AB_10013483, RRID:AB_2534023, RRID:AB_2278725, RRID:AB_11212597, RRID:AB_2298772, RRID:AB_477329, RRID:AB_2255365, RRID:AB_477560, RRID:AB_11211549
Graphical Abstract
We developed a BAC transgenic mouse model of the glucagon-like peptide-1 receptor (GLP1R) whereby expression of a red fluorescent protein (mApple) was driven by the GLP-1R promoter. We further characterized the expression patterns and cellular specificity of these neurons in order to better understand the functional roles of GLP-1R.
Introduction
The glucagon-like peptide-1 (GLP-1) is an incretin hormone and neuropeptide that plays a role in energy homeostasis and feeding behavior through stimulation of high affinity GLP-1 receptors (GLP-1Rs). It is through the activation of this receptor that GLP-1 mediates a host of physiological outcomes. Following food intake, GLP-1 is released from the L-cells of the intestine as well as the nucleus of the solitary tract (NTS) of the brain (Drucker, 2006; Hayes et al., 2010), where it migrates and activates GLP-1Rs in the various regions, such as the β-cells of the pancreas, the heart, and the brain before it is rapidly degraded. Along with the gastric inhibitory peptide (GIP), GLP-1 is one of the only incretins in humans, producing what is known as the incretin effect, whereby insulin secretion is enhanced due to gut-derived peptides that are released following oral glucose intake (Kazafeos, 2011; Kreymann et al., 1987). Modifications of the GLP-1 peptide have produced long-lasting GLP-1R agonists, many of which are FDA-approved for the treatment of type 2 diabetes mellitus. Clinical and preclinical data have also noted that these agonists are useful in treating obesity. Furthermore, GLP-1R activation results in decreasing the hedonic properties of food (Dickson et al., 2012; Dossat et al., 2011) and drug (Egecioglu, Engel, et al., 2013a, 2013b; Egecioglu, Steensland, et al., 2013; Graham et al., 2013; Shirazi et al., 2013) reward as well as playing an important role in modulating the stress response (Ghosal et al., 2013; Ghosal et al., 2017; Kinzig et al., 2003; R. Zhang et al., 2010).
Understanding how GLP-1R is expressed and its underlying circuitry is important in characterizing its function. However, GLP-1Rs are G protein-coupled receptors (GPCRs), which are notoriously difficult to label immunohistochemically. Thus far, attempts to develop an antibody have proven futile (Pyke & Knudsen, 2013). Some efforts offer hope (Pyke et al., 2014), although testing thus far has been limited to peripheral tissues, and such antibodies are not yet commercially available. Others have addressed this situation by utilizing receptor binding assays and in situ hybridization (Alvarez et al., 2005; Goke et al., 1995; Merchenthaler et al., 1999). Still others have developed transgenic models using cre recombinase-dependent expression (Cork et al., 2015; Richards et al., 2014). While models such as these are helpful in visualizing GLP-1R expression, dependence upon cre activation can result in confounding results due to lineage tracing. To avoid these issues, we utilized a bacterial artificial chromosome (BAC) transgenic approach, whereby the expression of a red fluorescent protein, mApple, is driven by the GLP-1R promoter, thus allowing the use of mApple as a proxy for GLP-1R expression and allowing full visualization of cell soma, dendrites, and axons of GLP-1R-expressing cells.
Materials and Methods
Creation of GLP-1R BAC transgenic mice and additional experimental animals:
The GLP-1R-mApple BAC transgenic mouse was created via the Vanderbilt Transgenic and Embryonic Stem Cell Core. A BAC clone (bMQ458o12) was used that contained the Glp1r gene (34.6 kb), which was flanked by 6 exons of the Dnahc8 gene (27 kb) and the first two exons of the Umod1 gene (18 kb) at the 5’ and 3’ ends, respectively. This clone was transferred into SW105 cells. A DNA fragment consisting of an mApple fluorescent reporter cassette, itself containing an optimized Kozak translation initiation sequence and β-globin poly-adenylation signal, was linked to an FRT-flanked antibiotic (Kan/Neo) cassette, kindly provided by Dr. Mark Magnuson (Vanderbilt). This mApple cassette-containing DNA fragment with homology arms was inserted via electroporation into the normal ATG start codon of the Glp1r gene within the BAC clone. Colonies that included the correct insertion were resistant to antibiotics. These colonies were selected, and the FRT-flanked cassettes were removed via bacterial FLP recombination. The final BAC vector construction was confirmed by sequencing of all recombination junctions and by pulsed-field and standard fingerprint gels to correspond with predicted restriction digests. Validated vectors were injected into B6D2 embryos via pronuclear DNA microinjection. Embryos were injected into pseudopregnant B6D2 F1 hybrid females (B6D2F1/J; Jackson Laboratories, Bar Harbor, ME). DNA was extracted from tail samples from the offspring, which were genotyped via PCR for the presence of the mApple gene (forward: 5’- CTA CTT CAA GCT GTC CTT CC −3’; reverse: 5’- GAT GGT GTA GTC CTC GTT GT −3’). Dopamine (DA) transporter primers (forward: 5’- CCC GTC TAC CCA TGA GTA AAA −3’; reverse: 5’ – CTC CAC CTT CCT AGC ACT AAC −3’) were run simultaneously as a positive control for successful PCR. Using 1 μM primers (final concentration), samples were incubated at 94°C for 3 min, followed by 30 cycles at 94°C (30 sec), 61°C (45 sec), and 72°C (45 sec). Afterwards, samples were heated to 72°C for 10 min, and then cooled to 4°C. Bands were visualized by gel electrophoresis (DA transporter band at 565 bp and mApple band at 388 bp). GLP-1R-mApple mice were backcrossed for at least 10 generations onto a C57Bl6/J background.
D1-eGFP and D2-eGFP BAC transgenic mice, created by the GENSAT project (S. Gong et al., 2003), were obtained via the MMRRC (UC Davis). These mice, originally on a FVB/N background, were backcrossed onto a C57Bl6/J background for more than 10 generations. The 5-HT3-eGFP mice were provided by the MMRRC and were maintained on a Swiss-Webster background. Genotypes were confirmed by PCR analysis of tail tissue. These BAC transgenic mice were genotyped using the following primer sets against the eGFP gene (forward and reverse, respectively): 5’- CCT ACG GCG TGC AGT GCT TCA GC −3’ and 5’- CGG CGA GCT GCA CGC TGC GTC CTC −3’. Thermocycler and electrophoresis conditions were identical to those used with the GLP-1R-mApple mice, with the eGFP band visible at ~300 bp.
Adult mice were housed 2–5/cage when possible and were provided with rodent chow and tap water ad libitum. Mice were housed in a temperature- and humidity-controlled AAALAC-approved facility that is maintained on a 12:12 h light:dark cycle. The GLP-1R-mApple BAC transgenic mice were produced by breeding hemizygotic and WT mice, with only the hemizygotic mice being used for experimentation. To produce GLP-1R-mApple × D1-, D2-, or 5-HT3-eGFP intercrosses, single hemizygotic mice of each genotype were bred to each other; only mice that were hemizygotic for both mApple and eGFP were used for experimentation. All protocols were approved by the local Institutional Animal Care and Use Committee, and all studies were performed in accordance with the recommendations in the National Institute of Health’s Guide for the Care and Use of Laboratory Animals.
Fluorescent immunohistochemistry:
Adult hemizygotic (P60 or older) mice were anesthetized with sodium pentobarbital and transcardially perfused with 4% paraformaldehyde. Brains were removed and fixed overnight in paraformaldehyde at 4°C. Following cryoprotection in a sucrose gradient (10%, 20%, and 30% in phosphate-buffered saline), brains were cut coronally into 40 μm sections on a freezing microtome and stored at −20°C in freezing solution until further experimentation. Fluorescent immunohistochemistry was performed as previously described (Jacobs et al., 2009). An antibody against rabbit dsRed (Table 1) was used to label mApple+ cells with a Cy3-tagged secondary antibody (Table 2). Red signal was pseudocolored to magenta post hoc, in order to aid in viewing for red-green color-blind readers. To determine cellular identity of GLP-1R-mApple cells, several sections from hemizygotic mice were simultaneously stained with anti-dsRed and one of the antibodies listed in Table 1. An appropriate AlexaFluor 488- or Cy2-tagged secondary antibody (Table 2) was used to visualize the other antibody except in the case of the GAD67 and CamKII antibodies. Here, a biotinylated secondary antibody (1:1000, Jackson ImmunoResearch, West Grove, PA), standard ABC kit (Vector Laboratories, Burlingame, CA), and AlexaFluor 488-TSA Amplification kit (1:100; Invitrogen, Carlsbad, CA) were used to amplify the signal. Images—both representative ones and those used for counting purposes—were captured using a Zeiss AxioImager microscope with Apotome2 and a Zeiss AxioCam 506 mono camera or an LSM 710 META confocal microscope with associated Zen software, or an Olympus laser-scanning FV1000-IX81 confocal microscope and associated Fluoview software. Brain regions were identified using the Paxinos and Franklin atlas (Paxinos & Franklin, 2007).
Table 1:
Primary antibodies used in histological assays
| Antigen (Host) | Immunogen | Manufacturer, Product #, and Research Resource Identifier (RRID) | Concentration |
|---|---|---|---|
| Calbindin (mouse, monoclonal) | Purified from chicken gut | Swant Cat# 300, RRID:AB_10000347 | 1:2000 |
| Calretinin (mouse, monoclonal) | Recombinant human | Swant Cat# 6B3, RRID:AB_10000320 | 1:500 |
| Ca2+/calmodulin-dependent protein kinase II (6G9 clone) (mouse, monoclonal) | Partially purified rat CaMKII, purified from hybridoma tissue culture supernatant | Enzo Life Sciences Cat# ADI-KAM-CA002, RRID:AB_10617228 | 1:2000 |
| Choline acetyltransferase (goat, polyclonal) | Human placental enzyme | Millipore Cat# AB144P, RRID:AB_2079751 | 1:200 |
| Dopamine- and cAMP-regulated neuronal phosphoprotein-32 (total protein; mouse, monoclonal) | BALB/c spleen cells immunized with purified DARPP-32 and fused with SP2/0 Ag14 meyloma cells | Courtesy of Drs. Paul Greengard and Angus Nairn, RRID:AB_2811192 | 1:500 |
| Doublecortin (goat, polyclonal) | Peptide mapping at the C-terminus (amino acids 385–402) of Doublecortin of human origin | Santa Cruz Biotechnology Cat# sc-8066, RRID:AB_2088494 | 1:100 |
| Discosoma sp. red fluorescent protein (DsRed, rabbit, polyclonal) | Variant of Discosoma sp. (DsRed-Express) | Takara Bio Cat# 632496, RRID:AB_10013483 | 1:1000 (1:500 in RNAScope/IHC assay) |
| Enhanced green fluorescent protein (chicken, polyclonal) | Isolated directly from the jellyfish (Aequorea victoria) | Thermo Fisher Scientific Cat# A10262, RRID:AB_2534023 | 1:250 |
| Glutamic acid decarboxylase-67 (1G10.2 clone, mouse, monoclonal) | Recombinant GAD67 protein | Millipore Cat# MAB5406, RRID:AB_2278725 | 1:500 |
| Glial fibrillary acidic protein (GA5 clone, mouse, monoclonal) | Purified GFAP from porcine spinal cord | Millipore Cat# MAB360, RRID:AB_11212597 | 1:300 |
| NeuN (mouse) | Purified cell nuclei from mouse brain | Millipore Cat# MAB377, RRID:AB_2298772 | 1:100 |
| Parvalbumin (mouse, monoclonal) | Frog muscle parvalbumin | Sigma-Aldrich Cat# P3088, RRID:AB_477329 | 1:200 |
| Somatostatin (rat, monoclonal) | Synthetic peptide corresponding to amino acids 1–14 of cyclic SST conjugated to bovine thyroglobulin using carbodiimide | Millipore Cat# MAB354, RRID:AB_2255365 | 1:200 |
| Tyrosine hydroxylase, clone TH-2 (mouse, monoclonal) | Rat tyrosine hydroxylase | Sigma-Aldrich Cat# T1299, RRID:AB_477560 | 1:500 |
| Vimentin, clone LN-6 (mouse, monoclonal) | Nuclei from adult human thymic biopsy specimens | Millipore, Cat# MAB1681, RRID:AB_11211549 | 1:250 |
Table 2:
Secondary antibodies used in histological assays
| Fluorescent Conjugate (Host, Target) All are α-IgG (H+L) unless noted | Jackson ImmunoResearch (West Grove, PA) Product # | Concentration |
|---|---|---|
| Cyanine Cy3 (donkey α-rabbit) | 711-165-152 | 1:1000 |
| Alexa Fluor 488 (bovine α-goat) | 805-545-180 | 1:1000 |
| Alexa Fluor 488 (donkey α-mouse) | 715-545-150 | 1:1000 |
| Alexa Fluor 488 (goat α-mouse, IgG + IgM H+L) | 115-545-068 | 1:500 Vimentin only |
| Cyanine Cy2 (donkey α-rat) | 712-225-150 | 1:1000 |
| Alexa Fluor 488 (donkey α-chicken) | 703-545-155 | 1:1000 |
| Biotin (donkey α-mouse) | 715-065-150 | 1:1000 |
| Biotin (donkey α-rat) | 712-065-150 | 1:1000 |
| Horseradish peroxidase (donkey α-rabbit) | 711-035-152 | 1:1000 |
Antibody specificity and characterization:
Additional information for each antibody can be found in Table 1. The calbindin (CALB) antibody (Swant #300, RRID:AB_10000347) was produced by hybridized mouse myeloma cells and splenic cells from mice immunized with calbindin D-28k purified from chicken gut. It labels a single band (28 KDa) in homogenates from both mouse and rat brain and does not cross-react with calretinin or other calcium-binding proteins (per manufacturer’s datasheet). The manufacturer also notes that the calretinin (CALR) antibody (Swant #6B3, RRID:AB_10000320) was produced in mice via immunization with recombinant human calretinin-22k and that immunoblots using it show a single band at 29 KDa in mouse and rat brain homogenates. The CaMKII antibody (Enzo Life Sciences #ADI-KAM-CA002, RRID:AB_10617228) was derived from partially purified rat CaMKII and then purified from hybridoma tissue culture supernatant; immunoblots show a band at ~50–60 KDa (mouse and rat brain per manufacturer’s technical sheet). The antibody against choline acetyltransferase (ChAT; Millipore #AB144P, RRID:AB_2079751) was purified against the human placental enzyme, with staining at a single band at ~68–70 KDa in mouse brain homogenates (manufacturer’s technical sheet). The antibody against DARPP-32, a generous gift from Drs. Paul Greengard and Angus Nairn, was produced by immunizing spleen cells from BALB/c mice with purified DARPP-32 and then fusing them with SP2/0 Ag14 myeloma cells using polyethylene glycol. It shows a single band at 32 KDa in rat brain homogenate (Ouimet et al., 1984). Generated by peptide mapping of the C-terminus (amino acids 385–402) of human doublecortin (DCX), the DCX antibody (Santa Cruz Biotechnology Cat# sc-8066, RRID:AB_2088494) generates a single band at ~45 KDa in rat brain homogenate (Brown et al., 2003). The dsRed antibody used to detect GLP-1R-mApple (Takara Bio #632496, RRID:AB_10013483) was raised against dsRed-Express, which is a variant of Discosoma sp. red fluorescent protein. It produces a band at ~30–38 KDa via Western blot in HEK293 cell lysates expressing the red fluorescent protein (manufacturer’s technical sheet) and a band at ~58 KDa in homogenates of intestine derived from ChAT-Cre-tdTomato mice (Gautron et al., 2013). The antibody used against the eGFP-derived lines (enhanced green fluorescent protein; Thermo Fisher Scientific #A10262, RRID:AB_2534023) was isolated directly from the jellyfish Aequorea victoria and has been characterized extensively, including specific labeling of tissue (specifically mouse cortex) transfected with GFP-expressing vectors via electroporation (Fousse et al., 2019; Inamata & Shirasaki, 2014). The GAD67 antibody (Millipore #MAB5406, RRID:AB_2278725) was previously characterized via immunoblot, producing a single band at 67 DKa in rat cortical homogenates (Fong et al., 2005). It was raised against a recombinant GAD67 protein and has no apparent cross-reactivity with GAD65 as determined by Western blot (manufacturer’s technical sheet). To identify glial fibrillary acidic protein (GFAP; Millipore #MAB360, RRID:AB_11212597), an antibody purified from porcine spinal cord-derived GFAP was used that labels a band at ~51 KDa via Western blot in mouse brain lysates (manufacturer’s technical sheet). Neurons were labeled with a NeuN antibody (Millipore #MAB377, RRID:AB_2298772), which was purified from cell nuclei derived from mouse brain and recognizes 2–3 bands at 46–48 KDa and (Mullen et al., 1992). The parvalbumin (PV; Sigma-Aldrich #P3088, RRID:AB_477329) antibody was purified from frog muscle PV and does not react with other members of the calcium-binding protein EF-hand super family (manufacturer’s technical sheet). It does not label cells in PV knockout mice and produces a single band at ~12 KDa in Western blots (Burette et al., 2009; Ramamurthy & Krubitzer, 2016). Showing no reactivity to enkephalins, other endorphins, substance P, or calcitonin gene-related protein, the somatostatin (SST) antibody (Millipore #MAB354, RRID:AB_2255365) was synthesized from a synthetic peptide corresponding to amino acids 1–14 of cyclic SST conjugated to bovine thyroglobulin using carbodiimide (manufacturer’s datasheet). A previous study using an immunoabsorption assay determined the specificity of this antibody (Xu et al., 2006). The immunogen for the antibody against tyrosine hydroxylase (TH; Sigma-Aldrich #T1299, RRID:AB_477560) was rat TH. The antibody recognizes an epitope in the N-terminal regions (aa ~9–16) for both the rodent and human analogs, and immunoblotting reveals labeling at ~60 KDa in rat tissue (manufacturer’s technical sheet). The vimentin antibody (Millipore #MAB1681, RRID:AB_11211549) was produced via nuclei from adult human thymic biopsy specimens and was characterized previously, in both competition studies and in immunoblots, showing a band at ~60 KDa using human sarcoma cells, similarly to another monoclonal anti-vimentin antibody (Stathopoulos et al., 1989).
RNAScope:
WT C57Bl6/J (P60 or older) were euthanized under isoflurane anesthesia, and whole brains were rapidly removed and frozen in cold 2-methylbutane. Fresh frozen brains were stored at −80°C until experimentation, upon which they were sliced on a cryostat at 20 μm and mounted on slides. RNAScope was performed following the guidelines provided by Advanced Cell Diagnostics (ACDBio, Newark, CA); RNAse-free reagents were used in all steps. Briefly, frozen slides were incubated for 15 min at 4°C in 4% paraformaldehyde, followed by several 5 min washes in increasing concentrations of ethanol (50, 70, and 100%). Slides were incubated in 100% ethanol overnight at 20°C to complete the dehydration steps. The following morning, slides were dried at room temperature for 5 min, after which a hydrophobic barrier was drawn around the sections using an ImmEdge Hydrophobic Barrier PAP pen (Vector Laboratories). Sections were incubated at room temperature for 20 min with Protease Pretreat 4 (ACDBio, Newark, CA), rinsed in 1X PBS, and then incubated with the appropriate probes (see Table 3) at 40°C for 2 hrs. Sections were then washed in 1X Wash Buffer (ACDBio) and then incubated in the AMP 1-FL (30 min), AMP 2-FL (15 min), AMP 3-FL (30 min), and AMP 4-FL ALT A (15 min) at 40 °C, each of which was interspersed with washes in 1X Wash Buffer. RTU DAPI solution (ACDBio) was applied at room temperature for 30 sec prior to coverslipping with Prolong Gold mounting medium (Life Technologies, Carlsbad, CA).
Table 3:
ACDBio Probes Utilized
| Probe Description | Product # |
|---|---|
| Mm-Slc17a6 | 319171 |
| Mm-Glp1r-C2 | 418851-C2 |
| Mm-Gad1-C3 | 400951-C3 |
| Mm-Glp1r | 418851 |
For experiments combining RNAScope with immunohistochemistry, GLP-1R-mApple mice were perfused with 4% paraformaldehyde as previously described, and brains were cryoprotected in a sucrose gradient (up to 20%) and cut at 20 μm onto slides via cryostat. The RNAScope protocol (Multiplex Fluorescent v2, ACDBio) was performed as described with some modifications. Slides were incubated in provided H2O2 prior to Protease Pretreat 4, and only the Glp1r (channel 1) probe was utilized. Sections then underwent TSA amplification as recommended using the PerkinElmer TSA® Plus Fluorescein System (Akoya Biosciences, Marlborough, MA). Briefly, Slides were incubated with HRP-C1 (15 min at 40°C), TSA® Plus Fluorescein (1:1,500, 30 min at 40°C), v2 HRP blocker (15 min at 40°C), with each step interspersed with rinses in 1X Wash Buffer. For the IHC portion, slides were incubated in 10% normal serum in TBS-0.1% BSA (30 min at room temperature) and then incubated in the aforementioned dsRed primary antibody (1:500) in TBS-0.1% BSA overnight at room temperature. After washes in TBST buffer, slides were incubated with an HRP-conjugated secondary antibody in TBS-0.1% BSA (1:1000; 30 min at room temperature) and then TSA® Plus Cyanine 3 (1:750 for 10 min at room temperature). Slides were incubated in DAPI and coverslipped with ProLong Gold.
Cell counting and analysis:
For the double-labeled IHCs, wherein expression of GLP-1R-mApple was examined in conjunction with another cellular marker, data are presented as the percent of co-labeled cells as a total of all GLP-1R-mApple cells within that region of interest and expressed as means ± standard error of the means (SEMs) within the text. Brains were cut at 40 μm thickness and every 8th section was used for histological staining in order to avoid counting adjacent sections and to provide representative sections for each brain region. The estimated number of cells per field was calculated in accordance with Abercrombie’s formula (Abercrombie, 1946), and data are presented both as percent of colocalized cells as well as the corrected number of cells/mm2. Sections from at least 3 mice (2–3 sections per mouse, using both hemispheres within each section where applicable) were counted by independent investigators trained in these procedures.
Results
Glp1r transcript levels within the WT brain:
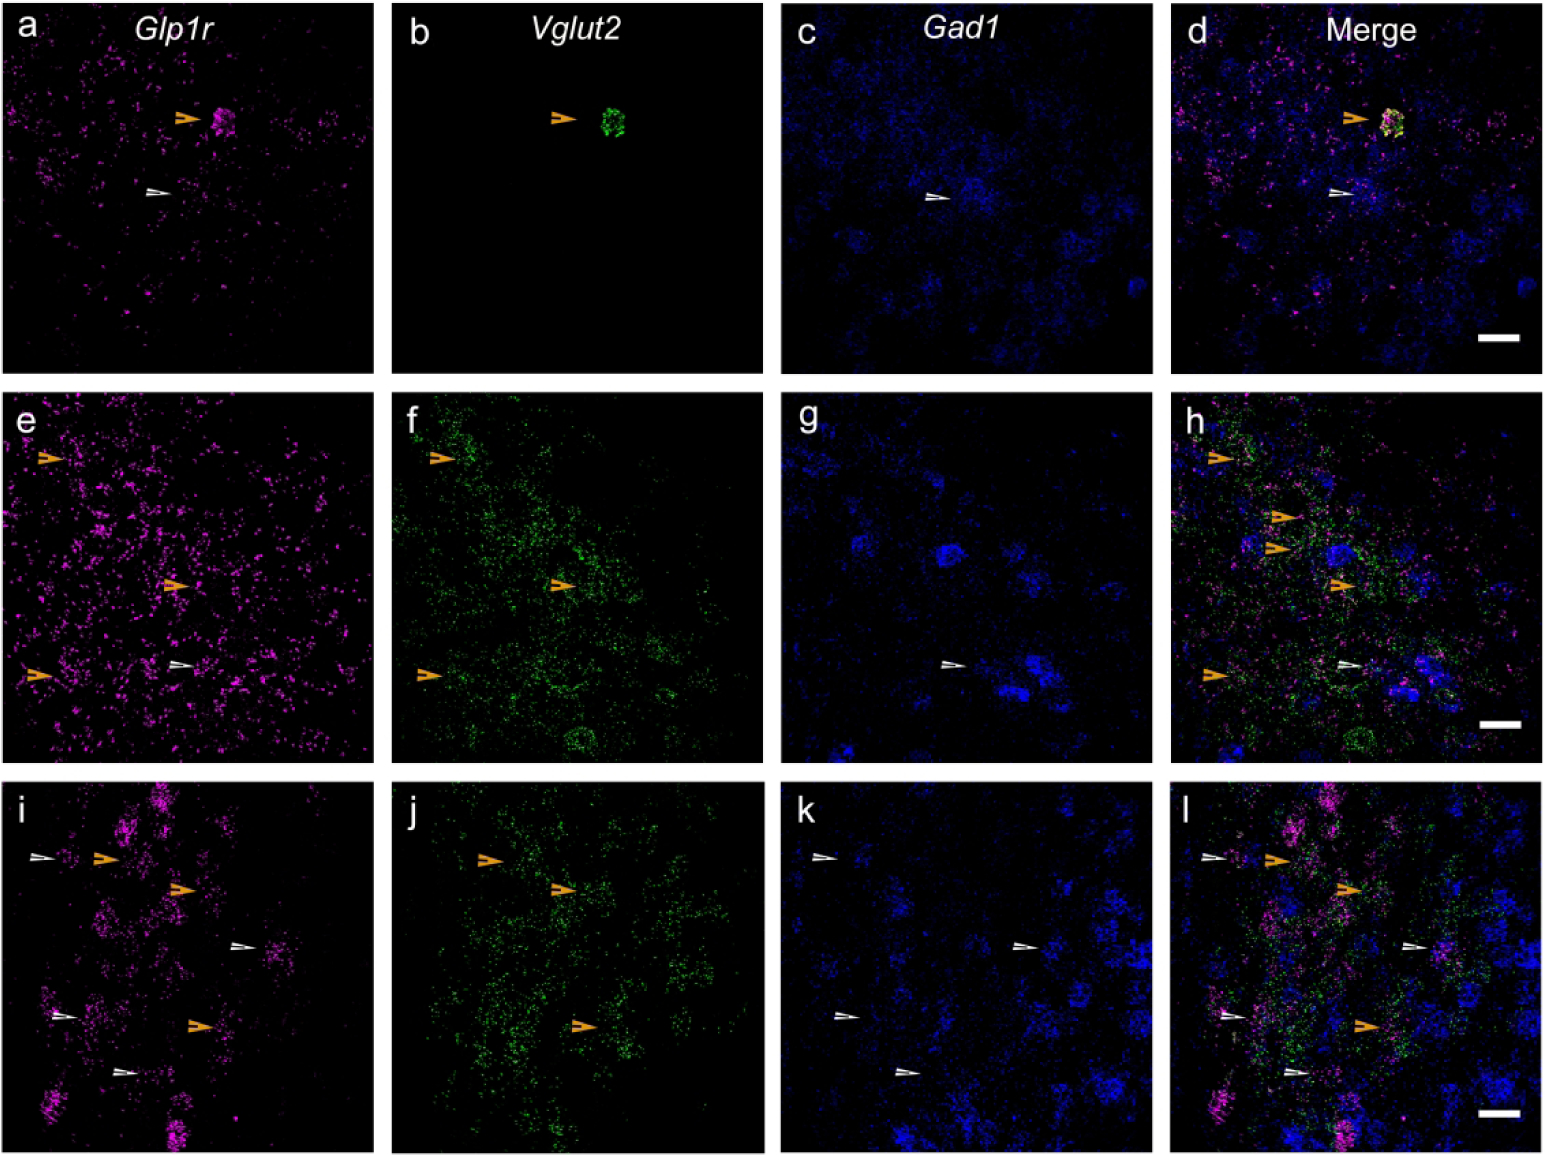
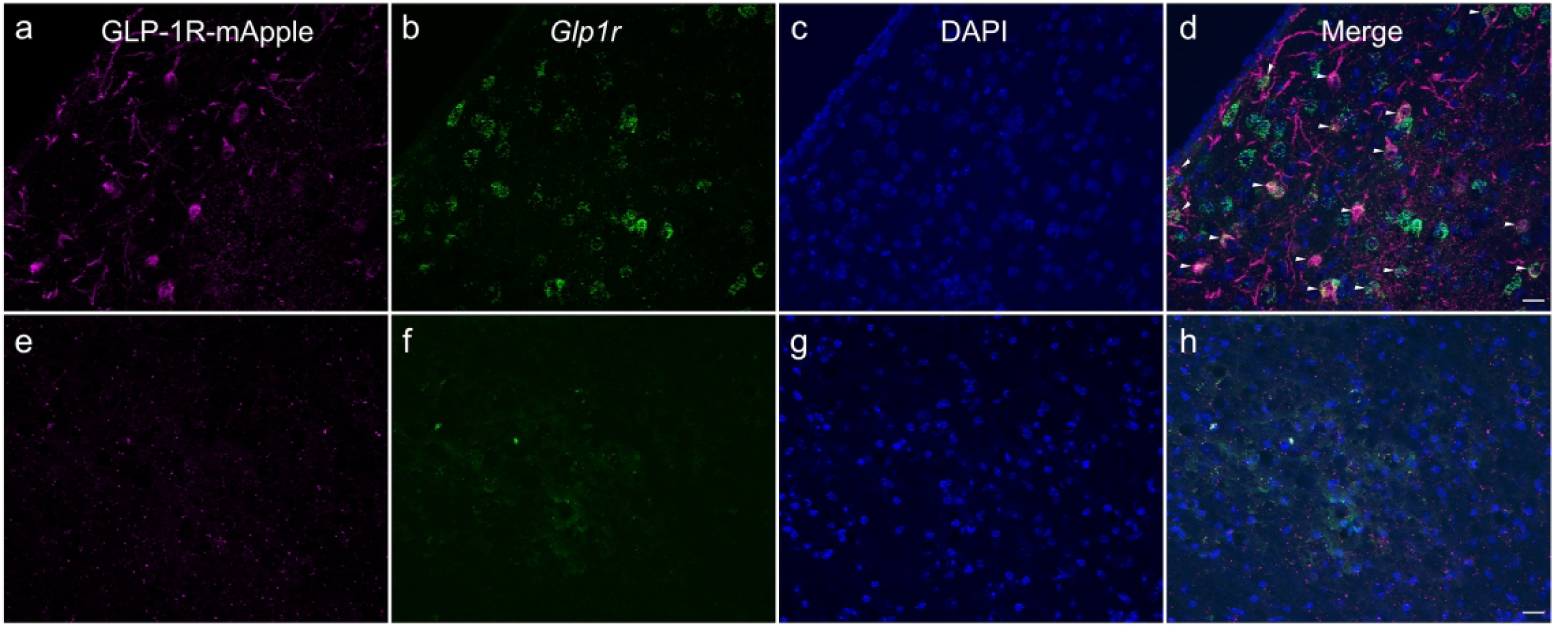
Fluorescent in situ hybridization utilizing RNAScope technology was used to identify Glpr1 mRNA levels in key regions of the brain, specifically regions associated with the mesolimbic DA reward circuitry, as data indicate that GLP-1R within these regions modulates the rewarding properties of drugs of abuse and food consumption (Dickson et al., 2012; Dossat et al., 2011; Harasta et al., 2015; Reddy et al., 2016; Sørensen et al., 2015; Terrill et al., 2016). Using this transcript visualization technique in WT tissue, we found that Glpr1r was highly expressed within GABAergic neurons of the lateral septum (LS, Fig 1a–d), which concurs with previous reports (Goke et al., 1995; Merchenthaler et al., 1999). On the contrary, in the dorsal striatum (data not shown) and nucleus accumbens (NAc, ventral striatum, Fig 1e–h), only occasional cells expressed Glpr1r. We also confirmed Glp1r expression within other brain regions to confirm the fidelity of our GLP-1R-mApple mouse model. For instance, Glp1r was expressed within both the dorsal and ventral portions of the dentate gyrus (DG), with greater expression in the molecular layer of these subregions and minimal transcript expression in the hilus (Fig. 1i–l, molecular layer of vDG). In this brain region, however, colocalization with Gad1 was not detected.
Figure 1:
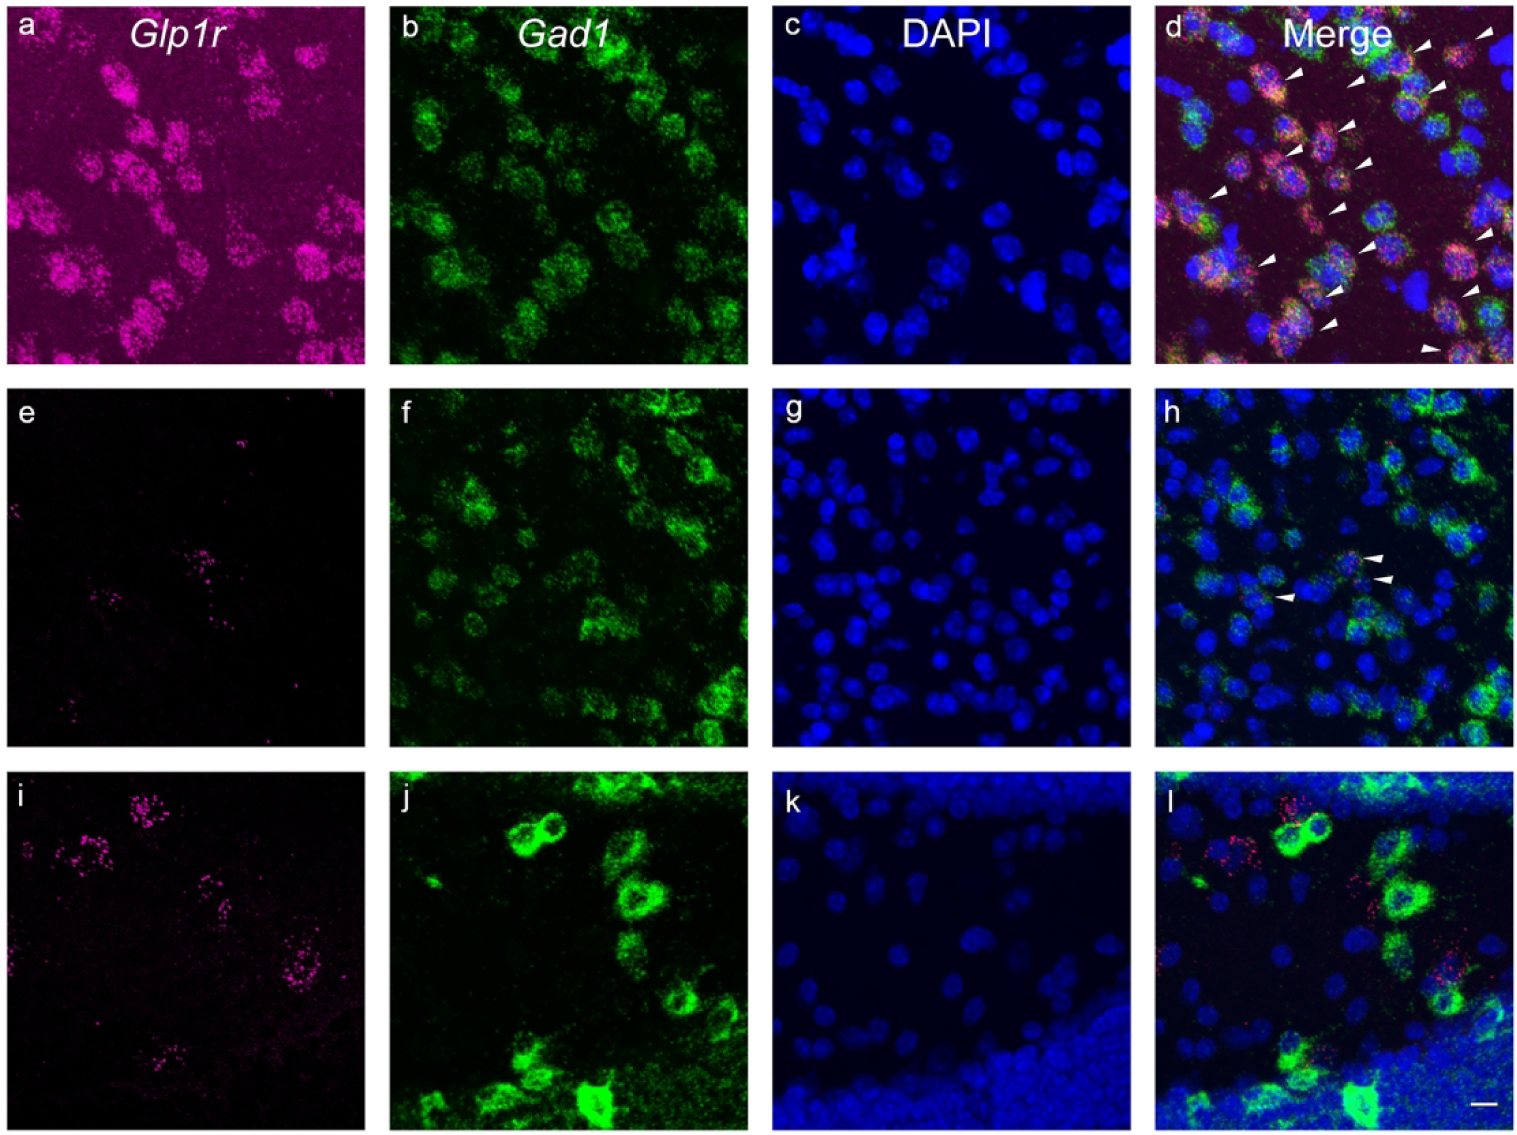
Endogenous Glp1r expression within the brain of WT C57Bl6/J mice. Glp1r (magenta, a, c, i) within the LS (a–d) and the NAc (e–h) is colocalized with Gad1 transcript (green, b, f, j). Also note that relatively few neurons in the NAc are GLP1r+ € but many in the LS are positive for this transcript (A). This co-expression does not manifest within the DG of the hippocampus (i–l). All representative micrographs are at 20X magnification, and DAPI is shown in blue (c, g, k). Arrows signify Glp1r colocalization with Gad1 if present (d, h, l). Scale bar = 20 μm.
Expression of GLP-1R-mApple within functional circuits of the brain:
We compared Glpr1 transcript expression patterns with antibody-amplification of the mApple transgene throughout the brain. As GLP-1R has a number of different functions within the nervous system, ranging from energy homeostasis and food intake to drug reward and learning and memory, we examined expression patterns within functional brain circuits. It should be noted that while some brain regions are placed into certain classes, there is a great deal of overlap in function across these regions. Hereafter, we will refer to these cells as neurons, as we did not observe GLP-1R-mApple within glial cells, but rather detected extensive overlap of GLP-1R-mApple with the neuronal marker NeuN (see colocalization section below).
Feeding behavior and energy homeostasis:
The hypothalamus is a complex brain region that has long been associated with GLP-1R modulation, particularly in terms of energy homeostasis and feeding behaviors (Kanoski et al., 2016; Suzuki et al., 2010). The BAC transgenic mice demonstrated a significant number of GLP-1R-mApple+ neurons within the medial preoptic area (MPA) as well as the lateral preoptic area (LPO, Fig. 2a). Moving caudally, GLP-1R-mApple was highly expressed within the MnPO (median preoptic nucleus), the periventricular hypothalamus (Pe) lining the 3rd ventricle, and the medial preoptic nucleus (MPO, Fig. 2b).
Figure 2:
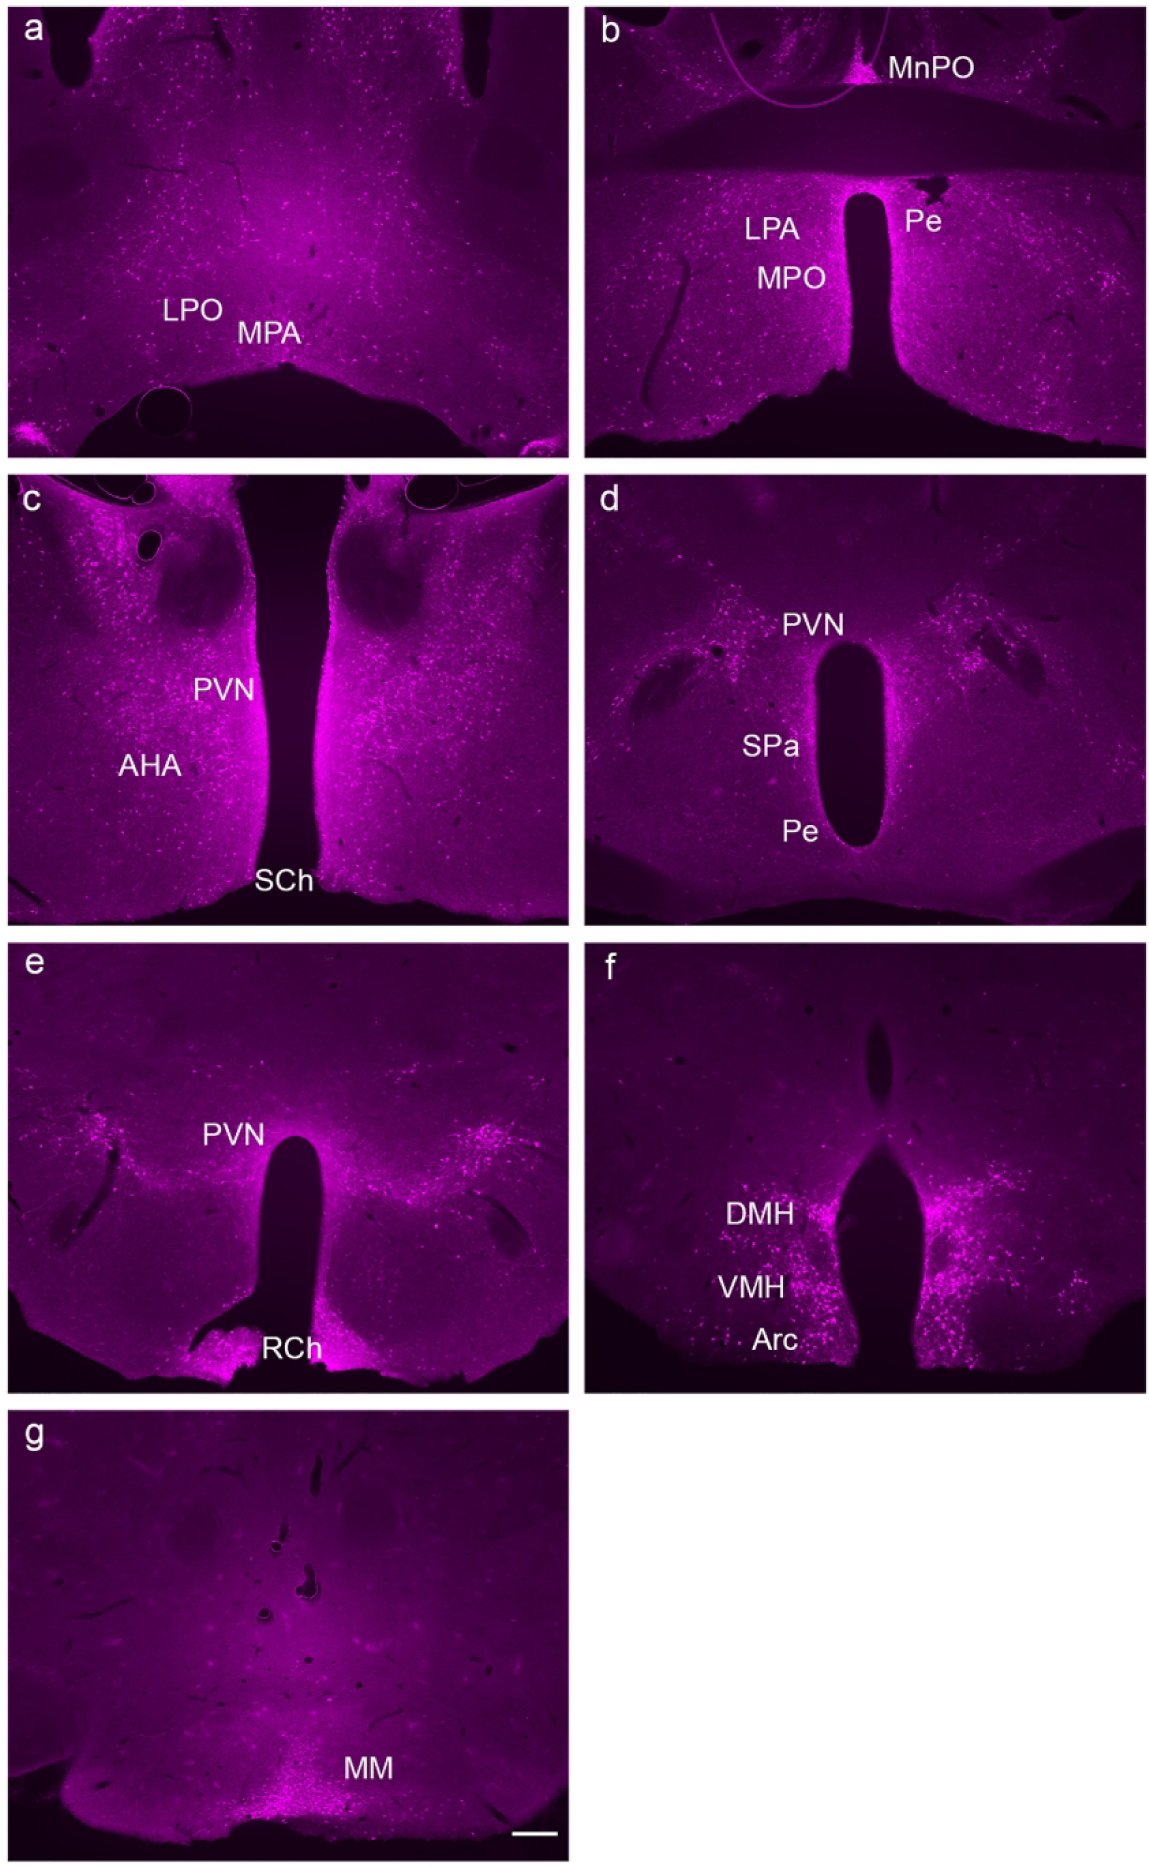
GLP-1R-mApple expression along the rostral to caudal (a → g) axis of the hypothalamus. 5X magnification, scale bar = 200 μm.
GLP-1R-mApple expression was also detected in the paraventricular hypothalamic nucleus (PVN, magnocellular and parvocellular divisions), as well as the subparaventricular zone (SPa) and extending caudally into the suprachiasmatic nucleus (SCh) and the retrochiasmatic area (RCh) (Fig. 2c–e). Low levels of expression were evident in the anterior portion of the anterior hypothalamus (AHA, Fig. 2c). GLP-1R+ neurons formed a butterfly pattern, presumably the dorsal and ventral portions of the dorsomedial hypothalamus (DMH), both of which are involved in hunger and feeding control (Ahima & Antwi, 2008), as well as the ventromedial hypothalamus (VMH, Fig. 2f). High levels of reporter expression were found in the arcuate hypothalamic nucleus (Arc, Fig 2f) and the medial mammillary nucleus (MM, Fig. 2g).
Fear and stress response systems:
The amygdala, as well as the other regions affiliated with the extended amygdala, are associated with responses to fear and stress. Within the amygdalar regions, scattered expression of the fluorescent label was found within the anterior amygdaloid area (AA) as well as the anterior cortical amygdaloid area (ACo) and cortex-amygdala transition zone (CxA). Extending caudally, no apparent expression of GLP-1R-mApple was found in the basolateral amygdala (BLA) with scarce labeling within the basomedial amygdala (BMA). However, GLP-1R-mApple was highly expressed within the central amygdala (CeA) in the medial, capsular, and lateral regions (Fig. 3a) as well as the medial amygdala (MeA). Staining is apparent in other regions associated with the extended amygdala, particularly the bed nucleus of the stria terminalis (BNST), which also exhibited significant levels of expression of the reporter throughout this region (Fig. 3b).
Figure 3:
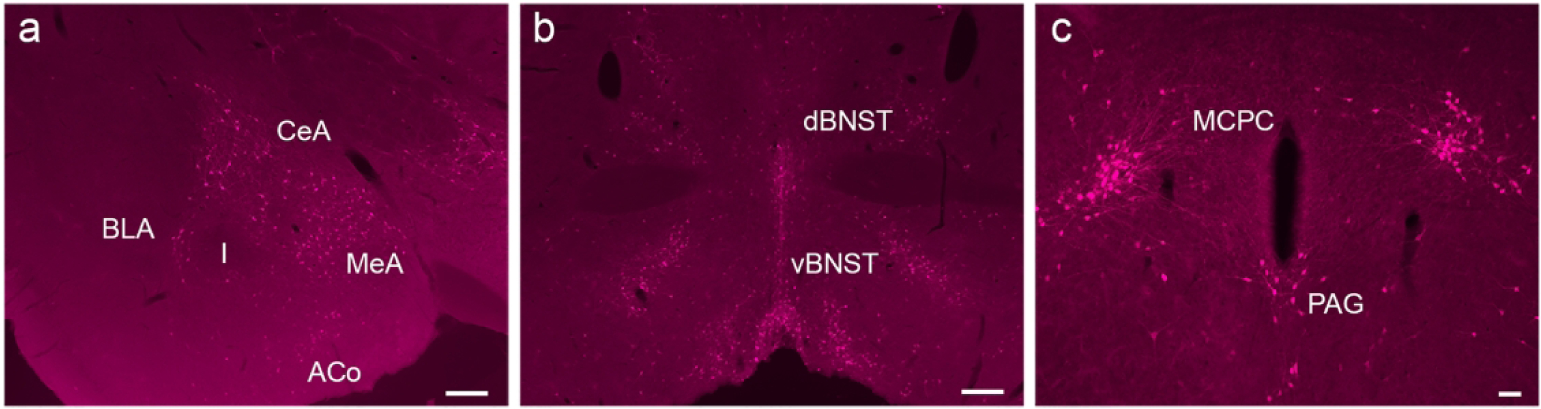
Expression of GLP-1R-mApple within the amygdala (a, 5X, scale bar = 200 μm), BNST (b, 5X, scale bar = 200 μm), and PAG (c, 10X, scale bar = 50 μm).
In the more caudal portions of the brain, the periaqueductal grey (PAG) is associated with fear behavior and memory as well (Watson et al., 2016). As has been previously described, GLP-1R is expressed in the PAG (Cork et al., 2015; Merchenthaler et al., 1999). However, GLP-1R-mApple was not evenly distributed throughout the PAG and was instead found only within the ventral PAG (Fig. 3c). Interestingly, vPAG neurons are also associated with the rewarding properties of drugs of abuse (Flores et al., 2006; Li et al., 2013). Moreover, a “wing pattern” of labeled cells was evident, branching off from the PAG, likely corresponding to the magnocellular nucleus of the posterior commissure (MCPC) (Fig. 3c).
Reward and motivation:
Data from our lab and others have demonstrated a role for GLP-1R on drug reward (Egecioglu, Engel, et al., 2013b; Egecioglu, Steensland, et al., 2013; Graham et al., 2013; Reddy et al., 2016; Sørensen et al., 2015). Thus, we examined a number of regions that have been associated with drug reward and addiction. Within the olfactory bulb, GLP-1R was sparsely expressed around the edges of the tissue, particularly in the glomerular layer and lateral olfactory bulb, as well as within the mitral cell layer (Fig. 4a). Moving caudally through the forebrain (Fig. 4B), there was a cluster of positively stained cells suggestive of the dorsal and intermediate endopiriform claustrum (DEn and IEn, respectively) as well as the claustrum proper (Cl) (Fig. 4d). However, this region appeared laterally to the external capsule (ec) and was not surrounded by PV+ neurons (Mathur, 2014; Mathur et al., 2009; Q. Wang et al., 2017), suggesting that this is not the Cl. Within the caudate putamen, GLP-1R-mApple labeling was present, although scant. No apparent clusters of cells were found in either the dorsal striatum (STR, Fig. 4c) or the ventral striatum (nucleus accumbens, NAc, Fig. 4e). Moving caudally, the globus pallidus (GP), an integral member of the basal ganglia, exhibited no GLP-1R-mApple+ cells; however, a significant number of cells expressing the GPCR marker was observed within the ventral pallidum (VP) in both the rostral and caudal portions of this structure (Fig. 4f). GLP-1R-mApple is also expressed in ventral patches of the brain, likely corresponding to the islands of Calleja (ICj) (Fig. 4f). The STR, NAc, and VP have long been associated with dopaminergic signaling and hedonic reward (Amalric & Koob, 1993; Pecina et al., 2006). However, the functions of the islands of Calleja are not well characterized; given their proximity to and/or role in the dopaminergic (DAergic) circuitry, it has been proposed that they play a role in drug reward (Hsieh & Puche, 2013; Ikemoto, 2007).
Figure 4:
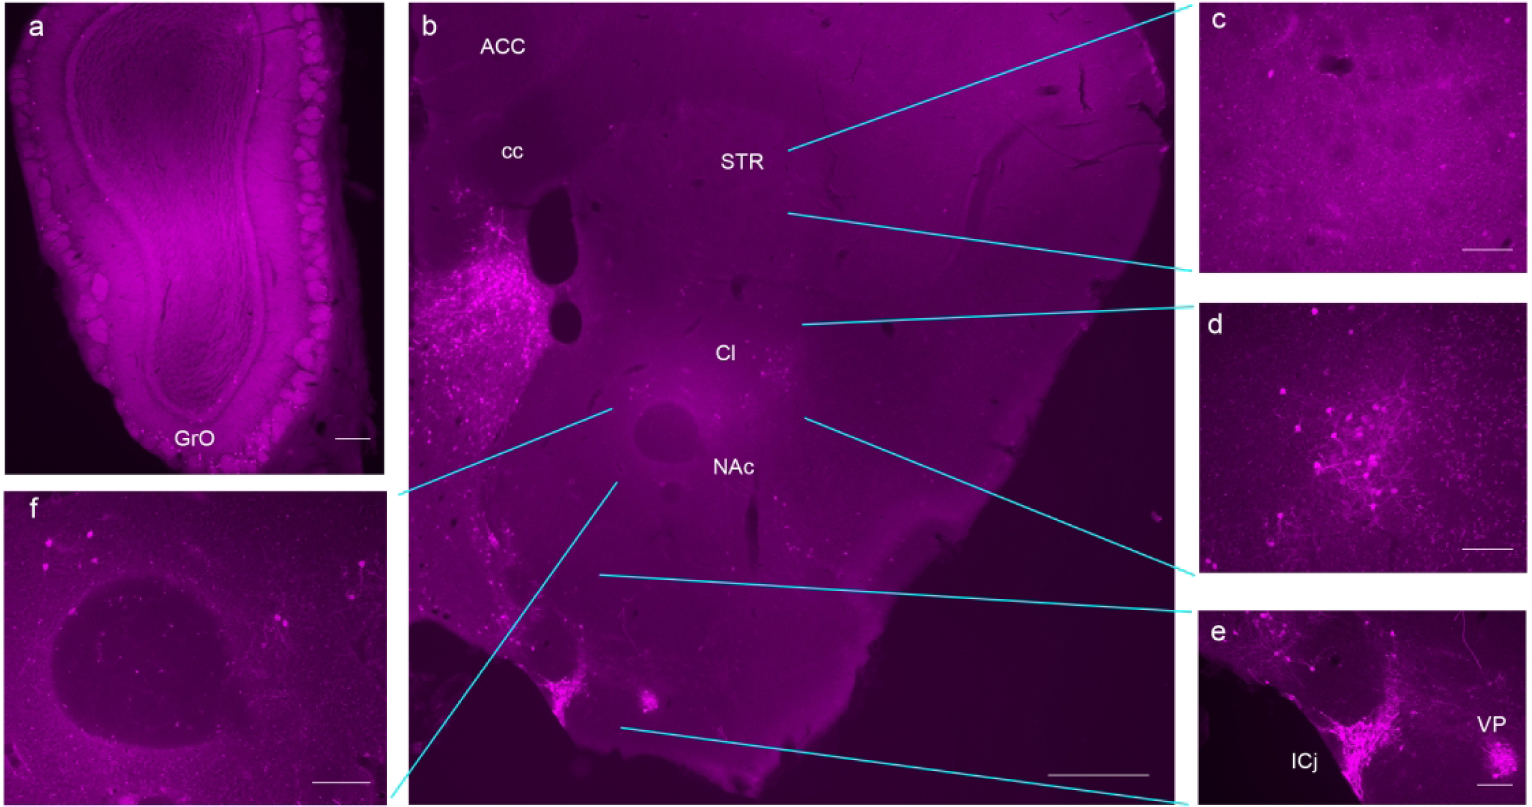
GLP-1R-mApple was expressed within the olfactory bulb (a, 5X, scale bar = 200 μm) and the forebrain (b, 2.5X, scale bar = 500 μm). Subsections of the forebrain are magnified to reveal GLP-1R-mApple labeling. Scant labeling was evident in the dorsal STR (c) and NAc (f), with greater levels of expression in the Cl (d) and ICj and VP (e). 10X magnification, scale bar = 100 μm.
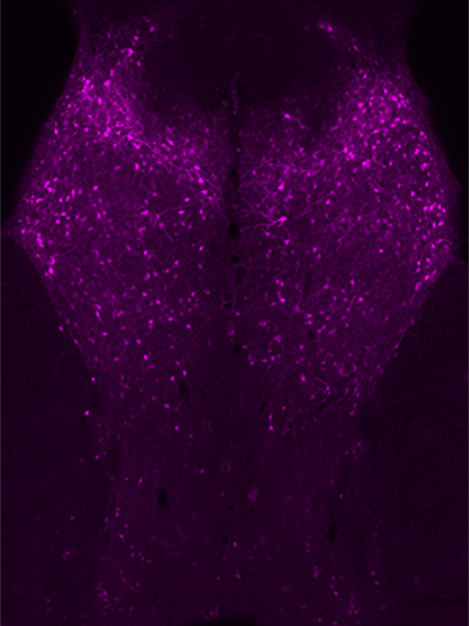
While little expression of GLP-1R was found within the NAc and STR, on the contrary, another region within the mesolimbic DA reward circuitry, the lateral septum (LS), had the highest level of GLP-1R expression within any brain region examined. The GLP-1R-mApple marker was highly expressed within the LS, although this expression was not uniform throughout this region (Fig. 5). For instance, expression was observed in the dorsal LS (LSD) at the most rostral point of the region. Both the intermediate and ventral LS (LSI and LSV, respectively) demonstrated similarly high expression levels. However, moving caudally through the LS, expression decreased significantly. Furthermore, little mApple-GLP-1R was detected within the medial septum (MS). At the level of the anterior commissure (aca), little mApple was found within the remains of the LS except for sparse labeling within the dorsal portion. Similarly, no GLP-1R-mApple signal was exhibited within the nearby septohippocampal nucleus (SHi) or the dorsopeduncular cortex (DP).
Figure 5:
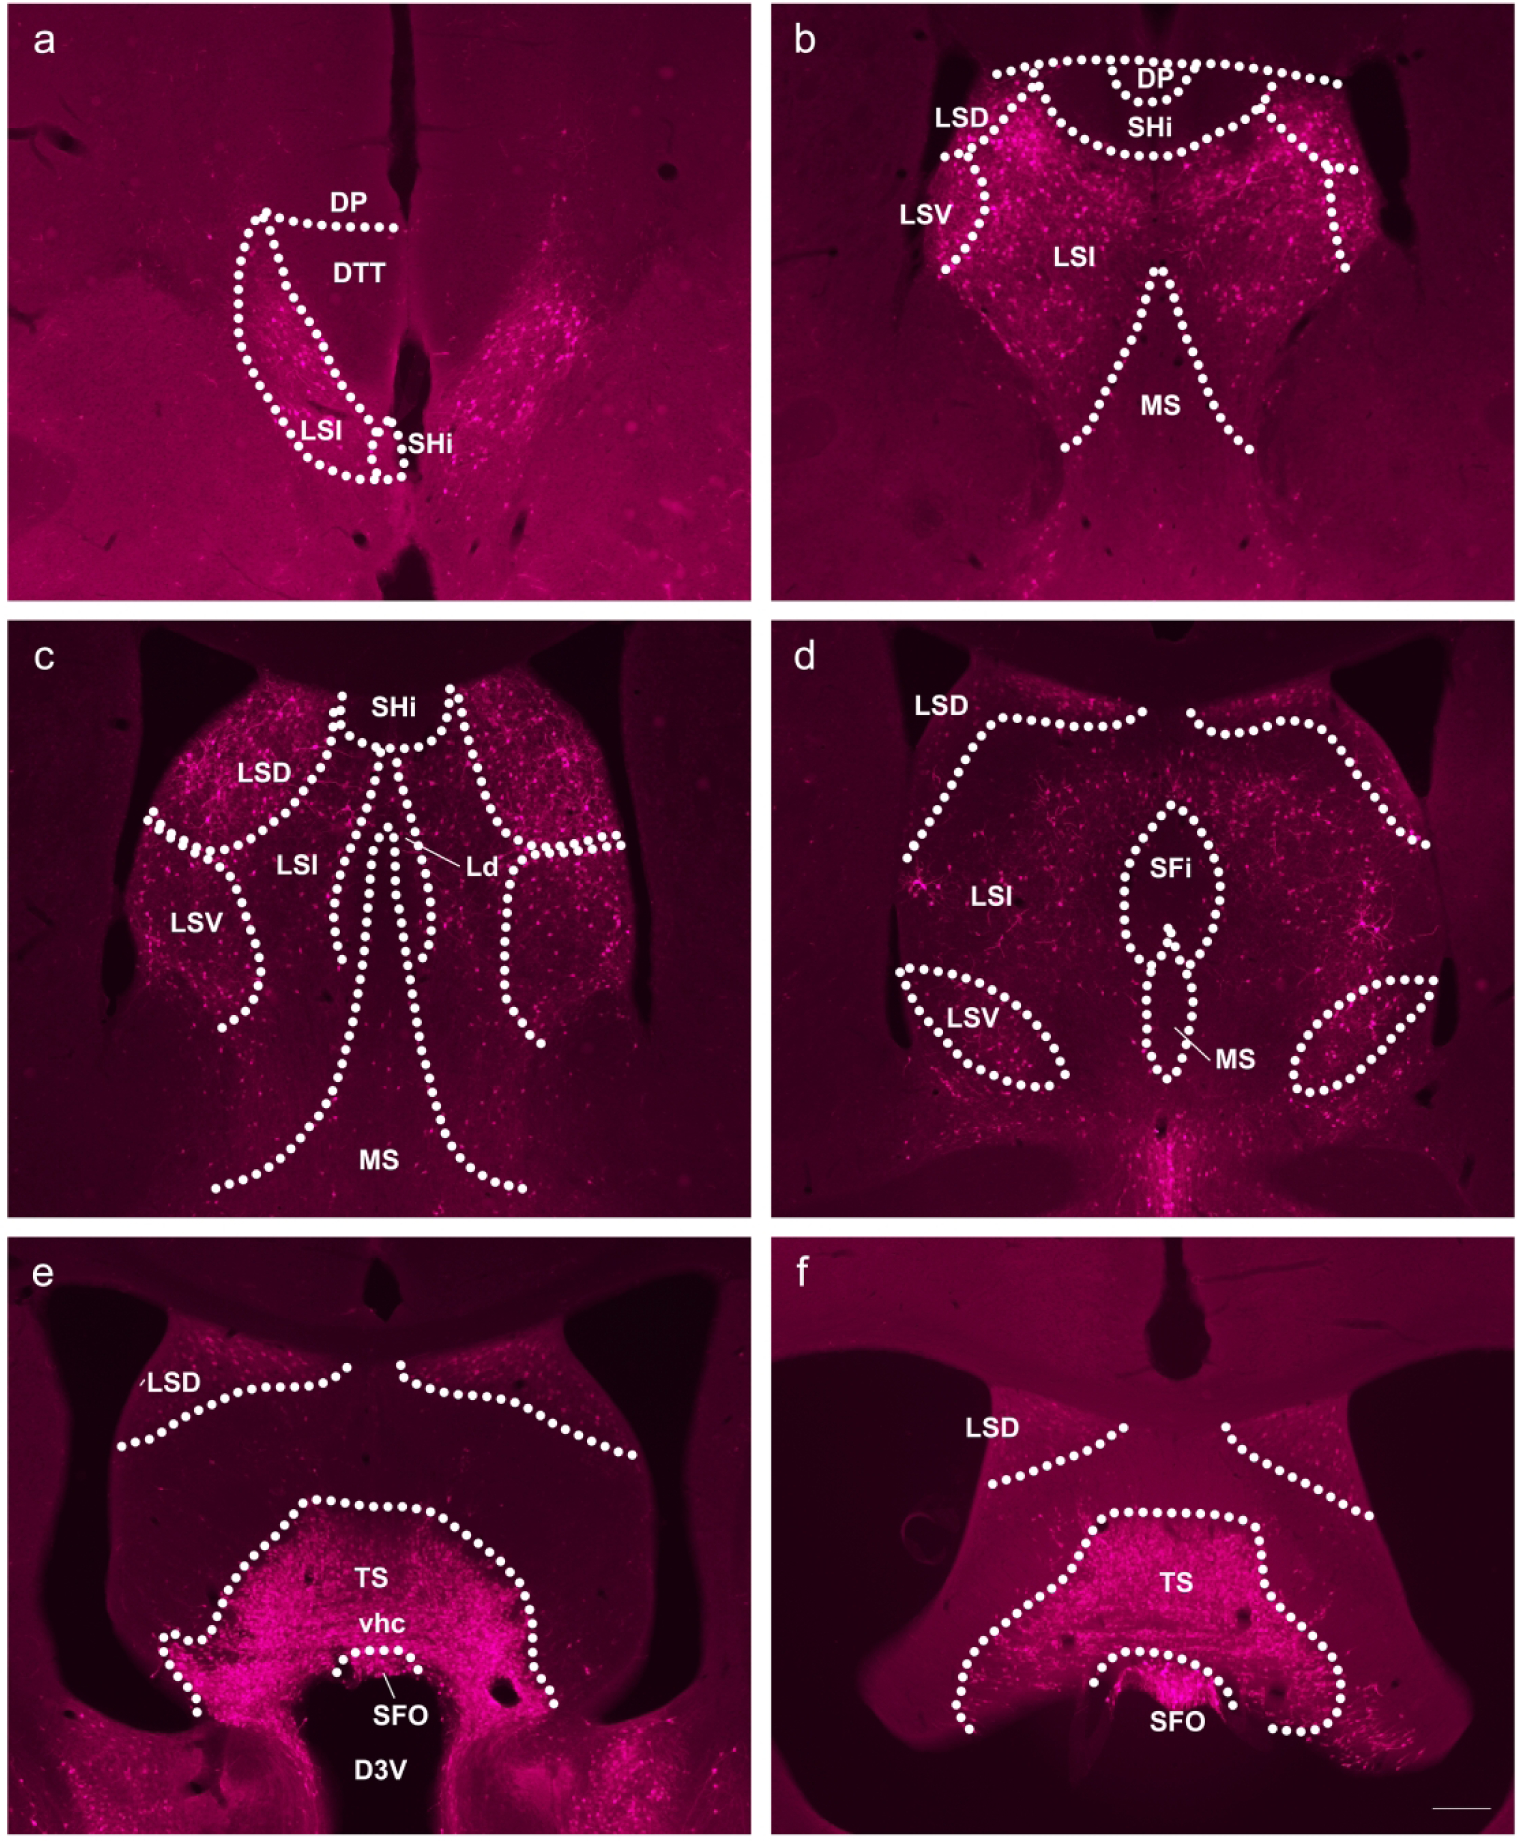
GLP-1R-mApple was most highly expressed throughout the rostral to caudal axis (a→f) of the LS. 5X magnification, scale bar = 200 μm.
The midbrain DAergic regions are synonymous with drug reward and addiction. We found some expression within the ventral tegmental area (VTA) as well as the substantia nigra pars compacta (SNc) or pars reticulata (SNr) (Fig. 6a). Upon closer examination, however, GLP-1R-mApple+ neurons were evident closer to the boundaries of these regions—perhaps corresponding to the zona incerta (ZI) of the thalamus for the nigral cells—and were not colocalized with TH, a marker of DAergic neurons that characterize these regions (Fig. 6b and c). Finally, we examined the habenular complex. While no positively stained cell bodies were present, considerable GLP-1R-mApple+ fiber tracts were evident within the medial portion (MHb, Fig. 6d), a region that is associated with some aspects of drug reward and withdrawal (Viswanath et al., 2013), although the lateral habenula (LHb) exhibited scant levels of fiber tracts. Similarly, the MHb, but not the LHb, receives a significant portion of its projections from the triangular septal nucleus (TS, Fig. 5f) (Kawaja et al., 1990), which was heavily labeled with GLP-1R-mApple+ cells, indicating a direct role of GLP-1R on MHb function. Interestingly, GLP-1R-mApple+ cells within the TS colocalized fully with calretinin (CALR, data not shown), indicating that these GLP-1R+ cells project directly to the MHb, in which extensive numbers of CALR+ axons are found (Wilson & Kawaja, 1996).
Figure 6:
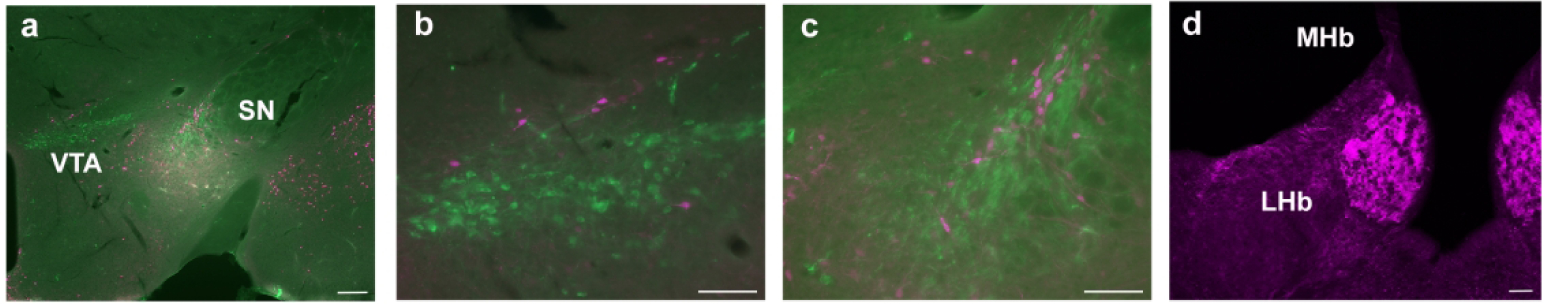
Expression of GLP-1R-mApple within brain regions associated with reward. The mApple marker (magenta) was found in and around the VTA and SNc/r, which can be visualized by staining for TH (green), a marker of DAergic neurons (a, 5X magnification, scale bar = 200 μm). The VTA (b) and SNc (c) are magnified to show that while GLP-1R-mApple is present in these regions, there is little to no colocalization with TH. 20X magnification, scale bar = 50 μm for both b and c. Significant levels of GLP-1R fiber tracts were apparent within the MHb, but not the LHb (d, 10X magnification, scale bar = 50 μm)
Learning and memory:
The frontal cortex plays an important role in cognitive function. We found sparse labeling of intrinsic cells within this region and more pronounced labeling of apparent neuronal processes, particularly in the mid-outer layers (layers 2–4, Fig. 7a). Scattered GLP-1R-mApple+ cells were also found in the auditory, visual, and somatosensory cortices as well (data not shown; see also Fig. 13). GLP-1R-mApple was minimally detected within the orbitofrontal cortex (OFC) and motor cortex [M1 and M2, although rostrally GLP-1R-mApple neurons are expressed within the frontal association cortex (FrA)]. The piriform cortex (Pir) also exhibits cells with relatively high levels of expression (Fig. 7a).
Figure 7:
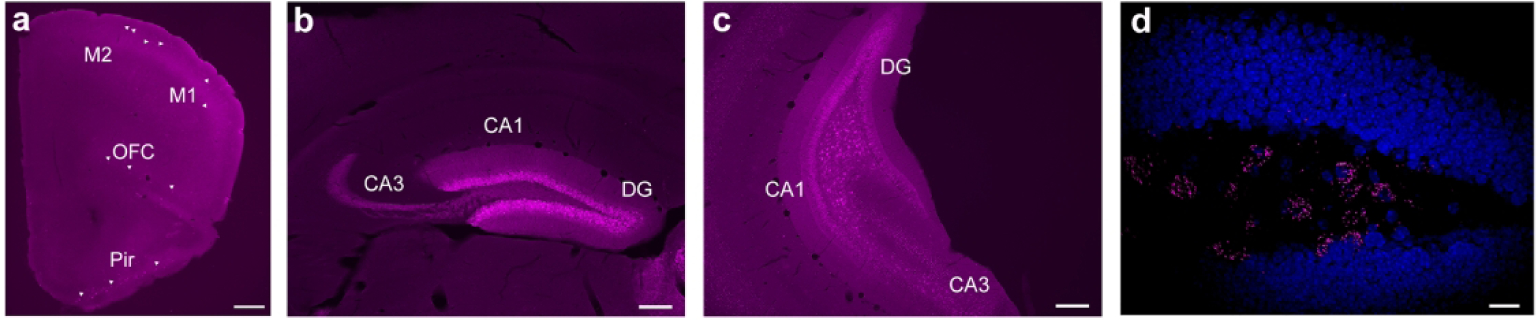
Little expression of the GLP-1R proxy was evident in the frontal cortex (a, 2.5X magnification, scale bar = 500 μm). However, GLP-1R-mApple was significantly expressed within the dorsal DG (b) and ventral DG and CA3 (c). Both b and c are depicted at 5X magnification (200 μm scale bar). RNAscope revealed that Glp1r is expressed within the molecular layer of the vDG (d), with minimal expression in the hilar region (40X magnification, 20 μm scale bar; DAPI is presented in blue). Arrowheads indicate GLP-1R-mApple+ neurons.
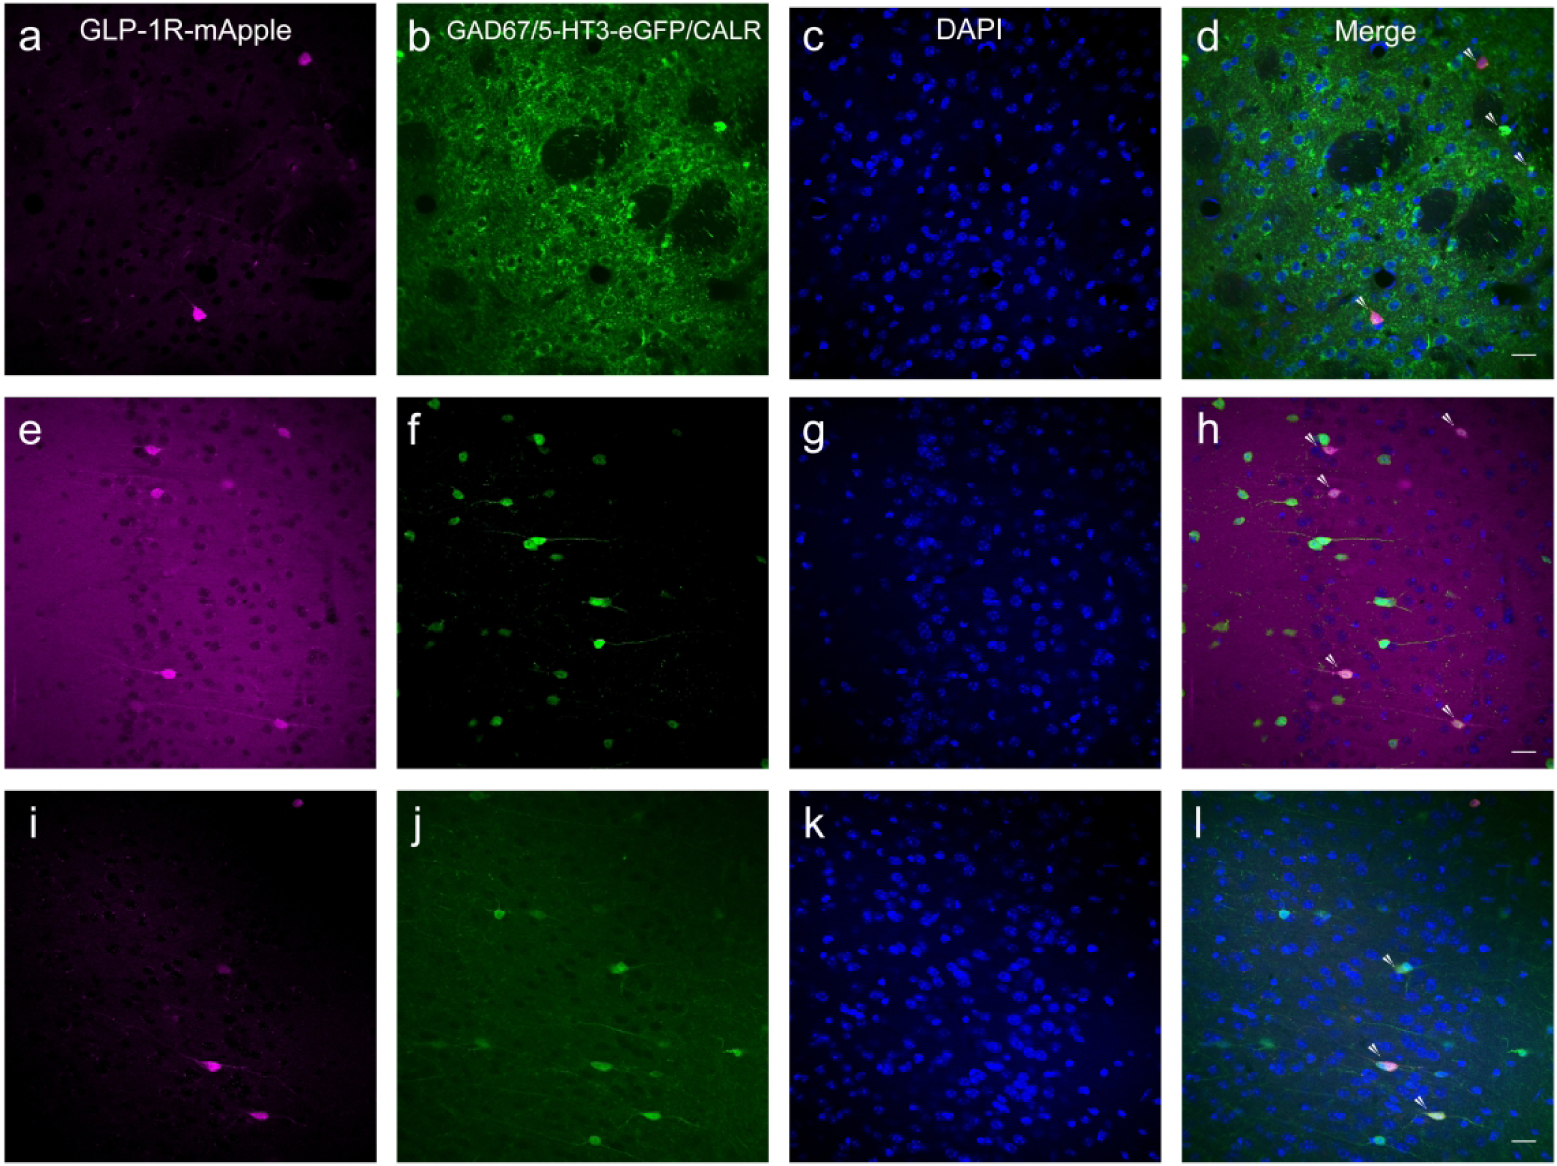
Figure 13:
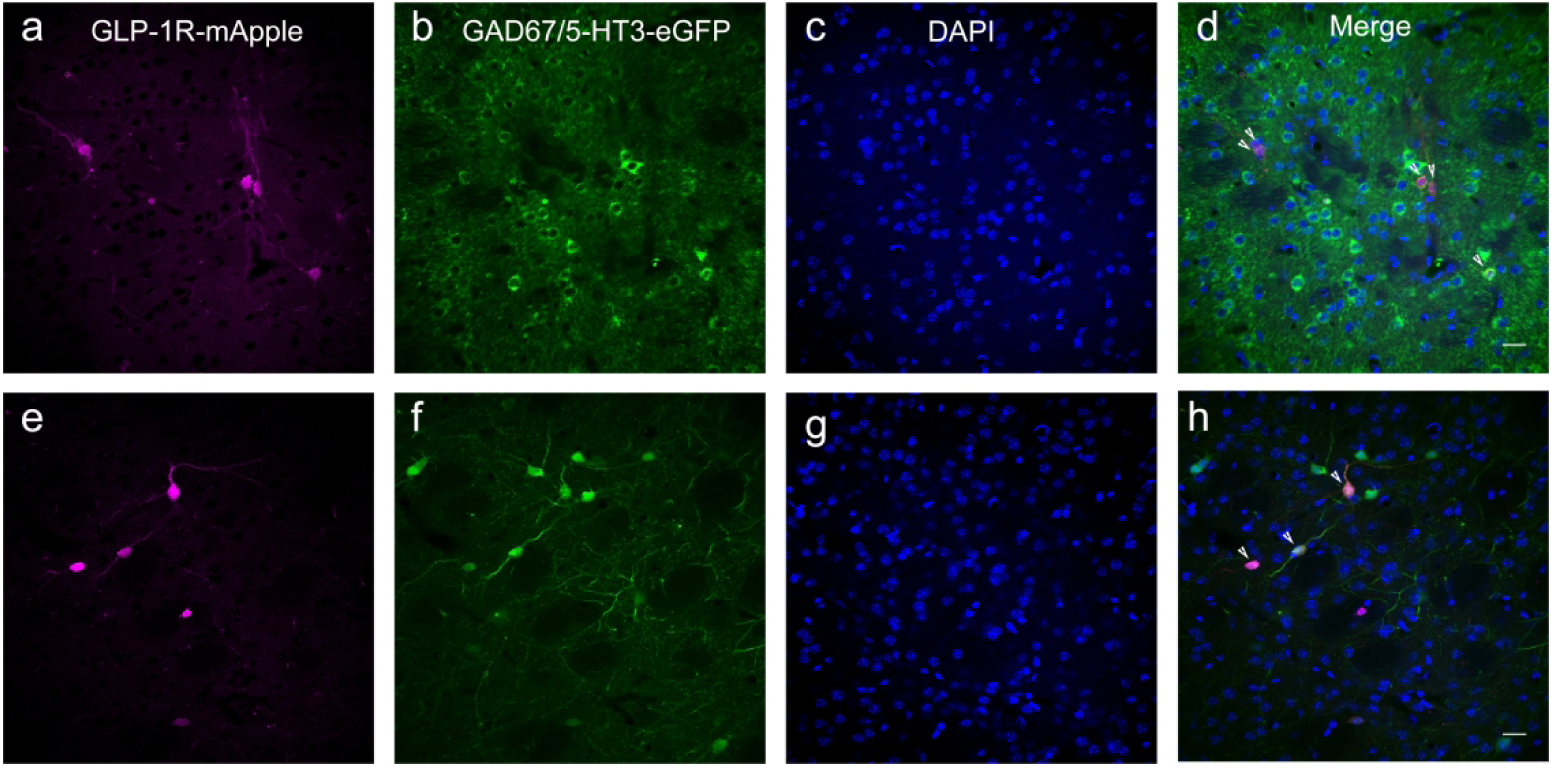
GLP-1R-mApple was expressed in GABAergic interneurons of the STR (a–d; GLP-1R-mApple, magenta; GAD67, green; DAPI, blue). Furthermore, these GABAergic cells were specifically 5-HT3R-expressing interneurons, as evidenced by utilizing crosses between the mApple and 5-HT3-eGFP mice (e–h; GLP-1R-mApple, magenta; 5-HT3-eGFP, green; DAPI, blue). Arrowheads indicate colocalized neurons. 20X magnification, 50 μm scale bar.
GLP-1R-mApple+ neurons were densely packed within the hilus—but sparsely within the molecular layer—of the dorsal DG of the hippocampus, but not within the CA1 and CA3 regions (Fig. 7b). Moving caudally within the coronal plane, positively labeled cells are found in the molecular layer of the ventral DG as well as in area CA3 (Fig. 7c). In situ hybridization, however, reports Glp1r expression within the molecular layer of the DG (Fig. 7d, dorsal DG). Caudally, GLP-1R cells can be found within the subiculum and entorhinal cortex as these regions become more prominent (data not shown).
Sensorimotor output and other miscellaneous functions:
As previously mentioned, GLP-1R-mApple expression was widespread throughout the hypothalamus; however, expression was scant within the thalamus, the other primary constituent of the diencephalon (Fig. 8). While not necessarily associated with energy homeostasis but rather as a relay center for sensorimotor signals to the cortex, the thalamus also exhibited some level of GLP-1R-mApple expression. Scattered labeling was apparent in the paraventricular thalamic nucleus (PVP) and parafasicular thalamic nucleus (PF). A distinct pattern of expression was evident surrounding the medial geniculate nuclei (MG) of the thalamus, in what could possibly be the triangular posterior thalamic nucleus (PoT) and the posterior intralaminar thalamic nucleus (PIL) (Fig. 8a). GLP-1R-mApple was expressed within the superior colliculus (sc), particularly within the optic nerve layer (Op) (Fig. 8b). Additionally, no GLP-1R-mApple+ cells were found in the reticular thalamus (Rt), a region involved in sensorimotor integration (Pinault, 2004), although GLP-1R-mApple+ neurons were evident near this region (Fig. 8c, PV in Rt). Expression of the receptor proxy was evident in the subcommissural organ, a circumventricular organ known to secrete proteins into the cerebrospinal fluid (data not shown). Another region associated with sensory signaling, the cerebellum contained expression within the pyramidal layers of the cerebellar lobules (Fig. 8d, shown with GAD67 in green). The NTS is the only region within the brain that can produce the GLP-1 peptide. We found moderate labeling of the GLP-1R marker within this region (Fig. 8d).The area postrema (AP) also demonstrated high levels of GLP-1R-mApple expression (Fig. 8d) with these neurons heavily surrounded by fiber tracts and cells expressing the 5-HT3 receptor (Fig. 8f), which contribute to nausea and emesis (Thompson & Lummis, 2006).
Figure 8:
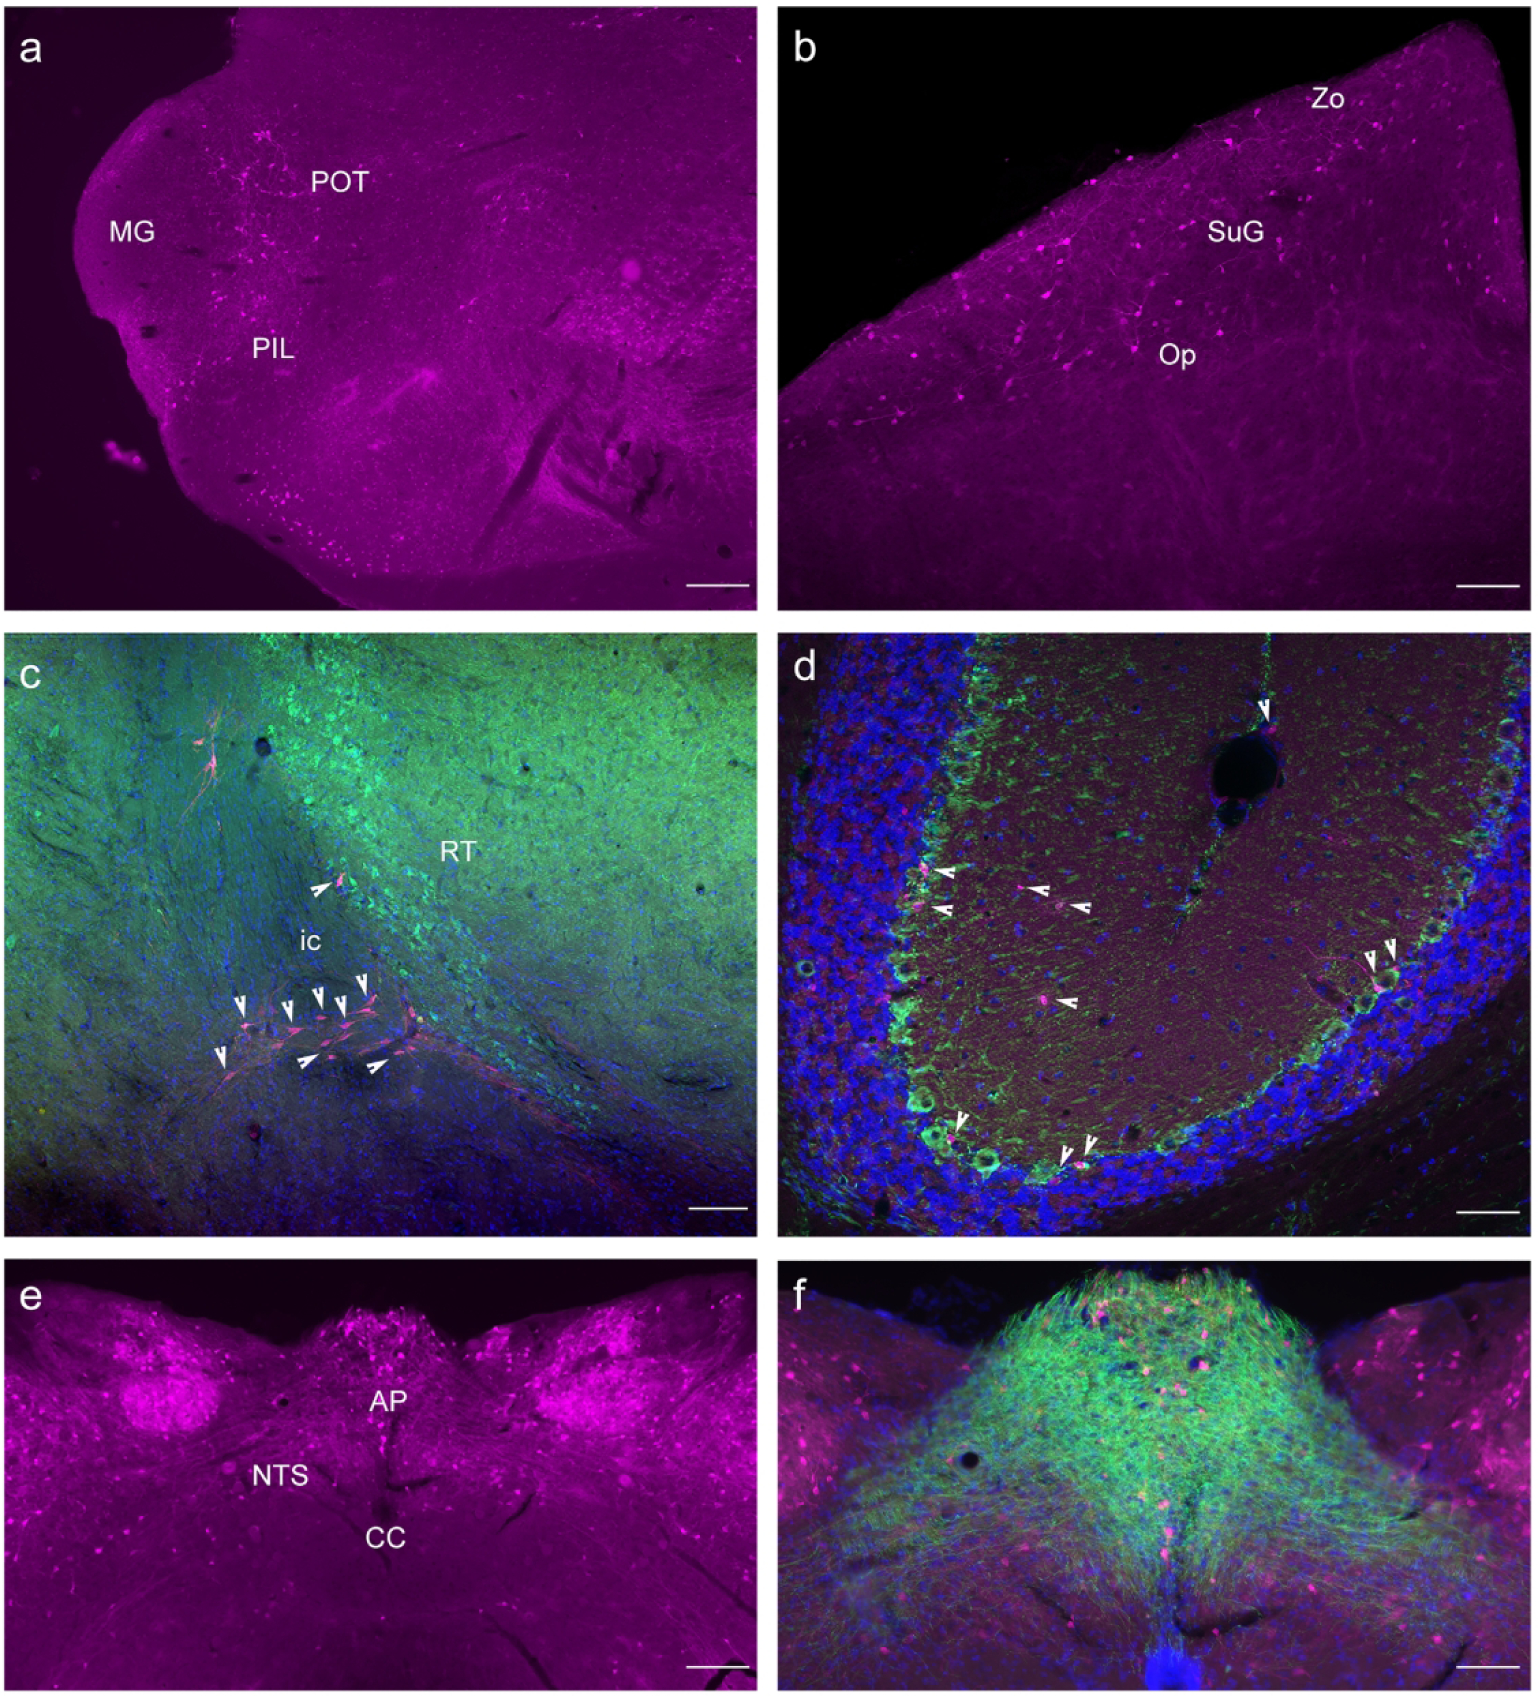
Thalamic expression of GLP-1R-mApple was found within the PoT (a; 5X magnification, 200 μm scale bar) as well as the sc, particularly the superficial gray and optic nerve layers (b, 10X magnification, 100 μm scale bar). GLP-1R-mApple was not present within the Rt, visualized via PV staining (green, c; 10X magnification, 100 μm scale bar). The cerebellum demonstrated little expression of the reporter (d, 20X, 50 μm scale bar; GAD67 in green, DAPI in blue). The NTS showed evidence of GLP-1R expression (e, 5X, 200 μm scale bar) which are surrounded by 5-HT3 receptor+ fiber tracts (f, 10X magnification, 100 μm scale bar).
Colocalization of GLP-1R-mApple and other cell markers:
We have determined that GLP-1Rs, as distinguished by mApple expression, are expressed in a large number of brain regions at varying levels. In order to further ascertain the functional role of GLP-1R within these regions, we used double-labeling IHC with a number of cellular markers to identify cellular specificity within particular regions of interest. Overall, we note that GLP-1R-mApple was expressed almost entirely in neurons, as determined by colocalization with NeuN (Fig. 9; 95.9%±0.5% examining AMY, CTX, DG, HYPO, STR, and LS). There was no colocalization of the mApple marker with the astrocytic marker GFAP in any area examined (Fig. 10; representative images from the LS). Furthermore, GLP-1R-mApple within the hypothalamus did not colocalize with vimentin, a marker of ependymal cells, another subcategory of glial cells that line the ventricles (Fig. 11).
Figure 9:
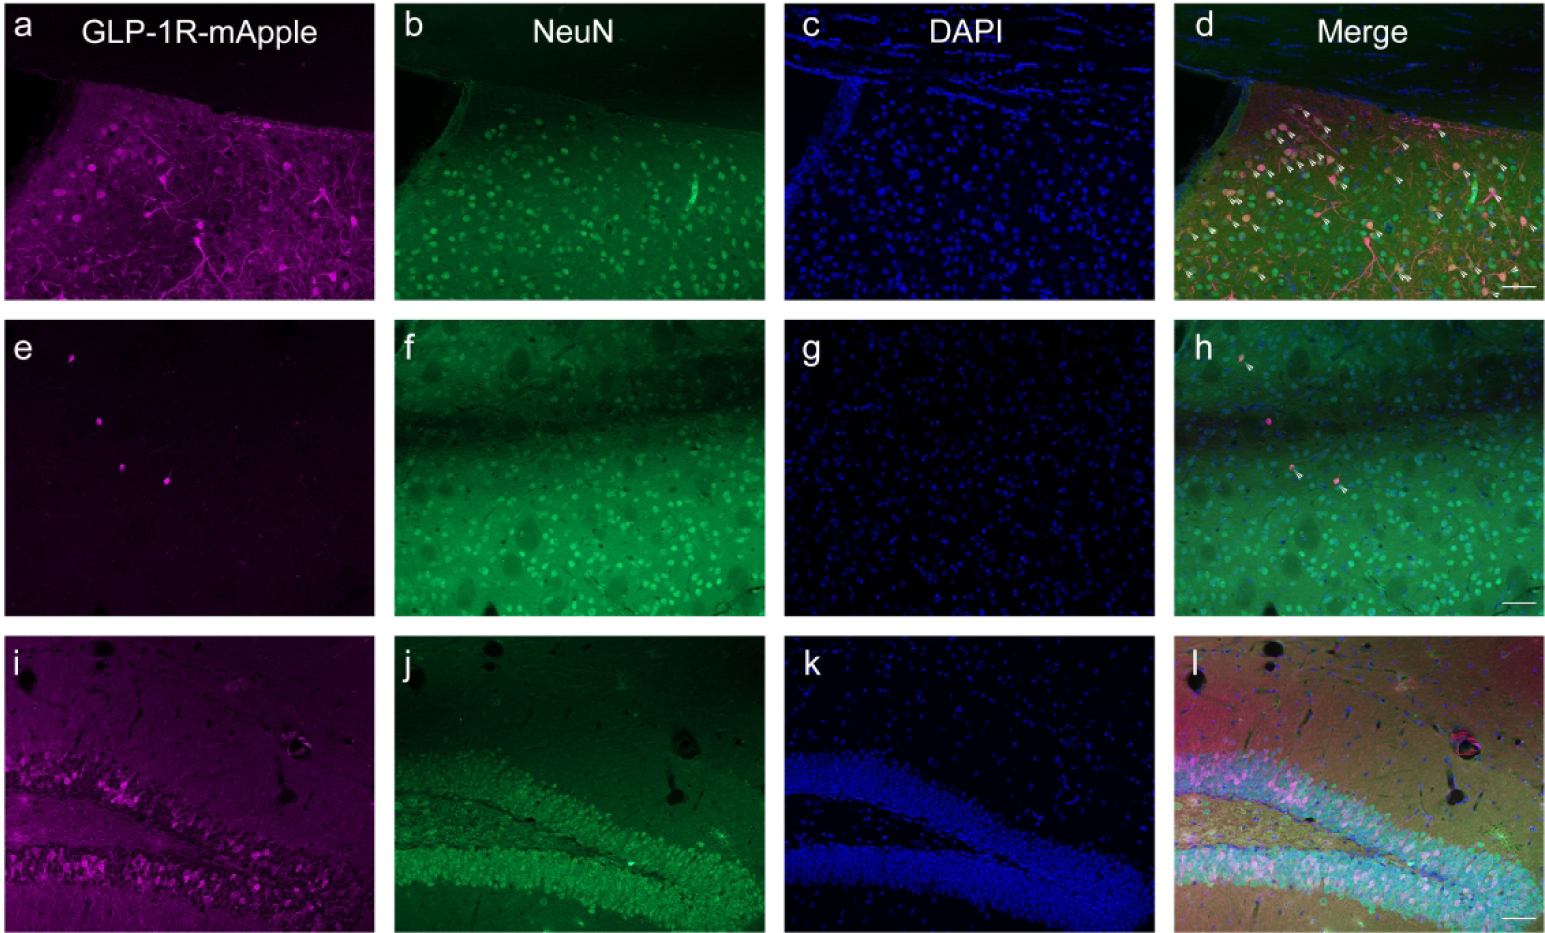
Antibodies against the GLP-1R-mApple reporter (magenta; a, e, i) and NeuN (green; b, f j) were used to show that the GPCR was expressed primarily within neuronal populations (d, h, l). Representative images are shown within the LS (a–d), STR (e–h), and dDG (i–l). DAPI is presented in blue (c, g, k). Arrowheads indicate colocalized cells. 20X magnification, 50 μm scale bar
Figure 10:
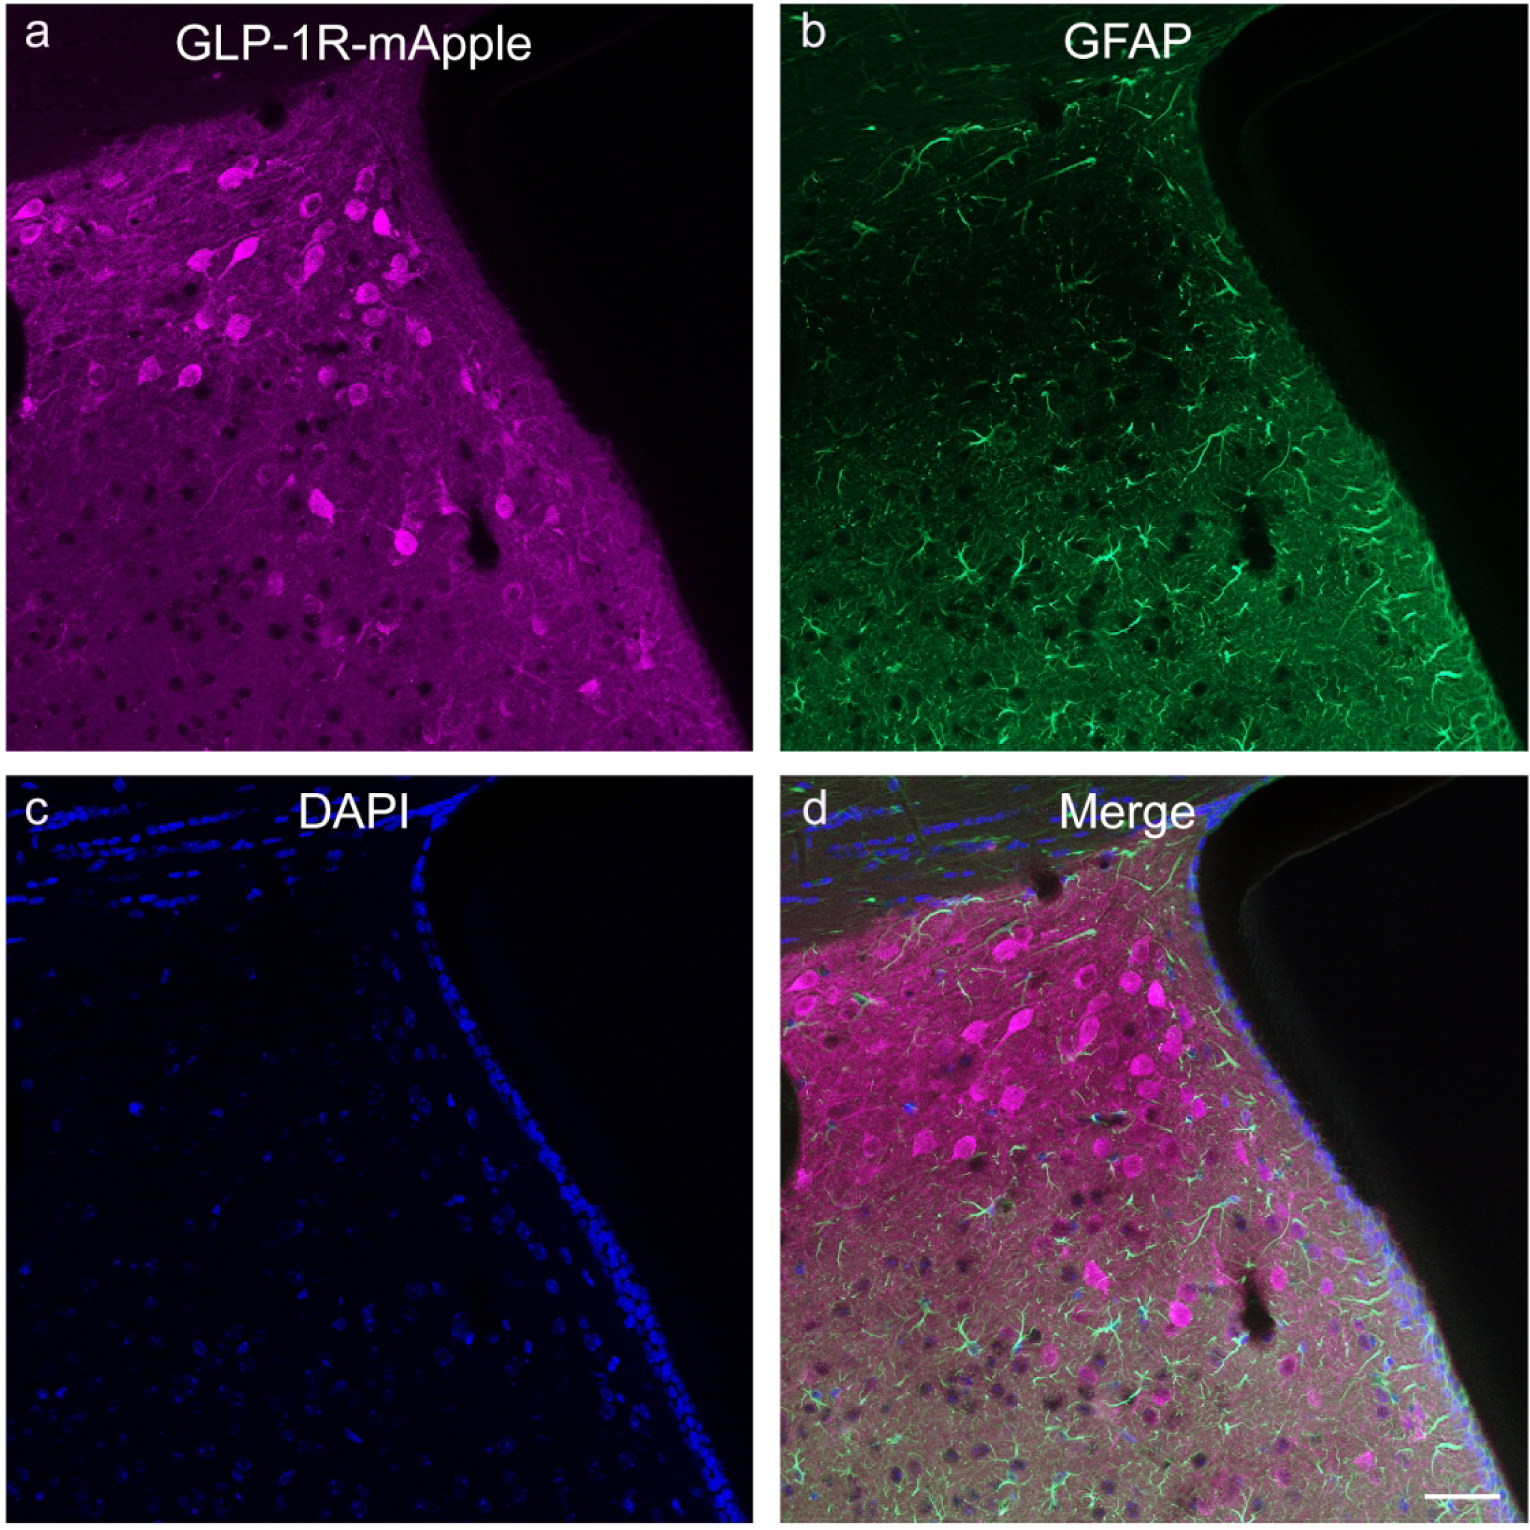
GLP-1R-mApple (a) was not expressed in GFAP+ cells (b), as depicted in the LS (d). DAPI is presented in blue (c). 20X magnification, 50 μm scale bar.
Figure 11:
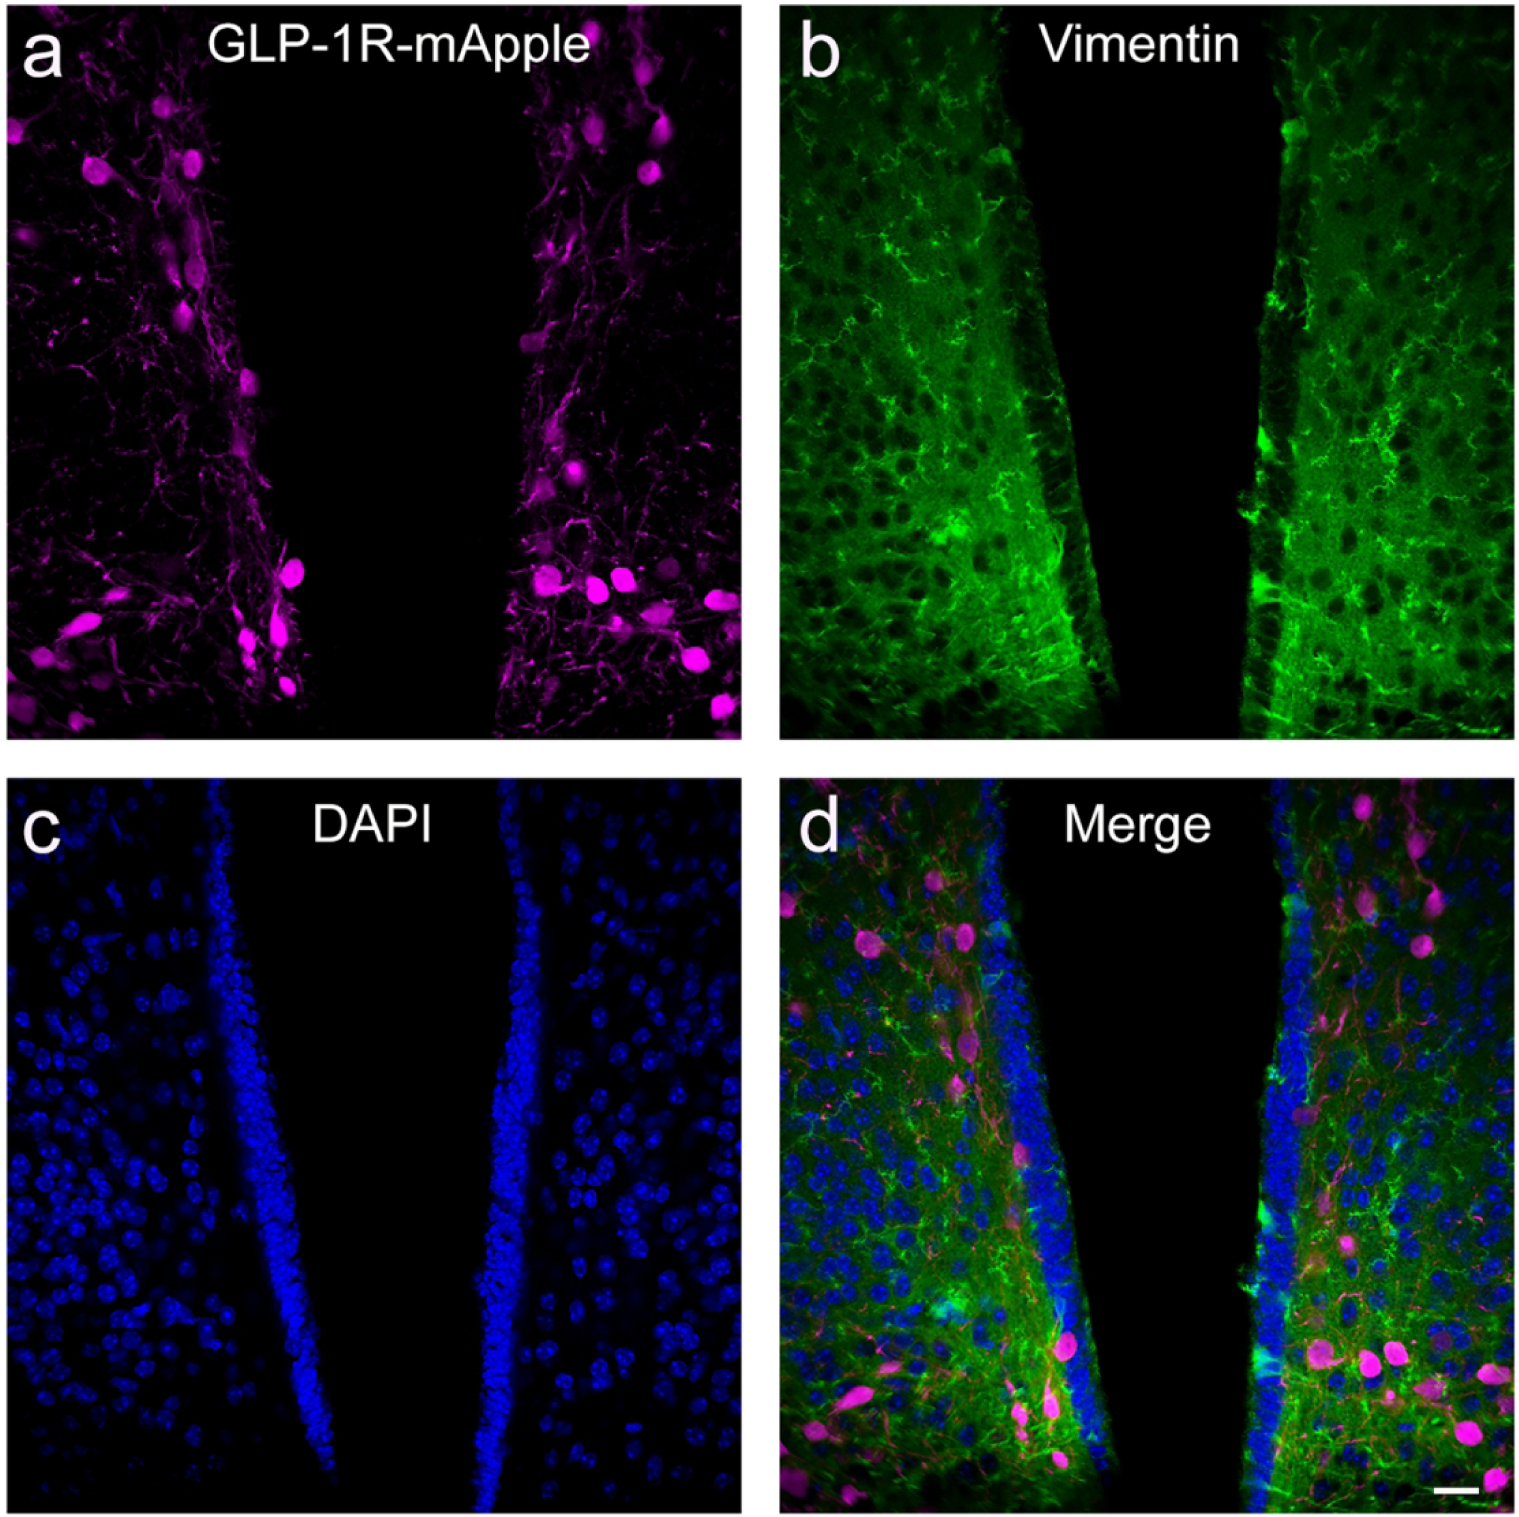
The GLP-1R-mApple transgene (a, magenta) did not colocalize (d) with ependymal cells as indicated by vimentin (b, green) in the hypothalamus. DAPI is in blue (c). 40X magnification, scale bar = 20 μm.
Given the purported role of GLP-1R and drug reward, as well as its expression within the mesolimbic DAergic circuitry, we evaluated the presence of GLP-1R-mApple with a number of markers for DAergic and dopaminoceptive neurons. As previously reported, there was no colocalization of mApple with tyrosine hydroxylase (TH) within midbrain neurons of the VTA and the SNc/r, although GLP-1R-mApple+ neurons were observed in the surrounding regions (Cork et al., 2015). This is in contrast to Hernandez et al., whereby fluorescein-tagged GLP-1R agonist bound to TH+ neurons within the VTA (Hernandez et al., 2018); the difference in species (mouse vs. rat) may account for these differences. These mApple+ cells colocalized with GAD67, indicating that they are GABAergic. However, we noted a dense plexus of mApple+ fibers surrounding the TH+ neurons within the midbrain, indicating a presynaptic role of GLP-1R on drug reward within this region (Fig. 6a–c). Similarly, GLP-1R+ neurons were observed near TH+ neurons within the vPAG (not shown). Within the STR and NAc, GLP-1R+ neurons were surrounded by axon terminals stained against not only TH, but also the DA transporter (data not shown). These mApple+ neurons did not colocalize with DARPP-32, a marker for dopaminoceptive neurons (Fig. 12a–d), nor did they colocalize significantly with neurons containing the DA D1 and D2 receptors by using brains resulting from GLP-1R-mApple × D1-eGFP or D2-eGFP crosses (Fig. 12e–h and i–l, respectively).
Figure 12:
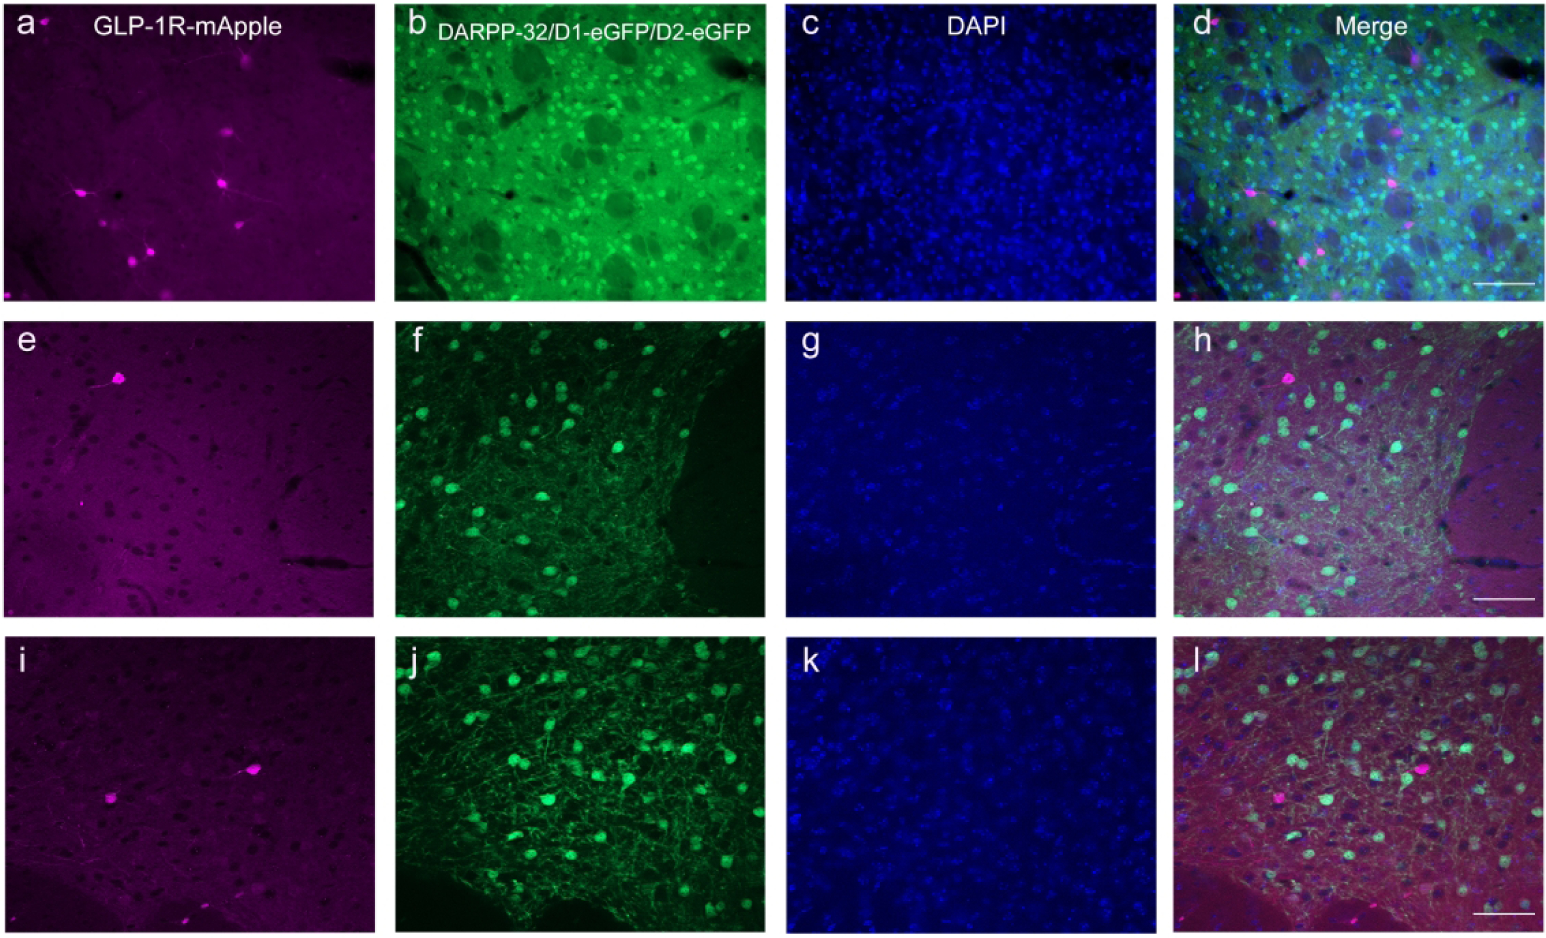
GLP-1R+ cells (a) were not expressed in targets of DAergic projections, as determined by lack of colocalization with DARPP-32 (b, green) within the STR. 10X magnification, 100 μm scale bar. Additionally, there was no colocalization (h, l) of GLP-1R-mApple (e, i) with either the D1R (f) or D2R (j) within the NAc using GLP-1R-mApple mice crossed with either D1- or D2-eGFP mice. 20X magnification, 100 μm (a–d) and 50 μm (e–l) scale bars. DAPI is depicted in blue (c, g, k).
Given that the vast majority of neurons within the caudate putamen are GABAergic, we examined colocalization of GLP-1R-mApple neurons with GAD67, a marker for GABA+ cells. Nearly all mApple neurons within the STR and NAc were GABAergic (92.6%±0.4%, or 18 cells/mm2 ± 0.3 cells/mm2, Fig. 13a–d). It is likely that all GLP-1R-mApple+ neurons in the caudate-putamen are GABAergic, but due to detergent sensitivity and incomplete somal labeling with the GAD67 antibody, this incomplete colocalization might be due to underrepresentation of GAD67+ cells (Graham et al., 2015). Given the lack of colocalization with DARPP-32 and DA receptors, it is most likely that these GABAergic cells were interneurons. Therefore, we stained against a number of GABAergic interneuron markers. There did not appear to be any colocalization of the GLP-1R marker with PV, CALB, CALR, or SST in the caudate putamen (data not shown). However, by crossing the GLP-1R-mApple BAC mouse with a mouse hemizygous for the 5-HT3-eGFP BAC transgene, whereby expression of a green fluorescent protein is driven by the 5-HT3 receptor promoter, we found that a large number of mApple+ GABAergic neurons co-expressed the 5-HT3 receptor (61.8%±8.2%, or 12.7 cells/mm2 ± 2.4 cells/mm2, Fig. 13e–h), which labels a distinct subset of striatal GABAergic interneurons (Munoz-Manchado et al., 2016). Furthermore, GLP-1R was not found within cholinergic interneurons, as determined by a lack of colocalization with the marker ChAT (data not shown).
We next examined the frontal cortex, which had a small number of mApple-expressing neurons, especially within the superficial layers. As with the dorsal and ventral striatum, GLP-1R-mApple+ neurons within the anterior cingulate cortex (ACC), for instance, were also GABAergic (93.4%±1.1%, or 14.3 cells/mm2±0.5 cells/mm2). This expression pattern was consistent throughout the cortex (SSC, Fig. 14a–d). Furthermore, a majority of the mApple+ neurons co-expressed 5-HT3R (83.2%±5.3% or 18.2 cells/mm2±1.8 cells/mm2; Fig. 13e–h). As in the striatum, the 5-HT3 receptor labels a specific group of GABAergic interneurons within the neocortex (Lee et al., 2014; Rudy et al., 2011). Moreover, it is known that a subset of 5-HT3 receptor+ interneurons within the cerebral cortex co-express CALR (Morales & Bloom, 1997; Qu et al., 2016). As such, we found a similar level of colocalization with mApple and CALR (82.5%±2.6%, or 19.1 cells/mm2±4.9 cells/mm2) relative to mApple and 5-HT3 receptor (ACC, Fig. 14i–l). No co-expression of mApple was demonstrated with PV, SST, or CALB.
Figure 14:
GLP-1R-mApple (a; magenta) was expressed in GABAergic interneurons within the SSC, similarly to other cortical subregions (a–d; GAD67, green; DAPI, blue). These GABAergic GLP-1R+ neurons in the ACC (shown) and in other cortical regions were specifically 5-HT3R+ cells (e–h; GLP-1R- mApple, magenta; 5-HT3-eGFP, green, DAPI, blue). 5-HT3R+ cells within the cortex often co-express CALR. We show in the ACC that GLP-1R-mApple is expressed within CALR+ neurons in this region as well (i–l; GLP-1R- mApple, magenta; CALR, green; DAPI, blue). 20X magnification, 50 μm scale bar. Arrowheads indicate colocalization.
The LS was also examined, given that it has perhaps the highest expression of GLP-1R within the brain. As with the caudate putamen and frontal cortex, GAD67 was co-expressed within nearly all GLP-1R-mApple neurons (98.4%±0.6% or 265.4 cells/mm2±30.8 cells/mm2, see Fig. 1A for Glp1r transcript expression). Unlike the aforementioned regions, the GABAergic mApple+ cells did not express the 5-HT3 receptor appreciably (0.16%±0.04% or 0.5 cells/mm2±0.1 cells/mm2). Some of these neurons co-expressed CALB (6.6%±0.7% or 18.1 cells/mm2±3.0 cells/mm2, Fig. 15a–d). Both the dopamine D1 and D2 receptors are highly expressed within the LS, so we again examined co-expression of GLP-1R-mApple with either D1-eGFP or D2-eGFP. A small percentage of neurons with the LS expressed both GLP-1R-mApple and D1-eGFP (4.8%±1.2% or 12.8 cells/mm2±4.1 cells/mm2, Fig. 15e–h). However, a greater proportion of GLP-1R-mApple neurons co-expressed D2-eGFP (10.7%±0.2% or 31.5 cells/mm2±6.0 cells/mm2, Fig. 15i–l). Using RNAScope we found that within the LS, Drd2 mRNA was coexpressed in 20.6%±0.5% of all cells expressing the Glp1r transcript (data not shown).
Figure 15:
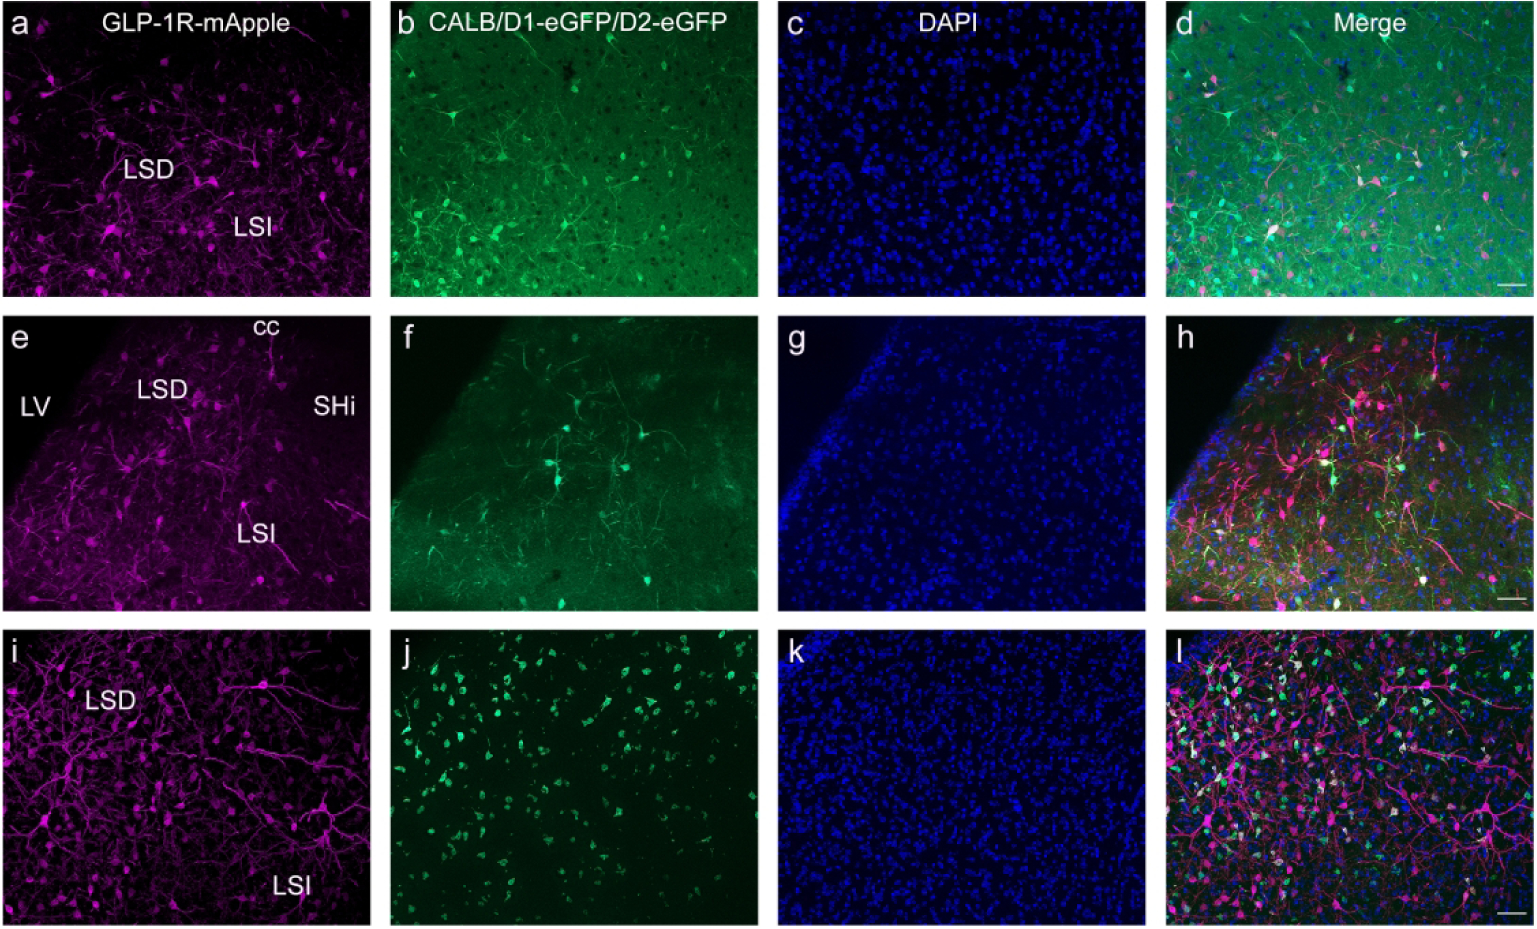
Within the LS, GLP-1R-mApple (a, e, i) was colocalized with several different subtypes of GABAergic neurons, including CALB (b), D1R (f, using D1-eGFP intercrosses), and D2R (j, using D2-eGFP intercrosses). DAPI is shown in blue (c, g, k). 20X magnification, 50 μm scale bar. Arrowheads indicate colocalized neurons.
Similar to the cortex and LS, the GLP-1R-mApple neurons within the CEA coexpressed GAD67, as GABAergic neurons are the primary cell type within this region. RNAScope assay confirmed Glp1r colocalization with Gad1 transcript (white arrowheads) with minimal expression in glutamatergic neurons (yellow arrowheads) as well, as assessed by Slc17a6 (Vglut2) expression (Fig. 16a–d). In the MeA, however, the Glp1r+ neurons primarily colocalized with the glutamatergic transcript (yellow arrowheads) with minimal overlap with Gad1 (white arrowheads; Fig. 16e–h). A similar co-expression pattern was also seen in the hypothalamus. Glp1r was highly expressed in both Gad1- and Slc17a6-expressing neurons, indicating that GLP-1R is expressed in both excitatory (yellow arrowheads) and inhibitory (white arrowheads) neurons (Fig. 16i–l). However, within the DG of the hippocampus, GLP-1R-mApple+ neurons were surrounded by GAD67+ terminals but were not GABAergic in and of themselves. We thus used an antibody against CAMKII, a marker for glutamatergic (pyramidal) cells within the cortex and hippocampus. The GLP-1R-mApple cells colocalized with CAMKII, indicating that these cells are indeed glutamatergic (Fig. 17). Interestingly, within the LS, approximately 18.3%±1.4% (or 44.0 cells/mm2±6.0 cells/mm2 of GLP-1R-mApple neurons co-expressed CAMKII, although within this region, CAMKII is not considered a marker of glutamatergic neurons (X. Wang et al., 2013). RNAScope assays corroborated these findings as well, with Glp1r and Slc17a6 transcript present within the same cell and little to no colocalization of Glp1r and Gad1 within the DG. Within the DG we used an antibody against DCX to label immature neurons. DCX-labeled cells lined the interior of the DG’s granule cell layer (Fig. 18). Interestingly, these emergent neurons were surrounded by densely packed GLP-1R-mApple cell bodies.
Figure 16:
RNAScope assays revealed that within the CeA (a–d), Glp1r (a) was colocalized within Gad1-expressing neurons (c, GABAergic), which are the primary cell type within this region, with minimal expression within glutamatergic neurons (b, Slc17a6 or Vglut2). However, within the MeA (e–h), Glp1r (e) was found to be colocalized within excitatory glutamatergic (f, Vglut2) neurons but not Gad1+ neurons (g). Subpopulations of Glp1r (i) colocalized with both Vglut2- (j) and Gad1-expressing neurons (k) in the hypothalamus. Glp1r, magenta (a, e, i); Slc17a6 or Vglut2, green (b, f, j); Gad1, blue (c, g, k). 20X magnification; 50 μm scale bar. White arrowheads indicate cells that coexpress Glp1r and Vglut1; yellow arrowheads, Glp1r and Gad1.
Figure 17:
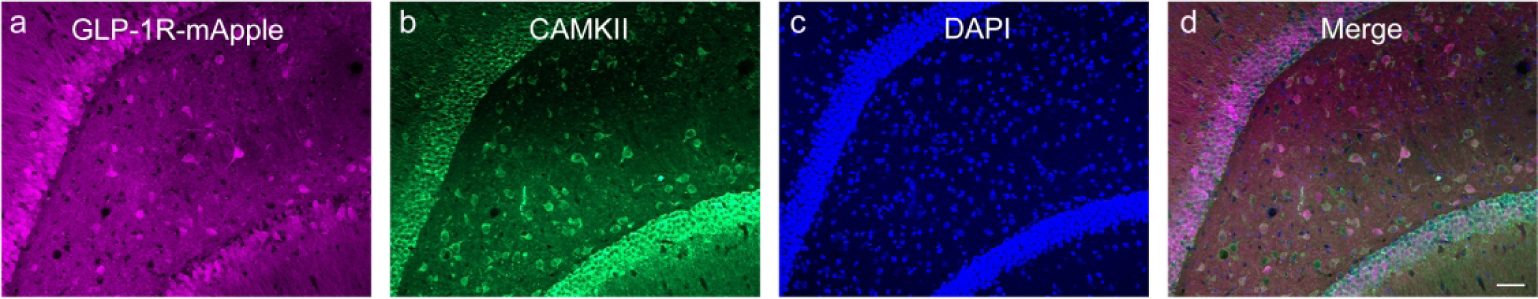
Within the hippocampus, GLP-1R-mApple (a) was colocalized within CAMKII+ neurons (b), indicating that these cells are glutamatergic. DAPI is shown in blue (c). 20X magnification, 50 μm scale bar.
Figure 18:
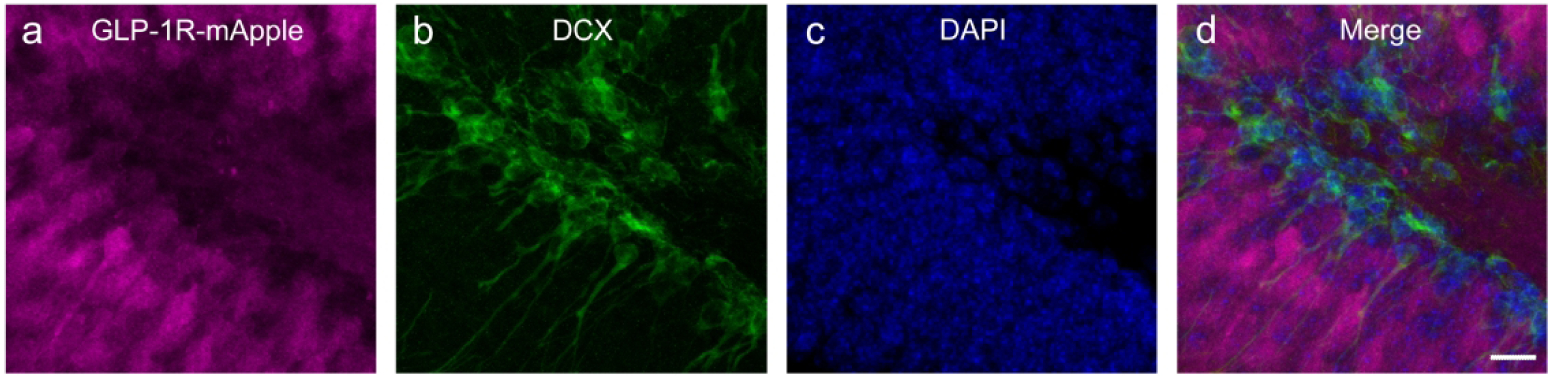
Within this model of GLP-1R expression, GLP-1R-mApple-expressing cells (a) were found to be juxtaposed against DCX+ neurons (b), indicating a potential role in GLP-1R activation in neurogenesis. DAPI is shown in blue (c). 126X magnification, 30 μm scale bar.
Fidelity of the GLP-1R-mApple BAC mice:
To determine the reliability and specificity of this mouse model and our immunohistochemical staining, we performed some control experiments. First, we demonstrated that the mApple staining was specific to Glp1r promoter-driven mApple expression and not due to a lack of specificity of the anti-dsRed primary antibody. No staining was visible using this antibody on WT tissue (Fig. 19a). Furthermore, at least in fixed tissue, the dsRed antibody amplification is necessary to visualize GLP-1R-mApple+ neurons, as histology without use of the primary antibody does not result in any appreciable staining (Fig. 19b). Finally, we performed an RNAScope assay in conjunction with immunohistochemistry in GLP-1R-mApple mice. Optimal tissue preparation and assay conditions differ for the in situ hybridization and immunohistochemical approaches, and the immunohistochemical staining of mApple was substantially reduced as compared to our normal labeling conditions. This decreased signal is most likely due to the harsh conditions associated with this combined protocol. Regardless, the vast majority of GLP-1R-mApple+ cells also expressed detectable levels of the Glp1r transcript (95%±2.9% in the LS, N=3; Fig. 20a–d). In comparison to other transgenic models of GLP-1R, we compared a number of regions where there were discrepancies between our model and those of others (Table 4). For instance, we found no expression of GLP-1R-mApple in areas such as the lateral habenula and the ventral posteriomedial thalamus, whereas Cork et al., found significant expression of their marker in these regions. The dual labeling technique demonstrates no significant expression of either GLP-1R-mApple or Glp1r in these regions (Fig. 20e–h, ventral posteriomedial thalamus). These data indicate that the GLP-1R-mApple mouse is a reliable indicator of GLP-1R expression within the brain regions we examined.
Figure 19:
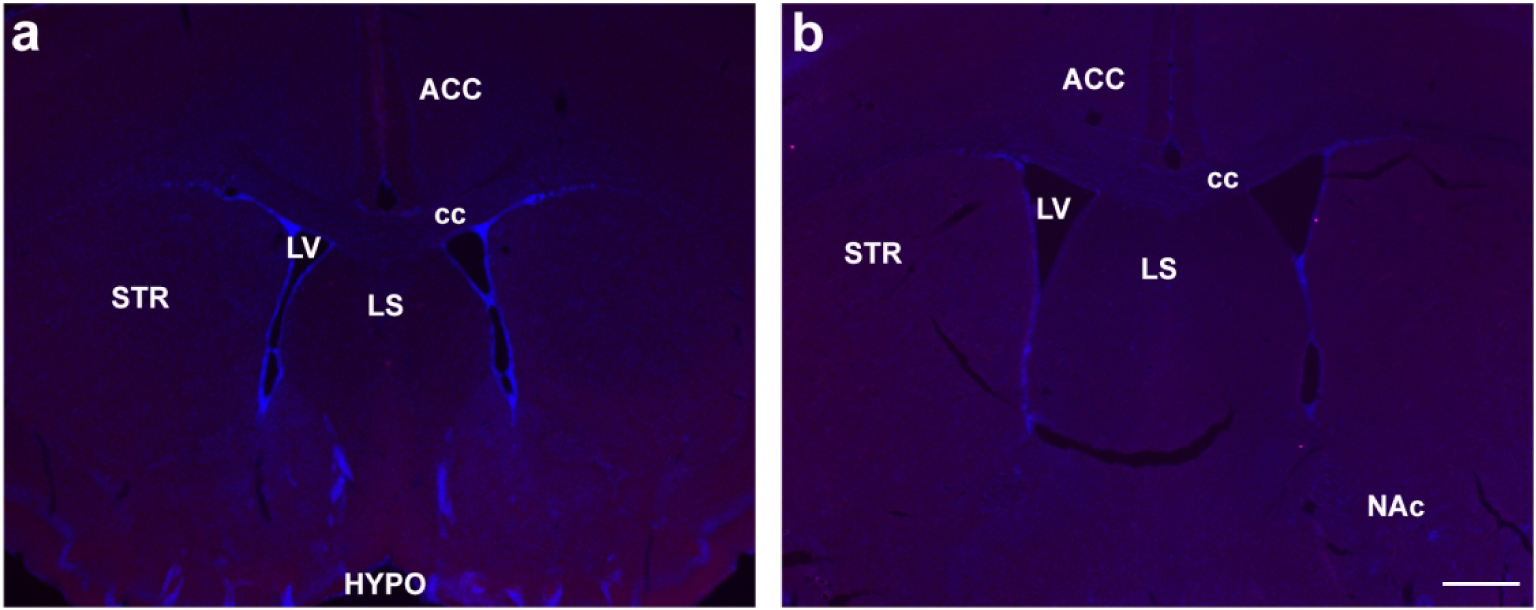
There was no expression of GLP-1R-mApple in WT tissue (a, magenta), nor could the expression in the transgenic model be attributed to non-specific reactivity to the α-dsRed antibody, (b, no primary antibody used in GLP-1R-mApple tissue). Images are shown with DAPI (blue). 2.5X magnification, scale bar = 500 μm.
Figure 20:
GLP-1R-mApple (magenta: a, e) colocalized with Glp1r transcript (green: b, f) in a immunohistochemistry-in situ combined assay within the LS (a–d). There was no expression of either marker in the ventral posteriomedial thalamic nucleus (e–h). DAPI is shown in blue (c, g). 40X magnification, scale bar = 20 μm
Table 4:
Comparison of expression of GLP-1R-mApple+ cells compared to the previously published mouse transgenic model [(Cork et al., 2015)] and RNA transcript in rat [(Merchenthaler et al., 1999)]. Table modified from (Cork et al., 2015). ND = not determined.
| GLP-1R-mApple model | Cork, et al. (2015) transgenic mouse | Merchenthaler, et al. (1999) rat in situ | |
|---|---|---|---|
| Telencephalon | |||
| Olfactory | |||
| Granule cell layer | ++ | ++ | ND |
| Anterior olfactory area | |||
| Dorsal | + | ++ | ND |
| Lateral | + | +++ | ND |
| Ventral | + | +++ | ND |
| Nucleus accumbens | +a | ||
| Shell | + | + | |
| Core | + | + | |
| Islands of Calleja | +++ | ND | ND |
| Ventral tenia tecta | ++ | ++ | ND |
| Claustrum | +++ | ++ | ND |
| Lateral Septum | |||
| Intermediate | ++ | ++ | ++ |
| Dorsal | ++++ | ++++ | ND |
| Ventral | ++++ | +++ | ND |
| Medial Septum | + | ND | ND |
| Subfornical organ | ++++ | ++++ | ND |
| Triangular septal nucleus | ++++ | ND | ND |
| Cortex | + | + | −a |
| Cingulate | + | + | |
| Piriform | ++ | ++ | |
| Bed nucleus of the stria terminalis | +++ | +++ | + |
| Septohypothalamic nuclei | ++ | ++ | ND |
| Preoptic area | |||
| Medial | + | + | ND |
| Lateral | ++ | + | ND |
| Ventral | ++ | ++ | ND |
| Median | +++ | ++ | ND |
| Hippocampus | |||
| CA3 | |||
| Rostral (Dorsal) | − | + | − |
| Caudal (Ventral) | +++ | +++ | + |
| CA1 (Caudal/Ventral) | + | ++ | ND |
| Dentate gyrus | +++ | ++ | ND |
| Central Amygdala | +++ | ++++ | − |
| Medial Amygdala | ++ | +++ | − |
| Basolateral Amygdala | − | ++ | ND |
| Cortical Amygdala | + | ++ | ND |
| Organum vasculosum laminae terminalis | ++ | + | ND |
| Diencephalon | |||
| Thalamus | |||
| Anterior thalamic nuclei | − | +++ | − |
| Ventral posteriomedial thalamic nuclei | − | +++ | ND |
| Paraventricular nucleus | + | + | ND |
| Geniculate nucleus | |||
| Dorsolateral | + | ++ | ND |
| Pregeniculate | + | ++ | ND |
| Medial | ++ | ++ | ND |
| Zona incerta | ++ | +++ | ++ |
| Nucleus reuniens | + | ++ | + |
| Parasubthalamic nucleus | + | + | ND |
| Ventral anterior thalamic nucleus | + | +++ | ND |
| Posterior thalamus | ++ | +++ | ND |
| Parafascicular thalamic nucleus | ++ | ++ | +++ |
| Precommissural nucleus | +++ | +++ | ND |
| Mediodorsal nucleus | +++ | ++++ | ND |
| Ventromedial thalamic nucleus | + | ++ | ND |
| Lateral habenular nucleus | − (++ fibers) | ++ | ND |
| Medial habenular nucleus | − (++++ fibers) | ND | ND |
| Thalamic reticular formation | + | ++ | ND |
| Hypothalamus | |||
| Anterior hypothalamus | + | ++ | ND |
| Dorsomedial hypothalamus | +++ | ++ | + |
| Paraventricular nucleus | +++ | +++ | ++++ |
| Arcuate nucleus | +++ | +++ | ++++ |
| Lateral Hypothalamus | ++ | ++ | + |
| Posterior hypothalamus | + | ++ | ND |
| Suprachiasmatic nucleus | ++ | +++ | ND |
| Retrochiasmatic nucleus | +++ | +++ | ND |
| Accessory neurosecretory nuclei | ++ | ++ | ND |
| Ventromedial hypothalamus | +++ | +++ | + |
| Mesencephalon | |||
| Periaqueductal grey | ++ | +++ | +++ |
| Premamilliary nucleus | ++ | + | ND |
| Mammilliary nucleus | +++ | ++ | ND |
| Posterior commissure | +++ | +++ | ND |
| Pretectal nucleus | |||
| Anterior | ++ | ++ | ND |
| Medial | ++ | +++ | ND |
| Posterior | ++ | +++ | ND |
| Olivary | ++ | +++ | ND |
| Superior colliculus | ++ | +++ | ++ |
| Ventral tegmental area | + | + | ++ |
| Substantia nigra | ++ | ND | ND |
| Parasubthalamic nucleus | ++ | ++ | ND |
| Brainstem | |||
| Area postrema | ++++ | ++++ | ++++ |
| Nucleus tractus solitarius | + | + | +++ |
| Nucleus of Roller | + | + | ND |
| Reticular formation | ++ | ++ | ND |
| Rostral ventrolateral medulla | ++ | ++ | ND |
| Locus coeruleus | ++ | ++ | ND |
transcript data in rat is further divided into subregions.
Discussion
The importance of the GLP-1R within the CNS has exploded in recent years, as data have ascribed a preeminent role in a number of functions related to human health. Thus, determining the localization of the GLP-1R within the brain, as well as its cellular specificity, is of the utmost importance. However, GPCRs are extraordinarily difficult to label, and commercial antibodies specific to GLP-1Rs are unavailable at this time. Thus, we developed this BAC transgenic mouse model whereby mApple, a red fluorescent protein, is used as a proxy for GLP-1R expression. Our data confirm and expand upon previous findings by others demonstrating Glp1r transcript and binding (Alvarez et al., 2005; Goke et al., 1995; Merchenthaler et al., 1999) as well as another model of Glp1r-driven expression via a fluorescent protein (Cork et al., 2015; Richards et al., 2014). A comparison of expressions patterns of the GLP-1R-mApple mouse model to that of the previously published transgenic mouse model (Cork et al., 2015) and to the transcript data from rat (Merchenthaler et al., 1999) is shown in Table 4.
We have documented GLP-1R expression within regions of the brain associated with food and drug reward, cognitive function, energy homeostasis, and sensorimotor integration, confirming research implicating GLP-1R in these functions (Dickson et al., 2012; Dossat et al., 2011; Egecioglu, Engel, et al., 2013a, 2013b; Egecioglu, Steensland, et al., 2013; Graham et al., 2013; Kreitzer, 2009; Reddy et al., 2016; Sørensen et al., 2015). Overall, a majority of these expression patterns corroborate with those noted by Cork et al. (2015), confirming the reliability of this BAC transgenic model. Briefly, GLP-1R was highly expressed in regions such as the LS, hippocampus, BNST, and the amygdala (CeA and MeA), with scattered expression elsewhere (e.g., caudate putamen, frontal cortex, olfactory bulb, thalamus, cerebellum, etc.). Similarly, both models show extensive expression of their respective GLP-1R proxies throughout the extent of the hypothalamus, a region in which GLP-1R plays a central role in feeding behavior and energy homeostasis. In particular, large numbers of neurons with the Glp1r-driven tag were expressed in the DMH, VMH, Arc, and PVN. Interestingly, alterations to GLP-1Rs within each of these regions have been associated with changes in not only food intake, but also body weight, brown adipose tissue thermogenesis, glucose homeostasis, and energy expenditure (Beiroa et al., 2014; Burmeister, Ayala, et al., 2017; Burmeister, Brown, et al., 2017; Dalvi et al., 2012; S. J. Lee et al., 2018; Liu et al., 2017). We also demonstrate that many GLP-1R-mApple+ neurons were GABAergic, a finding that—at least in some subregions such as the DMH—has been established at the transcript level (S. J. Lee et al., 2018). However, others note that GLP-1R co-expressed in glutamatergic—not GABAergic—neurons within the hypothalamus and other extrahypothalamic regions are responsible for the physiological functions of GLP-1R agonists (Adams et al., 2018). These findings of divergent colocalization patterns concur with observed GLP-1R expression in the hypothalamus in the current reporter mouse and RNAScope results. Further research is necessary to determine the diverse functions of GLP-1Rs within this region.
There were a few modest areas of conflict between these two models, however. For instance, the previous study found little to no expression of GLP-1R within the hilar layer of the DG of the hippocampus. However, we found significant expression here. This discrepancy might be considered a false positive in our model. However, Glp1r transcript is expressed within a small number of cells within this region of the DG according to the Allen Brain Atlas (Lein et al., 2007), a finding that we confirmed via in situ hybridization (Fig. 1). This suggests greater sensitivity of reporter readout in the current BAC mice. Furthermore, data from Hölscher et al. document that GLP-1R activation increases neurogenesis within the DG, suggesting that GLP-1R modulates this phenomenon directly (Hamilton et al., 2011; Holscher, 2012; Hunter & Holscher, 2012; McClean et al., 2015; McGovern et al., 2012). We have provided evidence that GLP-1R-mApple+ neurons within this region are in direct apposition to DCX+ cells, indicating that these GLP-1R-expressing neurons are mature granule cells and not newborn neurons; further research exploring this concept is required. GLP-1R activation has been shown to have an antidepressant effect (Anderberg et al., 2016; Sharma et al., 2015), implicating a role for GLP-1R in the modulation of mood disorders. In fact, a clinical trial was recently completed exploring this possibility (University Health Network Toronto). Moreover, the differential distribution of the receptor within the hippocampus (predominantly in the hilus of the DG dorsally, but also in the DG molecular layer) indicates that GLP-1R within the hippocampus has distinct functional roles. Even more so, the DG was one of the few regions examined wherein GLP-1R-mApple neurons were glutamatergic—not GABAergic—neurons. This is especially interesting as GLP-1R activation has been shown to have divergent effects in these regions. Several have shown that within the amygdala, specifically the CEA, GLP-1R activation induces an anxiety-like phenotype (Anderberg et al., 2016; Kinzig et al., 2003), while others, as previously mentioned, have noted an antidepressant-like effect, with some data suggesting that this is mediated via the hippocampus (Anderberg et al., 2016; Holscher, 2012; Sharma et al., 2015). Thus, the role of GLP-1R within these regions is an interesting result that merits further examination.
One of the most intriguing findings from this mouse model of GLP-1R expression is the colocalization of GLP-1R on GABAergic interneurons—specifically the 5-HT3a receptor-expressing subset—within the caudate putamen and frontal cortex. This ionotropic receptor has previously been reported to play a role in depression-like behaviors (Bhatnagar et al., 2004; Eisensamer et al., 2003; Rajkumar & Mahesh, 2010), although it is not clear which region or pool of receptors is responsible for this effect. GLP-1R has been demonstrated to play an intermediary role on GABAergic transmission in in vitro models of febrile seizure (Y. Zhang et al., 2018). Others have found that GLP-1Rs within the cortex are expressed within insulin-containing neurons and may regulate insulin release (Csajbok et al., 2019); further research is necessary to determine if GLP-1Rs expressed within 5-HT3R+ neurons are involved in this function. Finally, there has been a significant amount of research on the role of GLP-1R in drug reward and feeding behavior, specifically as to the regions and subsets of GLP-1R involved in these hedonic outputs. We and others have demonstrated that GLP-1R activation decreases drug reward (Egecioglu, Engel, et al., 2013a, 2013b; Egecioglu, Steensland, et al., 2013; Graham et al., 2013; Harasta et al., 2015; Reddy et al., 2016; Sørensen et al., 2015) and feeding behavior (Alhadeff et al., 2012; Dickson et al., 2012; Dossat et al., 2013; Dossat et al., 2011; Terrill et al., 2016). GLP-1R populations within the LS, VTA, and NAc have been implicated in these behaviors. While GLP-1R is highly expressed within the LS, there is little within the NAc and VTA. A scant number of positively labeled cell bodies are apparent in the NAc, making it unlikely that these few cells are responsible for the robust food intake and reward suppressive reductions. However, one study suggests that presynaptic GLP-1R on glutamatergic terminals within the NAc modulates feeding behavior, but it is not clear from what source these terminals arise (Mietlicki-Baase et al., 2014). In the VTA, there is evidence of GLP-1R-mApple+ fiber tracts and neurons that do not colocalize with TH, contradicting the mechanism and results proposed by others. (Hernandez et al., 2018; Mietlicki-Baase et al., 2013). Interestingly, GLP-1R-mApple+ neurons are evident on non-DAergic neurons as well as in nearby regions, and TH+ neurons within the VTA are in apposition to GLP-1R-mApple fiber tracts, indicating that GLP-1R modulates the feeding behavior within the VTA indirectly. This mechanism is suggested by the model proposed by Cork et al. (2015). Species differences in GLP-1R expression patterns may also exist; for example, it has been suggested that humans have relatively high expression of this receptor in multiple cell types within the parietal cortex (Farr et al., 2016). We also noted that GLP-1R-mApple appeared neuron-specific, as indicated by colocalization with NeuN. Using uptake assays with tagged GLP-1R ligands, others have shown that GLP-1Rs are expressed in glial cells, specifically astrocytes, at least within the NTS in rats (Reiner et al., 2016). We did not find this to be the case in our model, which may be due to differences in techniques, detection threshold (i.e., low levels of GLP-1R expression in this cell type), and/or species. However, similar results were found by Cork et al. (2015) in their mouse model as well. While there is concurrence between these two mouse models, this does not preclude the expression of GLP-1R in other types of glial cells. Others have shown that Glp1r is expressed in glial cells within the spinal cord in models of inflammation (N. Gong et al., 2014; C. H. Lee et al., 2018); an inflammatory insult may be necessary to induce significant GLP-1R expression. Further research is necessary to elucidate these concepts.
Given the growing interest of the role of GLP-1R within not only energy homeostasis but also neuropsychiatric disorders, it is of the utmost importance to determine the expression patterns and cellular identity of GLP-1R-expressing neurons. Recent data have suggested, for example, that GLP-1R tone in the BNST alters anxiety-related behavior and stress responses (Zheng et al., 2019). There are some key points to note about this model, however. One advantage of our model is that it can be used in combination with other cre lines to identify GLP-1R+ neurons while manipulating other cell types. As we have shown, little to no endogenous expression of the fluorescent marker is visualized without antibody amplification in fixed tissue (Fig. 19b). However, we have noted some native fluorescence in fresh tissue, indicating that this model would be suitable for in vivo studies using electrophysiology, for instance (data not shown). We should note that we use mice expressing a single copy of the transgene in this study, in order to minimize any effects of the gene insertion. It is possible that use of mice with two copies of the transgene would further enhance mApple fluorescence, thus increasing this model’s usefulness for studies in which antibody-based amplification cannot be used. The data presented here contribute to these aims, allowing researchers to identify subpopulations of cells and further delineate the roles of brain GLP-1Rs in modulating motivated behavior.
Acknowledgements
We thank Matt Buendia, Mary Akel, Lisa Anderson, and Dr. Julie Wu for excellent technical support and Dr. Pradeep Bhide and Deirdre McCarthy for assistance with confocal microscopy. This work was supported by NIH grant R21DA035588 (GDS, AG), the Peter F. McManus Charitable Trust (DLG), the FSU Council on Research & Creativity (DLG), and the FSU College of Medicine. We are also grateful for the scientific editing by Saunders Consulting. The transgenic line used was developed at the Vanderbilt Transgenic Mouse/Embryonic Stem Cell Shared Resource. The authors declare no conflict of interest or any competing financial or commercial interests.
Abbreviations:
- AA
anterior amygdaloid area
- ACC
anterior cingulate cortex
- aca
anterior commissure
- ACo
anterior cortical amygdaloid area
- AHA
anterior hypothalamic area, anterior portion
- AP
area postrema
- Arc
arcuate hypothalamic nucleus
- BAC
bacterial artificial chromosome
- BLA
basolateral amygdala
- BMA
basomedial amygdala
- BNST
the bed nucleus of the stria terminalis
- CALB
calbindin
- CAMKII
Ca2+/calmodulin-dependent protein kinase II
- CALR
calretinin
- CC
central canal
- cc
corpus callosum
- CeA
central amygdala
- ChAT
choline acetyltransferase
- Cl
claustrum
- CxA
cortex-amygdala transition zone
- d
dorsal
- DA
dopamine
- DCX
doublecortin
- DEn
dorsal endopiriform claustrum
- DG
dentate gyrus
- DMH
dorsomedial hypothalamus
- DP
dorsopeduncular cortex
- DTT
dorsal tenia tecta
- D1R
dopamine D1 receptor
- D2R
dopamine D2 receptor
- D3V
dorsal third ventricle
- DARPP-32
dopamine- and cAMP-regulated neuronal phosphoprotein-32
- dsRed
Discosoma sp. red fluorescent protein
- ec
external capsule
- eGFP
enhanced green fluorescent protein
- FrA
frontal association cortex
- GAD67
glutamic acid decarboxylase-67
- GFAP
Glial fibrillary acidic protein
- GIP
gastric inhibitory protein
- GLP-1
glucagon-like peptide-1
- GLP-1R
glucagon-like peptide-1 receptor
- GP
globus pallidus
- GPCR
G-protein coupled receptor
- GrO
granula cell layer of the olfactory bulb
- HRP
horseradish peroxidase
- I
intercalated nuclei of the amygdala
- ic
internal capsule
- ICj
islands of Calleja
- IEn
intermediate endopiriform claustrum
- KO
knockout
- Ld
lambdoid septal zone
- LHb
lateral habenula
- LS
lateral septum
- LSD
lateral septum, dorsal
- LSI
lateral septum, intermediate
- LSV
lateral septum, ventral
- LV
lateral ventricle
- MCPC
magnocellular nucleus of the posterior commissure
- MeA
medial amygdala
- MFC
medial frontal cortex
- MG
medial geniculate nucleus of the thalamus
- MHb
medial habenula
- MM
medial mammillary nucleus
- MPA
medial preoptic area
- MPO
medial preoptic nucleus
- MS
medial septum
- MnPO
median preoptic nucleus
- M1, M2
motor cortices
- NAc
nucleus accumbens
- NTS
nucleus of the solitary tract
- OFC
orbitofrontal cortex
- Op
optic nerve layer of the superior colliculus
- P
postnatal day
- PAG
periaqueductal grey
- PE
periventricular hypothalamus
- PF
parafasicular thalamic nucleus
- PIL
posterior intralaminar thalamic nucleus
- Pir
piriform cortex
- PoT
posterior thalamic nucleus, triangular
- PV
parvalbumin
- PVP
paraventricular thalamic nucleus
- Rt
reticular thalamus
- sc
superior colliculus
- SCh
suprachiasmatic nucleus
- SCO
subcommissural organ
- SFO
subfornical organ
- SHi
septohippocampal nucleus
- SNc
substantia nigra pars compacta
- SNr
substantia nigra pars reticulata
- Spa
subparaventricular zone
- SST
somatostatin
- STR
striatum
- SuG
superficial gray layer of superior colliculus
- TH
tyrosine hydroxylase
- TS
triangular septal nucleus
- v
ventral
- vhc
ventral hippocampal commissure
- VMH
ventromedial hypothalamus
- VP
ventral pallidum
- VTA
ventral tegmental area
- WT
wild-type
- ZI
zona incerta
- Zo
zona layer of superior colliculus
- 5-HT
serotonin
Footnotes
Data Availability Statement
The GLP-1R-mApple mouseline used in this study is available from the corresponding author upon reasonable request.
References
- Abercrombie M (1946). Estimation of nuclear population from microtome sections. Anatomical Record, 94, 239–247. [DOI] [PubMed] [Google Scholar]
- Adams JM, Pei H, Sandoval DA, Seeley RJ, Chang RB, Liberles SD, & Olson DP (2018). Liraglutide Modulates Appetite and Body Weight Through Glucagon-Like Peptide 1 Receptor-Expressing Glutamatergic Neurons. Diabetes, 67(8), 1538–1548. doi: 10.2337/db17-1385 [DOI] [PMC free article] [PubMed] [Google Scholar]
- Ahima RS, & Antwi DA (2008). Brain regulation of appetite and satiety. Endocrinology and Metabolism Clinics of North America, 37(4), 811–823. doi: 10.1016/j.ecl.2008.08.005 [DOI] [PMC free article] [PubMed] [Google Scholar]
- Alhadeff AL, Rupprecht LE, & Hayes MR (2012). GLP-1 Neurons in the Nucleus of the Solitary Tract Project Directly to the Ventral Tegmental Area and Nucleus Accumbens to Control for Food Intake. Endocrinology, 153(2), 647–658. 10.1210/en.2011-1443 [DOI] [PMC free article] [PubMed] [Google Scholar]
- Alvarez E, Martinez MD, Roncero I, Chowen JA, Garcia-Cuartero B, Gispert JD, … Blazquez E (2005). The expression of GLP-1 receptor mRNA and protein allows the effect of GLP-1 on glucose metabolism in the human hypothalamus and brainstem. Journal of Neurochemistry, 92(4), 798–806. doi: 10.1111/j.1471-4159.2004.02914.x [DOI] [PubMed] [Google Scholar]
- Amalric M, & Koob GF (1993). Functionally selective neurochemical afferents and efferents of the mesocorticolimbic and nigrostriatal dopamine system. Progress in Brain Research, 99, 209–226. [DOI] [PubMed] [Google Scholar]
- Anderberg RH, Richard JE, Hansson C, Nissbrandt H, Bergquist F, & Skibicka KP (2016). GLP-1 is both anxiogenic and antidepressant; divergent effects of acute and chronic GLP-1 on emotionality. Psychoneuroendocrinology, 65, 54–66. doi: 10.1016/j.psyneuen.2015.11.021 [DOI] [PubMed] [Google Scholar]
- Beiroa D, Imbernon M, Gallego R, Senra A, Herranz D, Villarroya F, … Nogueiras R (2014). GLP-1 agonism stimulates brown adipose tissue thermogenesis and browning through hypothalamic AMPK. Diabetes, 63(10), 3346–3358. doi: 10.2337/db14-0302 [DOI] [PubMed] [Google Scholar]
- Bhatnagar S, Nowak N, Babich L, & Bok L (2004). Deletion of the 5-HT3 receptor differentially affects behavior of males and females in the Porsolt forced swim and defensive withdrawal tests. Behavioural Brain Research, 153(2), 527–535. doi: 10.1016/j.bbr.2004.01.018 [DOI] [PubMed] [Google Scholar]
- Brown JP, Couillard-Despres S, Cooper-Kuhn CM, Winkler J, Aigner L, & Kuhn HG (2003). Transient expression of doublecortin during adult neurogenesis. Journal of Comparative Neurology, 467(1), 1–10. doi: 10.1002/cne.10874 [DOI] [PubMed] [Google Scholar]
- Burette AC, Strehler EE, & Weinberg RJ (2009). “Fast” plasma membrane calcium pump PMCA2a concentrates in GABAergic terminals in the adult rat brain. Journal of Comparative Neurology, 512(4), 500–513. doi: 10.1002/cne.21909 [DOI] [PMC free article] [PubMed] [Google Scholar]
- Burmeister MA, Ayala JE, Smouse H, Landivar-Rocha A, Brown JD, Drucker DJ, … Ayala JE (2017). The Hypothalamic Glucagon-Like Peptide 1 Receptor Is Sufficient but Not Necessary for the Regulation of Energy Balance and Glucose Homeostasis in Mice. Diabetes, 66(2), 372–384. doi: 10.2337/db16-1102 [DOI] [PMC free article] [PubMed] [Google Scholar]
- Burmeister MA, Brown JD, Ayala JE, Stoffers DA, Sandoval DA, Seeley RJ, & Ayala JE (2017). The glucagon-like peptide-1 receptor in the ventromedial hypothalamus reduces short-term food intake in male mice by regulating nutrient sensor activity. Am J Physiol Endocrinol Metab, 313(6), E651–E662. doi: 10.1152/ajpendo.00113.2017 [DOI] [PMC free article] [PubMed] [Google Scholar]
- Cork SC, Richards JE, Holt MK, Gribble FM, Reimann F, & Trapp S (2015). Distribution and characterisation of Glucagon-like peptide-1 receptor expressing cells in the mouse brain. Mol Metab, 4(10), 718–731. doi: 10.1016/j.molmet.2015.07.008 [DOI] [PMC free article] [PubMed] [Google Scholar]
- Csajbok EA, Kocsis AK, Farago N, Furdan S, Kovacs B, Lovas S, … Tamas G (2019). Expression of GLP-1 receptors in insulin-containing interneurons of rat cerebral cortex. Diabetologia, 62(4), 717–725. doi: 10.1007/s00125-018-4803-z [DOI] [PubMed] [Google Scholar]
- Dalvi PS, Nazarians-Armavil A, Purser MJ, & Belsham DD (2012). Glucagon-like peptide-1 receptor agonist, exendin-4, regulates feeding-associated neuropeptides in hypothalamic neurons in vivo and in vitro. Endocrinology, 153(5), 2208–2222. doi: 10.1210/en.2011-1795 [DOI] [PubMed] [Google Scholar]
- Dickson SL, Shirazi RH, Hansson C, Bergquist F, Nissbrandt H, & Skibicka KP (2012). The glucagon-like peptide 1 (GLP-1) analogue, exendin-4, decreases the rewarding value of food: a new role for mesolimbic GLP-1 receptors. Journal of Neuroscience, 32(14), 4812–4820. 10.1523/JNEUROSCI.6326-11.2012 [DOI] [PMC free article] [PubMed] [Google Scholar]
- Dossat AM, Diaz R, Gallo L, Panagos A, Kay K, & Williams DL (2013). Nucleus accumbens GLP-1 receptors influence meal size and palatability. Am J Physiol Endocrinol Metab, 304(12), E1314–1320. doi: 10.1152/ajpendo.00137.2013 [DOI] [PMC free article] [PubMed] [Google Scholar]
- Dossat AM, Lilly N, Kay K, & Williams DL (2011). Glucagon-like peptide 1 receptors in nucleus accumbens affect food intake. Journal of Neuroscience, 31(41), 14453–14457. 10.1523/JNEUROSCI.3262-11.2011 [DOI] [PMC free article] [PubMed] [Google Scholar]
- Drucker DJ (2006). The biology of incretin hormones. Cell Metab, 3(3), 153–165. doi:S1550–4131(06)00028–3 [pii] 10.1016/j.cmet.2006.01.004 [DOI] [PubMed] [Google Scholar]
- Egecioglu E, Engel JA, & Jerlhag E (2013a). The glucagon-like peptide 1 analogue Exendin-4 attenuates the nicotine-induced locomotor stimulation, accumbal dopamine release, conditioned place preference as well as the expression of locomotor sensitization in mice. PLoS One, 8(10), e77284. doi: 10.1371/journal.pone.0077284 [DOI] [PMC free article] [PubMed] [Google Scholar]
- Egecioglu E, Engel JA, & Jerlhag E (2013b). The glucagon-like peptide 1 analogue, exendin-4, attenuates the rewarding properties of psychostimulant drugs in mice. PLoS One, 8(7), e69010. doi: 10.1371/journal.pone.0069010 PONE-D-13–14678 [pii] [DOI] [PMC free article] [PubMed] [Google Scholar]
- Egecioglu E, Steensland P, Fredriksson I, Feltmann K, Engel JA, & Jerlhag E (2013). The glucagon-like peptide 1 analogue Exendin-4 attenuates alcohol mediated behaviors in rodents. Psychoneuroendocrinology, 38(8), 1259–1270. doi: 10.1016/j.psyneuen.2012.11.009 [DOI] [PubMed] [Google Scholar]
- Eisensamer B, Rammes G, Gimpl G, Shapa M, Ferrari U, Hapfelmeier G, … Rupprecht R (2003). Antidepressants are functional antagonists at the serotonin type 3 (5-HT3) receptor. Molecular Psychiatry, 8(12), 994–1007. doi: 10.1038/sj.mp.4001314 [DOI] [PubMed] [Google Scholar]
- Farr OM, Sofopoulos M, Tsoukas MA, Dincer F, Thakkar B, Sahin-Efe A, … Mantzoros CS (2016). GLP-1 receptors exist in the parietal cortex, hypothalamus and medulla of human brains and the GLP-1 analogue liraglutide alters brain activity related to highly desirable food cues in individuals with diabetes: a crossover, randomised, placebo-controlled trial. Diabetologia, 59(5), 954–965. doi: 10.1007/s00125-016-3874-y [DOI] [PMC free article] [PubMed] [Google Scholar]
- Flores JA, Galan-Rodriguez B, Ramiro-Fuentes S, & Fernandez-Espejo E (2006). Role for dopamine neurons of the rostral linear nucleus and periaqueductal gray in the rewarding and sensitizing properties of heroin. Neuropsychopharmacology, 31(7), 14751488. doi: 10.1038/sj.npp.1300946 [DOI] [PubMed] [Google Scholar]
- Fong AY, Stornetta RL, Foley CM, & Potts JT (2005). Immunohistochemical localization of GAD67-expressing neurons and processes in the rat brainstem: subregional distribution in the nucleus tractus solitarius. Journal of Comparative Neurology, 493(2), 274–290. doi: 10.1002/cne.20758 [DOI] [PubMed] [Google Scholar]
- Fousse J, Gautier E, Patti D, & Dehay C (2019). Developmental changes in interkinetic nuclear migration dynamics with respect to cell-cycle progression in the mouse cerebral cortex ventricular zone. Journal of Comparative Neurology, 527(10), 1545–1557. doi: 10.1002/cne.24641 [DOI] [PubMed] [Google Scholar]
- Gautron L, Rutkowski JM, Burton MD, Wei W, Wan Y, & Elmquist JK (2013). Neuronal and nonneuronal cholinergic structures in the mouse gastrointestinal tract and spleen. Journal of Comparative Neurology, 521(16), 3741–3767. doi: 10.1002/cne.23376 [DOI] [PMC free article] [PubMed] [Google Scholar]
- Ghosal S, Myers B, & Herman JP (2013). Role of central glucagon-like peptide-1 in stress regulation. Physiology and Behavior, 122, 201–207. doi: 10.1016/j.physbeh.2013.04.003 [DOI] [PMC free article] [PubMed] [Google Scholar]
- Ghosal S, Packard AE, Mahbod P, McKlveen JM, Seeley RJ, Myers B, … Herman JP (2017). Disruption of Glucagon-Like Peptide 1 Signaling in Sim1 Neurons Reduces Physiological and Behavioral Reactivity to Acute and Chronic Stress. Journal of Neuroscience, 37(1), 184–193. doi: 10.1523/JNEUROSCI.1104-16.2017 [DOI] [PMC free article] [PubMed] [Google Scholar]
- Goke R, Larsen PJ, Mikkelsen JD, & Sheikh SP (1995). Distribution of GLP-1 binding sites in the rat brain: evidence that exendin-4 is a ligand of brain GLP-1 binding sites. European Journal of Neuroscience, 7(11), 2294–2300. [DOI] [PubMed] [Google Scholar]
- Gong N, Xiao Q, Zhu B, Zhang CY, Wang YC, Fan H, … Wang YX (2014). Activation of spinal glucagon-like peptide-1 receptors specifically suppresses pain hypersensitivity. Journal of Neuroscience, 34(15), 5322–5334. doi: 10.1523/JNEUROSCI.4703-13.2014 [DOI] [PMC free article] [PubMed] [Google Scholar]
- Gong S, Zheng C, Doughty ML, Losos K, Didkovsky N, Schambra UB, … Heintz N (2003). A gene expression atlas of the central nervous system based on bacterial artificial chromosomes. Nature, 425(6961), 917–925. doi: 10.1038/nature02033nature02033 [pii] [DOI] [PubMed] [Google Scholar]
- Graham DL, Durai HH, Garden JD, Cohen EL, Echevarria FD, & Stanwood GD (2015). Loss of dopamine d2 receptors increases parvalbumin-positive interneurons in the anterior cingulate cortex. ACS Chem Neurosci, 6(2), 297–305. doi: 10.1021/cn500235m [DOI] [PMC free article] [PubMed] [Google Scholar]
- Graham DL, Erreger K, Galli A, & Stanwood GD (2013). GLP-1 analog attenuates cocaine reward. Molecular Psychiatry, 18(9), 961–962. 10.1038/mp.2012.141 [DOI] [PMC free article] [PubMed] [Google Scholar]
- Hamilton A, Patterson S, Porter D, Gault VA, & Holscher C (2011). Novel GLP-1 mimetics developed to treat type 2 diabetes promote progenitor cell proliferation in the brain. Journal of Neuroscience Research, 89(4), 481–489. doi: 10.1002/jnr.22565 [DOI] [PubMed] [Google Scholar]
- Harasta AE, Power JM, von Jonquieres G, Karl T, Drucker DJ, Housley GD, … Klugmann M (2015). Septal Glucagon-Like Peptide 1 Receptor Expression Determines Suppression of Cocaine-Induced Behavior. Neuropsychopharmacology, 40(8), 1969–1978. doi: 10.1038/npp.2015.47 [DOI] [PMC free article] [PubMed] [Google Scholar]
- Hayes MR, De Jonghe BC, & Kanoski SE (2010). Role of the glucagon-like-peptide-1 receptor in the control of energy balance. Physiology and Behavior, 100(5), 503–510. 10.1016/j.physbeh.2010.02.029 [DOI] [PMC free article] [PubMed] [Google Scholar]
- Hernandez NS, Ige KY, Mietlicki-Baase EG, Molina-Castro GC, Turner CA, Hayes MR, & Schmidt HD (2018). Glucagon-like peptide-1 receptor activation in the ventral tegmental area attenuates cocaine seeking in rats. Neuropsychopharmacology, 43(10), 2000–2008. doi: 10.1038/s41386-018-0010-3 [DOI] [PMC free article] [PubMed] [Google Scholar]
- Holscher C (2012). Potential role of glucagon-like peptide-1 (GLP-1) in neuroprotection. CNS Drugs, 26(10), 871–882. doi: 10.2165/11635890-000000000-00000 [DOI] [PubMed] [Google Scholar]
- Hsieh YC, & Puche AC (2013). Development of the Islands of Calleja. Brain Research, 1490, 52–60. doi: 10.1016/j.brainres.2012.10.051 [DOI] [PubMed] [Google Scholar]
- Hunter K, & Holscher C (2012). Drugs developed to treat diabetes, liraglutide and lixisenatide, cross the blood brain barrier and enhance neurogenesis. BMC Neurosci, 13, 33. doi: 10.1186/1471-2202-13-33 [DOI] [PMC free article] [PubMed] [Google Scholar]
- Ikemoto S (2007). Dopamine reward circuitry: two projection systems from the ventral midbrain to the nucleus accumbens-olfactory tubercle complex. Brain Res Rev, 56(1), 27–78. doi: 10.1016/j.brainresrev.2007.05.004 [DOI] [PMC free article] [PubMed] [Google Scholar]
- Inamata Y, & Shirasaki R (2014). Dbx1 triggers crucial molecular programs required for midline crossing by midbrain commissural axons. Development, 141(6), 1260–1271. doi: 10.1242/dev.102327 [DOI] [PubMed] [Google Scholar]
- Jacobs MM, Fogg RL, Emeson RB, & Stanwood GD (2009). ADAR1 and ADAR2 expression and editing activity during forebrain development. Developmental Neuroscience, 31(3), 223–237. 10.1159/000210185 [DOI] [PMC free article] [PubMed] [Google Scholar]
- Kanoski SE, Hayes MR, & Skibicka KP (2016). GLP-1 and weight loss: unraveling the diverse neural circuitry. Am J Physiol Regul Integr Comp Physiol, 310(10), R885–895. doi: 10.1152/ajpregu.00520.2015 [DOI] [PMC free article] [PubMed] [Google Scholar]
- Kawaja MD, Flumerfelt BA, & Hrycyshyn AW (1990). Synaptic organization of septal projections in the rat medial habenula: a wheat germ agglutinin-horseradish peroxidase and immunohistochemical study. Synapse, 6(1), 45–54. doi: 10.1002/syn.890060106 [DOI] [PubMed] [Google Scholar]
- Kazafeos K (2011). Incretin effect: GLP-1, GIP, DPP4. Diabetes Research and Clinical Practice, 93 Suppl 1, S32–36. 10.1016/S0168-8227(11)70011-0 [DOI] [PubMed] [Google Scholar]
- Kinzig KP, D’Alessio DA, Herman JP, Sakai RR, Vahl TP, Figueiredo HF, … Seeley RJ (2003). CNS glucagon-like peptide-1 receptors mediate endocrine and anxiety responses to interoceptive and psychogenic stressors. Journal of Neuroscience, 23(15), 6163–6170. [DOI] [PMC free article] [PubMed] [Google Scholar]
- Kreitzer AC (2009). Physiology and pharmacology of striatal neurons. Annual Review of Neuroscience, 32, 127–147. doi: 10.1146/annurev.neuro.051508.135422 [DOI] [PubMed] [Google Scholar]
- Kreymann B, Williams G, Ghatei MA, & Bloom SR (1987). Glucagon-like peptide-1 7–36: a physiological incretin in man. Lancet, 2(8571), 1300–1304. doi:S0140-6736(87)91194-9 [pii] [DOI] [PubMed] [Google Scholar]
- Lee AT, Gee SM, Vogt D, Patel T, Rubenstein JL, & Sohal VS (2014). Pyramidal neurons in prefrontal cortex receive subtype-specific forms of excitation and inhibition. Neuron, 81(1), 61–68. 10.1016/j.neuron.2013.10.031 [DOI] [PMC free article] [PubMed] [Google Scholar]
- Lee CH, Jeon SJ, Cho KS, Moon E, Sapkota A, Jun HS, … Choi JW (2018). Activation of Glucagon-Like Peptide-1 Receptor Promotes Neuroprotection in Experimental Autoimmune Encephalomyelitis by Reducing Neuroinflammatory Responses. Molecular Neurobiology, 55(4), 3007–3020. doi: 10.1007/s12035-017-0550-2 [DOI] [PubMed] [Google Scholar]
- Lee SJ, Sanchez-Watts G, Krieger JP, Pignalosa A, Norell PN, Cortella A, … Watts AG (2018). Loss of dorsomedial hypothalamic GLP-1 signaling reduces BAT thermogenesis and increases adiposity. Mol Metab, 11, 33–46. doi: 10.1016/j.molmet.2018.03.008 [DOI] [PMC free article] [PubMed] [Google Scholar]
- Lein ES, Hawrylycz MJ, Ao N, Ayres M, Bensinger A, Bernard A, … Jones AR (2007). Genome-wide atlas of gene expression in the adult mouse brain. Nature, 445(7124), 168–176. doi: 10.1038/nature05453 [DOI] [PubMed] [Google Scholar]
- Li C, McCall NM, Lopez AJ, & Kash TL (2013). Alcohol effects on synaptic transmission in periaqueductal gray dopamine neurons. Alcohol, 47(4), 279–287. doi: 10.1016/j.alcohol.2013.02.002 [DOI] [PMC free article] [PubMed] [Google Scholar]
- Liu J, Conde K, Zhang P, Lilascharoen V, Xu Z, Lim BK, … Pang ZP (2017). Enhanced AMPA Receptor Trafficking Mediates the Anorexigenic Effect of Endogenous Glucagon-like Peptide-1 in the Paraventricular Hypothalamus. Neuron, 96(4), 897–909 e895. doi: 10.1016/j.neuron.2017.09.042 [DOI] [PMC free article] [PubMed] [Google Scholar]
- Mathur BN (2014). The claustrum in review. Front Syst Neurosci, 8, 48. doi: 10.3389/fnsys.2014.00048 [DOI] [PMC free article] [PubMed] [Google Scholar]
- Mathur BN, Caprioli RM, & Deutch AY (2009). Proteomic analysis illuminates a novel structural definition of the claustrum and insula. Cerebral Cortex, 19(10), 2372–2379. doi: 10.1093/cercor/bhn253 [DOI] [PMC free article] [PubMed] [Google Scholar]
- McClean PL, Jalewa J, & Holscher C (2015). Prophylactic liraglutide treatment prevents amyloid plaque deposition, chronic inflammation and memory impairment in APP/PS1 mice. Behavioural Brain Research, 293, 96–106. doi: 10.1016/j.bbr.2015.07.024 [DOI] [PubMed] [Google Scholar]
- McGovern SF, Hunter K, & Holscher C (2012). Effects of the glucagon-like polypeptide-1 analogue (Val8)GLP-1 on learning, progenitor cell proliferation and neurogenesis in the C57B/16 mouse brain. Brain Research, 1473, 204–213. doi: 10.1016/j.brainres.2012.07.029 [DOI] [PubMed] [Google Scholar]
- Merchenthaler I, Lane M, & Shughrue P (1999). Distribution of pre-pro-glucagon and glucagon-like peptide-1 receptor messenger RNAs in the rat central nervous system. Journal of Comparative Neurology, 403(2), 261–280. doi: [pii] [DOI] [PubMed] [Google Scholar]
- Mietlicki-Baase EG, Ortinski PI, Reiner DJ, Sinon CG, McCutcheon JE, Pierce RC, … Hayes MR (2014). Glucagon-like peptide-1 receptor activation in the nucleus accumbens core suppresses feeding by increasing glutamatergic AMPA/kainate signaling. Journal of Neuroscience, 34(20), 6985–6992. doi: 10.1523/JNEUROSCI.0115-14.2014 [DOI] [PMC free article] [PubMed] [Google Scholar]
- Mietlicki-Baase EG, Ortinski PI, Rupprecht LE, Olivos DR, Alhadeff AL, Pierce RC, & Hayes MR (2013). The food intake-suppressive effects of glucagon-like peptide-1 receptor signaling in the ventral tegmental area are mediated by AMPA/kainate receptors. Am J Physiol Endocrinol Metab, 305(11), E1367–1374. doi: 10.1152/ajpendo.00413.2013 [DOI] [PMC free article] [PubMed] [Google Scholar]
- Morales M, & Bloom FE (1997). The 5-HT3 receptor is present in different subpopulations of GABAergic neurons in the rat telencephalon. Journal of Neuroscience, 17(9), 3157–3167. [DOI] [PMC free article] [PubMed] [Google Scholar]
- Mullen RJ, Buck CR, & Smith AM (1992). NeuN, a neuronal specific nuclear protein in vertebrates. Development, 116(1), 201–211. [DOI] [PubMed] [Google Scholar]
- Munoz-Manchado AB, Foldi C, Szydlowski S, Sjulson L, Farries M, Wilson C, … Hjerling-Leffler J (2016). Novel Striatal GABAergic Interneuron Populations Labeled in the 5HT3a(EGFP) Mouse. Cerebral Cortex, 26(1), 96–105. doi: 10.1093/cercor/bhu179 [DOI] [PMC free article] [PubMed] [Google Scholar]
- Ouimet CC, Miller PE, Hemmings HC Jr., Walaas SI, & Greengard P (1984). DARPP-32, a dopamine- and adenosine 3′:5′-monophosphate-regulated phosphoprotein enriched in dopamine-innervated brain regions. III. Immunocytochemical localization. Journal of Neuroscience, 4(1), 111–124. [DOI] [PMC free article] [PubMed] [Google Scholar]
- Paxinos G, & Franklin KBJ (2007). The Mouse Brain in Stereotaxic Coordinates (3rd ed.). New York City: Academic Press. [Google Scholar]
- Pecina S, Smith KS, & Berridge KC (2006). Hedonic hot spots in the brain. Neuroscientist, 12(6), 500–511. doi: 10.1177/1073858406293154 [DOI] [PubMed] [Google Scholar]
- Pinault D (2004). The thalamic reticular nucleus: structure, function and concept. Brain Research. Brain Research Reviews, 46(1), 1–31. doi: 10.1016/j.brainresrev.2004.04.008 [DOI] [PubMed] [Google Scholar]
- Pyke C, Heller RS, Kirk RK, Orskov C, Reedtz-Runge S, Kaastrup P, … Knudsen LB (2014). GLP-1 receptor localization in monkey and human tissue: novel distribution revealed with extensively validated monoclonal antibody. Endocrinology, 155(4), 1280–1290. doi: 10.1210/en.2013-1934 [DOI] [PubMed] [Google Scholar]
- Pyke C, & Knudsen LB (2013). The glucagon-like peptide-1 receptor--or not? Endocrinology, 154(1), 4–8. 10.1210/en.2012-2124 [DOI] [PubMed] [Google Scholar]
- Qu GJ, Ma J, Yu YC, & Fu Y (2016). Postnatal development of GABAergic interneurons in the neocortical subplate of mice. Neuroscience, 322, 78–93. doi: 10.1016/j.neuroscience.2016.02.023 [DOI] [PubMed] [Google Scholar]
- Rajkumar R, & Mahesh R (2010). The auspicious role of the 5-HT3 receptor in depression: a probable neuronal target? J Psychopharmacol, 24(4), 455–469. doi: 10.1177/0269881109348161 [DOI] [PubMed] [Google Scholar]
- Ramamurthy DL, & Krubitzer LA (2016). The evolution of whisker-mediated somatosensation in mammals: Sensory processing in barrelless S1 cortex of a marsupial, Monodelphis domestica. Journal of Comparative Neurology, 524(17), 3587–3613. doi: 10.1002/cne.24018 [DOI] [PMC free article] [PubMed] [Google Scholar]
- Reddy IA, Pino JA, Weikop P, Osses N, Sorensen G, Bering T, … Galli A (2016). Glucagon-like peptide 1 receptor activation regulates cocaine actions and dopamine homeostasis in the lateral septum by decreasing arachidonic acid levels. Transl Psychiatry, 6, e809. doi: 10.1038/tp.2016.86 [DOI] [PMC free article] [PubMed] [Google Scholar]
- Reiner DJ, Mietlicki-Baase EG, McGrath LE, Zimmer DJ, Bence KK, Sousa GL, … Hayes MR (2016). Astrocytes Regulate GLP-1 Receptor-Mediated Effects on Energy Balance. Journal of Neuroscience, 36(12), 3531–3540. doi: 10.1523/JNEUROSCI.3579-15.2016 [DOI] [PMC free article] [PubMed] [Google Scholar]
- Richards P, Parker HE, Adriaenssens AE, Hodgson JM, Cork SC, Trapp S, … Reimann F (2014). Identification and characterization of GLP-1 receptor-expressing cells using a new transgenic mouse model. Diabetes, 63(4), 1224–1233. doi: 10.2337/db13-1440 [DOI] [PMC free article] [PubMed] [Google Scholar]
- Rudy B, Fishell G, Lee S, & Hjerling-Leffler J (2011). Three groups of interneurons account for nearly 100% of neocortical GABAergic neurons. Dev Neurobiol, 71(1), 45–61. doi: 10.1002/dneu.20853 [DOI] [PMC free article] [PubMed] [Google Scholar]
- Sharma AN, Ligade SS, Sharma JN, Shukla P, Elased KM, & Lucot JB (2015). GLP-1 receptor agonist liraglutide reverses long-term atypical antipsychotic treatment associated behavioral depression and metabolic abnormalities in rats. Metabolic Brain Disease, 30(2), 519–527. doi: 10.1007/s11011-014-9591-7 [DOI] [PubMed] [Google Scholar]
- Shirazi RH, Dickson SL, & Skibicka KP (2013). Gut peptide GLP-1 and its analogue, Exendin-4, decrease alcohol intake and reward. PLoS One, 8(4), e61965. doi: 10.1371/journal.pone.0061965 PONE-D-13–03785 [pii] [DOI] [PMC free article] [PubMed] [Google Scholar]
- Sørensen G, Reddy IA, Weikop P, Graham DL, Stanwood GD, Wortwein G, … Fink-Jensen A (2015). The glucagon-like peptide 1 (GLP-1) receptor agonist exendin-4 reduces cocaine self-administration in mice. Physiology and Behavior, 149, 262–268. doi: 10.1016/j.physbeh.2015.06.013 [DOI] [PMC free article] [PubMed] [Google Scholar]
- Stathopoulos E, Naeve GS, Taylor CR, & Epstein AL (1989). LN-6: a monoclonal antibody to vimentin expressed in non-hematopoietic mesenchymal cells and derived tumors and reactive in B5-fixed, paraffin-embedded tissues. Journal of Histochemistry and Cytochemistry, 37(9), 1363–1370. doi: 10.1177/37.9.2671152 [DOI] [PubMed] [Google Scholar]
- Suzuki K, Simpson KA, Minnion JS, Shillito JC, & Bloom SR (2010). The role of gut hormones and the hypothalamus in appetite regulation. Endocrine Journal, 57(5), 359–372. [DOI] [PubMed] [Google Scholar]
- Terrill SJ, Jackson CM, Greene HE, Lilly N, Maske CB, Vallejo S, & Williams DL (2016). Role of lateral septum glucagon-like peptide 1 receptors in food intake. Am J Physiol Regul Integr Comp Physiol, 311(1), R124–132. doi: 10.1152/ajpregu.00460.2015 [DOI] [PMC free article] [PubMed] [Google Scholar]
- Thompson AJ, & Lummis SC (2006). 5-HT3 receptors. Current Pharmaceutical Design, 12(28), 3615–3630. doi: 10.2174/138161206778522029 [DOI] [PMC free article] [PubMed] [Google Scholar]
- University Health Network Toronto. Cognitive Dysfunction and Glucagon-like Peptide-1 Agonists (COGDYS-GLP1) In (Vol. In: ClinicalTrials.gov [Internet]. Bethesda (MD): National Library of Medicine (US) 2015- [cited 2015 May 5]. Available from: https://clinicaltrials.gov/ct2/show/NCT02423824 Identifier: NCT02423824.). [Google Scholar]
- Viswanath H, Carter AQ, Baldwin PR, Molfese DL, & Salas R (2013). The medial habenula: still neglected. Front Hum Neurosci, 7, 931. doi: 10.3389/fnhum.2013.00931 [DOI] [PMC free article] [PubMed] [Google Scholar]
- Wang Q, Ng L, Harris JA, Feng D, Li Y, Royall JJ, … Zeng H (2017). Organization of the connections between claustrum and cortex in the mouse. Journal of Comparative Neurology, 525(6), 1317–1346. doi: 10.1002/cne.24047 [DOI] [PMC free article] [PubMed] [Google Scholar]
- Wang X, Zhang C, Szabo G, & Sun QQ (2013). Distribution of CaMKIIalpha expression in the brain in vivo, studied by CaMKIIalpha-GFP mice. Brain Research, 1518, 9–25. doi: 10.1016/j.brainres.2013.04.042 [DOI] [PMC free article] [PubMed] [Google Scholar]
- Watson TC, Cerminara NL, Lumb BM, & Apps R (2016). Neural Correlates of Fear in the Periaqueductal Gray. Journal of Neuroscience, 36(50), 12707–12719. doi: 10.1523/JNEUROSCI.1100-16.2016 [DOI] [PMC free article] [PubMed] [Google Scholar]
- Wilson JA, & Kawaja MD (1996). Distribution of calretinin-immunoreactive septal axons in the normal and deafferented medial habenula of adult rats. Journal of Comparative Neurology, 374(4), 593–606. doi: [DOI] [PubMed] [Google Scholar]
- Xu X, Roby KD, & Callaway EM (2006). Mouse cortical inhibitory neuron type that coexpresses somatostatin and calretinin. Journal of Comparative Neurology, 499(1), 144–160. doi: 10.1002/cne.21101 [DOI] [PubMed] [Google Scholar]
- Zhang R, Jankord R, Flak JN, Solomon MB, D’Alessio DA, & Herman JP (2010). Role of glucocorticoids in tuning hindbrain stress integration. Journal of Neuroscience, 30(44), 14907–14914. 10.1523/JNEUROSCI.0522-10.2010 [DOI] [PMC free article] [PubMed] [Google Scholar]
- Zhang Y, Liu Y, Xu J, Sun Q, Yu F, Cheng J, … He X (2018). Inhibition of DPP4 enhances inhibitory synaptic transmission through activating the GLP-1/GLP-1R signaling pathway in a rat model of febrile seizures. Biochemical Pharmacology, 156, 78–85. doi: 10.1016/j.bcp.2018.08.004 [DOI] [PubMed] [Google Scholar]
- Zheng H, Reiner DJ, Hayes MR, & Rinaman L (2019). Chronic Suppression of Glucagon-Like Peptide-1 Receptor (GLP1R) mRNA Translation in the Rat Bed Nucleus of the Stria Terminalis Reduces Anxiety-Like Behavior and Stress-Induced Hypophagia, But Prolongs Stress-Induced Elevation of Plasma Corticosterone. Journal of Neuroscience, 39(14), 2649–2663. doi: 10.1523/JNEUROSCI.2180-18.2019 [DOI] [PMC free article] [PubMed] [Google Scholar]