Abstract
Recent studies of metformin, the first-line drug for type 2 diabetes, have reported the involvement of gut microbiota in the mechanism underlying its antihyperglycemic effect. However, the mechanisms underlying the development of diarrhea and bloating, which are adverse effects of metformin, are unclear, and these effects decrease the quality of life of metformin-receiving patients with diabetes. In this study, we focused on the effects of metformin on gut microbiota. Namely, we examined the effects of Bifidobacterium bifidum G9-1 (BBG9-1), which has the ability to improve dysbiosis, on the changes in gut microbiota and occurrence of soft feces (increased fecal water content) during the administration of metformin. The results showed that coadministration of BBG9-1 and metformin suppressed metformin-mediated changes in the gut microbiota and, thus, soft feces. Meanwhile, BBG9-1 did not influence the antihyperglycemic effect of metformin. Based on these results, we believe that BBG9-1, which could improve gut microbiota, suppresses metformin-induced soft feces without influencing the drug’s antihyperglycemic effect.
Keywords: Bifidobacterium bifidum G9-1, diarrhea, metformin, microbiota, Akkermansia
INTRODUCTION
The number of cases of diabetes continues to increase, with patients required to take therapeutic medications continuously over a long term to maintain their blood glucose levels. However, metformin, the first-line drug used for type 2 diabetes (T2D) management [1], is associated with adverse effects such as diarrhea and bloating [2, 3]. Among these adverse effects, diarrhea, which is observed with especially high frequency, not only lowers patients’ quality of life but also necessitates a medication change from metformin to other drugs, which may be disadvantageous to patient treatment.
The detailed mechanism of metformin-induced diarrhea remains unclear; however, changes in intestinal bacteria have been reported to contribute to the effectiveness of metformin in lowering blood glucose levels [4, 5]. Because the changes in the gut microbiota are related to the occurrence of diarrhea [6, 7], metformin-induced changes in the gut microbiota could also contribute to the occurrence of diarrhea. Therefore, improving metformin-mediated changes in the gut microbiota may lead to the suppression of diarrhea occurrence. However, we must consider that examining the effects of metformin on the gut microbiota may also influence its effectiveness in lowering blood glucose levels.
Probiotics are defined as live microbes that exhibit host-beneficial effects when they are ingested in an adequate quantity [8]. The probiotic Bifidobacterium bifidum G9-1 (BBG9-1) has been used as an intestinal regulator for many years and reported to have beneficial effects on its hosts by improving dysbiosis [9, 10]. Thus, we hypothesized that metformin-mediated changes in the gut microbiota contribute to its adverse effect of diarrhea. We examined the influence of BBG9-1, which has gut microbiota-improving effects, on the antihyperglycemic effect of metformin as well as one of its adverse effects, soft feces.
MATERIALS AND METHODS
Bacteria
BBG9-1 was obtained from Biofermin Pharmaceutical Co., Ltd. (Kobe, Japan) and cultured for 18 hr at 37°C in Gifu anaerobic medium (GAM) broth (Nissui Pharmaceutical Co., Ltd., Tokyo, Japan) supplemented with 0.7% glucose and 0.1% Tween 80. The bacteria were washed twice with phosphate-buffered saline (PBS), and the pellets obtained after low-speed centrifugation were stored at −80°C until use.
Animals
Four-week-old male Wistar rats were purchased from Japan SLC (Hamamatsu, Japan), and 15-week-old male C57BL/6 J mice and C57BL/6 J-DIO mice were purchased from Charles River Laboratories Japan (Atsugi, Japan). C57BL/6 J-DIO mice have been reported to constitute a mouse model that is genetically predisposed to T2D and exhibits diabetes-related symptoms, including impaired glucose tolerance [21, 22]. These animals were used in experiments after a 1-week acclimation and rearing period. Wistar rats were reared separately in five stainless steel cages (CL-02036, W755 mm × D210 mm × H170 mm, CLEA Japan, Inc., Tokyo, Japan). They were fed CRF-1 powdered feed (Oriental Yeast Co., Ltd., Tokyo, Japan) as the standard feed. C57BL/6 J mice were fed a standard feed (D12450 J, Research Diets, New Brunswick, NJ, USA; Table 1), and C57BL/6 J-DIO mice were freely fed a high-fat diet (HFD; D12492, Research Diets, New Brunswick, NJ, USA; Table 1). All the animals were allowed free access to water via a water supply bottle. The animals were reared at a temperature of 22°C ± 3°C and humidity of 55% ± 15% in a specific-pathogen-free environment with a 12-hr light cycle (07:00–19:00 hr). All experiments were performed according to the animal experiment guidelines of Biofermin Pharmaceutical and were approved (approval no. 132-002) by the animal experiment care and use committee of Biofermin Pharmaceutical.
Table 1. Contents of the standard diet and high-fat diet.
| Product | D12450J |
D12492 |
||
|---|---|---|---|---|
| gm% | kcal% | gm% | kcal% | |
| Protein | 19.2 | 20 | 26.2 | 20 |
| Carbohydrate | 67.3 | 70 | 26.3 | 20 |
| Fat | 4.3 | 10 | 34.9 | 60 |
| Total | 100 | 100 | ||
| kcal/gm | 3.85 | 5.24 | ||
Study design
Study 1
After a 1-week acclimation and rearing period, the male Wistar rats were randomly sorted into the following three groups: normal, metformin, and BBG9-1 groups (n=10 per group). To establish the soft feces models, the metformin and BBG9-1 groups were subjected to continuous oral administration of 200 mg/kg metformin hydrochloride (FUJIFILM Wako Pure Chemical Corp., Osaka, Japan) by gavage three times per day (at 4-hr intervals) for 1 week. The BBG9-1 group was subjected to continuous oral administration of 3.3 × 10⁸ CFU/animal BBG9-1 three times per day by gavage for 1 week. The metformin group was orally administered by gavage the same quantity of PBS instead of BBG9-1. The normal group was orally administered by gavage the same quantity of PBS instead of metformin hydrochloride and BBG9-1. The BBG9-1 group was orally administered BBG9-1 by gavage within 5 min after metformin administration. The day after the final day of continuous oral administration by gavage, fresh feces were collected. Some of the fresh feces samples were used to measure the water content. The rest were rapidly frozen with liquid nitrogen and stored at –80°C until the microbiota analysis.
Study 2
After 1 week of acclimation and rearing, the male C57BL/6 J-DIO mice were randomly sorted into the following three groups: the control, metformin group, and BBG9-1 group (n=8). The C57BL/6 J mice were used as the normal group. The metformin and BBG9-1 groups were administered 300 mg/kg/day metformin hydrochloride through drinking water. The BBG9-1 group was orally administered by gavage 1 × 10⁸ CFU/animal BBG9-1 once per day. Normal, contol and metformin groups were orally administered with PBS instead of BBG9-1. An oral glucose tolerance test (OGTT) was conducted at 7 weeks after the start of administration. One week after the OGTT, fresh feces were collected, rapidly frozen with liquid nitrogen, and stored at −80°C until the microbiota analysis.
Measurement of fecal water content
The water content in freshly collected feces was measured after collection by applying light pressure to the abdominal area of the animals. The feces were weighed immediately after collection and then dried for 24 hr at 90°C. The difference in the weights before and after drying was considered the water content of the feces, and the water content (%) was calculated by obtaining the ratio of the water content to the pre-drying fecal weight.
OGTT
An OGTT (oral administration of 2 mg/kg glucose by gavage; FUJIFILM Wako Pure Chemical Corp., Osaka, Japan) was conducted at 7 weeks after the start of the experiment. The test was started after 16 hr of fasting. Immediately before and at 15, 30, 60, and 120 min after glucose administration, blood samples were collected from the jugular vein, and blood glucose levels were measured using a blood glucose measuring instrument (Accu-Chek, Roche, Germany). The area under the curve (AUC) was calculated using the linear trapezoidal method.
Fecal microbiological analyses
A comprehensive bacterial 16S rRNA sequence analysis was conducted to analyze the gut microbiota. Specifically, DNA was extracted from the feces using the bead-phenol method, and a sequence analysis of the V3-V4 region of the 16S rRNA gene was conducted using the MiSeq platform according to the methods described by Fadrosh et al. [11]. The sequence read data were analyzed using the QIIME pipeline [12]. Specifically, the reads were merged using Fastq-join, and quality filtering (QV ≥25) was conducted using USEARCH v6.1. For reads that passed filtering, highly reliable read data with chimera reads removed were used in the gut microbiota analysis. For each sample, 5,000 reads were randomly selected, and an operational taxonomic unit (OTU) was created with a homology threshold of 97% using USEARCH. The OTU representative array was used for a homology search using UCLUST, and taxonomy analysis was conducted down to the genus level for each read.
The vegdist function (vegan package) of the statistical analysis software R was used to calculate the degree of non-similarity in each sample’s gut microbiota composition (weighted UniFrac distance), and the values obtained were used in a principal coordinate analysis (PCoA) using the dsv.pco function.
Statistical analysis
The experimental results are reported as the mean ± standard error. In cases where Bartlett’s test showed unequal variance, the Steel-Dwass test was used for verification. In cases with equal variance, the Tukey-Kramer test was used for verification. PERMANOVA was used for the PCoA. A value of p<0.05 represented statistical significance.
RESULTS
Effect of BBG9-1 on rats with metformin-induced soft feces
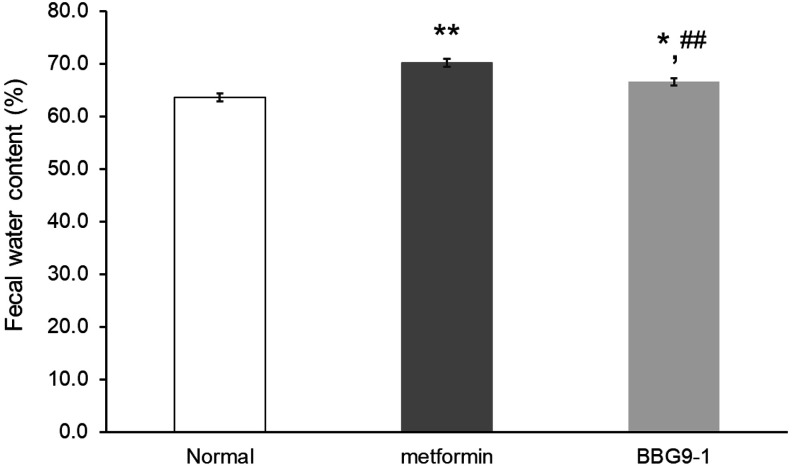
After 7 days of metformin administration in rats, the metformin group showed a significant increase in the fecal water content relative to that in the normal group. Meanwhile, the BBG9-1 group showed a significant decrease in the fecal water content relative to that in the metformin group (Fig. 1).
Fig. 1.
Effect of BBG9-1 on metformin-induced soft feces.
Fecal water content was measured in each group on day 7. Values are expressed as the mean ± SE of 10 animals. *p<0.05 vs. normal; **p<0.01 vs. normal; ##p<0.01 vs. metformin.
Effect of BBG9-1 on metformin-induced changes in fecal microbiota in rats
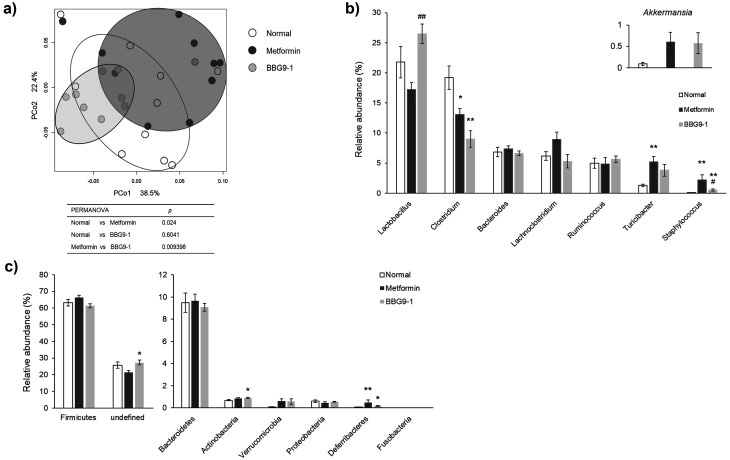
After 7 days of metformin administration, the gut microbiota profile of the metformin group differed from that of the normal group. However, unlike the microbiota profile of the metformin group, the BBG9-1 group’s profile showed similarities to that of the normal group (Fig. 2a). The Akkermansia level tended to increase in the metformin group compared with that in the normal group (test statistic –2.2418; value for which the difference would be significant 2.3437), and BBG9-1 had no effect on this change. Compared with the normal group, the metformin group showed a significant decrease in Clostridium species, significant increases in Turicibacter and Staphylococcus species, and a tendency for a decrease in Lactobacillus species. Compared with the metformin group, the BBG9-1 group showed a significant increase in Lactobacillus species and significant decrease in Staphylococcus species. The metformin-induced increase in Turicibacter (compared with the normal group) was inhibited by BBG9-1. Clostridium exhibited a significant decrease in both the metformin and BBG9-1 groups compared with the normal group (Fig. 2b). Actinobacteria was significantly increased in the BBG9-1 group compared with the level in the normal group. Deferribacteres was significantly increased in the metformin and BBG9-1 groups compared with the level in the normal group (Fig. 2c). At the genus level, there was no significant increase in bacteria belonging to Actinobacteria, but due to the small increase in levels of bacteria that made up 1% or less of the Actinobacteria (although not associated with a significant difference), there was a significant increase in Actinobacteria levels. Furthermore, the significant increase in Deferribacteres in the metformin and BBG9-1 groups was thought to be due to the increase in Mucispirillum, despite the low proportion.
Fig. 2.
Effect of BBG9-1 on the structure of fecal microbiota in rat models of metformin-induced soft feces.
a) Principal coordinates analysis (PCoA) showed clustered communities of fecal microbiota, based on the weighted UniFrac distance between samples. Results of PERMANOVA analysis on weighted UniFrac distance in fecal microbiota. The test was performed using 5000 permutations. The relative abundances of each bacterial genus (b) and phylum (c) were analyzed by next-generation sequencing of bacterial 16S rDNA. Each value is expressed as the mean ± SE of 10 animals. *p<0.05 vs. normal; **p<0.01 vs. normal; #p<0.05 vs. metformin; ##p<0.01 vs. metformin.
Effect of BBG9-1 on OGTT in C57BL/6 J-DIO mice
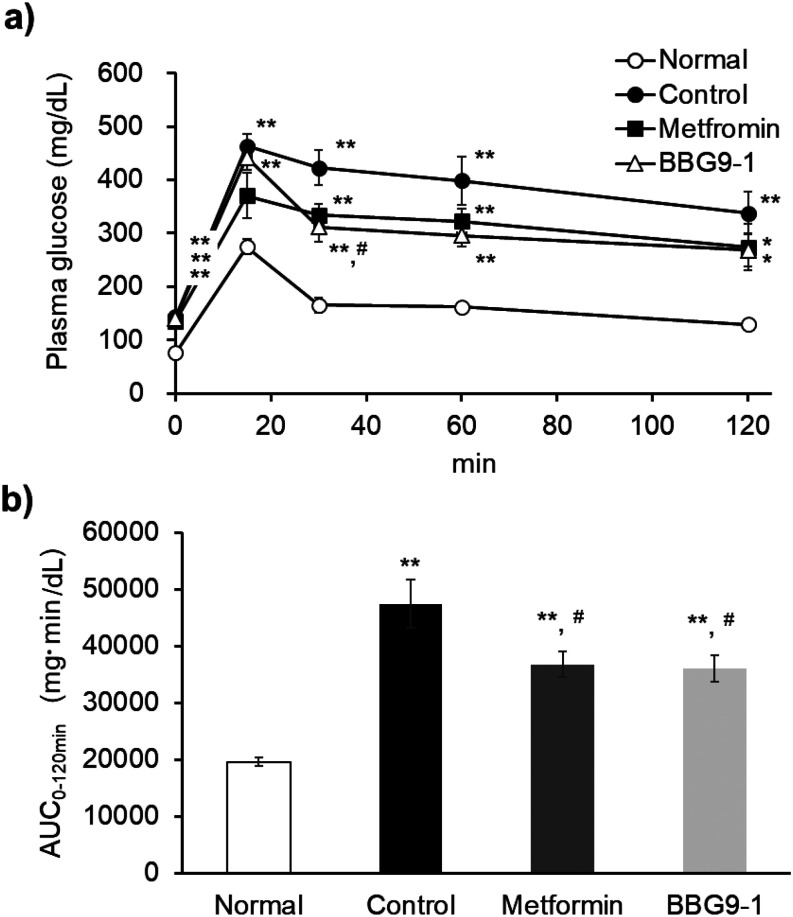
The AUC0-120 min revealed that the blood glucose levels in C57BL/6 J-DIO mice during the OGTT increased significantly in the control group compared with those in the normal group. However, the blood glucose levels in the metformin and BBG9-1 groups were significantly lower than those in the control group. Blood glucose was significantly elevated in the control group compared with the normal group at all time points. The plasma glucose level at the 30 min time point of the OGTT tended to be lower in the metformin group than in the control group (test statistic 2.43654; value for which the difference would be significant 2.73664) and was significantly lower in the BBG9-1 group (Fig. 3a). There was no difference in blood glucose levels between the metformin and BBG9-1 groups, indicating the same blood glucose level pattern (Fig. 3b).
Fig. 3.
Effect of BBG9-1 on the OGTT in C57BL/6 J-DIO mice.
a) Time courses for plasma concentrations. b) Corresponding area under the curve (AUC) of the OGTT. All mice were fasted overnight (16 hr) before the OGTT. Values are expressed as the mean ± SE of 7 or 8 animals. *p<0.05 vs. normal; **p<0.01 vs. normal; #p<0.05 vs. control.
Effect of BBG9-1 on the composition of the fecal microbiota in C57BL/6 J-DIO mice
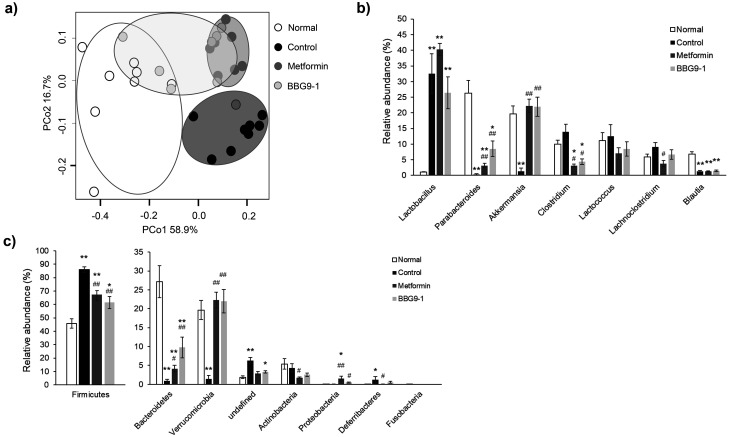
Although no changes in fecal consistency were observed in C57BL/6 J-DIO mice that were administered metformin, the results of the PCoA based on the weighted UniFrac distance for the gut microbiota of the diabetes model mice showed that the gut microbiota profiles of the normal, control, and metformin groups differed from one another, whereas that of the BBG9-1 group was plotted between clusters of the metformin and normal groups (Fig. 4a). A comparison of the taxonomy at the genus level showed a significant increase in Lactobacillus in all groups relative to the levels in the normal group and a significant decrease in Parabacteroides and Blautia in the control, metformin, and BBG9-1 groups. Clostridium in the metformin and BBG9-1 groups decreased significantly relative to the levels in the normal group. Compared with the control group, the metformin and BBG9-1 groups showed a significant increase in Parabacteroides and significant decrease in Clostridium. Lachnoclostridium decreased significantly in the metformin group. Akkermansia decreased significantly in the control group only, and no differences were observed in the levels between the metformin and BBG9-1 groups (Fig. 4b). Relative to the level in the normal group, Firmicutes was significantly increased in all groups, whereas it was significantly decreased in the metformin and BBG9-1 groups relative to the level in the control group. In contrast, relative to the level in the normal group, Bacteroidetes was significantly decreased in all groups, whereas it was significantly increased in the metformin and BBG9-1 groups relative to the level in the control group. The level of Verrucomicrobia, to which Akkermansia belongs, was significantly decreased only in the control group relative to the level in the normal group, whereas it was significantly increased in the metformin and BBG9-1 groups relative to the level in the control group. Actinobacteria was significantly decreased in the metformin group relative to the level in the control group. Proteobacteria was significantly increased in the metformin group relative to the level in the normal group, and it was significantly increased in the metformin and BBG9-1 groups relative to the level in the control group. Deferribacteres was significantly increased in the control group relative to the level in the normal group, and it was significantly decreased in the metformin group relative to the level in the control group (Fig. 4c).
Fig. 4.
Effect of BBG9-1 on the structure of fecal microbiota in C57BL/6 J-DIO mice.
a) Principal coordinates analysis (PCoA) showed the clustered communities of fecal microbiota, based on the weighted UniFrac distance between samples. The relative abundances of each bacterial genus (b) and phylum (c) were analyzed by next-generation sequencing of bacterial 16S rDNA. Each value is expressed as the mean ± SE of 7 or 8 animals. *p<0.05 vs. normal; **p<0.01 vs. normal; #p<0.05 vs. control; ##p<0.01 vs. control.
DISCUSSION
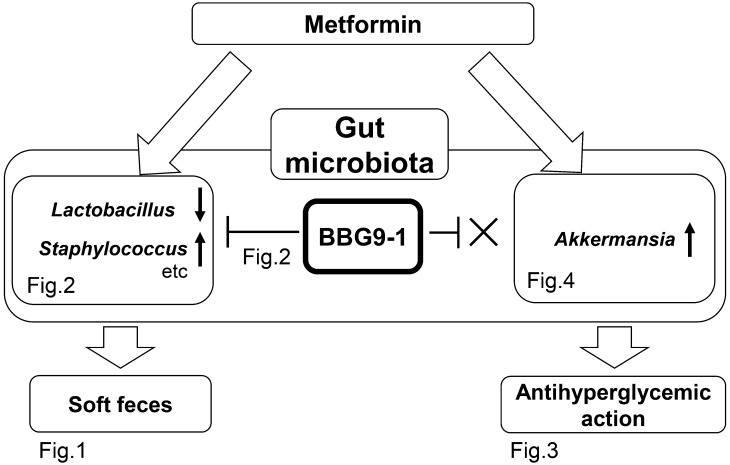
Because dysbiosis is reportedly involved in the occurrence of diarrhea and bloating [2, 3, 13], we hypothesized that metformin-mediated changes in the gut microbiota contribute to not only the drug’s antihyperglycemic effect but also one of its adverse effects, diarrhea. In this study using rats, we discovered that the induction of soft feces by metformin was suppressed through restoration of gut microbiota by BBG9-1 (Figs. 1 and 2). Furthermore, in model mice with T2D, BBG9-1 did not influence the antihyperglycemic effect of metformin (Figs. 3, Figs. 4, 5).
Fig. 5.
Outline of the influence of BBG9-1 on the effects of metformin.
Changes were observed in the gut microbiota due to metformin. Administration of BBG9-1 in combination with metformin resulted in improvements in both the gut microbiota causing soft feces and the soft feces themselves. Furthermore, the antihyperglycemic effects were not affected. That is, BBG9-1 suppressed the metformin side effect of soft feces, without influencing the drug’s inhibitory effects on increased blood glucose levels.
The mechanism underlying the induction of soft feces by metformin is unclear. In our experiments, in addition to confirming that soft feces (increased fecal water content) was induced by the oral administration of metformin by gavage three times per day, we also confirmed changes in the gut microbiota, especially a tendency for a decrease in Lactobacillus species and a significant increase in Staphylococcus species. A decrease in Lactobacillus species and an increase in Staphylococcus species have also been confirmed for antibiotic-associated diarrhea (AAD) [14]. Furthermore, other studies have suggested that Lactobacillus administration improves AAD [15] and that the presence of Staphylococcus species is related to AAD [16]. The gut microbiota in the normal and metformin groups differed as a result of metformin administration, showing that metformin changed the gut microbiota. The gut microbiota in the BBG9-1 group, however, resembled that in the normal group, unlike that of the metformin group, suggesting that changes in the gut microbiota may have contributed to the occurrence of soft feces after metformin administration. BBG9-1 brought the metformin-induced changes in the gut microbiota closer to those of the normal group, leading to improved fecal water content. The T2D model in this study supports this possibility, given that soft feces did not occur even with metformin administration and the decrease in Lactobacillus and increase in Staphylococcus species were negligible (Fig. 4). Therefore, because BBG9-1 suppresses soft feces induced by gut microbiota fluctuation (Fig. 2), it may also suppress metformin-induced soft feces by maintaining normal gut microbiota (Fig. 1). In this experiment, there was a significant increase in Turicibacter when soft feces were present. However, it has also been reported that Turicibacter decreases in dogs with diarrhea [23]. This difference may have been due to the difference between dogs and rats at the species level and may also have been affected by differences in factors such as food and rearing environment. Further studies are required to further the discussion on the contribution of Turicibacter to diarrhea.
In recent years, high levels of Akkermansia species have been reported in the intestine of patients taking metformin [17], and Akkermansia itself has the same antihyperglycemic effect as metformin [5]. Therefore, Akkermansia may be greatly involved in the antihyperglycemic effect of metformin.
That is, suppression of the increase in Akkermansia induced by metformin, may pose a risk of weakening the antihyperglycemic effect, which is the original objective of metformin administration.
However, the significant increase in Akkermansia species due to metformin was not influenced by the administration of BBG9-1 (Fig. 4). Furthermore, BBG9-1 did not influence the antihyperglycemic effects of metformin (Fig. 3). Akkermansia assimilates mucin when mucin is present [18], and B. bifidum also has the ability to degrade mucin [19], so it is conceivable that the two are engaged in a mutual, nutritional competition. However, due to the suppression of glucose absorption, which is one of the effects of metformin [20], many saccharides are present in the intestine. Because BBG9-1 actively uses the saccharides in the intestine and Akkermansia successfully assimilates mucin, there is a possibility that there is little competition between the two. Based on the above, it is possible that BBG9-1 did not weaken the antihyperglycemic effects of metformin even though it suppresses the gut microbiota changes caused by metformin, as it does not affect the levels of Akkermansia, which contribute to the efficacy of metformin. To deepen the understanding of the changes in the gut microbiota, we performed an analysis at the phylum level. The results revealed that Firmicutes and Bacteroidetes, which have been reported to be involved in obesity and diabetes [24], were significantly altered in the control group and that this improved with metformin administration. Furthermore, BBG9-1 did not influence this effect of metformin. Therefore, the fact that BBG9-1 did not influence the improvement in the ratio of Firmicutes and Bacteroidetes, in addition to its lack of influence on Akkermansia, might be related to the reason why BBG9-1 did not influence the effect of metformin in suppressing the increase in blood glucose levels.
Metformin has been reported to suppress glucose spikes when taken prior to meals [25]. However, in the present study, metformin was not administered prior to the OGTT. This might be one reason why suppression of glucose spikes was weak in the present study (no significant difference compared with the control group). Furthermore, as glucose levels at the 15 min time point of the OGTT were higher in the BBG9-1 group than in the metformin group (despite not showing a statistically significant difference), we cannot rule out that BBG9-1 has an influence on the effect of metformin on glucose spikes. However, as the glucose level and AUC in the BBG9-1 group thereafter were the same as those in the metformin group, the effect of BBG9-1 on glucose spikes might be small. We hope that future studies performed to clarify the effect of BBG9-1 on insulin might lead to more detailed discoveries.
In conclusion, the results suggest that the gut microbiota-improving effects of BBG9-1 suppress soft feces associated with metformin without influencing the drug’s antihyperglycemic effects (Fig. 5). In this study, we were unable to observe both the hypoglycemic action of metformin and occurrence of soft feces in a single experimental design, and we therefore investigated the effects of BBG9-1 on each of these in separate experiments. This was a limitation of the study. To clarify our claims in this study, further studies using different metformin doses and model animals (such as GK rats or KKay mice) are required to produce T2D mice that develop soft feces when administered metformin. In a future clinical study, we expect to find evidence for quality of life improvement in patients taking metformin through the administration of BBG9-1.
CONFLICT OF INTEREST
The authors have no conflicts of interest to declare.
REFERENCES
- 1.American Diabetes Association.2019. Standards of medical care in diabetes-2019 abridged for primary care providers. Clin Diabetes 37: 11–34. [DOI] [PMC free article] [PubMed] [Google Scholar]
- 2.Forslund K, Hildebrand F, Nielsen T, Falony G, Le Chatelier E, Sunagawa S, Prifti E, Vieira-Silva S, Gudmundsdottir V, Pedersen HK, Arumugam M, Kristiansen K, Voigt AY, Vestergaard H, Hercog R, Costea PI, Kultima JR, Li J, Jørgensen T, Levenez F, Dore J, Nielsen HB, Brunak S, Raes J, Hansen T, Wang J, Ehrlich SD, Bork P, Pedersen O, MetaHIT consortium. 2015. Disentangling type 2 diabetes and metformin treatment signatures in the human gut microbiota. Nature 528: 262–266. [DOI] [PMC free article] [PubMed] [Google Scholar]
- 3.Okayasu S, Kitaichi K, Hori A, Suwa T, Horikawa Y, Yamamoto M, Takeda J, Itoh Y. 2012. The evaluation of risk factors associated with adverse drug reactions by metformin in type 2 diabetes mellitus. Biol Pharm Bull 35: 933–937. [DOI] [PubMed] [Google Scholar]
- 4.Zhang X, Zhao Y, Xu J, Xue Z, Zhang M, Pang X, Zhang X, Zhao L. 2015. Modulation of gut microbiota by berberine and metformin during the treatment of high-fat diet-induced obesity in rats. Sci Rep 5: 14405. [DOI] [PMC free article] [PubMed] [Google Scholar]
- 5.Shin NR, Lee JC, Lee HY, Kim MS, Whon TW, Lee MS, Bae JW. 2014. An increase in the Akkermansia spp. population induced by metformin treatment improves glucose homeostasis in diet-induced obese mice. Gut 63: 727–735. [DOI] [PubMed] [Google Scholar]
- 6.Braun T, Di Segni A, BenShoshan M, Asaf R, Squires JE, Farage Barhom S, Glick Saar E, Cesarkas K, Smollan G, Weiss B, Amit S, Keller N, Haberman Y. 2017. Fecal microbial characterization of hospitalized patients with suspected infectious diarrhea shows significant dysbiosis. Sci Rep 7: 1088. [DOI] [PMC free article] [PubMed] [Google Scholar]
- 7.Moré MI, Swidsinski A. 2015. Saccharomyces boulardii CNCM I-745 supports regeneration of the intestinal microbiota after diarrheic dysbiosis—a review. Clin Exp Gastroenterol 8: 237–255. [DOI] [PMC free article] [PubMed] [Google Scholar]
- 8.FAO/WHO Working Group.2002. Report of a joint FAO/WHO working group on drafting guidelines for the evaluation of probiotics in food. London, Ontario, Canada. Food and Agriculture Organization/World Health Organization. [Google Scholar]
- 9.Makizaki Y, Maeda A, Oikawa Y, Tamura S, Tanaka Y, Nakajima S, Yamamura H. 2019. Alleviation of low-fiber diet-induced constipation by probiotic Bifidobacterium bifidum G9-1 is based on correction of gut microbiota dysbiosis. Biosci Microbiota Food Health 38: 49–53. [DOI] [PMC free article] [PubMed] [Google Scholar]
- 10.Fukui H, Oshima T, Tanaka Y, Oikawa Y, Makizaki Y, Ohno H, Tomita T, Watari J, Miwa H. 2018. Effect of probiotic Bifidobacterium bifidum G9-1 on the relationship between gut microbiota profile and stress sensitivity in maternally separated rats. Sci Rep 8: 12384. [DOI] [PMC free article] [PubMed] [Google Scholar]
- 11.Fadrosh DW, Ma B, Gajer P, Sengamalay N, Ott S, Brotman RM, Ravel J. 2014. An improved dual-indexing approach for multiplexed 16S rRNA gene sequencing on the Illumina MiSeq platform. Microbiome 2: 6. [DOI] [PMC free article] [PubMed] [Google Scholar]
- 12.Caporaso JG, Kuczynski J, Stombaugh J, Bittinger K, Bushman FD, Costello EK, Fierer N, Peña AG, Goodrich JK, Gordon JI, Huttley GA, Kelley ST, Knights D, Koenig JE, Ley RE, Lozupone CA, McDonald D, Muegge BD, Pirrung M, Reeder J, Sevinsky JR, Turnbaugh PJ, Walters WA, Widmann J, Yatsunenko T, Zaneveld J, Knight R. 2010. QIIME allows analysis of high-throughput community sequencing data. Nat Methods 7: 335–336. [DOI] [PMC free article] [PubMed] [Google Scholar]
- 13.Maeda A, Makizaki Y, Oikawa Y, Tamura S, Tanaka Y, Ohno H. 2018. Effect of dimethicone, cassia seed and probiotics on intestinal gas production. Jpn J Med Pham Sci 75: 43–51. [Google Scholar]
- 14.Zhang W, Zhu B, Xu J, Liu Y, Qiu E, Li Z, Li Z, He Y, Zhou H, Bai Y, Zhi F. 2018. Bacteroides fragilis protects against antibiotic-associated diarrhea in rats by modulating intestinal defenses. Front Immunol 9: 1040. [DOI] [PMC free article] [PubMed] [Google Scholar]
- 15.Gao XW, Mubasher M, Fang CY, Reifer C, Miller LE. 2010. Dose-response efficacy of a proprietary probiotic formula of Lactobacillus acidophilus CL1285 and Lactobacillus casei LBC80R for antibiotic-associated diarrhea and Clostridium difficile-associated diarrhea prophylaxis in adult patients. Am J Gastroenterol 105: 1636–1641. [DOI] [PubMed] [Google Scholar]
- 16.Gravet A, Rondeau M, Harf-Monteil C, Grunenberger F, Monteil H, Scheftel JM, Prévost G. 1999. Predominant Staphylococcus aureus isolated from antibiotic-associated diarrhea is clinically relevant and produces enterotoxin A and the bicomponent toxin LukE-lukD. J Clin Microbiol 37: 4012–4019. [DOI] [PMC free article] [PubMed] [Google Scholar]
- 17.de la Cuesta-Zuluaga J, Mueller NT, Corrales-Agudelo V, Velásquez-Mejía EP, Carmona JA, Abad JM, Escobar JS. 2017. Metformin is associated with higher relative abundance of mucin-degrading Akkermansia muciniphila and several short-chain fatty acid-producing microbiota in the gut. Diabetes Care 40: 54–62. [DOI] [PubMed] [Google Scholar]
- 18.Derrien M, Plugge CM, de Vos WM, Zoetandal EG. 2015. Akkermansia. Bergey’s manual of systematics of archaea and bacteria. John Wiley & Sons, Inc., in association with Bergey’s manual trust. Online (Bergh). [Google Scholar]
- 19.Kiyohara M, Nakatomi T, Kurihara S, Fushinobu S, Suzuki H, Tanaka T, Shoda S, Kitaoka M, Katayama T, Yamamoto K, Ashida H. 2012. α-N-acetylgalactosaminidase from infant-associated bifidobacteria belonging to novel glycoside hydrolase family 129 is implicated in alternative mucin degradation pathway. J Biol Chem 287: 693–700. [DOI] [PMC free article] [PubMed] [Google Scholar]
- 20.Wu T, Xie C, Wu H, Jones KL, Horowitz M, Rayner CK. 2017. Metformin reduces the rate of small intestinal glucose absorption in type 2 diabetes. Diabetes Obes Metab 19: 290–293. [DOI] [PubMed] [Google Scholar]
- 21.Surwit RS, Kuhn CM, Cochrane C, McCubbin JA, Feinglos MN. 1988. Diet-induced type II diabetes in C57BL/6J mice. Diabetes 37: 1163–1167. [DOI] [PubMed] [Google Scholar]
- 22.Gallou-Kabani C, Vigé A, Gross MS, Rabès JP, Boileau C, Larue-Achagiotis C, Tomé D, Jais JP, Junien C. 2007. C57BL/6J and A/J mice fed a high-fat diet delineate components of metabolic syndrome. Obesity (Silver Spring) 15: 1996–2005. [DOI] [PubMed] [Google Scholar]
- 23.Suchodolski JS, Markel ME, Garcia-Mazcorro JF, Unterer S, Heilmann RM, Dowd SE, Kachroo P, Ivanov I, Minamoto Y, Dillman EM, Steiner JM, Cook AK, Toresson L. 2012. The fecal microbiome in dogs with acute diarrhea and idiopathic inflammatory bowel disease. PLoS One 7: e51907. [DOI] [PMC free article] [PubMed] [Google Scholar]
- 24.Nakano Y, Bouchi R, Ogawa Y. 2016. Diabetes and gut microbiome. Mod Med 62: 11–17. [Google Scholar]
- 25.Hashimoto Y, Tanaka M, Okada H, Mistuhashi K, Kimura T, Kitagawa N, Fukuda T, Majima S, Fukuda Y, Tanaka Y, Yamada S, Senmaru T, Hamaguchi M, Asano M, Yamazaki M, Oda Y, Hasegawa G, Nakamura N, Fukui M. 2016. Postprandial hyperglycemia was ameliorated by taking metformin 30 min before a meal than taking metformin with a meal; a randomized, open-label, crossover pilot study. Endocrine 52: 271–276. [DOI] [PubMed] [Google Scholar]


