

Abstract
Objective:
Fructose malabsorption is a common digestive disorder in which absorption of fructose in the small intestine is impaired. An abnormality of the main intestinal fructose transporter proteins has been proposed as a cause for fructose malabsorption. However the underlying molecular mechanism for this remains unclear. In this study, we investigated whether carbohydrate response element-binding protein (ChREBP) plays a role in intestinal fructose absorption through the regulation of genes involved in fructose transport and metabolism and ion transport.
Methods:
Wild type (WT) and Chrebp knockout (KO) mice (6 or 8 weeks old) were fed a control diet (55% starch, 15% maltodextrin 10) or high-fructose diet (HFrD, 60% fructose, 10% starch) for 3–12 days. Body weight and food intake were measured, signs of fructose malabsorption were monitored, and the expression of genes involved in fructose transport/metabolism and ion transport was evaluated. Furthermore, transient transfection and chromatin immunoprecipitation were performed to show the direct interaction between ChREBP and carbohydrate response elements in the promoter of Slc2A5, which encodes the fructose transporter GLUT5.
Results:
Chrebp KO mice fed the control diet maintained a constant body weight, whereas those fed a HFrD showed significant weight loss within 3–5 days. In addition, Chrebp KO mice fed the HFrD exhibited a markedly distended cecum and proximal colon containing both fluid and gas, suggesting incomplete fructose absorption. Fructose-induced increases of genes involved in fructose transport (GLUT5), fructose metabolism (fructokinase, aldolase B, triokinase, and lactate dehydrogenase), and gluconeogenesis (glucose-6-phosphatase and fructose-1,6-bisphosphatase) were observed in the intestine of WT but not of Chrebp KO mice. Moreover the Na+/H+ exchanger NHE3, which is involved in Na+ and water absorption in the intestine, was significantly decreased in HFrD-fed Chrebp KO mice. Consistent with this finding, the high-fructose diet-fed Chrebp KO mice developed severe diarrhea. Results of chromatin immunoprecipitation assays showed a direct interaction of ChREBP with the Glut5 promoter, but not the Nhe3 promoter, in the small intestine. Ectopic co-expression of ChREBP and its heterodimer partner Max-like protein X activated the Glut5 promoter in Caco-2BBE cells.
Conclusions:
ChREBP plays a key role in the dietary fructose transport as well as conversion into lactate and glucose through direct transcriptional control of genes involved in fructose transport, fructolysis, and gluconeogenesis. Moreover, ablation of Chrebp results in a severe diarrhea in mice fed a high-fructose diet, which is associated with the insufficient induction of GLUT5 in the intestine.
Keywords: ChREBP, Intestine, Fructose absorption, Diarrhea, GLUT5
1. Introduction
The increased consumption of sugar and high-fructose corn syrup, both of which consist of nearly equal amounts of glucose and fructose, is associated with obesity and related metabolic diseases including dyslipidemia, insulin resistance, and nonalcoholic fatty liver disease [1–3]. The metabolic effects of dietary fructose appear to be more harmful than those of glucose, with excessive fructose intake increasing de novo lipogenesis and serum TG levels [4]. Moreover, excess intake of fructose as a monosaccharide can easily overwhelm the absorptive capacity of the small intestine, leading to incomplete absorption, i.e., fructose malabsorption [5, 6]. A high concentration of fructose within the gut lumen draws fluids into the intestine, and the fructose is fermented by anaerobic flora in colon, which can produce gas, bloating, abdominal pain, or diarrhea, and results in decreased food intake [7, 8].
Fructose is primarily absorbed in the small intestine through glucose transporter 5 (GLUT5, encoded by Slc2A5), a main fructose transporter in mammals [9, 10]. This is an energy-independent process, and its absorptive capacity is carrier-limited [11]. GLUT5 is normally expressed at low baseline levels throughout the suckling and weaning stages in neonatal rats [12]. Differentiated cells express GLUT5 on the apical border of enterocytes in the small intestine and marked increases in its mRNA and protein abundance occur within a few hours of fructose consumption [13, 14]. Although several regions of the Glut5 promoter respond to developmental and dietary signals [15–18], little is known about transcription factors and cis- regulatory elements that respond to dietary fructose.
Carbohydrate response element-binding protein (ChREBP) is a basic helix-loop-helix/leucine zipper transcription factor that plays a key role in glycolytic and lipogenic gene expression in response to carbohydrate consumption [19–21]. ChREBP is expressed ubiquitously but is most highly expressed in liver and adipose tissues and more modestly expressed in the intestine, kidney, and pancreatic β-cells. Upon activation by glucose, ChREBP translocates from the cytosol into the nucleus, where it forms a heterodimer with Max-like protein X (MLX) and binds to target genes containing carbohydrate response elements [22, 23]. Although ChREBP was first identified as a glucose-responsive factor, a critical role of ChREBP in fructose metabolism was suggested by the observation that Chrebp knockout (KO) mice could not tolerate diets containing sucrose and fructose [19]. ChREBP is now known to be activated by fructose as much as glucose [24, 25]. Although it has been reported that ChREBP upregulates hepatic fructokinase (Khk) upon high fructose consumption [24], no published studies have reported the effect of ChREBP on intestinal fructose transport and metabolism. Here we aimed to identify the molecular mechanism underlying fructose intolerance in Chrebp KO mice, focusing on intestinal fructose malabsorption.
2. Materials and Methods
2.1. Mice and diets
C57BL/6J mice (wild type, WT) and Chrebp KO mice were purchased from Jackson Laboratory (Bar Harbor, ME). Mice were maintained on a normal diet containing 13% kcal fat, 25% protein, 55% starch, 5% sucrose, and 2% lactose (PicoLab Rodent Diet 20, Orient Bio, Gyeonggi Province, Korea) under a 12-h light/dark cycle. The 6-week-old male and 8-week-old female mice were fed a control diet (CD) containing 10% kcal fat, 20% protein, 55% starch, and 15% maltodextrin 10 (D12450K; Research Diets, Inc., New Brunswick, NJ) or high-fructose diet (HFrD) containing 10% kcal fat, 20% protein, 10% starch, and 60% fructose (D02022704; Research Diets, Inc., New Brunswick, NJ). Body weight, blood glucose, rectal temperature, and food intake were measured on days 0, 5, 8, and 12. For glucose measurements, blood was taken from the tail vein of the same animals sequentially on the indicated days. The 8-week-old male mice were fed a CD or HFrD for 3, 5, or 7 days. At the end of the experiment, the mice were fasted for 2 h, euthanized, and body weights were obtained. Blood samples (600~800 μl) were collected immediately via the hepatic portal vein and plasma was obtained by centrifugation at 300 × g for 15 min at 4°C. Plasma samples were stored at −80°C until biochemical analysis. Liver and intestine were removed, weighed, and either formalin-fixed, or snap-frozen in liquid nitrogen. The length of small intestine and contents of the colon and cecum were determined on days 3, 5, and 7.
In a pair-fed experiment, 8-week-old WT male mice were fed the same amount of food (CD or HFrD) as was consumed by the HFrD-fed Chrebp KO mice; body weight was measured daily for 7 days. In a recovery experiment, 8-week-old WT male mice were fed the HFrD for 15 days. Chrebp KO male mice of the same age were fed either the HFrD for 15 days or the HFrD for 7 days, and switched to the CD until day 15. All animal studies were performed in accordance with protocols approved by the Institutional Animal Care and Use Committee of the Lee Gil Ya Cancer and Diabetes Institute, Gachon University.
2.2. Oral administration of liquid fructose or glucose
Male mice were maintained on a normal diet for 12 weeks prior to the gavage study. To allow the mice to adapt to oral administration, Dulbecco’s phosphate buffered saline (DPBS) was injected orally every day for 7 days. Mice were fasted for 4 h and then orally administered either liquid fructose or glucose (~250 μl, 2 g/kg body weight of 20% D-fructose or 20% D-glucose). Blood samples (60 μl) were taken from the tip of the tail at 0 min, 20 min, 4 h, and 8 h after administration.
2.3. Biochemical analysis
Plasma alanine transaminase (ALT), aspartate transaminase (AST), lactate dehydrogenase (LDH), triglyceride (TG), and total cholesterol were determined by automated analysis (Model AU-480; Olympus, Tokyo, Japan). Liver TG was determined as previously described [26] using a Cleantech TG-S kit (Asan Pharmacy, Inc., Seoul, Korea). Liver cholesterol was determined using a Cholesterol/Cholesteryl Ester Quantitation Kit (BioVision, Inc., Milpitas, CA). Blood glucose was measured using the GlucoDr.™ Plus (AGM-3000; Allmedicus, Gyeonggi Province, Korea). Blood fructose concentration was measured using the EnzyChrom™ Fructose Assay Kit (EFRU-100; BioAssay System, Hayward, CA). For lactate measurements, intestine and liver were homogenized in lactate assay buffer and centrifuged at 13,000 rpm 5 min at 4°C. Supernatant was transferred into new tube and enzyme was removed from supernatant using Deproteinizing Sample Preparation kit-TCA (ab204708; Abcam, Cambridge, MA). Lactate concentration was determined using a L-Lactate assay kit (ab65330; Abcam, Cambridge, MA).
2.4. RNA isolation and quantitative polymerase chain reaction
Total RNA was isolated from the small intestine using RNAiso Plus (Takara, Shiga, Japan). Purified total RNA was treated with RNase-free DNase (Roche, Penzberg, Germany) and reverse-transcribed using PrimeScript™ RT Reagent Kit with gDNA Eraser (Takara, Shiga, Japan). Gene-specific primers were designed using Primer Express Software (PerkinElmer Life Sciences, Waltham, MA), and validated by analysis of template titration and dissociation curves. Quantitative polymerase chain reaction (qPCR) was performed on a CFX384 Touch™ Real-Time PCR Detection System (Bio-Rad Laboratories, Inc., Hercules, CA) using SYBR® Premix Ex Taq™ II, ROX Plus (Takara, Shiga, Japan). Relative gene expression was determined using the 2−ΔΔCt method [27], with the gene encoding ribosomal protein, large, P0 (Rplp0) serving as the invariant control. Primer sequences are shown in Supplementary Table 1.
2.5. Immunohistochemistry
Small intestine specimens were fixed in neutral-buffered formalin and embedded in paraffin blocks according to standard procedures. The paraffin-embedded tissue sections were incubated in the oven at 60°C for 1 h. After rehydration in graded ethanol, antigen retrieval was performed in 1× Tris-EDTA, pH 9.5 (Thermo Scientific, Boston, MA) by heating in a microwave for 10 min. Sections were incubated with 3% H2O2 (Dako, Denmark) at room temperature for 30 min, blocked for 5 min, and then incubated with the primary antibody overnight. The next day, sections were incubated with the secondary antibody for 30 min, washed with DPBS containing Tween 20, and stained with 3,3′-diaminobenzidine. Primary antibodies against the following proteins were used: ChREBP (Novus Biologicals, Littleton, CO), GLUT5 (Santa Cruz Biotechnology, Santa Cruz CA), GLUT2 (Santa Cruz Biotechnology, Santa Cruz CA), and NHE3 (Santa Cruz Biotechnology, Santa Cruz CA).
2.6. Western blotting
Western blot analyses were performed according to standard protocols using antibodies against ChREBP (Novus Biologicals), GLUT5 (Santa Cruz Biotechnology), GLUT2 (Santa Cruz Biotechnology), NHE3 (Santa Cruz Biotechnology), and Glyceraldehyde-3-phosphate dehydrogenase (GAPDH, Merck Millipore, Temecula, CA). GAPDH was used as a loading control.
2.7. Plasmid construction
ChoREs (CANNTGNNNNNNNNNTG [28]) in the Glut5 and Nhe3 promoters were identified by using Vector NTI software. Five ChoREs were located in the Glut5 promoter between 0 and 2165 bp upstream from the transcription start site: −915 to −889 (ChoRE4 overlaps ChoRE5), −1620 to −1604, −1937 to −1853, and −2165 to −2149. One ChoRE was located in the Nhe2 promoter, −1248 to −1264. The proximal region of the Glut5 promoter (−2165/+0) was amplified from mouse genomic DNA by PCR and inserted into the SacI and EcoRV sites of the pGL4 basic vector (mGlut5–2165). Serial deletion constructs of the Glut5 promoter were generated by PCR amplification and subcloned into the pGL4 basic vector. Mouse ChREBP and MLX expression vectors were kind gifts from Dr. Howard C. Towle [23].
2.8. Cell culture and luciferase assay
Well-differentiated mature monolayers of Caco-2BBE (human intestinal epithelial) cells were maintained in 25 mM glucose Dulbecco’s Modified Eagle’s Medium (DMEM, Gibco, Life Technologies, Seoul, Korea) supplemented with 10% fetal bovine serum (FBS, Gibco, Life Technologies, Seoul, Korea), 1% penicillin-streptomycin (Gibco, Life Technologies, Seoul, Korea), and 0.01 mg/ml human transferrin (Gibco, Life Technologies, Seoul, Korea). Cell cultures were maintained in a 37°C incubator supplemented with 5% CO2. Luciferase reporter plasmids containing the Glut5 promoter constructs were transfected into Caco-2BBE cells with or without pcDNA expression vectors containing the Chrebp and Mlx genes. Luciferase activity was determined using the Luciferase Assay System (Promega Corporation, Fitchburg, WI) according to the manufacturer’s instructions and expressed as arbitrary units normalized to β-galactosidase activity. All experiments were performed in triplicate and repeated at least three times.
2.9. Chromatin immunoprecipitation assay
Small intestine tissues were washed with formaldehyde (37°C, 1% final concentration) and then opened longitudinally on a glass plate. The mucosa was scraped and separated from the underlying muscle layers by a glass microscope slide. The scraped mucosal cells were then fixed in formaldehyde (37°C, 1% final concentration) for 10 min at room temperature. The chromatin immunoprecipitation (ChIP) assay was performed as described previously [28, 29] using the EpiQuik Tissue Chromatin Immunoprecipitation kit (P-2003, EpiGentek, Farmingdale, NY). Chromatin was immunoprecipitated with control IgG or anti-ChREBP antibody (Novus Biologicals), purified, and then analyzed by qPCR using a CFX384 Touch™ Real-Time PCR Detection System (Bio-Rad Laboratories, Inc.). The following primers were used: ChoRE1 forward 5′GATTTC CTG CCG CAT TCA GA3′, reverse 5′TTTTCAGAC CTC CCA GAT GGA3′; ChoRE2 forward 5′TCC ATC CAC ACA CTT TCA AAC C3′, reverse 5′CAA GCC ACG GCC AAC AG3′; ChoRE3 forward 5′TCC CCG GCT CAC CTC AA3′, reverse 5′TTC GGA GTG GGA GTC TGG TT3′; ChoRE4/5 forward 5′TGG TCA GTC CGG TAG CAG TTG3′, reverse 5′CCT TTG CAG GGC AGG CTA A3′; mNHE3 ChoRE1 forward 5′GGG AGG ATA TAG GGA ATT TG3′, reverse 5′CGA TAC TTG AAA CGT ATA TAT GT3′; mCyclophilin forward 5′GGT CTT TGG GAA GGT GAA AGA A3′, reverse 5′GCC ATT CCT GGA CCC AAA A3′.
2.10. Statistical analysis
Data are expressed as mean ± standard error of the mean (SEM). Statistical analysis was carried out using SPSS (Version 17.0; SPSS Inc., Chicago, IL). Data were analyzed using the Mann–Whitney U test; p < 0.05 was considered significant.
3. Results
3.1. Fructose intolerance in Chrebp KO mice
To examine the role of ChREBP in fructose absorption in the intestine, 6-week-old male WT and Chrebp KO mice were fed either the HFrD (60% fructose, 10% starch) or CD (55% starch, 15% maltodextrin 10) for 3–12 days. WT mice maintained a constant body weight on both diets; however, Chrebp KO mice showed significant weight loss on the HFrD relative to the CD (Fig. 1 A). Chrebp KO mice fed the HFrD for 5 days showed approximately 20% reduction in body weight and became moribund in 2 weeks, necessitating termination of the study. Compared with WT mice, HFrD-fed Chrebp KO mice exhibited markedly lower blood glucose levels (Fig. 1B) and lower body temperature (Fig. 1C). Similar changes in body weight and temperature were observed in female mice (Fig. 1D & F). Blood glucose levels were slightly increased by HFrD in either group of mice (Fig. 1E). Of note, Chrebp KO mice younger than 5 weeks that were fed the HFrD became moribund within a few days, culminating in death in less than 1 week (>90% of the Chrebp KO mice; data not shown). To better understand the cause of weight loss in HFrD-fed Chrebp KO mice, we evaluated daily food consumption. We found that the average daily food intake for 3 days was similar between WT and Chrebp KO mice fed the CD but was significantly lower in Chrebp KO mice than in WT mice fed the HFrD (Fig. 1G). To determine whether reduced food intake was the sole cause of weight loss in Chrebp KO mice, we conducted a pair-feeding experiment. WT mice limited to the same amount of food (CD or HFrD) consumed by the HFrD-fed Chrebp KO mice showed no significant change in body weight over the duration of experiment (Fig. 1H). In addition, the weight loss of HFrD-fed Chrebp KO mice was reversible (Fig. 1I and Supplementary Fig. S1). Food intake in Chrebp KO mice was decreased by greater than 50% within 1 to 2 days after starting HFrD and increased right after switching back to the CD, and the symptom of diarrhea was significantly improved within 48 h. The body weight and food intake of HFrD-fed Chrebp KO mice fully recovered within 6 days after switching back to the CD. Together, these results indicate that Chrebp KO mice show significant weight loss and food intake on the HFrD relative to the CD, however, reduced food intake was not the sole cause of weight loss in HFrD-fed Chrebp KO mice.
Fig. 1. Mice lacking ChREBP lost body weight and appetite with high-fructose feeding.
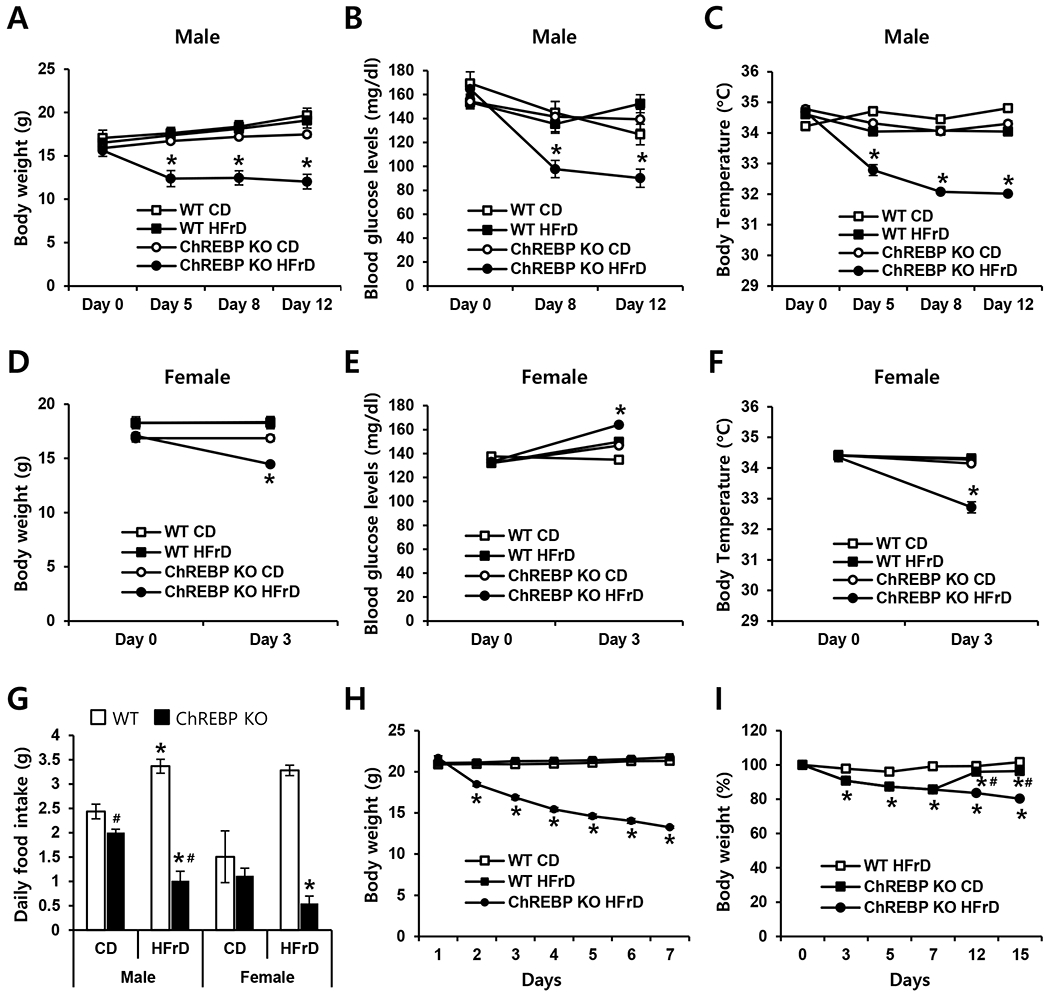
WT (n=9) and Chrebp KO (n=8) mice were fed with either the control diet (CD) or high-fructose diet (HFrD) for 3 to 12 days starting at 6 weeks of age. (A) Body weight, (B) peripheral blood glucose, and (C) body temperature of male mice were measured sequentially on days 0, 5, 8, and 12. (D) Body weight, (E) blood glucose, and (F) body temperature of female mice were measured on days 0 and 3. (G) Daily food intake (average for 3 days) was measured in male and female mice. (H) A pair-feeding experiment was conducted for 7 days, with WT mice fed the same amount of food (CD or HFrD) as was consumed by HFrD-fed Chrebp KO mice. (I) Body weight of WT mice fed the HFrD (n=9) and Chrebp KO (n=8) mice that were fed either the HFrD for 15 days or the HFrD for 7 days and then switched to the CD until day 15. Results are expressed as mean ± SEM. * p<0.05 vs. the WT HFrD group and Chrebp KO CD group (A-F), * p<0.05 vs. genotype-matched, CD-fed group; # p<0.05 vs. diet-matched, genotype control (G). * p<0.05 vs. the WT CD group (H), * p<0.05 vs. the WT HFrD group; # p<0.05 vs. genotype-matched, HFrD group (I).
3.2. Distended bowel in HFrD-fed Chrebp KO mice
We next examined whether HFrD might induce pathological changes of the intestine. On day 3 of the diet, HFrD-fed Chrebp KO mice had enlarged ceca that contained fluid. By day 5, and through day 7, these mice exhibited enlarged, red intestines and extremely distended ceca that appeared to contain both fluid and gas (Fig. 2A). Such symptoms are indicative of bacterial fermentation and intestinal irritation, both of which might further aggravate fructose malabsorption in these HFrD-fed Chrebp KO mice. In contrast, the intestines of WT or Chrebp KO mice on the CD and HFrD-fed WT mice appeared normal on days 5 and 7. Colon length and cecum weight were significantly increased in HFrD-fed Chrebp KO mice relative to HFrD-fed WT mice (Fig. 2B). In addition, fecal pellets were significantly decreased in HFrD-fed Chrebp KO mice (Fig. 2C). These changes occurred within 3–5 days after starting the HFrD. Fructose levels in the feces were 2-fold higher in HFrD-fed Chrebp KO mice by day 3 (Fig. 2D), demonstrating that Chrebp KO mice developed overt fructose intolerance accompanied by clinical signs due to increased fructose in the colon lumen. Consistent with this finding, the HFrD-fed Chrebp KO mice developed diarrhea, which can result from incomplete intestinal absorption of fructose. These results indicate that without ChREBP, a high concentration of fructose in the gut cannot be absorbed, which can lead to water influx into the lumen due to osmotic pressure, and rapid propulsion of bowel contents into the colon. Bacterial fermentation of unabsorbed fructose causes gas, bloating, abdominal pain, or diarrhea and results in decreased food intake and weight loss [30, 31], such as is shown in Fig 1
Fig. 2. Chrebp deletion caused fructose malabsorption upon high-fructose feeding.
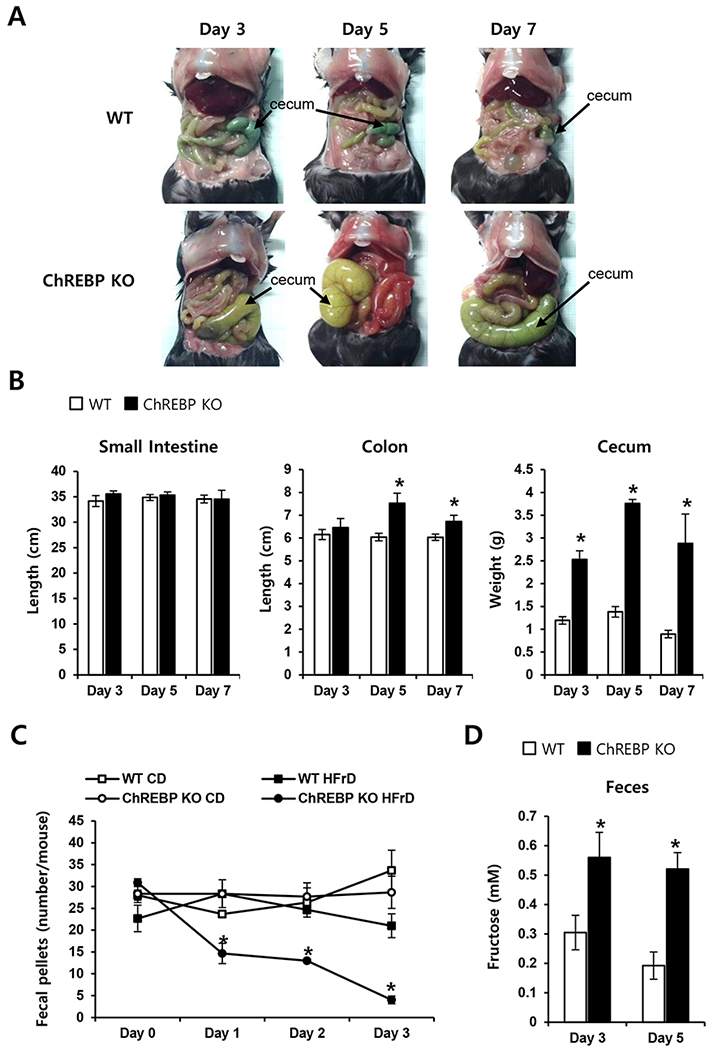
WT (n≥5) and Chrebp KO (n≥5) mice were fed either the control diet (CD) or high-fructose diet (HFrD) for 7 days starting at 8 weeks of age. On days 3, 5, and 7, the small intestine, colon, and cecum were measured. (A) The cecum and colon of HFrD-fed Chrebp KO mice were distended, whereas the intestines of HFrD-fed WT mice appeared normal. (B) Intestine length and cecum weight of HFrD-fed WT and Chrebp KO mice. (C) Formed stools (fecal pellets) were measured on days 0–3, and (D) the fructose concentration of feces was determined on days 3 and 5 in HFrD-fed WT and Chrebp KO mice. Results are expressed as mean ± SEM. * p<0.05 vs. the WT HFrD group.
3.3. Impaired fructose absorption and metabolism in HFrD-fed Chrebp KO mice
We next characterized the impact of HFrD feeding on metabolic parameters. Eight-week-old male WT and Chrebp KO mice were fed either the HFrD or CD for 3 days and plasma ALT, AST, LDH, TG, and cholesterol were examined. Plasma ALT, AST, and LDH as indicators of liver injury were significantly increased in HFrD-fed WT mice, but these increases were not observed in HFrD-fed Chrebp KO mice (Fig. 3A–C). Plasma and liver TG and cholesterol were not significantly changed with HFrD feeding in WT mice (Fig. 3D–G). Chrebp KO mice showed decreased plasma TG and cholesterol and liver TG compared with WT mice upon either diet (Fig. 3D–F). Together, these data indicate that Chrebp KO mice were resistant to liver damage by HFrD feeding, which could result from the reduced intestinal fructose absorption and transport into the liver. Based on the fact that a significant proportion of absorbed monosaccharides is converted to lactate in rats and humans [32–34], we measured lactate levels in the intestine and liver. Lactate levels in the intestine were significantly increased in HFrD-fed WT mice but this increase was not observed in HFrD-fed Chrebp KO mice (Fig. 3H). Lactate levels in the liver were higher than in the intestine regardless of genotype and they were not increased by the HFrD but, rather, were decreased in HFrD-fed Chrebp KO mice (Fig. 3I). These results indicate that HFrD feeding increases fructose conversion into lactate in the intestine but not in the liver, a process which is impaired in Chrebp KO mice.
Fig. 3. Chrebp deletion resulted in impaired fructose transport into the liver and impaired conversion to lactate in the intestine.
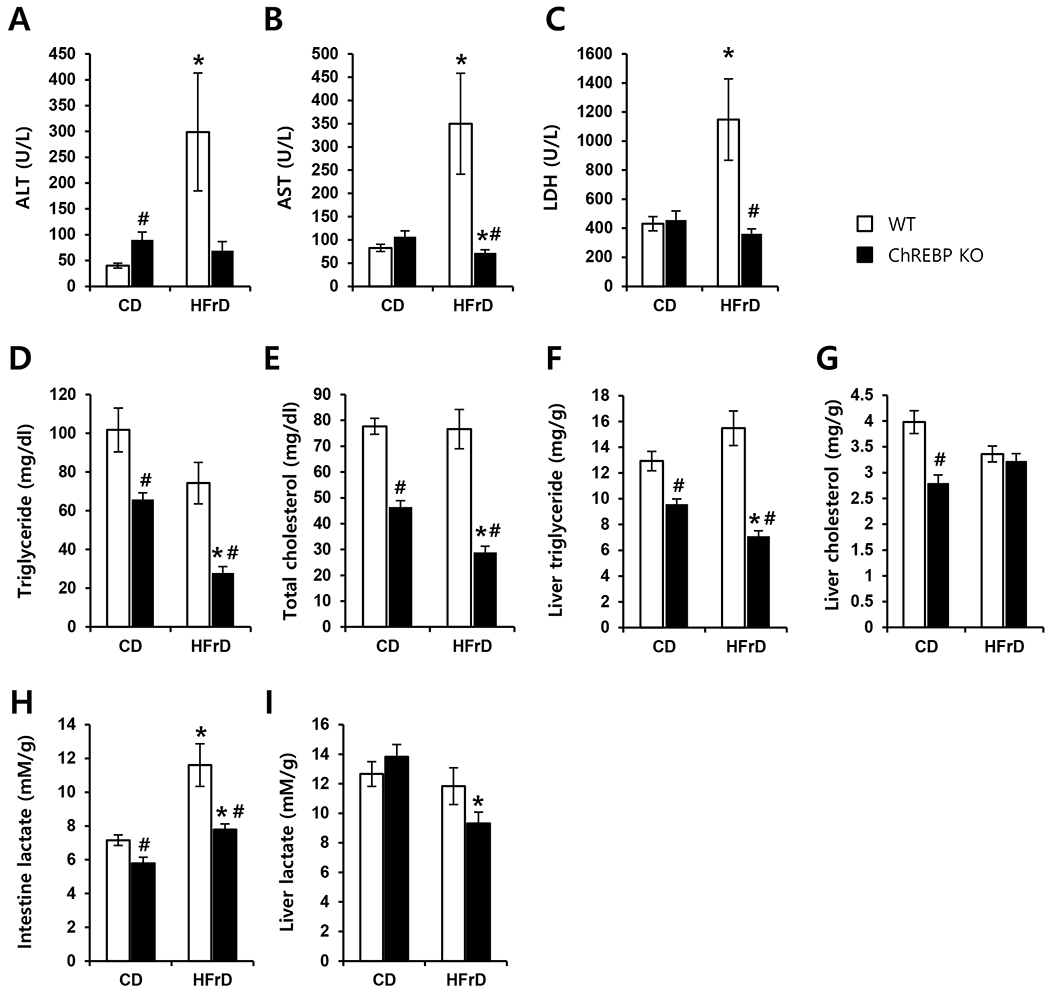
WT (n=8) and Chrebp KO (n=8) mice were fed either the control diet (CD) or high-fructose diet (HFrD) for 3 days starting at 8 weeks of age; they were then fasted for 2 h to achieve synchronization. Plasma levels of (A) ALT, (B) AST, (C) LDH, (D) triglyceride, and (E) total cholesterol, (F) liver triglyceride, and (G) liver cholesterol were measured from portal samples. Lactate levels in (H) the intestine and (I) liver were measured. Results are expressed as mean ± SEM. * p<0.05 vs. genotype-matched, CD-fed group; # p<0.05 vs. diet-matched, genotype control.
3.4. Changes in genes involved in intestinal fructose metabolism in HFrD-fed Chrebp KO mice
To explore possible mechanisms underlying fructose malabsorption, we first analyzed the expression of genes involved in fructose transport and metabolism in the intestine after mice consumed the HFrD for 3 days (Fig. 4A). We found that the HFrD had no significant effect on mRNA levels of Chrebp or Mix in WT mice. Compared with WT mice fed either diet, expression of Glut2 (the high capacity glucose transporter) and Slc5a1 (Sglt1, Na+/glucose transporter) was significantly lower in Chrebp KO mice fed either diet. However, in HFrD-fed WT mice, mRNA levels of Glut5 (the main intestinal fructose transporter) were increased 8-fold compared to WT mice fed the CD. In HFrD-fed WT mice, mRNA levels of Khk, AldoB, and Triok, which encode fructokinase, aldolase B, and triokinase, were increased 2-fold, 4-fold, and 5.5-fold respectively. However, these fructose-induced increases were attenuated in Chrebp KO mice, and expression of these genes was also lower in Chrebp KO mice fed the CD. In accordance with the intestine lactate levels shown in Fig. 3H, Ldh expression was lower in Chrebp KO mice compared with WT mice and a fructose-induced increase was observed only in WT mice. Previously, it was reported that mRNA levels of key gluconeogenic enzymes, glucose-6-phospatase (G6pc) and fructose-1,6-bisphosphatase (Fbp1) increased significantly in fructose-perfused intestines [35]. Consistent with this result, the expression of these two gluconeogenic genes was dramatically increased by fructose in WT mice but the induction was completely blunted in Chrebp KO mice.
Fig. 4. Chrebp deletion decreased fructose-induced transporter and fructolytic gene expression.
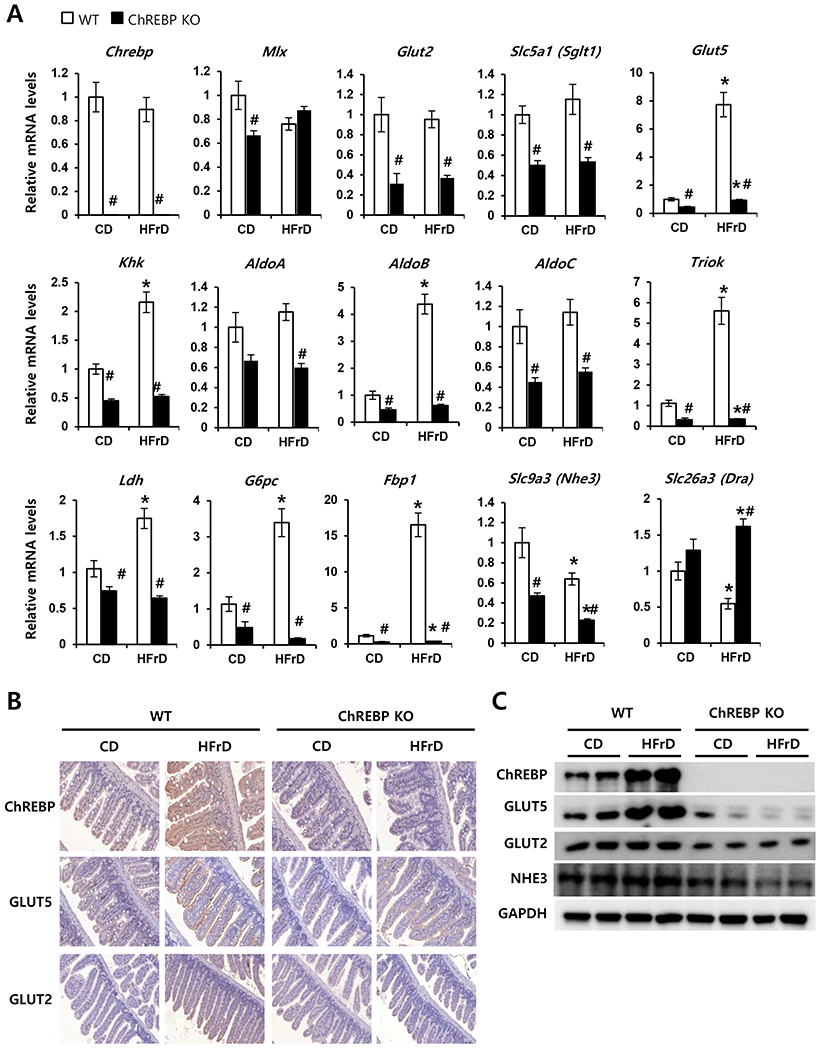
WT (n=8) and Chrebp KO (n=8) mice were fed either the control diet (CD) or high-fructose diet (HFrD) for 3 days starting at 8 weeks of age. (A) Relative expression of genes encoding the transcription factors Chrebp and Mix, glucose and/or fructose transporter genes (Glut2, Sglt1, and Glut 5), fructolytic genes (Khk, AldoA, AldoB, AldoC, TrioK, and Ldh), gluconeogenic genes (G6pc and Fbp1), and ion transporter genes (Nhe3, and Dra) in the intestine were analyzed by qPCR. Target gene expression was normalized to the expression of Rplp0 and expressed as mean ± SEM. *p<0.05 vs. genotype-matched, CD-fed group; #p<0.05 vs. diet-matched, genotype control. (B) Representative immunohistochemistry images of ChREBP, GLUT5, and GLUT2 in the small intestine of WT (C57BL/6J) and Chrebp KO mice. (C) Western blot analysis of ChREBP, GLUT5, GLUT2, and NHE3 in the small intestine of WT and Chrebp KO mice fed the CD or HFrD.
We next evaluated the expression of genes involved in electrolyte transport, because decreased Na+ absorption and increased electrogenic Cl− secretion can cause luminal fluid accumulation and diarrhea [36]. The mRNA levels of Slc9a3 (Nhe3), which encodes the Na+/H+ exchanger NHE3, were significantly decreased by the HFrD in Chrebp KO mice but not in WT mice. In contrast, the mRNA levels of Slc26a3 (Dra), which encodes the Cl−/HCO3+ exchanger DRA, were not significantly changed by HFrD in either group of mice. Changes in protein levels of ChREBP, GLUT5, GLUT2, and NHE3 correlated with the corresponding mRNA levels (Fig. 4B & C). These results suggest that intestinal ChREBP plays a key role in the dietary fructose transport as well as conversion into lactate and glucose through the fructose-induced increase of genes involved in fructose transport (Glut5), fructolysis (Khk, AldoB, Triok, Ldh), and gluconeogenesis (G6pc and Fbp1).
3.5. ChREBP is necessary for fructose-mediated Glut5 induction
To identify direct targets of ChREBP that mediate the effects of fructose on fructose transport and metabolism, liquid fructose or glucose was administered by oral gavage to WT and Chrebp KO mice after a 4-h fast. Previous studies have shown that Glut5 mRNA levels and fructose transport rates in rodents increase within 2–4 h of fructose consumption or after intestinal perfusion of fructose during weaning [12, 37]. Therefore, we evaluated intestinal gene expression 4 h after oral administration of liquid fructose or glucose. Blood glucose or plasma fructose concentrations were increased in both WT and Chrebp KO mice within 20 min after administration (Fig. 5A). It is noteworthy that plasma fructose concentration in Chrebp KO mice was comparable with WT mice at any time point after oral fructose gavage, partially due to the impaired fructose transport and fructolysis in the peripheral tissues [38].
Fig. 5. ChREBP directly increases fructose-mediated Glut5 gene expression.
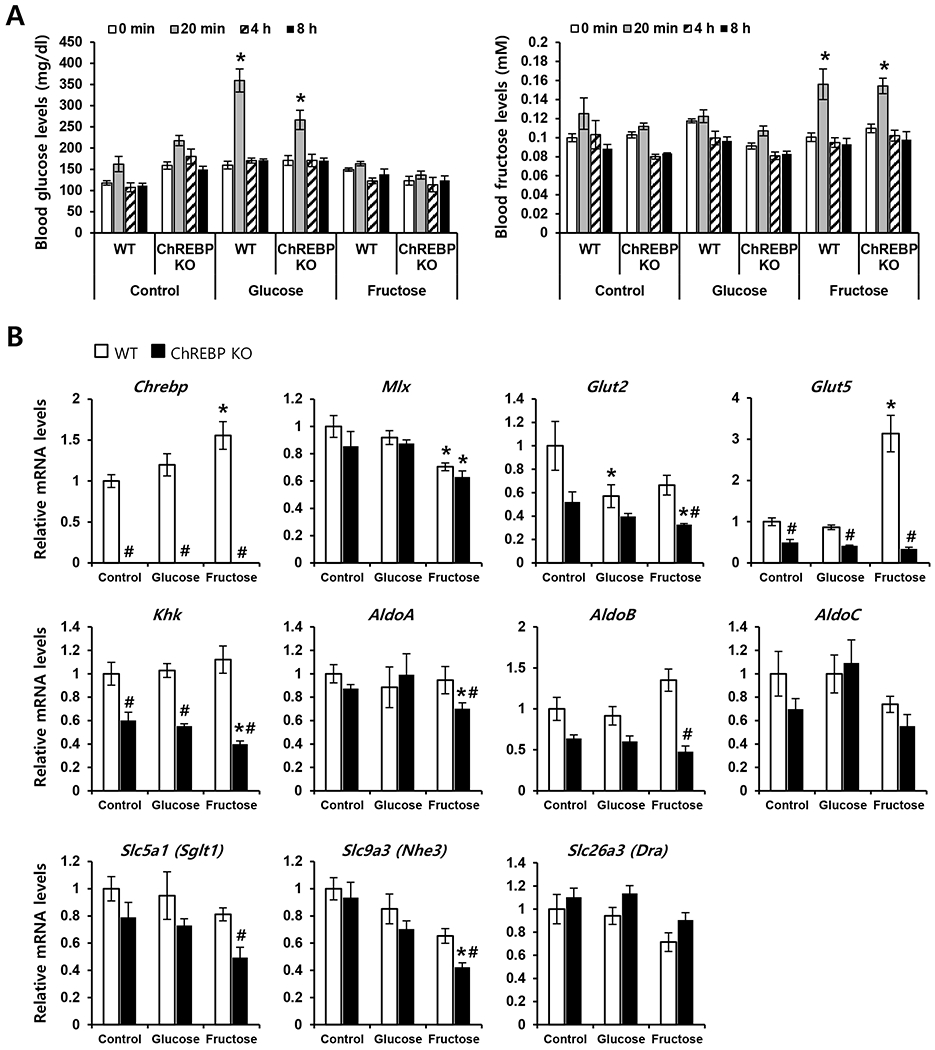
WT and Chrebp KO mice were given Dulbecco’s phosphate buffered saline (control), 20% fructose, or 20% glucose by oral gavage (n=4 each group). (A) Plasma fructose and glucose concentrations were measured at 0 min, 20 min, 4 h, and 8 h. (B) After 4 h, the expression of genes encoding the transcription factors Chrebp and Mix, fructose transporter genes Glut2 and Glut5, fructolytic genes Khk, AldoA, AldoB, and AldoC, and ion transporter genes Sglt1, Nhe3, and Dra were analyzed by qPCR. The expression of target genes was normalized to Rplp0 expression and expressed as mean ± SEM. * p<0.05 vs. genotype-matched, control group; # p<0.05 vs. administration-matched, genotype control.
Acute fructose administration produced a 3-fold increase in Glut5 mRNA level in WT mice but did not significantly change Glut5 expression in Chrebp KO mice (Fig. 5B). Compared with WT mice, Chrebp KO mice showed lower basal mRNA levels of Glut2 and Khk, which were not changed by acute glucose or fructose administration. The basal level of AldoB mRNA was lower in Chrebp KO mice compared to WT mice. AldoB expression was increased slightly with fructose administration in WT mice but not in Chrebp KO mice. In contrast, the mRNA levels of A Ido A and AldoC were not significantly changed with administration of glucose or fructose in either group of mice. The Nhe3 mRNA level was not significantly changed with glucose or fructose administration in WT mice but decreased slightly with fructose administration in Chrebp KO mice. The mRNA levels of Sgltl and Dra were not changed by fructose administration in either group of mice. These data suggest that ChREBP functions as a transcriptional activator for fructose-mediated Glut5 induction and is also required for appropriate expression of Nhe3 in the intestine upon high fructose ingestion.
3.6. ChREBP directly regulates Glut5 gene expression through functional ChoREs
To establish the mechanism by which ChREBP regulates Glut5 gene expression, we performed promoter analysis. In silico analysis of the mouse Glut5 promoter revealed five putative ChoREs in the 2-kb upstream region of the gene. Therefore, a nearly 2-kb fragment of the 5′-flanking region of the gene was cloned and ligated into a luciferase reporter plasmid (mGLUT5–2165, Fig. 6A) and transfected into Caco-2BBE human intestinal cells. The full-length native promoter increased luciferase activity by 150-fold compared with the empty vector, confirming Glut5 promoter activity in intestinal cells. We then tested the effect of fructose on promoter activity in the presence or absence of the transcription factors ChREBP and MLX. Our results showed increased luciferase activity of mGLUT5–2165 upon fructose treatment only when the reporter construct was transfected along with expression vectors for ChREBP and its heterodimer partner MLX (Fig. 6B). To evaluate putative ChoRE sequences in the Glut5 promoter, serially deleted promoter constructs were transfected along with expression vectors for ChREBP and MLX (Fig. 6C). Transcriptional activation by ChREBP/MLX was completely abolished with the deletion of ChoRE1, indicating that ChREBP activates the Glut5 promoter through ChoRE1 in Caco-2BBE cells. To confirm the in vivo association of ChREBP with the Glut5 promoter, ChIP-qPCR was performed using primers specifically designed for the ChoREs (Fig. 6D). Our results showed binding of ChREBP to ChoREl in the intestinal tissue of HFrD-fed WT mice but not in WT mice fed the CD or Chrebp KO mice fed either diet. We also evaluated whether ChREBP binds to the putative ChoRE on the Nhe3 promoter using ChIP-qPCR. Our results show that ChREBP did not bind to the Nhe3 promoter, suggesting that Nhe3 is an indirect target of ChREBP (Supplementary Fig. S2). Collectively, these results demonstrate that ChREBP directly binds to ChoREl of the Glut5 promoter in the intestine, and this protein-DNA interaction is dependent on diet.
Fig. 6. ChREBP directly binds to carbohydrate response elements in the Glut5 promoter.
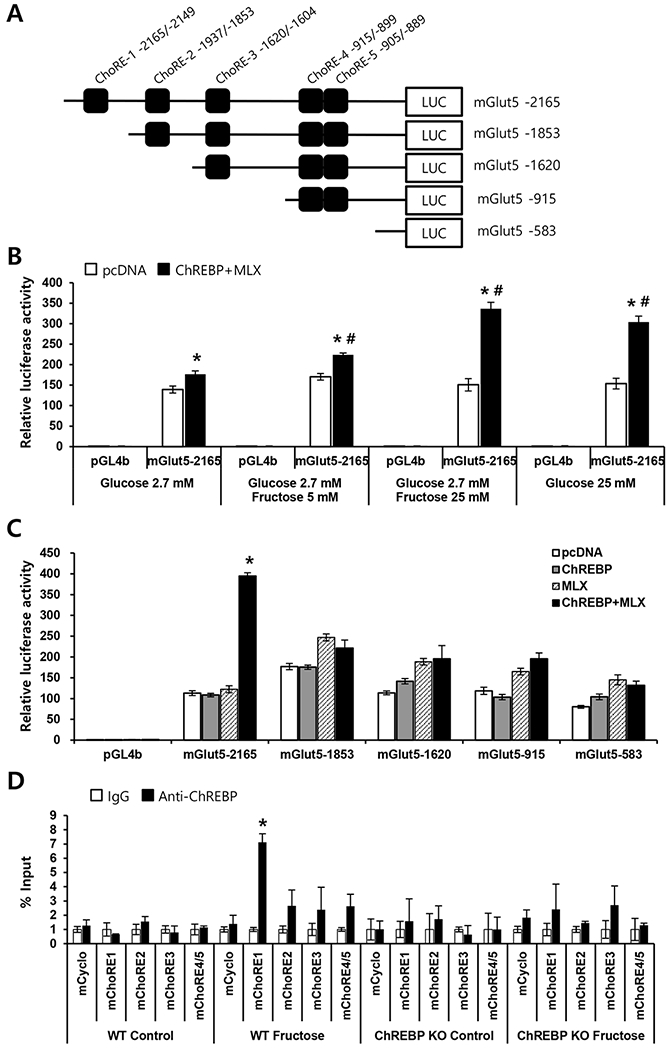
(A) Locations and sequences of carbohydrate response elements (ChoREs) in the mouse Glut5 promoter and schematic diagram of the serial deletion Glut5 promoter-luciferase reporter constructs. (B) The full-length Glut5 promoter-luciferase reporter construct (mGlut5–2165) was transfected into Caco-2BBE cells along with vectors expressing Chrebp and Mix or empty pcDNA vector (control). Transfected cells were maintained in DMEM containing the indicated concentration of glucose and/or fructose for 48 h. Results are expressed as fold increase in luciferase activity relative to that of the control vector (pGL4b) in 2.7 mM glucose. *p < 0.05 vs. pcDNA, #p < 0.05 vs. 2.7 mM glucose-treated group. (C) Serially deleted Glut5 promoter-luciferase reporter constructs were transfected into Caco-2BBE cells, with or without vectors expressing Chrebp and/or Mix. After 48 h, luciferase activity was determined. Results are expressed as fold increase in luciferase activity (mean ± SEM) relative to that of the control vector pGL4b. *p < 0.05 vs. pcDNA. (D) ChIP assay for ChREBP binding to ChoREs in the Glut5 gene promoter. Chromatin was extracted from intestinal tissue of WT or Chrebp KO mice that received DPBS (control) or 20% fructose (Fructose) for 4 h (n=3 per group) by oral gavage. Chromatin was immunoprecipitated with control IgG or anti-ChREBP antibody and amplified by qPCR. Target gene enrichment was normalized to the enrichment of cyclophilin. Results are expressed as fold increase in the signal (mean ± SEM) compared to control IgG. *p < 0.05 vs. IgG.
4. Discussion
Excessive fructose consumption leads to fructose malabsorption, which is linked to irritable bowel syndrome (IBS). Although impaired fructose transport is considered a main cause of fructose malabsorption, the molecular mechanism underlying fructose-induced upregulation of fructose transporters is poorly understood. Here we demonstrate that ChREBP deficiency results in severe fructose malabsorption mainly due to a decreased capacity for fructose absorption resulting from insufficient induction of GLUT5 upon high fructose ingestion (Fig. 7). As a result, a high concentration of fructose in the gut cannot be absorbed, which can lead to water influx into the lumen due to osmotic pressure, and rapid propulsion of bowel contents into the colon. Fermentation of unabsorbed fructose in the colon might cause gas, bloating, abdominal pain, or diarrhea and results in decreased food intake. As shown in IBS patients [31, 39], avoiding fructose in the diet was found to improve all of the IBS symptoms that we observed in HFrD-fed Chrebp KO mice. This recovery in human patients is consistent with our findings that HFrD-induced weight loss and diarrhea are reversible in Chrebp KO mice, indicating that the clinical effects of fructose malabsorption and metabolism are reversible.
Fig. 7. Model showing the effects of ChREBP deletion on fructose transport and metabolism upon high-fructose diet feeding.
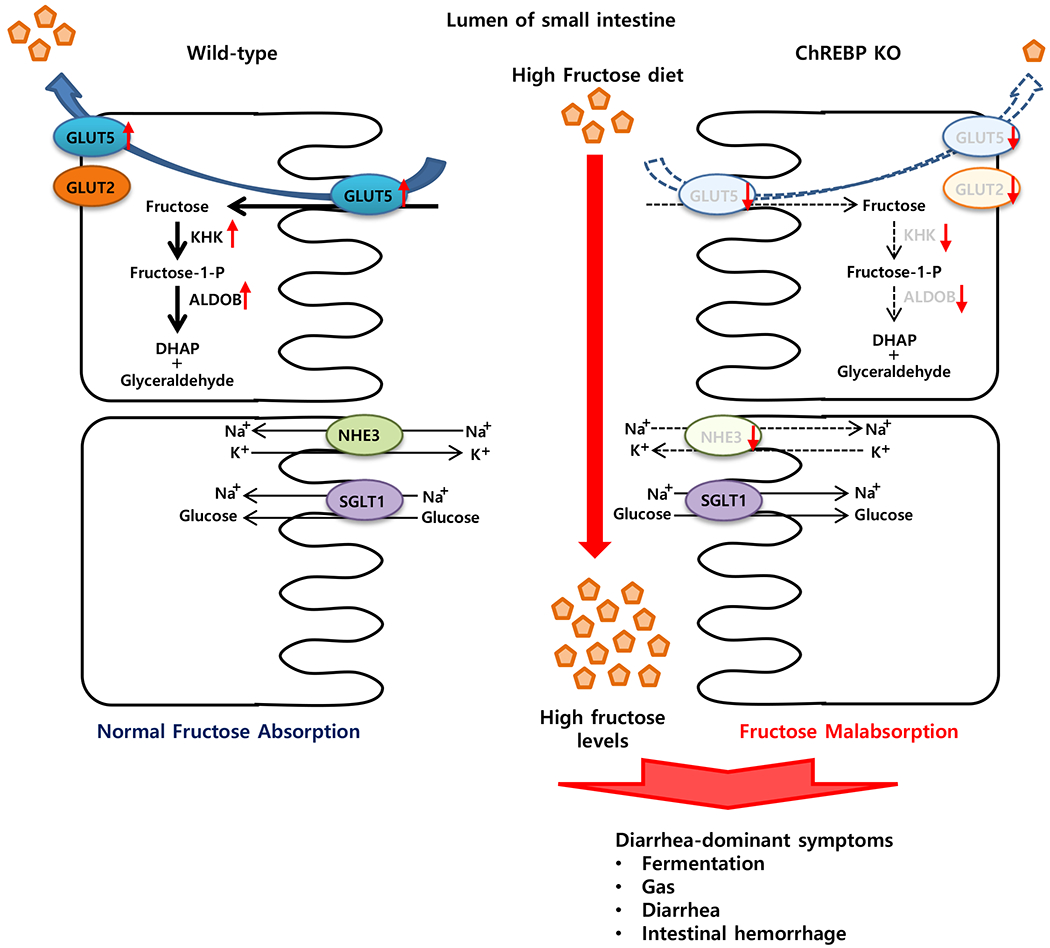
Upon high fructose ingestion, genes involved in fructose transport (Glut5), fructolysis (Khk, AldoB, Triok, and Ldh), and gluconeogenesis (G6pc and Fbp1) are significantly increased in the intestinal cells. However, Chrebp KO mice show impaired fructose absorption and diarrhea, due to the inability to upregulate GLUT5 as well as fructolytic and glucogenic enzymes to match fructose levels in the diet, and the decreased expression of NHE3, a contributor to Na+ and water absorption in the intestine. As a result, HFrD-fed Chrebp KO mice develop diarrhea-dominant irritable bowel symptoms such as gas, bloating, abdominal pain, or diarrhea. Significantly increased genes by high fructose in WT mice but not in Chrebp KO mice are indicated in red color. ALDOB, aldolase B; ChREBP, carbohydrate response element-binding protein; DHAP, dihydroxyacetone phosphate; F-1-P, fructose-1-phosphate; F-1,6-BP, fructose-1,6-bisphosphate; FBP1, fructose-1,6-bisphosphatase; GA, glyceraldehyde; GAP, glyceraldehyde-3-phosphate; GLUT2, glucose transporter 2; GLUT5, glucose transporter 5; G-6-P, glucose-6-phosphate; G6PC, glucose-6-phosphatase; KHK, fructokinase; LDH, lactate dehydrogenase; NHE3, Na+/H+ exchanger type3; SGLT1, Na+/glucose transporter; TrioK, triokinase.
Chrebp KO mice exhibited normal food intake and growth when fed low-fructose or fructose-free diets but rapidly lost weight when fed the HFrD, as the unabsorbed fructose caused distention, localized fluid retention, and nutrient malabsorption in the gastrointestinal tract. Another contributing, though not exclusive, factor to the weight loss in HFrD-fed Chrebp KO mice is decreased food intake. The reason for the decreased appetite in HFrD-fed Chrebp KO mice is unclear, but pain, flatulence, and diarrhea resulting from incomplete intestinal absorption of fructose could all be factors. Although not investigated here, we speculate that the disturbed secretion of gut hormones, known to influence appetite and metabolism, may also be a factor in HFrD-fed Chrebp KO mice. Therefore, the reasons for the decreased appetite in HFrd-fed Chrebp KO mice warrant further investigation.
In our study Chrebp KO mice showed severe diarrhea as early as 3–5 days after the start of the HFrD, whereas Glut5 KO mice have been reported to exhibit relatively well-formed stools when eating a similar diet [13]. These different phenotypes could be explained by differential expression of NHE3. Intestinal NHE3 is the major Na+/H+ exchanger at the apical membrane of intestinal epithelial cells [40] and its transport function is essential for the regulation of salt and water homeostasis. In mice, NHE3 deficiency leads to mild diarrhea and distention in all intestinal segments [41]. Consistent with these results, HFrD-fed Chrebp KO mice showed significantly decreased NHE3 expression, whereas HFrD-fed Gluts KO mice showed increased NHE3 expression [13]. However, we did not observe the direct binding of ChREBP to the putative ChoRE in the Nhe3 promoter in HFrD-fed mice (Supplementary Fig. S2), suggesting that Nhe3 is an indirect target of ChREBP. Further studies are needed to identify the mechanism by which ChREBP regulates NHE3 protein levels in response to fructose consumption.
In this study, we observed acute liver damage in HFrD-fed WT mice but not in Chrebp KO mice. The HFrD feeding for 3 days fails to increase plasma and liver TG in WT mice. Therefore a possible mechanism by which fructose may induce liver toxicity involves the influx of fructose itself into the liver [42, 43]. Fructose is metabolized by KHK, which phosphorylates fructose to fructose-1-phosphate rapidly, resulting in marked ATP depletion coupled with the absence of a feedback inhibition. In WT mice, excessive fructose consumption increases intestinal fructose uptake and delivery into the liver, resulting in increased production of fructose-1-phosphate and ATP depletion. Whereas, in Chrebp KO mice, low fructose delivery to the liver due to insufficient fructose uptake in the intestine may prevent such ATP depletion and liver damage.
Recently Jang et al. [34] reported that most dietary fructose is cleared by the intestine and that clearance requires KHK. They found that the intestine converts fructose to glucose and various organic acids (lactate, glycerate, TCA intermediates, and amino acids). In agreement with their results, we also observed the significantly increased expression of genes involved in fructose transport (Glut5), fructolysis (Khk, AldoB, Triok, and Ldh), and gluconeogenesis (G6pc and Fbp1) in HFrD-fed WT mice. In Chrebp KO mice, expression of these genes is significantly decreased and fructose-induced increased expression of these genes is blunted. It is known that the fructose-induced expression of these genes requires increased GLUT5 activity. Therefore, further studies are needed to clarify whether these genes are directly regulated by ChREBP or indirectly by increased fructose and/or its metabolites downstream of GLUT5 activity. Intestine-specific induction of GLUT5 in Chrebp KO mice will be a valuable tool to test this question.
Fructose absorption in humans appears to be limited by high fructose consumption [7], and this is consistent with the restricted absorption capacity of a facilitative transport system. The inability to upregulate GLUT5 protein levels to match fructose levels in the diet may also be a cause of fructose malabsorption and diarrhea-predominant irritable bowel syndrome in humans. Several studies showed no correlation between fructose malabsorption and Glut5 gene expression or variants in humans [44, 45]. These results do not necessarily preclude a role for GLUT5 in fructose malabsorption, because those studies were performed on fasted patients and the cohort size was small. It is possible that reduced transport could result from impaired upregulation of gene expression or activity of GLUT5 in response to dietary fructose. Our findings underscore the need to evaluate genetic defects in ChREBP and the Glut5 promoter region in adult patients with fructose malabsorption and diarrhea-predominant irritable bowel syndrome.
In conclusion, our study demonstrated the role of ChREBP in intestinal fructose absorption in mice challenged with a high-fructose diet and supports the use of Chrebp KO mice as a model for irritable bowel syndrome with diarrhea. Further studies are needed to better understand tissue-specific actions of the ChREBP pathway in response to a high-fructose diet. Targeting ChREBP may be a potential therapy for fructose-induced obesity, hepatic steatosis, and hypertriglyceridemia, but such therapy could be accompanied by intestinal fructose malabsorption as shown in this study.
Supplementary Material
Acknowledgements
We thank Yun-Seung Jeong for assistance with the ChIP assay and Dr. Ok-Hee Kim for measuring biochemical changes.
Funding
This work was supported by grants to J-Y Cha by the Basic Science Research Program through the National Research Foundation of Korea (NRF) funded by the Ministry of Education, Science and Technology (NRF-2016R1A2B4015866); the Korea Health Technology R&D Project through the Korea Health Industry Development Institute (KHIDI) funded by the Ministry of Health & Welfare (HI14C1135); and the Korea Mouse Phenotyping Project (2013M3A9D5072550) of the Ministry of Science, ICT and Future Planning through the National Research Foundation and to Y-B Kim by the National Institutes of Health (R01DK083567).
Abbreviations:
- CD
control diet
- ChREBP
carbohydrate response element-binding protein
- FBP1
fructose-1,6-bisphosphatase
- GLUT2
glucose transporter 2
- GLUT5
glucose transporter 5
- G6PC
glucose-6-phospatase
- IBS
irritable bowel syndrome
- HFrD
high-fructose diet
- KHK
fructokinase
- KO
knockout
- LDH
lactate dehydrogenase
- MLX
Max-like protein X
- NHE3
Na+/H+ exchanger type3
- TG
triglyceride
- TrioK
triokinase
- WT
wild type
Footnotes
Disclosure statement
The authors declare no conflicts of interest.
References
- [1].Elliott SS, Keim NL, Stern JS, Teff K, Havel PJ. Fructose, weight gain, and the insulin resistance syndrome. Am J Clin Nutr. 2002;76:911–22. [DOI] [PubMed] [Google Scholar]
- [2].Haidari M, Leung N, Mahbub F, Uffelman KD, Kohen-Avramoglu R, Lewis GF, et al. Fasting and postprandial overproduction of intestinally derived lipoproteins in an animal model of insulin resistance. Evidence that chronic fructose feeding in the hamster is accompanied by enhanced intestinal de novo lipogenesis and ApoB48-containing lipoprotein overproduction. J Biol Chem. 2002;277:31646–55. [DOI] [PubMed] [Google Scholar]
- [3].Stanhope KL. Role of fructose-containing sugars in the epidemics of obesity and metabolic syndrome. Annu Rev Med. 2012;63:329–43. [DOI] [PubMed] [Google Scholar]
- [4].Le KA, Ith M, Kreis R, Faeh D, Bortolotti M, Tran C, et al. Fructose overconsumption causes dyslipidemia and ectopic lipid deposition in healthy subjects with and without a family history of type 2 diabetes. Am J Clin Nutr. 2009;89:1760–5. [DOI] [PubMed] [Google Scholar]
- [5].Jones HF, Butler RN, Brooks DA. Intestinal fructose transport and malabsorption in humans. Am J Physiol Gastrointest Liver Physiol. 2011;300:G202–6. [DOI] [PubMed] [Google Scholar]
- [6].Heizer WD, Southern S, McGovern S. The role of diet in symptoms of irritable bowel syndrome in adults: a narrative review. J Am Diet Assoc 2009;109:1204–14. [DOI] [PubMed] [Google Scholar]
- [7].Choi YK, Johlin FC Jr., Summers RW, Jackson M, Rao SS. Fructose intolerance: an under-recognized problem. Am J Gastroenterol. 2003;98:1348–53. [DOI] [PubMed] [Google Scholar]
- [8].Ravich WJ, Bayless TM. Carbohydrate absorption and malabsorption. Clin Gastroenterol. 1983;12:335–56. [PubMed] [Google Scholar]
- [9].Thorens B, Mueckler M. Glucose transporters in the 21st Century. Am J Physiol Endocrinol Metab. 2010;298:E141–5. [DOI] [PMC free article] [PubMed] [Google Scholar]
- [10].Burant CF, Takeda J, Brot-Laroche E, Bell GI, Davidson NO. Fructose transporter in human spermatozoa and small intestine is GLUT5. J Biol Chem. 1992;267:14523–6. [PubMed] [Google Scholar]
- [11].Corpe CP, Burant CF, Hoekstra JH. Intestinal fructose absorption: clinical and molecular aspects. J Pediatr Gastroenterol Nutr. 1999;28:364–74. [DOI] [PubMed] [Google Scholar]
- [12].Jiang L, David ES, Espina N, Ferraris RP. GLUT-5 expression in neonatal rats: crypt-villus location and age-dependent regulation. Am J Physiol Gastrointest Liver Physiol. 2001;281:G666–74. [DOI] [PubMed] [Google Scholar]
- [13].Barone S, Fussell SL, Singh AK, Lucas F, Xu J, Kim C, et al. Slc2a5 (Glut5) is essential for the absorption of fructose in the intestine and generation of fructose-induced hypertension. J Biol Chem. 2009;284:5056–66. [DOI] [PMC free article] [PubMed] [Google Scholar]
- [14].Castello A, Guma A, Sevilla L, Furriols M, Testar X, Palacin M, et al. Regulation of GLUT5 gene expression in rat intestinal mucosa: regional distribution, circadian rhythm, perinatal development and effect of diabetes. The Biochemical journal. 1995;309 (Pt 1):271–7. [DOI] [PMC free article] [PubMed] [Google Scholar]
- [15].Shu R, David ES, Ferraris RP. Dietary fructose enhances intestinal fructose transport and GLUT5 expression in weaning rats. The American journal of physiology. 1997;272:G446–53. [DOI] [PubMed] [Google Scholar]
- [16].Suzuki T, Douard V, Mochizuki K, Goda T, Ferraris RP. Diet-induced epigenetic regulation in vivo of the intestinal fructose transporter Glut5 during development of rat small intestine. The Biochemical journal. 2011;435:43–53. [DOI] [PubMed] [Google Scholar]
- [17].Takabe S, Mochizuki K, Goda T. De-phosphorylation of GR at Ser203 in nuclei associates with GR nuclear translocation and GLUT5 gene expression in Caco-2 cells. Arch Biochem Biophys. 2008;475:1–6. [DOI] [PubMed] [Google Scholar]
- [18].Mochizuki K, Takabe S, Goda T. Changes on histone H3 modifications on the GLUT5 gene and its expression in Caco-2 cells co-treated with a p44/42 MAPK inhibitor and glucocorticoid hormone. Biochem Biophys Res Commun. 2008;371:324–7. [DOI] [PubMed] [Google Scholar]
- [19].Iizuka K, Bruick RK, Liang G, Horton JD, Uyeda K. Deficiency of carbohydrate response element-binding protein (ChREBP) reduces lipogenesis as well as glycolysis. Proceedings of the National Academy of Sciences of the United States of America. 2004;101:7281–6. [DOI] [PMC free article] [PubMed] [Google Scholar]
- [20].Yamashita H, Takenoshita M, Sakurai M, Bruick RK, Henzel WJ, Shillinglaw W, et al. A glucose-responsive transcription factor that regulates carbohydrate metabolism in the liver. Proceedings of the National Academy of Sciences of the United States of America. 2001;98:9116–21. [DOI] [PMC free article] [PubMed] [Google Scholar]
- [21].Filhoulaud G, Guilmeau S, Dentin R, Girard J, Postic C. Novel insights into ChREBP regulation and function. Trends Endocrinol Metab. 2013;24:257–68. [DOI] [PubMed] [Google Scholar]
- [22].Ma L, Tsatsos NG, Towle HC. Direct role of ChREBP.Mlx in regulating hepatic glucose-responsive genes. J Biol Chem. 2005;280:12019–27. [DOI] [PubMed] [Google Scholar]
- [23].Stoeckman AK, Ma L, Towle HC. Mlx is the functional heteromeric partner of the carbohydrate response element-binding protein in glucose regulation of lipogenic enzyme genes. J Biol Chem. 2004;279:15662–9. [DOI] [PubMed] [Google Scholar]
- [24].Lanaspa MA, Sanchez-Lozada LG, Cicerchi C, Li N, Roncal-Jimenez CA, Ishimoto T, et al. Uric acid stimulates fructokinase and accelerates fructose metabolism in the development of fatty liver. PLoS One. 2012;7:e47948. [DOI] [PMC free article] [PubMed] [Google Scholar]
- [25].Koo HY, Miyashita M, Cho BH, Nakamura MT. Replacing dietary glucose with fructose increases ChREBP activity and SREBP-1 protein in rat liver nucleus. Biochem Biophys Res Commun. 2009;390:285–9. [DOI] [PubMed] [Google Scholar]
- [26].Bae JS, Park JM, Lee J, Oh BC, Jang SH, Lee YB, et al. Amelioration of non-alcoholic fatty liver disease with NPC1L1-targeted IgY or n-3 polyunsaturated fatty acids in mice. Metabolism. 2017;66:32–44. [DOI] [PubMed] [Google Scholar]
- [27].Livak KJ, Schmittgen TD. Analysis of relative gene expression data using real-time quantitative PCR and the 2(-Delta Delta C(T)) Method. Methods. 2001;25:402–8. [DOI] [PubMed] [Google Scholar]
- [28].Jeong YS, Kim D, Lee YS, Kim HJ, Han JY, Im SS, et al. Integrated expression profiling and genome-wide analysis of ChREBP targets reveals the dual role for ChREBP in glucose-regulated gene expression. PLoS One. 2011;6:e22544. [DOI] [PMC free article] [PubMed] [Google Scholar]
- [29].Cha JY, Repa JJ. The liver X receptor (LXR) and hepatic lipogenesis. The carbohydrate-response element-binding protein is a target gene of LXR. J Biol Chem. 2007;282:743–51. [DOI] [PubMed] [Google Scholar]
- [30].Ikechi R, Fischer BD, DeSipio J, Phadtare S. Irritable Bowel Syndrome: Clinical Manifestations, Dietary Influences, and Management. Healthcare (Basel). 2017;5. [DOI] [PMC free article] [PubMed] [Google Scholar]
- [31].Choi YK, Kraft N, Zimmerman B, Jackson M, Rao SS. Fructose intolerance in IBS and utility of fructose-restricted diet. J Clin Gastroenterol. 2008;42:233–8. [DOI] [PubMed] [Google Scholar]
- [32].Hanson PJ, Parsons DS. The utilization of glucose and production of lactate by in vitro preparations of rat small intestine: effects of vascular perfusion. J Physiol. 1976;255:775–95. [DOI] [PMC free article] [PubMed] [Google Scholar]
- [33].Holloway PA, Parsons DS. Absorption and metabolism of fructose by rat jejunum. The Biochemical journal. 1984;222:57–64. [DOI] [PMC free article] [PubMed] [Google Scholar]
- [34].Jang C, Hui S, Lu W, Cowan AJ, Morscher RJ, Lee G, et al. The Small Intestine Converts Dietary Fructose into Glucose and Organic Acids. Cell Metab. 2018;27:351–61 e3. [DOI] [PMC free article] [PubMed] [Google Scholar]
- [35].Cui XL, Soteropoulos P, Tolias P, Ferraris RP. Fructose-responsive genes in the small intestine of neonatal rats. Physiol Genomics. 2004;18:206–17. [DOI] [PubMed] [Google Scholar]
- [36].Dominguez Rieg JA, de la Mora Chavez S, Rieg T. Novel developments in differentiating the role of renal and intestinal sodium hydrogen exchanger 3. Am J Physiol Regul Integr Comp Physiol. 2016;311:R1186–R91. [DOI] [PMC free article] [PubMed] [Google Scholar]
- [37].Corpe CP, Bovelander FJ, Hoekstra JH, Burant CF. The small intestinal fructose transporters: site of dietary perception and evidence for diurnal and fructose sensitive control elements. Biochim Biophys Acta. 1998;1402:229–38. [DOI] [PubMed] [Google Scholar]
- [38].Patel C, Sugimoto K, Douard V, Shah A, Inui H, Yamanouchi T, et al. Effect of dietary fructose on portal and systemic serum fructose levels in rats and in KHK−/− and GLUT5−/− mice. Am J Physiol Gastrointest Liver Physiol. 2015;309:G779–90. [DOI] [PMC free article] [PubMed] [Google Scholar]
- [39].Shepherd SJ, Gibson PR. Fructose malabsorption and symptoms of irritable bowel syndrome: guidelines for effective dietary management. J Am Diet Assoc. 2006;106:1631–9. [DOI] [PubMed] [Google Scholar]
- [40].Hoogerwerf WA, Tsao SC, Devuyst O, Levine SA, Yun CH, Yip JW, et al. NHE2 and NHE3 are human and rabbit intestinal brush-border proteins. The American journal of physiology. 1996;270:G29–41. [DOI] [PubMed] [Google Scholar]
- [41].Schultheis PJ, Clarke LL, Meneton P, Miller ML, Soleimani M, Gawenis LR, et al. Renal and intestinal absorptive defects in mice lacking the NHE3 Na+/H+ exchanger. Nat Genet. 1998;19:282–5. [DOI] [PubMed] [Google Scholar]
- [42].Kim MS, Krawczyk SA, Doridot L, Fowler AJ, Wang JX, Trauger SA, et al. ChREBP regulates fructose-induced glucose production independently of insulin signaling. J Clin Invest. 2016;126:4372–86. [DOI] [PMC free article] [PubMed] [Google Scholar]
- [43].Zhang D, Tong X, VanDommelen K, Gupta N, Stamper K, Brady GF, et al. Lipogenic transcription factor ChREBP mediates fructose-induced metabolic adaptations to prevent hepatotoxicity. J Clin Invest. 2017;127:2855–67. [DOI] [PMC free article] [PubMed] [Google Scholar]
- [44].Wilder-Smith CH, Li X, Ho SS, Leong SM, Wong RK, Koay ES, et al. Fructose transporters GLUT5 and GLUT2 expression in adult patients with fructose intolerance. United European Gastroenterol J. 2014;2:14–21. [DOI] [PMC free article] [PubMed] [Google Scholar]
- [45].Wasserman D, Hoekstra JH, Tolia V, Taylor CJ, Kirschner BS, Takeda J, et al. Molecular analysis of the fructose transporter gene (GLUT5) in isolated fructose malabsorption. J Clin Invest. 1996;98:2398–402. [DOI] [PMC free article] [PubMed] [Google Scholar]
Associated Data
This section collects any data citations, data availability statements, or supplementary materials included in this article.