Abstract
Objective
Non-alcoholic fatty liver disease (NAFLD) is the leading cause of end-stage liver diseases worldwide. Understanding NAFLD prevalence and trends over time at the global, regional and national levels is critical to understanding the NAFLD disease burden and creating more tailored prevention strategies.
Design
Population-based observational study.
Setting
The study was global, including 21 regions and 195 countries or territories.
Main outcomes measure
The estimated annual percentage change for NAFLD prevalence.
Results
Worldwide, cases of NAFLD have increased from 391.2 million in 1990 to 882.1 million in 2017, with the prevalence rate increasing from 8.2% to 10.9% during the same period. The increasing trends were consistent across sexes. Case numbers were highest in East Asia, followed by South Asia, then North Africa and the Middle East. The highest prevalence of NAFLD was observed in North Africa and the Middle East, while the greatest increase was detected in Western Europe, followed by Tropical Latin America, then high-income North America.
Conclusion
Nearly all countries or territories worldwide have experienced a significant increase in NAFLD prevalence. The greatest increase was observed in Oman. Almost all countries showed a significant increasing trend in NAFLD prevalence over the past three decades. This drastic increase is alarming and suggests that NAFLD has emerged as a new public health concern worldwide. As such, more efficient prevention strategies are urgently needed.
Keywords: epidemiology, adult gastroenterology, hepatobiliary disease
Strengths and limitations of this study.
Our study comprehensively investigated temporal trends in non-alcoholic fatty liver disease (NAFLD) prevalence at the global, regional and national levels.
We assessed secular trends in NAFLD risk factors, according to the Global Burden of Disease study.
All data used in our study were derived from mathematical estimates rather than surveillance data.
Introduction
Over the past three decades, non-alcoholic fatty liver disease (NAFLD) has gone from an obscure liver disorder to the most prominent chronic liver disease worldwide.1 2 NAFLD is a growing cause of end-stage liver disease and has been recognised as an aetiology of hepatocellular cancer (HCC), even in the absence of underlying cirrhosis.3 NAFLD is highly prevalent across nearly all continents and is geographically heterogeneous in its prevalence from country to country, with the highest rates, for example, being reported in South America and the Middle East, followed by Asia, the USA, and Europe; NAFLD is less common in Africa.4
In line with the worldwide increases in obesity and type 2 diabetes,5 6 in recent years, NAFLD has shown novel epidemics in both developed and developing countries. Understanding temporal trends in NAFLD prevalence is vital to better understanding its disease burden and preventing additional cases of NAFLD. Previous studies have either focused on individual regions had limited time frames.3 7 8 Fortunately, the Global Burden of Disease (GBD) study, which provides a tool for quantifying health losses caused by hundreds of diseases, injuries and risk factors, fills the gap when actual data on disease burden is sparse or unavailable, providing an unprecedented opportunity to learn more about NAFLF epidemiology. This study uses the data from the GBD study to comprehensively describe NAFLD prevalence and to quantify its temporal trends between 1990 and 2017 at the global, regional and national levels. Our results are instrumental in raising awareness of NAFLD and will be invaluable in the establishment of updated prevention strategies.
Materials and methods
Prevalence data for NAFLD by sex, region, and age were retrieved using the online Global Health Data Exchange query tool.9 We used data from five Sociodemographic Index (SDI) regions (low, low-middle, middle, high-middle and high), 21 GBD geographically defined regions (eg, East Asia) and a total of 195 countries and territories. The SDI is a composite average of the rankings of residents’ incomes per capita, average educational attainment and fertility rates in all areas for their respective regions, according to the GBD study. Prevalence (or the prevalence rate) is a commonly used Epidemiological Index that quantifies the degree to which a disease or condition exists within a population at a particular point in time. We calculated annual NAFLD prevalence as: , where the case number denotes the number of NAFLD cases diagnosed at the end of that year. The general methods used in the GBD for creating estimates have been detailed in the previous studies.10 NAFLD is an umbrella term for a range of liver conditions affecting people who drink little to no alcohol and is identified by International Classification of Disease (ICD)10 code K76.0. NAFLD prevalence was estimated by conducting a systematic literature review of PubMed, and then adopting DisMod-MR 2.1 models. The following inclusion criteria were used: (1) a sample size greater than 100; (2) representative of locale or area and sufficient methods; (3) does not exclude comorbidities and (4) NAFLD diagnosed by ultrasound scan (USS) or other imaging diagnostic. Any hospital or claims data that severely underestimated NAFLD prevalence were excluded. Data were outliered or excluded if we found that they differed significantly when compared with the regional, superregional or global rates. Studies using serum diagnostics or fatty liver indices and scores to diagnose NAFLD were also excluded. We also retrieved data from the National Human Development Index (HDI), a composite index created by the World Bank (www.worldbank.org) that measures average achievement in three basic dimensions of human development—a long and healthy life, knowledge and a decent standard of living. To assess secular trends in NAFLD risk factors, we retrieved prevalence data for type 2 diabetes from the GBD online database and prevalence data for obesity (and overweight status) from the WHO (http://apps.who.int/gho/data/view.main.GLOBAL2461A?lang=en). The obesity dataset includes estimates of the prevalence of overweight men and women aged 18 and over by country, region and globally. A person is defined as overweight if he or she has a body mass index (BMI) equal to or greater than 25. BMI is calculated by dividing a person’s weight in kilograms by his or her height in metres. We retrieved data spanning 1990–2016.
Estimated annual percentage change (EAPC) was used to quantify trends in the prevalence of NAFLD, stratified by sex, nation and age, between 1990 and 2017. As described elsewhere, EAPC can be calculated using a regression line fitted to the natural logarithm of the rates, that is, y=α+βx+ɛ, where y=ln (rate), and x=calendar year.11 All statistical analyses were performed using the R program (V.3.3.3, R Core Team, Vienna, Austria). A p value of less than 0.05 was considered statistically significant.
Patient and public involvement
No patients or members of the public were involved in designing, conducting, reporting on or dissemination information related to our research.
Results
Prevalence in case numbers and prevalence rates of NAFLD globally
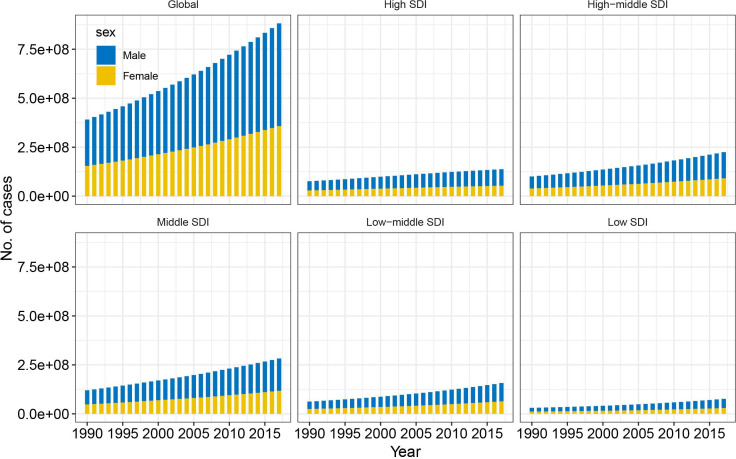
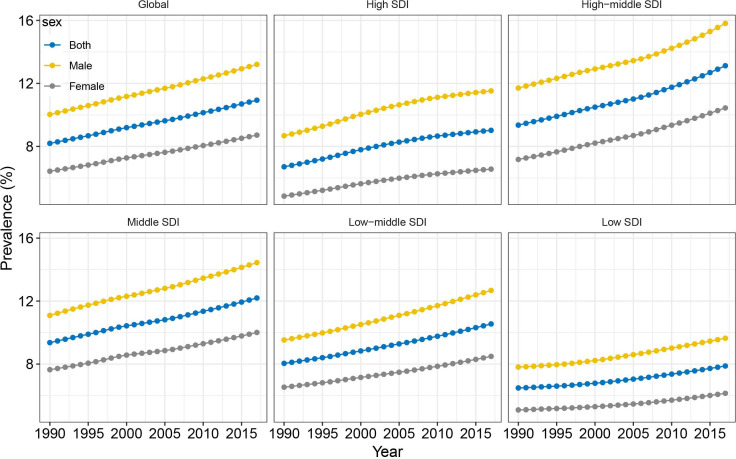
Worldwide, the prevalence of NAFLD increased from 391.2 million in 1990 to 882.1 million in 2017, with the prevalence rate increasing from 8.2% to 10.9% during this same period (EAPC=1.05, 95% CI 1.04 to 1.07, p<0.001) (table 1; figures 1 and 2). Men accounted for approximately two-thirds of all cases; however, women experienced a greater increase in NAFLD prevalence than men (table 1). All five SDI regions saw increase in both NAFLD prevalence in case numbers and prevalence rate. The most pronounced increase was in the high-middle SDI region, with the greatest prevalence seen in 2017 (table 1; figures 1 and 2). The increasing trends in both NAFLD prevalence in absolute case numbers and in prevalence rates were consistent across different age groups. Younger people (aged 15–49 years) accounted for nearly 50% of the total number of cases and accounted for the greatest increase in NAFLD prevalence between 1990 and 2017 (EAPC=1.25, 95% CI 1.22 to 1.28, p<0.001) (table 1).
Table 1.
The changing trends of number of prevalent cases and prevalence rate of NAFLD from 1990 to 2017
| 1990 | 2017 | 1990–2017* | |||
| No. of cases (×1 million) |
Prevalence (%)‡ |
No. of cases (×1 million) |
Prevalence (%) |
EAPC (95% CI) | |
| Overall | 391.2 | 8.2 | 882.1 | 10.9 | 1.05 (1.04 to 1.07) |
| Sex | |||||
| Male | 236.4 | 10.0 | 524.0 | 13.2 | 1.00 (0.99 to 1.02) |
| Female | 154.8 | 6.4 | 358.1 | 8.7 | 1.12 (1.10 to 1.13) |
| Sociodemographic Index | |||||
| High | 76.2 | 6.7 | 137.4 | 9.0 | 1.14 (1.06 to 1.21) |
| High-middle | 100.2 | 9.4 | 224.5 | 13.1 | 1.21 (1.17 to 1.25) |
| Middle | 120.0 | 9.4 | 282.3 | 12.2 | 0.94 (0.92 to 0.96) |
| Middle-low | 62.3 | 8.0 | 157.1 | 10.5 | 1.01 (1.00 to 1.02) |
| Low | 30.4 | 6.5 | 76.2 | 7.9 | 0.74 (0.70 to 0.79) |
| Age (years)† | |||||
| 15–49 | 241.5 | 8.8 | 489.1 | 12.5 | 1.25 (1.22 to 1.28) |
| 50–69 | 109.1 | 15.9 | 281.5 | 21.4 | 1.06 (1.04 to 1.08) |
| ≥70 | 40.7 | 20.0 | 111.4 | 25.7 | 0.93 (0.89 to 0.96) |
| GBD region | |||||
| Andean Latin America | 2.5 | 8.8 | 7.1 | 12.0 | 1.13 (1.10 to 1.16) |
| Australasia | 1.5 | 6.4 | 3.1 | 8.6 | 1.16 (1.04 to 1.28) |
| Caribbean | 2.8 | 9.2 | 5.8 | 11.7 | 1.03 (0.98 to 1.07) |
| Central Asia | 3.8 | 6.7 | 7.4 | 8.5 | 0.91 (0.81 to 1.01) |
| Central Europe | 9.5 | 6.7 | 13.1 | 8.0 | 0.70 (0.67 to 0.73) |
| Central Latin America | 12.7 | 10.5 | 36.5 | 14.4 | 1.17 (1.14 to 1.21) |
| Central sub-Saharan Africa | 2.3 | 6.5 | 6.2 | 7.5 | 0.58 (0.50 to 0.67) |
| East Asia | 111.8 | 9.6 | 242.8 | 12.6 | 0.88 (0.82 to 0.95) |
| Eastern Europe | 18.4 | 7.0 | 23.7 | 8.4 | 0.73 (0.64 to 0.82) |
| Eastern sub-Saharan Africa | 7.1 | 6.0 | 18.0 | 7.0 | 0.58 (0.55 to 0.60) |
| High-income Asia Pacific | 11.4 | 5.7 | 18.7 | 7.0 | 0.78 (0.75 to 0.82) |
| High-income North America | 23.1 | 7.2 | 44.0 | 9.6 | 1.17 (1.06 to 1.29) |
| North Africa and Middle East | 35.0 | 14.3 | 108.0 | 19.3 | 1.12 (1.10 to 1.15) |
| Oceania | 0.6 | 12.8 | 1.6 | 16.3 | 0.90 (0.87 to 0.92) |
| South Asia | 53.6 | 6.4 | 131.2 | 8.0 | 0.81 (0.78 to 0.83) |
| Southeast Asia | 39.5 | 10.9 | 98.5 | 14.5 | 1.12 (1.08 to 1.15) |
| Southern Latin America | 3.1 | 6.5 | 6.3 | 8.6 | 1.05 (1.01 to 1.08) |
| Southern sub-Saharan Africa | 3.7 | 9.3 | 8.1 | 11.4 | 0.73 (0.69 to 0.77) |
| Tropical Latin America | 9.8 | 8.0 | 26.7 | 11.1 | 1.17 (1.15 to 1.19) |
| Western Europe | 30.9 | 6.5 | 52.1 | 8.9 | 1.17 (1.05 to 1.29) |
| Western sub-Saharan Africa | 8.4 | 6.5 | 23.2 | 8.0 | 0.69 (0.63 to 0.75) |
*The prevalence has been standardised by age.
†Crude prevalence rate for each age group.
‡P values of all EAPCs were <0.001.
EAPC, estimated annual percentage change; GBD, Global Burden of Disease; NAFLD, non-alcoholic fatty liver disease.
Figure 1.
Changing trends in case numbers for non-alcoholic fatty liver disease between 1990 and 2017, by sex and SDI. SDI, Sociodemographic Index.
Figure 2.
Temporal trends in the prevalence of non-alcoholic fatty liver disease between 1990 and 2017, by sex and SDI. SDI, Sociodemographic Index.
Prevalence in case numbers and prevalence rates of NAFLD regionally
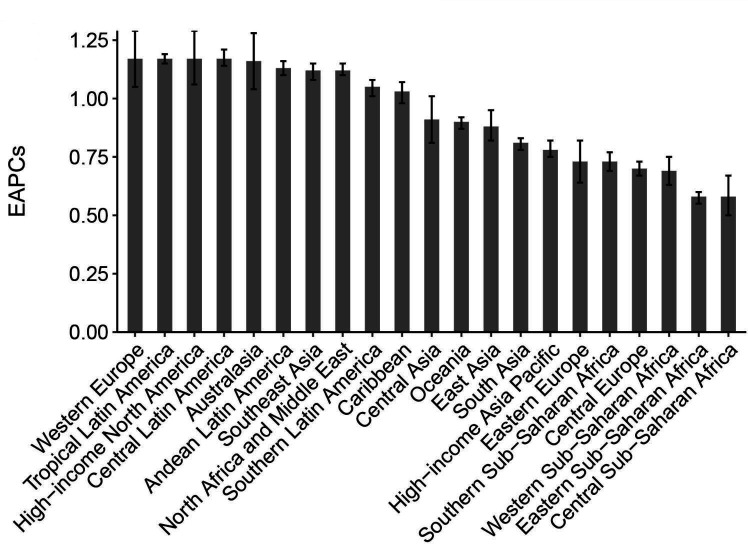
A total of 21 GBD regions were included in our analysis. The prevalence in terms of case numbers was highest in East Asia, followed by South Asia, then North Africa and the Middle East. In these three regions, absolute case numbers exceeded 0.1 billion in 2017. The highest NAFLD prevalence was observed in North Africa and the Middle East (19.3%), followed by Oceania, Southeast Asia and Central Latin America (table 1). Between 1990 and 2017, all 21 regions experienced significant increases in NAFLD prevalence (figure 3). The greatest increase was detected in Western Europe, followed by Tropical Latin America and then high-income North America (table 1; figure 3).
Figure 3.
Prevalence trends in non-alcoholic fatty liver disease at the Global Burden of Disease regional level. The error bar denotes a 95% CI. EAPCs, estimated annual percentage changes.
Prevalence in case numbers and prevalence rates of NAFLD nationally
Globally, NAFLD prevalence varied from country to country, ranging from 5.2% in Rwanda to 24.9% in Qatar in 2017 (figure 4A). The highest prevalence rates were observed in Qatar, Kuwait, Saudi Arabia and Oman. Relatively lower prevalence was found in parts of Africa and Europe, including Uganda, Mozambique, France and Denmark. China, India, Indonesia, Brazil and the USA had the heaviest burden of NAFLD in terms of absolute case numbers, with case numbers above 20 million in each of these five countries (figure 4B). Between 1990 and 2017, nearly all countries or territories experienced a significant increase in NAFLD prevalence rates (figure 4C). The greatest increase was observed in Oman (EAPC=2.12, 95% CI 1.97 to 2.26, p<0.001), followed by Finland, Equatorial Guinea and Nicaragua (figure 4C; online supplementary table). Only one country, Bulgaria, remained stable in terms of NAFLD prevalence for the study period. These increasing trends were consistent across both sexes and all three age groups at national levels (online supplementary table).
Figure 4.
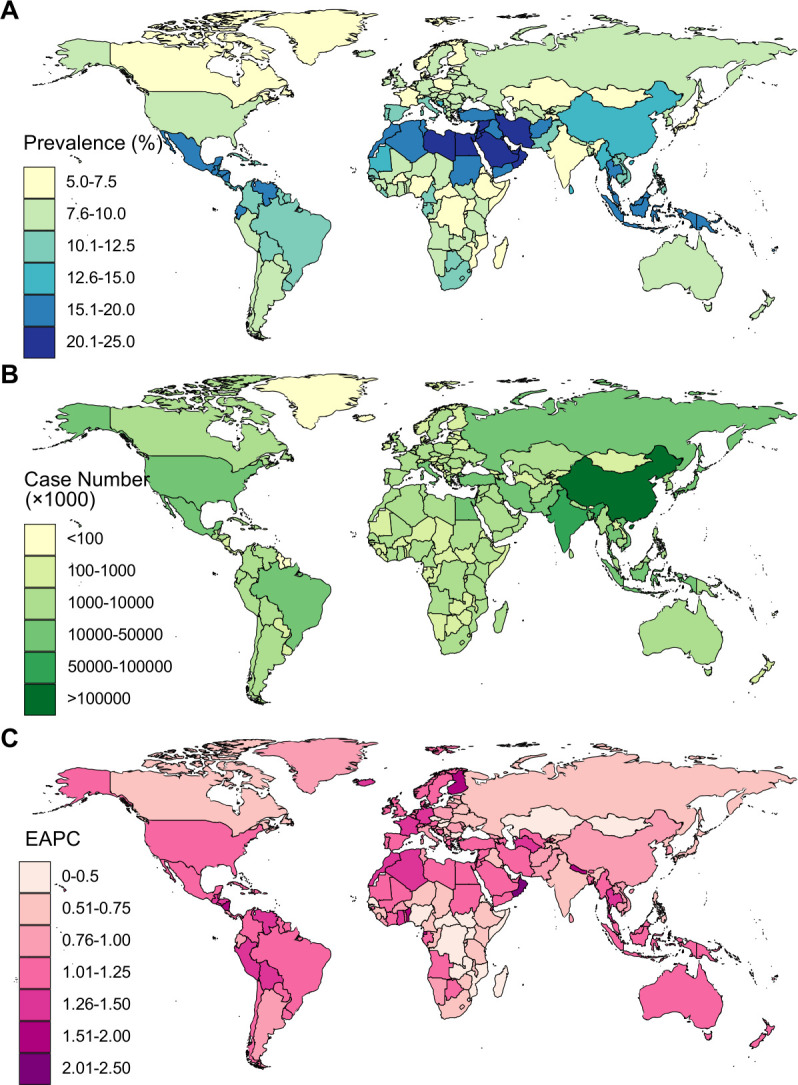
Age-standardised prevalence rates (A), case numbers (B) and trends (C) in non-alcoholic fatty liver disease between 1990 and 2017 at the national level. EAPC, estimated annual percentage change.
bmjopen-2019-036663supp002.pdf (193.4KB, pdf)
Correlations between NAFLD prevalence and risk factors
We assessed the correlations between NAFLD prevalence and the prevalence of overweight and diabetic status at the national level (online supplementary figure S1). There were significant positive correlations between these categories, with a r of 0.664 and 0.354, respectively. We also tested the correlations for EAPCs of NAFLD prevalence with HDIs at the national level. As shown in figure 5A, we found a significant positive correlation between these two indices (r=0.310, p<0.001). Over the last three decades, more than 90% of countries or territories experienced a significant increase in overweight prevalence, while more than 80% experienced increases in diabetes prevalence. This positive correlation was observed between temporal trends in NAFLD and the same trends in overweight status and diabetes (figure 5B, C).
Figure 5.
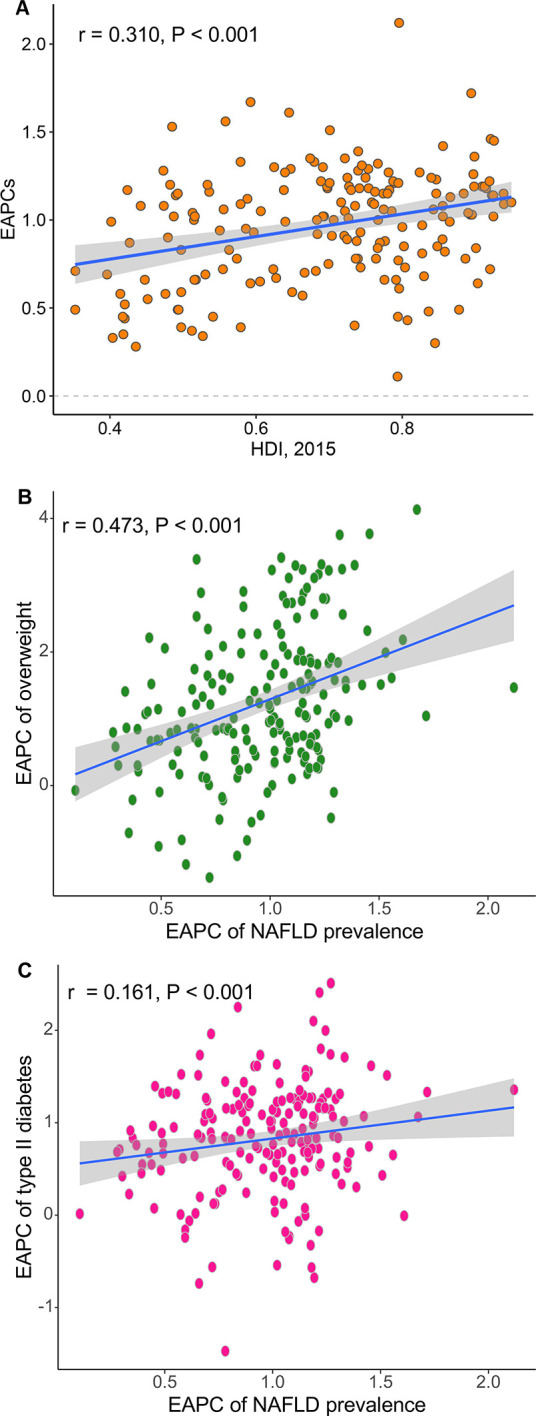
Association of prevalence trends in non-alcoholic fatty liver disease (NAFLD), quantified by estimated annual percentage changes (EAPCs), with Human Development Index (HDI) (A), trends in overweight prevalence (B) and trends in diabetes prevalence (C) at the national level. The correlation coefficient was derived from a Pearson correlation test.
bmjopen-2019-036663supp001.pdf (297.9KB, pdf)
Discussion
NAFLD and its histological subtype, non-alcoholic steatohepatitis (NASH), have emerged as the most common forms of chronic liver disease in most regions worldwide. This study comprehensively describes NAFLD prevalence and temporal trends in NAFLD prevalence over the past three decades at the global, regional and national levels. In general, we found that NAFLD prevalence was heterogeneous across the globe, with almost all countries demonstrating significantly increasing trends between 1990 and 2017. These increases have been consistent across sexes and age groups. The highest prevalence overall was observed in countries located in North Africa and the Middle East. The most significant increases in prevalence were observed in Western European countries.
According to a recent study, the estimated prevalence of overweight status was highest in several countries North African and Middle Eastern countries (including Qatar, Libya and Kuwait) across both sexes.6 The distribution of overweight status lines up significantly with NAFLD prevalence, as demonstrated in this and other studies.12 The greatest increase in NAFLD prevalence was found in Western Europe, which may primarily be ascribed to the rapid increase in overweight status in these countries.6 This striking increase in NAFLD prevalence has prompted investigators to explore the disease’s risk factors. So far, well-established risk factors for NAFLD include obesity, type 2 diabetes, an unhealthy diet (eg, high intake of red meat and processed meat) and physical inactivity.13–17 Of these, an unhealthy lifestyle is deemed to be the most important contributor to NAFLD.18 Key lifestyle parameters include an increased intake of glucose, fructose, and saturated fat, induced hepatic de novo lipogenesis, subclinical inflammation in the adipose tissue and liver, and insulin resistance in adipose tissue, the liver, and skeletal muscle. These parameters are also accompanied by an increased risk of type 2 diabetes.19
Additionally, gut dysbiosis, which is induced in most cases by an unhealthy diet, is believed to be a major contributor to the accumulation of fat in the liver and to the pathogenesis of NASH. There is a set of clinical trials currently underway that focuses on liver-specific and extrahepatic targets, including the microbiome and gut–liver signalling axis, as well as other organs that contribute to metabolic syndrome, especially muscle and adipose tissue.20 Although there is a great deal of activity in terms of drug development targeting NASH—for example, with an farnesoid X receptor (FXR) agonist (obeticholic acid), a peroxisome proliferator-activated receptor (PPAR)α and PPARδ agonist (elafibrinor) and a C-C chemokine receptor (CCR)2 and CCR5 antagonist (cenicriviroc)—it is too early to prioritise these drugs or mechanisms based on which seems most promising. It will take time to translate the findings of all these studies into long-term safety and efficacy.20 For these reasons, the primary preventative steps in terms of the abovementioned risk factors, including adherence to a healthy lifestyle and maintaining a healthy BMI, remain the optimal approach to preventing NAFLD.
Our study found that approximately 0.9 billion people suffered from NAFLD in 2017. What sets NAFLD apart from other common liver diseases is the sheer number of patients worldwide. Unfortunately, we also observed increasing trends in NAFLD prevalence globally. Consequently, the complications and sequelae of NAFLD might also be on the rise. For example, this increasing prevalence of NAFLD is accompanied by increasing prevalence of other non-communicable diseases, including cardiovascular disease, obesity-associated and type 2 diabetes-associated cancer and advanced liver diseases such as hepatic cirrhosis and HCC.21 As the clinical consequences of NAFLD grow, so too will the economic repercussions. One model based on the populations of the USA and four European countries (Germany, France, Italy and the UK) estimated the annual burden associated with all incident and prevalent NAFLD cases at US$103 billion in the USA (or US$1613 per patient) and €35 billion in these four European countries (from €354 to €1163 per patient).22 Unfortunately, as our results show, we found significant increases in both obesity and diabetes prevalence in most countries over the last decade. If the annual rate of increase in NAFLD-related costs parallels annual growth in the prevalence of obesity—and taking into account an ageing population—then the expected 10-year burden for NAFLD could increase to an estimated US$1.005 trillion in the USA and €334 billion in these Europe countries.22 Interestingly, we also found a significant positive correlation between national HDI and increase magnitude in NAFLD prevalence. This result suggests a striking increase in NAFLD risk factors, particularly in developed countries; these factors likely include an ever-growing ageing population, physical inactivity, increases in consumption of red meat and processed meat and other unhealthy lifestyles choices that contribute to NAFLD.16 23 Given the observable increases in obesity and diabetes prevalence, NAFLD prevalence is anticipated to continue to increase in the near future if no effective interventions are introduced.3 Moreover, this persistent increase in NAFLD also indicates an increasing need for medical facilities and improved health systems in these countries, given that more NAFLD patients will continue to be diagnosed.
NAFLD prevalence has also persistently increased in developing regions, including the sub-Saharan Africa, a region where NAFLD had previously been a less frequent diagnosis. This increase might be ascribed to the increasing availability of healthcare and the concomitant rise in accurate NAFLD diagnosis, as well as to transitions in lifestyle. Increased awareness and urgent action is needed if we want to control the NAFLD pandemic worldwide. Specifically, (1) our governments should play a strong leadership role in reinforcing the importance of addressing obesity and establishing more effective prevention strategies; (2) funds should be allocated specifically to create a culture that promotes healthy eating and an active lifestyle, especially for children and adolescents; (3) we must create multifaceted interventions aimed at motivating behavioural changes, including setting-based health promotion and education programmes (eg, in preschools, schools, workplaces, religious settings and hospitals), mass media campaigns, social marketing to share knowledge and skills within our communities and routine primary healthcare and counselling appointments to facilitate obesity prevention and management.24
Our study has several limitations that should be noted. First, the data we used were derived from mathematical models rather than surveillance. Differences in data processing approaches between the GBD study and previous studies might also contribute to disparities in the NAFLD prevalence rates proposed in our study when compared with those from the previous meta-analyses.4 25 For example, Younossi et al reported that the global prevalence of NAFLD derived from a meta-analysis was 25.24%, which is significantly higher than the estimates in our study.4 We assume that this difference can be explained as follows: (1) Most studies included in the meta-analysis were conducted in Europe, Asia and North America, where NAFLD prevalence is relatively high. In Africa and Australia, where NAFLD is not a major public health concern, studies on NAFLD are rare. However, in the GBD study, NAFLD prevalence was estimated from country to country using mathematical models; (2) The GBD study included a wider study population, ranging in age from 0 to ≥85 years. Children, adolescents and young adults are relatively less afflicted by NAFLD than middle-aged people and elderly people26 and (3) To ensure the robustness of its estimates, NAFLD prevalence rates that were significantly higher than the regional, superregional, or global rates were excluded from the GBD study.
Second, NAFLD is a complex and heterogeneous disease. The scarcity of histological and stage data in the GBD database made it difficult to describe the NAFLD disease burden in detail. This type of descriptive study also lacks information at the individual level. For example, the GBD study did not include information on hepatic fibrosis evaluations, which are a key determinant of NAFLD outcomes. Future studies assessing the NAFLD disease burden should also take these histological and pathological data into account. Third, NAFLD prevalence was estimated using a mathematical model that included patients who were diagnosed only by USS or another imaging diagnostic tool. Since there are few effective diagnostic methods available in daily clinical practice—and because we excluded NAFLD diagnosed using other methods (eg, non-invasive scores)—our data may underestimate the NAFLD disease burden.
In summary, NAFLD prevalence is increasing worldwide and the disease is being diagnosed in all parts of the world. The highest prevalence was observed in North Africa and the Middle East, while the greatest increase was detected in Western Europe and North America. This dramatic and significant increase in NAFLD prevalence is alarming and suggests that NAFLD has emerged as a new public health concern worldwide. More efficient prevention strategies are urgently needed.
Supplementary Material
Footnotes
XG and LZ contributed equally.
Contributors: Study conception and design: JJ, XG and MW. Data collection: XG, YD and LZ. Data analyses: XG, YD and LZ. Manuscript drafting: XG, LZ and YD. Results interpretations and manuscript proofing: All authors.
Funding: The present study was supported by the National Natural Science Foundation of China (grant no. 81560487) and Department of Science and Technology in Guizhou province QIAN KE HE LH word [2015]7515.
Map disclaimer: The depiction of boundaries on the map(s) in this article do not imply the expression of any opinion whatsoever on the part of BMJ (or any member of its group) concerning the legal status of any country, territory, jurisdiction or area or of its authorities. The map(s) are provided without any warranty of any kind, either express or implied.
Competing interests: None declared.
Patient consent for publication: Not required.
Ethics approval: The need for study approval was waived the National Centre of Health and Statistics Research ethics review board, because the research relied on public, deidentified secondary data.
Provenance and peer review: Not commissioned; externally peer reviewed.
Data availability statement: Data are available in a public, open access repository. All data are available online via the Global Health Data Exchange query tool (http://ghdx.healthdata.org/gbd-results-tool).
References
- 1.Younossi Z, Tacke F, Arrese M, et al. Global perspectives on nonalcoholic fatty liver disease and nonalcoholic steatohepatitis. Hepatology 2019;69:2672–82. 10.1002/hep.30251 [DOI] [PubMed] [Google Scholar]
- 2.Younossi Z, Anstee QM, Marietti M, et al. Global burden of NAFLD and NASH: trends, predictions, risk factors and prevention. Nat Rev Gastroenterol Hepatol 2018;15:11–20. 10.1038/nrgastro.2017.109 [DOI] [PubMed] [Google Scholar]
- 3.Estes C, Razavi H, Loomba R, et al. Modeling the epidemic of nonalcoholic fatty liver disease demonstrates an exponential increase in burden of disease. Hepatology 2018;67:123–33. 10.1002/hep.29466 [DOI] [PMC free article] [PubMed] [Google Scholar]
- 4.Younossi ZM, Koenig AB, Abdelatif D, et al. Global epidemiology of nonalcoholic fatty liver disease-Meta-analytic assessment of prevalence, incidence, and outcomes. Hepatology 2016;64:73–84. 10.1002/hep.28431 [DOI] [PubMed] [Google Scholar]
- 5.NCD Risk Factor Collaboration (NCD-RisC) Worldwide trends in diabetes since 1980: a pooled analysis of 751 population-based studies with 4.4 million participants. Lancet 2016;387:1513–30. 10.1016/S0140-6736(16)00618-8 [DOI] [PMC free article] [PubMed] [Google Scholar]
- 6.Ng M, Fleming T, Robinson M, et al. Global, regional, and national prevalence of overweight and obesity in children and adults during 1980-2013: a systematic analysis for the global burden of disease study 2013. Lancet 2014;384:766–81. 10.1016/S0140-6736(14)60460-8 [DOI] [PMC free article] [PubMed] [Google Scholar]
- 7.Xanthakos SA, Jenkins TM, Kleiner DE, et al. High prevalence of nonalcoholic fatty liver disease in adolescents undergoing bariatric surgery. Gastroenterology 2015;149:623–34. 10.1053/j.gastro.2015.05.039 [DOI] [PMC free article] [PubMed] [Google Scholar]
- 8.Lazarus JV, Ekstedt M, Marchesini G, et al. A cross-sectional study of the public health response to non-alcoholic fatty liver disease in Europe. J Hepatol 2020;72:14–24. 10.1016/j.jhep.2019.08.027 [DOI] [PubMed] [Google Scholar]
- 9.Global Burden of Disease Collaborative Network Global burden of disease study 2017 (GBD 2017) results. Seattle, United States: Institute for Health Metrics and Evaluation (IHME), 2018. http://ghdx.healthdata.org/gbd-results-tool [Google Scholar]
- 10.GBD 2017 Disease and Injury Incidence and Prevalence Collaborators Global, regional, and national incidence, prevalence, and years lived with disability for 354 diseases and injuries for 195 countries and territories, 1990-2017: a systematic analysis for the global burden of disease study 2017. Lancet 2018;392:1789–858. 10.1016/S0140-6736(18)32279-7 [DOI] [PMC free article] [PubMed] [Google Scholar]
- 11.Liu Z, Jiang Y, Yuan H, et al. The trends in incidence of primary liver cancer caused by specific etiologies: results from the global burden of disease study 2016 and implications for liver cancer prevention. J Hepatol 2019;70:674–83. 10.1016/j.jhep.2018.12.001 [DOI] [PubMed] [Google Scholar]
- 12.Polyzos SA, Kountouras J, Mantzoros CS. Obesity and nonalcoholic fatty liver disease: from pathophysiology to therapeutics. Metabolism 2019;92:82–97. 10.1016/j.metabol.2018.11.014 [DOI] [PubMed] [Google Scholar]
- 13.Lu F-B, Hu E-D, Xu L-M, et al. The relationship between obesity and the severity of non-alcoholic fatty liver disease: systematic review and meta-analysis. Expert Rev Gastroenterol Hepatol 2018;12:491–502. 10.1080/17474124.2018.1460202 [DOI] [PubMed] [Google Scholar]
- 14.Ayonrinde OT, Oddy WH, Adams LA, et al. Infant nutrition and maternal obesity influence the risk of non-alcoholic fatty liver disease in adolescents. J Hepatol 2017;67:568–76. 10.1016/j.jhep.2017.03.029 [DOI] [PubMed] [Google Scholar]
- 15.Cusi K, Sanyal AJ, Zhang S, et al. Non-alcoholic fatty liver disease (NAFLD) prevalence and its metabolic associations in patients with type 1 diabetes and type 2 diabetes. Diabetes Obes Metab 2017;19:1630–4. 10.1111/dom.12973 [DOI] [PubMed] [Google Scholar]
- 16.Zelber-Sagi S, Ivancovsky-Wajcman D, Fliss Isakov N, et al. High red and processed meat consumption is associated with non-alcoholic fatty liver disease and insulin resistance. J Hepatol 2018;68:1239–46. 10.1016/j.jhep.2018.01.015 [DOI] [PubMed] [Google Scholar]
- 17.Mitchell T, McKinnon E, Ayonrinde O, et al. Decreased physical working capacity in adolescents with nonalcoholic fatty liver disease associates with reduced iron availability. Clin Gastroenterol Hepatol 2020;18:1584–91. 10.1016/j.cgh.2019.10.017 [DOI] [PubMed] [Google Scholar]
- 18.Stefan N, Häring H-U, Cusi K. Non-alcoholic fatty liver disease: causes, diagnosis, cardiometabolic consequences, and treatment strategies. Lancet Diabetes Endocrinol 2019;7:313–24. 10.1016/S2213-8587(18)30154-2 [DOI] [PubMed] [Google Scholar]
- 19.Stefan N, Kantartzis K, Häring H-U. Causes and metabolic consequences of fatty liver. Endocr Rev 2008;29:939–60. 10.1210/er.2008-0009 [DOI] [PubMed] [Google Scholar]
- 20.Friedman SL, Neuschwander-Tetri BA, Rinella M, et al. Mechanisms of NAFLD development and therapeutic strategies. Nat Med 2018;24:908–22. 10.1038/s41591-018-0104-9 [DOI] [PMC free article] [PubMed] [Google Scholar]
- 21.Younossi ZM, Otgonsuren M, Henry L, et al. Association of nonalcoholic fatty liver disease (NAFLD) with hepatocellular carcinoma (HCC) in the United States from 2004 to 2009. Hepatology 2015;62:1723–30. 10.1002/hep.28123 [DOI] [PubMed] [Google Scholar]
- 22.Younossi ZM, Blissett D, Blissett R, et al. The economic and clinical burden of nonalcoholic fatty liver disease in the United States and Europe. Hepatology 2016;64:1577–86. 10.1002/hep.28785 [DOI] [PubMed] [Google Scholar]
- 23.Kim D, Vazquez-Montesino LM, Li AA, et al. Inadequate physical activity and sedentary behavior are independent predictors of nonalcoholic fatty liver disease. Hepatology 2020. 10.1002/hep.31158. [Epub ahead of print: 03 Feb 2020]. [DOI] [PubMed] [Google Scholar]
- 24.Zhang G, Cao F, Shi L, et al. Contribution of high body mass index and alcohol use to liver cancer-related mortality: a study based on 195 countries or territories. Dig Liver Dis 2020;52:221–31. 10.1016/j.dld.2019.10.012 [DOI] [PubMed] [Google Scholar]
- 25.Zhou F, Zhou J, Wang W, et al. Unexpected rapid increase in the burden of NAFLD in China from 2008 to 2018: a systematic review and meta-analysis. Hepatology 2019;70:1119–33. 10.1002/hep.30702 [DOI] [PubMed] [Google Scholar]
- 26.Anderson EL, Howe LD, Jones HE, et al. The prevalence of non-alcoholic fatty liver disease in children and adolescents: a systematic review and meta-analysis. PLoS One 2015;10:e0140908. 10.1371/journal.pone.0140908 [DOI] [PMC free article] [PubMed] [Google Scholar]
Associated Data
This section collects any data citations, data availability statements, or supplementary materials included in this article.
Supplementary Materials
bmjopen-2019-036663supp002.pdf (193.4KB, pdf)
bmjopen-2019-036663supp001.pdf (297.9KB, pdf)


