

Abstract
Although individuals vary in how optimistic they are about the future, one assumption that researchers make is that optimism is sensitive to changes in life events and circumstances. We examined how optimism and pessimism changed across the lifespan and in response to life events in three large panel studies (combined N = 74,886). In the American and Dutch samples, we found that optimism increased across younger adulthood, plateaued in midlife, and then decreased in older adulthood. In the German sample, there were inconsistent results with respect to age differences and mean level changes in optimism. Associations between life events and changes in optimism/pessimism were inconsistent across samples. We discuss our results in the context of life events and lifespan development.
Keywords: optimism, lifespan development, life events, aging, time perspective, adult personality development
Dispositional optimism, the generalized expectation that good things will happen, has been linked with a broad array of positive intra- and interpersonal outcomes (e.g., Boehm et al., 2018; Srivastava et al., 2006). For example, higher levels of optimism are associated with lower illness severity, lower cardiovascular risk, and reduced all-cause mortality (Kim et al., 2017; Kubzansky et al., 2001; Mroczek et al., 1993). Although individuals vary in how optimistic they are about the future, one assumption that researchers make is that optimism (and other psychological characteristics) are sensitive to changes in life circumstances such as life events (Chopik et al., 2015; Roberts et al., 2005). In other words, people might change their expectations about the future when they gather evidence about themselves and the world around them. However, few studies have formally examined how optimism predicts the onset of life events and also whether optimism changes in response to life events (Schwaba et al., 2019). The current report examined how optimism predicts the onset of, and changes, in response to life events using three large panel studies of human development: the Dutch Longitudinal Internet Study for the Social Sciences (LISS), the German Socio-economic Panel (G-SOEP), and the Health and Retirement Study (HRS).
How does optimism change over time?
Optimism is an individual attribute that is ~25% heritable but can also be learned and shaped by social influences (Brunwasser et al., 2009; Hanssen et al., 2013; Heinonen et al., 2005; Malouff & Schutte, 2017; Meevissen et al., 2011; Peters et al., 2010; Plomin et al., 1992; Segerstrom, 2007). Much of the research examining the development of optimism has focused on characterizing mean-level changes and stability in optimism over time (Burns & Seligman, 1989; Segerstrom, 2007). There are many theoretical reasons to expect that optimism might change across the lifespan (see Chopik et al., 2015). For example, as people age, their increased focus on maintaining emotional balance and well-being might lead them to attend more strongly to positive information—leading to the prediction that optimism increases across the lifespan (Carstensen, 2006; Reed & Carstensen, 2012). Such increases in socio-emotional goals also occur in the context of normative age-graded increases in autonomy and self-regulation, which are likely antecedents of optimism (Deci & Ryan, 2000).
Although there are some inconsistencies across studies, researchers generally observe that optimism increases from young adulthood to older adulthood (Abraham, 2007; Isaacowitz, 2005; Lennings, 2000; You et al., 2009). However, optimism may not uniformly increase across the entire lifespan. Several other theories suggest that, although optimism might increase throughout the majority of life, practical restrictions and limitations experienced by individuals as they age (e.g., health, mobility) might compromise people’s ability to always expect the best of the future (Baltes & Baltes, 1990; Charles, 2010; Sweeny & Krizan, 2013). Indeed, research on other conceptually related constructs to optimism (like life satisfaction) show late life declines prior to death (Gerstorf, Ram, Estabrook, et al., 2008; Gerstorf et al., 2010; Gerstorf, Ram, Röcke, et al., 2008). At least two studies show similar effects in optimism, such that optimism increases throughout life, reaches a plateau between ages 55 and 70, and declines in older adulthood (Chopik et al., 2015; Schwaba et al., 2019).
Based on these theoretical reasons and the available evidence from longitudinal studies, we expected to find a curvilinear effect for how optimism changes over the lifespan. Specifically, we hypothesized that optimism would increase in early- and middle-adulthood and decline in older-adulthood.
Does optimism change in response to life events?
A separate but closely related question is why optimism changes the way it does across the lifespan. Our report here contributes to a large literature of how psychological characteristics change in response to life circumstances more generally (e.g., Bleidorn et al., 2016; Chopik, 2018; Lüdtke et al., 2011; Richter & Kunzmann, 2011; Roberts et al., 2005; Specht et al., 2011). These changes are hypothesized to originate from a variety of sources, including changes in goals, introspection, expectation and behavioral adjustments, volitional processes, social networks, or changes in biological and physical systems (Bleidorn et al., 2016; Bleidorn et al., 2013; Chopik & Kitayama, 2018; Freund et al., 2018; Hudson et al., 2018; Terracciano, 2014). Likewise, optimism may change in part as a result of individuals adjusting their worldview to adapt to new life circumstances. For example, people who encounter an unfortunate health diagnosis may become less optimistic. Specifically, they might receive a bad prognosis that a chronic illness could shorten their life or introduce severe physical limitations or pain. The future might appear less positive as a result. Conversely, people who get married might increase in optimism because they look forward to sharing positive life experiences with a person they love. The future might look more positive as a result.
It makes intuitive sense that negative events might make people less optimistic and positive events might make people more optimistic. Changes and adjustments to optimism might reflect a normative tracking in which individuals remain calibrated to their environments (Carver & Scheier, 1982; DeYoung, 2015; Schwaba et al., 2019). However, there have been few studies examining the factors that drive development and change in optimism across the lifespan. The little research that has been done has yielded inconsistent findings as to whether life events exert a powerful enough influence to change optimism. For example, among cancer patients, optimism is relatively stable and does not substantially change when patients receive cancer diagnoses, go through intensive treatments, or receive bad news following treatment (e.g., that the cancer was still present or was in a more advanced stage; Schou et al., 2005; Stanton & Snider, 1993; Stiegelis et al., 2003). There is other evidence that optimism and health are closely linked in older adulthood, such that declines in health correspond to declines in optimism, both among individuals and in the context of their spousal relationships (Chopik et al., 2015; Chopik et al., 2018).
The most comprehensive study to date on optimism development examined how optimism changed in response to a variety of positive (e.g., new friendships, desired parenthood) and negative (e.g., unemployment) life events in a sample of over 1,000 individuals followed over seven years (Schwaba et al., 2019). Surprisingly, only the incidence of positive events was associated with higher levels of optimism across the sample from ages 26 to 70 years old. Negative events were unrelated to the development of optimism over time. The observation that optimism may be more responsive to positive events than negative ones has many implications for the study of lifespan development. For example, it is possible that optimists perceive events in a fundamentally different, more positive light than others. These perceptions align with the attributional styles that optimists possess—they attribute negative events to external, unstable, and specific circumstances that are unlikely to last over time (Gillham et al., 2001; Peterson et al., 1982). In this way, optimists might construe negative life events in a more positive (or at least neutral) light, buffering them from declines in optimism.
Further complicating the study of how life events are associated with optimism changes is that life events are not randomly distributed across the population. Optimists tend to find success in many different domains to begin with. Optimism is associated with better health and fewer chronic health problems, remarriage following a divorce, and success in academics, athletics, cognitive performance, work/occupations, romance, and even politics (Assad et al., 2007; Forgeard & Seligman, 2012; Gawronski et al., 2016; Gillham et al., 2001; Kim et al., 2014; Peterson, 2000; Peterson et al., 2012; Puri & Robinson, 2007). In examining whether optimism changes in response to life events, it is important to acknowledge that optimists may be more or less likely to experience a life event, such as divorce. Then, among those who do experience divorce, we can examine how their levels of optimism change over time in those individuals. The former effect—in which optimism predicts the onset of a life event—is considered a selection effect; the latter effect—in which optimism changes in response to the onset of a life event—is considered a socialization effect. In the current study, we examined both: (a) how optimism predicts the onset of life events and (b) how optimism changes in response to life events.1
The Current Study
In the current study, we examined changes in optimism across the lifespan using three large panel studies from the Netherlands (LISS), the United States (HRS), and Germany (GSOEP). Based on previous research (Chopik et al., 2015; Schwaba et al., 2019), we hypothesized a curvilinear effect such that optimism would increase throughout early adulthood, reach a plateau around ages 55–70, and decline beginning in older adulthood. Because the few previous studies evaluating the associations between life events and optimism have yielded some inconsistent results (Chopik et al., 2015; Schou et al., 2005; Schwaba et al., 2019), we did not make any formal hypotheses about which life events would exert a strong influence to change optimism (and in what direction it would do so). Thus, we treated these tests as exploratory. The analyses were run in parallel across the three data sets and consistencies and inconsistencies across the panel studies will be summarized in a narrative fashion.
Contribution of the Current Manuscript
Although the development of optimism has been the subject of previous investigations, the current approach extends these efforts in numerous ways (Chopik et al., 2015; Schwaba et al., 2019). Specifically, we take a more holistic view by integrating life events as predictors of changes in optimism over time. Although some studies (e.g., Schwaba et al., 2019) have examined life events, the current studies extends the literature by: 1) examining the effect of individual life events (rather than clustering life events by valence), 2) using a broader age range, 3) more time points, and 4) participants from three different countries. Some of these data have been used in previous examinations of optimism development (e.g., the Health and Retirement Study; Chopik et al., 2015), but our analysis adds an additional wave of optimism data as well as life event information as predictors of changes in optimism. In this way, the current studies can be seen as partial replications of previous work, but more importantly extensions of this work using better, larger samples from three different countries.
Method
Participants
The current report used three large panel studies of human development: the Dutch Longitudinal Internet Study for the Social Sciences (LISS), the German Socio-economic Panel (G-SOEP), the Health and Retirement Study (HRS)—all publicly available datasets.
For LISS, we had 10,045 participants with at least one assessment of optimism (81.3% had ≥ 2 assessments), ranging in age from 16–101 years old (Mage = 46.32, SD = 18.48); 54.5% were female, and the median education was intermediate vocational education, which is equivalent to a college junior in the United States.
For G-SOEP, we had 42,691 participants with at least one assessment of optimism (39.9% had ≥ 2 assessments), ranging in age from 16–96 years old (Mage = 44.26, SD = 17.49); 52.7% were female, and the median years of education was 11.5 years.
For HRS, we had 22,150 participants with at least one assessment of optimism (64.8% of the sample had ≥ 2 assessments), ranging in age from 18–104 years old (Mage = 63.62, SD = 11.05). 58.4% were female, and the median education was 12 years.
Means, standard deviations, and correlations for age, gender, education and optimism are presented in Supplementary Tables 1–3.
Measures
Optimism.
LISS and HRS assessed optimism using the Life Orientation Test-Revised (LOT-R; Scheier et al., 1994; Tindle et al., 2009), a standard six-item measure of optimism. We derived measures of optimism and pessimism from the LOT-R (see Results section for details). A sample optimism item is “I expect more good things to happen,” and a sample pessimism item is “I rarely count on good things.” Participants rated the extent to which they agreed with each item on a scale ranging from 1 (strongly disagree) to 6 (strongly agree). Based on an initial measurement model, we removed one of the optimism items that was deemed problematic in both the HRS and LISS samples (i.e., “In uncertain times, I usually expect the best”). In total, two items were used to assess optimism (αopt_LISS =.56–.61; αopt_HRS = .68–.71) and three items were used to assess pessimism (αpes_LISS = .70–.73; αpes_HRS = .75–.77). LISS measured optimism annually starting in 2012 until 2019 (except in 2016); thus we used seven waves of optimism data.2 HRS measured optimism/pessimism every two years starting in 2006 in a random 50% of the sample, and in 2008 in the other 50% of the sample. The two sub-cohorts were combined. Thus, we used three waves of optimism/pessimism data with each wave being four years apart (wave 1=2006/2008, wave 2=2010/2012, wave 3=2014/2016).
G-SOEP used a single-item measure “When you think about the future, are you…” which participants rated 1 (optimistic), 2 (more optimistic than pessimistic), 3 (more pessimistic than optimistic), or 4 (pessimistic). Responses were reverse-scored prior to analysis.3 G-SOEP measured optimism four times in: 1999, 2005, 2009, and 2014. However, we only used data from 2005, 2009, and 2014 because including data from 1999 led to convergence issues due to a large amount of missing data (the exclusive use of waves from 2005, 2009, and 2014 was in our pre-registration).
Life events.
Several life events were collected at each wave across samples. We included a total of 16 life events as predictors across our three samples. The majority of these life events were consistently assessed across the three samples, but there were minor variations in the way and which life events were assessed across samples (e.g. a different combination of life events were assessed in each sample). Among the 16 events, three events were about children (childbirth, a child leaving home, and loss of a child), four about relationship status (widowed, divorce, separation, and marriage), one about parents (loss of a parent), three about moving residences (moving residence, leaving parental home, and moving in with a partner), three about changes in health status (new chronic illness, positive and negative subjective change in health), and three about employment (first job, retirement, and unemployment).
All life events were coded as 0 (did not occur) or 1 (occurred). Specifically, we coded life events as “occurred” if and only if events happened at least once after the first wave up to and including the final wave. In other words, if an event happened before participant’s first wave of optimism data and did not happen again after they provided optimism data, it was coded as “did not occur.” Table 1 presents a list of the frequency of life events for each sample.
Table 1.
Frequency and Percentage of Life Events
| Sample | LISS | G-SOEP | HRS |
|---|---|---|---|
| Years | 2012–2019 | 2005–2014 | 2006/2010–2014/2016 |
| Birth of child | - | 4717 (11.0%) | 31 (.2%) |
| Child leaves home | - | 5418 (11.6%) | - |
| New chronic illnesses | 1107 (13.1%) | - | 11041 (49.8%) |
| Death of a child | 219 (2.5%) | 162 (.4%) | 959 (4.9%) |
| Death of a partner | 105 (1.2%) | 720 (1.7%) | 2495 (11.3%) |
| Death of parent | 515 (12.1%) | 3180 (7.4%) | 3592 (48.6%) |
| Divorce | 119 (1.3%) | 815 (1.9%) | 894 (4.0%) |
| First job | 51 (.5%) | 2088 (4.9%) | 88 (.4%) |
| Health (subjective; positive change) | 575 (7.1%) | 4034 (9.4%) | 5652 (25.5%) |
| Health (subjective; negative change) | 2407 (28.0%) | 5404 (12.6%) | 2985 (13.5%) |
| Marriage | 342 (6.5%) | 2558 (6.0%) | 723 (3.3%) |
| Moved in with partner | 350 (9.8%) | 3036 (7.1%) | - |
| Moved residences | 773 (12.5%) | - | 6265 (29.5%) |
| Retirement | 575 (7.1%) | 1084 (2.5%) | 6712 (30.3%) |
| Separation from partner | 39 (.4%) | 2351 (5.5%) | 480 (2.2%) |
| Unemployment | 384 (4.0%) | 3624 (8.5%) | 1041 (4.7%) |
Note. The percentage represents proportion of people who experienced that event among people with data (i.e. excluding missing data).
Analytic Plan
Our analytic plan was applied consistently across the three data sets (see preregistration: https://osf.io/wr7ua/?view_only=72cbdb7d53c0464fb841b7eb704ce33c). Prior to modeling changes in optimism over time we examined measurement invariance in the optimism measure. Poor fit in measurement invariance models for a single factor structure suggested that we first examine the structure of the multi-item scales for the LISS and HRS (the G-SOEP was a single-item measure, so observed changes in this item are assumed to reflect changes in the construct). Therefore, we conducted a series of exploratory and confirmatory factor analyses (EFA and CFA). Upon settling on the two-factor solution (see below), we then tested for weak-, strong-, and strict-invariance over time. Model fit was assessed using change in multiple goodness-of-fit indices.
Next, we estimated a series of latent growth curve models to examine mean-level development in optimism across the study period. Time was coded by year and optimism/pessimism were centered at the first wave of data collection and scaled so that estimated intercepts can be interpreted as an average score at wave 1 and estimated slopes can be interpreted as an average unit change per year. Previous research suggests that changes in optimism are likely non-linear across the lifespan (Chopik et al., 2015), thus we modeled participant age and age2 as predictors of the intercepts and slopes of the aforementioned latent growth curve models while controlling for gender and education, and we used these parameter estimates to chart lifespan optimism trajectories (see Specht et al., 2011; for a similar approach).4 Because the LISS data set had seven waves, we estimated both a linear and quadratic slope; HRS and G-SOEP had three waves of data, so we only estimated a linear slope in those analyses. To examine the association between life events and optimism development, we examined whether experiencing (versus not experiencing) life events predicted the intercepts and slopes of optimism. We used traditional indices of model fit for each analysis (e.g., CFI, RMSEA; Cheung & Rensvold, 2002; Hu & Bentler, 1999). All analyses were conducted in Mplus 8.1 (Muthén & Muthén, 2017). In our tables, unstandardized and standardized effects are reported.
Results
Measurement Models and Invariance Tests
We first examined the fit and the pattern of factor loadings across time by testing configural invariance (as a baseline model). This one-factor structure fit the data poorly over time (e.g. CFIHRS = .673, RMSEAHRS = .107) and suggested that, although indicators loaded onto factors similarly across time, there were systematic differences in factor loadings (i.e., all negatively-valenced [i.e., pessimism] items loaded strongly, while positively-valenced [i.e., optimism] items loaded moderately) and this likely contributed to the poor fit. Following up with EFAs, we discovered that the one-factor solution for the optimism scale fit the data poorly in both LISS (CFI = .831, RMSEA = .142, SRMR = .091) and HRS (CFI = .664, RMSEA = .234, SRMR = .118). We found that a two-factor structure better fit the data, and that a specific item (“In uncertain times, I usually expect the best.”) was cross-loading on both factors in both samples. After excluding this item and re-running the CFA for a two-factor solution, we found that separating items into separate 2-item optimism and 3-item pessimism scales led to good model fit for both LISS (CFI = .994, RMSEA = .039, SRMR = .013) and improved fit for HRS (CFI = .905, RMSEA = .19, SRMR = .043). Details of these factor analyses can be found in the supplementary materials.
The question of whether optimism and pessimism are indeed separate but correlated constructs (or a single bipolar construct) is somewhat controversial. There have been psychometric studies providing evidence for the two being both separable (Alessandri et al., 2010; Creed et al., 2002) or a single dimension separated by differentially-keyed items (Steca et al., 2015). There are also studies showing that optimism or pessimism occasionally uniquely predict health and well-being outcomes while the other respective dimension does not (e.g., Chang et al., 1994; Kim et al., 2011; Kubzansky et al., 2001; Marshall et al., 1992; Mroczek et al., 1993; Nabi et al., 2010; Roy et al., 2010; Serlachius et al., 2015). Other researchers have tried to make more conceptual distinctions between the two, such that optimists employ active, approach-oriented coping styles and pessimists employ avoiding coping styles, suggesting they are separable in how optimists and pessimists cope with challenges (Nes & Segerstrom, 2006; Scheier & Carver, 2018). In the current data sets, we considered optimism and pessimism as separate dimensions as a result of our factor analyses.
After settling on the two-factor solution, we tested for weak-, strong-, and strict-invariance over time for the pessimism scale (testing for invariance was not possible for the 2-item optimism scale because models were underidentified—there were more free parameters than observations; Kline, 2015; Yong & Pearce, 2013). The pessimism scales demonstrated strict invariance (e.g., CFIs > .98), with minimal changes in model fit across constraining factor loadings, means, variances, intercepts, and residual variances (ΔCFIs < .005, ΔTLIs < .006, ΔRMSEAs < .004, ΔSRMRs < .004). Details of these invariance tests can be found in the supplementary materials.
Rank-order Stability, Mean-level Change, and Age-related Changes in Optimism and Pessimism
Rank-order stability in optimism and pessimism.
Supplementary Tables 1 (for LISS), 2 (for G-SOEP), and 3 (for HRS) present the descriptive statistics and bivariate correlations between our main study variables. Optimism was moderately stable over a 1–2-year period in LISS (rmean = .58), over a 4–5-year period in G-SOEP (rmean = .39), and over a 4-year period in HRS (rmean = .40). Pessimism was moderately stable over a 1–2-year period (and significantly more so than optimism) in LISS (rmean = .63) and a 4-year period in HRS (rmean = .56). As a reminder, pessimism was not measured in G-SOEP. Differences in stability across the data sets can be partially attributable to the length of their assessment intervals—HRS and G-SOEP had longer spaced intervals than LISS, so their test-retest correlations were lower (Fraley & Roberts, 2005).
Mean-level changes in optimism and pessimism.
We began by running unconditional models in which optimism and pessimism were modeled as a function of intercepts and linear slopes (and a quadratic slope for LISS because there were enough waves to do so). Models for optimism and pessimism were run separately (for LISS and HRS); a model for the one-item measure of optimism for G-SOEP was also run. As seen in Table 2, the unconditional model fit the data well for optimism and pessimism for each data set. The only exception was poor model fit for G-SOEP optimism, possibly because we used a single-item indicator.
Table 2.
Model Fit Indices for Unconditional Linear Growth Curve Models
| Sample | χ2 | df | p | RMSEA | CFI | TLI | SRMR |
|---|---|---|---|---|---|---|---|
| LISS-Optimism | 109.87 | 19 | <.001 | 0.02 [.02,.03] | 0.99 | 0.99 | 0.05 |
| LISS-Pessimism | 119.02 | 19 | <.001 | 0.02 [.02,.03] | 0.99 | 0.99 | 0.02 |
| G-SOEP Optimism | 1037.40 | 1 | <.001 | 0.16 [.15,.16] | 0.80 | 0.41 | 0.08 |
| HRS-Optimism | 12.34 | 1 | <.001 | 0.02 [.01,.04] | 0.99 | 0.99 | 0.01 |
| HRS-Pessimism | 21.47 | 1 | <.001 | 0.03 [.02,.04] | 0.99 | 0.99 | 0.01 |
Note. 90% Confidence intervals in brackets. LISS sample included quadratic factors
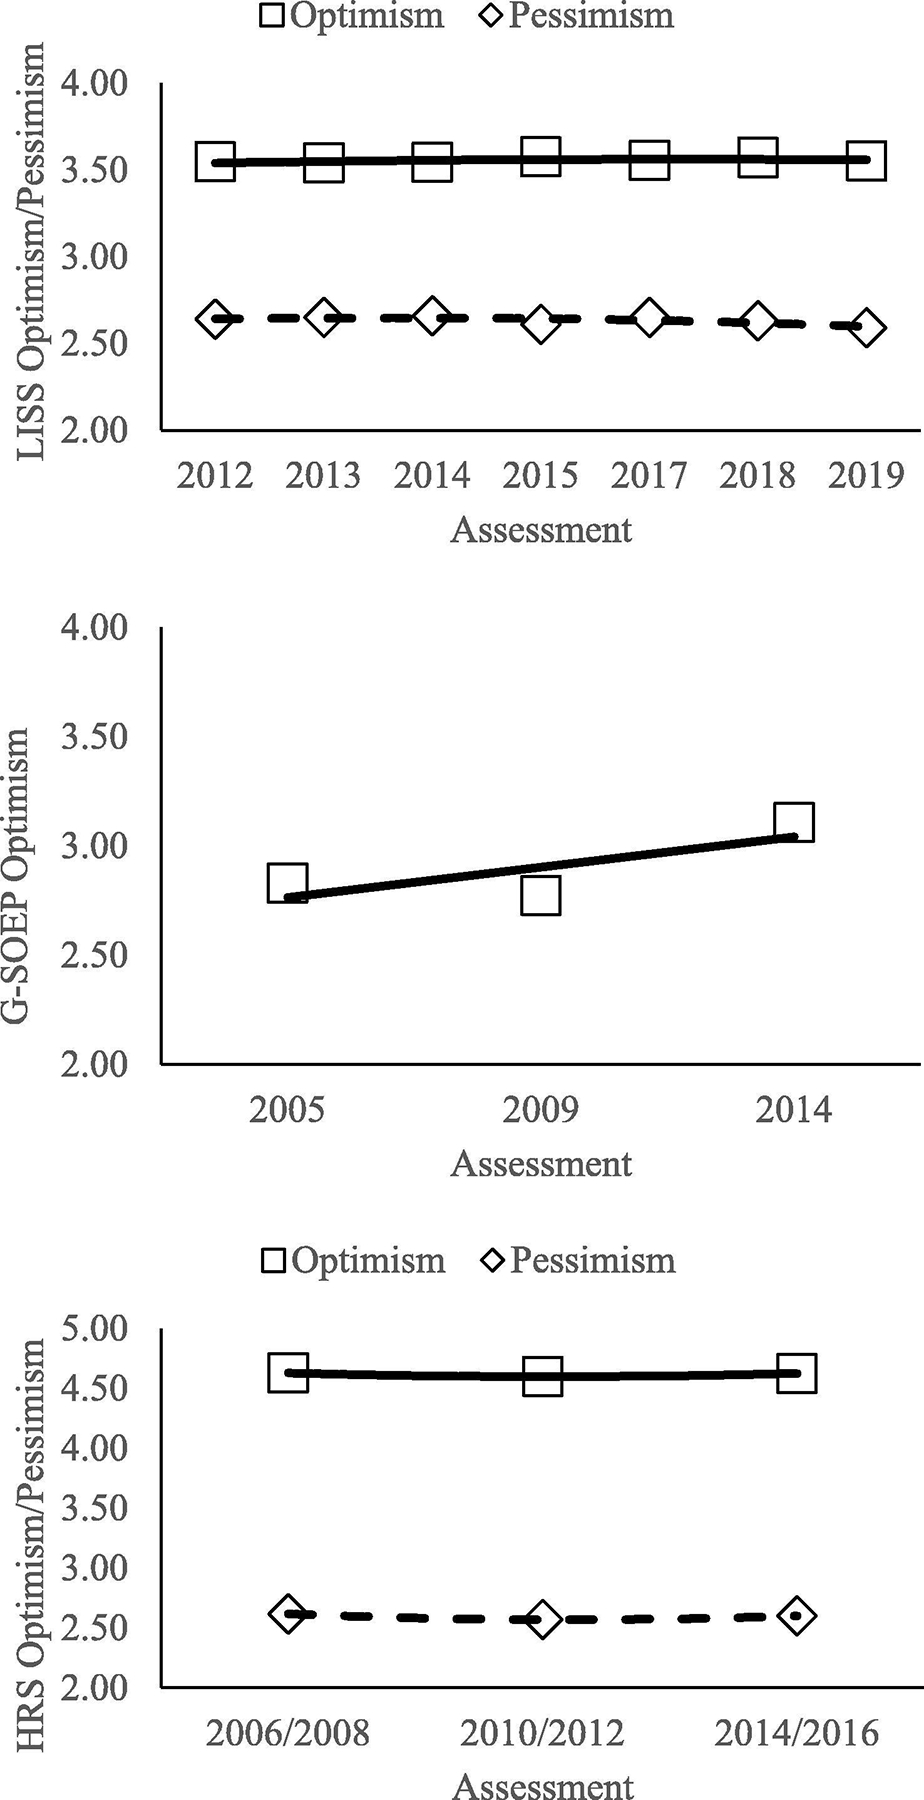
Parameter estimates from the unconditional models are presented in Table 3, and patterns of mean-level changes for optimism and pessimism are depicted in Figures 1a–c.
Table 3.
Parameter Estimates for Unconditional Latent Growth Curve Models
| LISS | Optimism | Pessimism | ||||||||||||
|---|---|---|---|---|---|---|---|---|---|---|---|---|---|---|
| b | SE | t | p | LB | UB | ϐ | b | SE | t | p | LB | UB | ϐ | |
| Level mean | 3.53 | 0.01 | 472.58 | <0.001 | 3.52 | 3.55 | 6.79 | 2.67 | 0.01 | 336.64 | <0.001 | 2.65 | 2.681 | 4.75 |
| Level variance | 0.27 | 0.01 | 32.25 | <0.001 | 0.25 | 0.29 | 1.00 | 0.32 | 0.01 | 34.05 | <0.001 | 0.30 | 0.334 | 1.00 |
| Slope mean | 0.01 | 0.00 | 2.64 | 0.008 | 0.00 | 0.02 | 0.12 | 0.00 | 0.00 | 0.86 | 0.391 | −0.00 | 0.011 | 0.04 |
| Slope variance | 0.01 | 0.00 | 3.17 | 0.002 | 0.00 | 0.01 | 1.00 | 0.01 | 0.00 | 2.64 | 0.008 | 0.00 | 0.012 | 1.00 |
| Quadratic mean | −0.00 | 0.00 | −2.04 | 0.042 | −0.00 | 0.00 | −0.09 | −0.00 | 0.00 | −2.35 | 0.019 | −0.00 | <0.001 | −0.13 |
| Quadratic variance | 0.00 | 0.00 | 3.06 | 0.002 | <0.00 | 0.00 | 1.00 | 0.00 | 0.00 | 2.09 | 0.037 | 0.00 | <0.001 | 1.00 |
| Level and slope | 0.00 | 0.00 | 0.25 | 0.806 | −0.01 | 0.01 | 0.02 | 0.01 | 0.00 | 1.25 | 0.210 | −0.00 | 0.013 | 0.11 |
| Level and quadratic | −0.00 | 0.00 | −1.34 | 0.180 | −0.00 | 0.00 | −0.11 | −0.00 | 0.00 | −1.30 | 0.195 | −0.00 | <0.001 | −0.12 |
| Slope and quadratic | −0.00 | 0.00 | −2.76 | 0.006 | −0.00 | 0.00 | −0.87 | −0.00 | 0.00 | −2.08 | 0.038 | −0.00 | <0.001 | −0.86 |
| G-SOEP | Optimism | ||||||
|---|---|---|---|---|---|---|---|
| b | SE | t | p | LB | UB | ϐ | |
| Level mean | 2.81 | 0.01 | 532.41 | <0.001 | 2.80 | 2.82 | 5.14 |
| Level variance | 0.30 | 0.01 | 31.44 | <0.001 | 0.28 | 0.32 | 1.00 |
| Slope mean | 0.03 | 0.00 | 39.99 | <0.001 | 0.03 | 0.03 | 0.76 |
| Slope variance | 0.00 | 0.00 | 4.96 | <0.001 | 0.00 | 0.00 | 1.00 |
| Level and slope | −0.01 | 0.00 | −5.74 | <0.001 | −0.01 | −0.01 | −0.36 |
| HRS | Optimism | Pessimism | ||||||||||||
|---|---|---|---|---|---|---|---|---|---|---|---|---|---|---|
| b | SE | t | p | LB | UB | ϐ | b | SE | t | p | LB | UB | ϐ | |
| Level mean | 4.62 | 0.01 | 502.99 | <0.001 | 4.60 | 4.64 | 5.59 | 2.64 | 0.01 | 268.50 | <.001 | 2.62 | 2.66 | 2.51 |
| Level Variance | 0.68 | 0.03 | 24.90 | <0.001 | 0.63 | 0.74 | 1.00 | 1.11 | 0.03 | 39.31 | <.001 | 1.05 | 1.16 | 1.00 |
| Slope mean | 0.00 | 0.00 | −2.63 | 0.009 | −0.01 | 0.00 | 0.06 | .00 | 0.00 | −0.18 | 0.856 | −0.00 | 0.00 | 0.00 |
| Slope variance | 0.01 | 0.00 | 5.70 | <0.001 | 0.00 | 0.01 | 1.00 | 0.00 | 0.00 | 4.77 | <.001 | 0.00 | 0.01 | 1.00 |
| Level and slope | −0.02 | 0.00 | −3.81 | <0.001 | −0.02 | −0.01 | −0.27 | −0.02 | 0.01 | −5.86 | <.001 | −0.03 | −0.02 | −0.35 |
Note. LB = lower bound, UB = upper bound of 95% confidence intervals.
Figure 1.
Forest plot of the effects on life events on the intercepts for optimism (left) and pessimism (right).
For optimism, the linear slope was positive for LISS and G-SOEP (suggesting increases in optimism on average over time) and negative for HRS (suggesting declines in optimism on average over time). The quadratic effect for optimism in LISS was also significant, suggesting that increases in optimism were most prevalent during the first couple years of the study (2012–2015) before reaching a plateau (2015–2019). Variances in the intercepts and slopes were significant, indicating individual differences in the development of optimism over time that may be associated with life event experience.
For pessimism, the linear slope was not significant in either HRS or LISS, suggesting little to no changes in pessimism on average. However, the quadratic effect for pessimism in LISS was significant, suggesting that pessimism was relatively stable for the first couple of years of the study (2012–2015) before increasing in the latter years of the study (2015–2019). Variances in the intercepts and slopes were significant, indicating individual differences in the development of pessimism over time as well.
Age-related changes in optimism and pessimism.
We next ran conditional models in which we examined age, age2, gender, and education as predictors of intercepts and slopes for optimism and pessimism.
Optimism.
The results for optimism can be seen in upper three panels of Table 4. In all three data sets, age2 predicted the intercept of optimism. As seen in Figures 2a–c, younger adults were lower in optimism compared to middle-aged adults in LISS and HRS. However, optimism was lowest in the late life participants in HRS and G-SOEP, replicating and reproducing previous research (Chopik et al., 2015; Schwaba et al., 2019). Interestingly, the G-SOEP data showed the opposite pattern from young-adulthood to mid-life, such that younger adults were higher in optimism compared to middle-aged adults.
Table 4.
Changes in Optimism and Pessimism (LISS)
| Optimism-LISS | Intercept | Slope | ||||||||||||
|---|---|---|---|---|---|---|---|---|---|---|---|---|---|---|
| b | SE | t | p | LB | UB | ϐ | b | SE | t | p | LB | UB | ϐ | |
| Gender | 0.07 | 0.02 | 4.59 | <.001 | 0.04 | 0.10 | 0.07 | 0.00 | 0.01 | −0.16 | 0.872 | −0.02 | 0.01 | −0.01 |
| Age | 0.00 | 0.00 | 5.27 | <.001 | 0.00 | 0.00 | 0.08 | 0.00 | 0.00 | 1.68 | 0.093 | 0.00 | 0.00 | 0.08 |
| Age2 | 0.00 | 0.00 | 4.07 | <.001 | 0.00 | 0.00 | 0.06 | 0.00 | 0.00 | −1.62 | 0.104 | 0.00 | 0.00 | −0.08 |
| Education | 0.05 | 0.01 | 9.40 | <.001 | 0.04 | 0.06 | 0.15 | 0.00 | 0.00 | 0.49 | 0.621 | 0.00 | 0.01 | 0.02 |
| Optimism-G-SOEP | Intercept | Slope | ||||||||||||
|---|---|---|---|---|---|---|---|---|---|---|---|---|---|---|
| b | SE | t | p | LB | UB | ϐ | b | SE | t | p | LB | UB | ϐ | |
| Gender | −0.01 | 0.01 | −0.75 | 0.454 | −0.03 | 0.01 | −0.01 | 0.00 | 0.00 | 2.37 | 0.018 | 0.00 | 0.01 | 0.05 |
| Age | −0.01 | 0.00 | −32.02 | <.001 | −0.01 | −0.01 | −0.34 | 0.00 | 0.00 | 5.65 | <.001 | 0.00 | 0.00 | 0.13 |
| Age2 | 0.00 | 0.00 | 8.89 | <.001 | 0.00 | 0.00 | 0.09 | 0.00 | 0.00 | −3.80 | <.001 | 0.00 | 0.00 | −0.09 |
| Education | 0.03 | 0.00 | 17.20 | <.001 | 0.03 | 0.04 | 0.17 | 0.00 | 0.00 | −6.88 | <.001 | 0.00 | 0.00 | −0.14 |
| Optimism-HRS | Intercept | Slope | ||||||||||||
|---|---|---|---|---|---|---|---|---|---|---|---|---|---|---|
| b | SE | t | p | LB | UB | ϐ | b | SE | t | p | LB | UB | ϐ | |
| Gender | −0.03 | 0.02 | −1.41 | 0.158 | −0.06 | 0.01 | −0.02 | −0.01 | 0.01 | −1.88 | 0.061 | −0.02 | 0.00 | −0.04 |
| Age | 0.00 | 0.00 | 1.53 | 0.126 | 0.00 | 0.00 | 0.02 | 0.00 | 0.00 | −3.98 | <.001 | 0.00 | 0.00 | −0.10 |
| Age2 | 0.00 | 0.00 | −2.82 | 0.005 | 0.00 | 0.00 | −0.03 | 0.00 | 0.00 | −1.40 | 0.161 | 0.00 | 0.00 | −0.04 |
| Education | 0.02 | 0.00 | 7.11 | <.001 | 0.02 | 0.03 | 0.08 | 0.00 | 0.00 | 1.61 | 0.107 | 0.00 | 0.00 | 0.04 |
| Pessimism-LISS | Intercept | Slope | ||||||||||||
|---|---|---|---|---|---|---|---|---|---|---|---|---|---|---|
| b | SE | t | p | LB | UB | ϐ | b | SE | t | p | LB | UB | ϐ | |
| Gender | 0.01 | 0.02 | 0.77 | 0.441 | −0.02 | 0.04 | 0.01 | 0.01 | 0.01 | 0.82 | 0.413 | −0.01 | 0.02 | 0.04 |
| Age | 0.00 | 0.00 | −3.01 | 0.003 | 0.00 | 0.00 | −0.04 | 0.00 | 0.00 | −0.58 | 0.562 | 0.00 | 0.00 | −0.03 |
| Age2 | 0.00 | 0.00 | 0.22 | 0.826 | 0.00 | 0.00 | 0.00 | 0.00 | 0.00 | 0.64 | 0.525 | 0.00 | 0.00 | 0.03 |
| Education | −0.11 | 0.01 | −20.68 | <.001 | −0.12 | −0.10 | −0.31 | 0.00 | 0.00 | 0.56 | 0.573 | 0.00 | 0.01 | 0.03 |
| Pessimism-HRS | Intercept | Slope | ||||||||||||
|---|---|---|---|---|---|---|---|---|---|---|---|---|---|---|
| b | SE | t | p | LB | UB | ϐ | b | SE | t | p | LB | UB | ϐ | |
| Gender | 0.20 | 0.02 | 10.41 | <.001 | 0.16 | 0.24 | 0.09 | −0.01 | 0.00 | −3.02 | 0.003 | −0.02 | 0.00 | −0.07 |
| Age | −0.01 | 0.00 | −7.95 | <.001 | −0.01 | −0.01 | −0.08 | 0.00 | 0.00 | 3.77 | 0.000 | 0.00 | 0.00 | 0.10 |
| Age2 | 0.00 | 0.00 | 6.06 | <.001 | 0.00 | 0.00 | 0.06 | 0.00 | 0.00 | −1.29 | 0.198 | 0.00 | 0.00 | −0.04 |
| Education | −0.12 | 0.00 | −40.17 | <.001 | −0.13 | −0.12 | −0.37 | 0.00 | 0.00 | 3.34 | 0.001 | 0.00 | 0.00 | −0.08 |
| Optimism-LISS | Quadratic | ||||||
|---|---|---|---|---|---|---|---|
| b | SE | t | p | LB | UB | ϐ | |
| Gender | 0.00 | 0.00 | −0.11 | 0.909 | 0.00 | 0.00 | −0.01 |
| Age | 0.00 | 0.00 | −3.38 | 0.001 | 0.00 | 0.00 | −0.17 |
| Age2 | 0.00 | 0.00 | 1.31 | 0.191 | 0.00 | 0.00 | 0.07 |
| Education | 0.00 | 0.00 | −0.14 | 0.886 | 0.00 | 0.00 | −0.01 |
| Pessimism-LISS | Quadratic | ||||||
|---|---|---|---|---|---|---|---|
| b | SE | t | p | LB | UB | ϐ | |
| Gender | 0.00 | 0.00 | −0.66 | 0.512 | 0.00 | 0.00 | −0.04 |
| Age | 0.00 | 0.00 | 2.16 | 0.031 | 0.00 | 0.00 | 0.13 |
| Age2 | 0.00 | 0.00 | −1.01 | 0.311 | 0.00 | 0.00 | −0.06 |
| Education | 0.00 | 0.00 | −0.54 | 0.588 | 0.00 | 0.00 | −0.03 |
Note. Due to convergence issues, parameters with “-” were not modeled to simplify the model. Gender: 1=men, 0=women. and education were grand-mean centered. All life events: 1=experienced event, 0= did not experience event. LB = lower bound, UB = upper bound of 95% confidence intervals. Significant results at p < .05 are bolded.
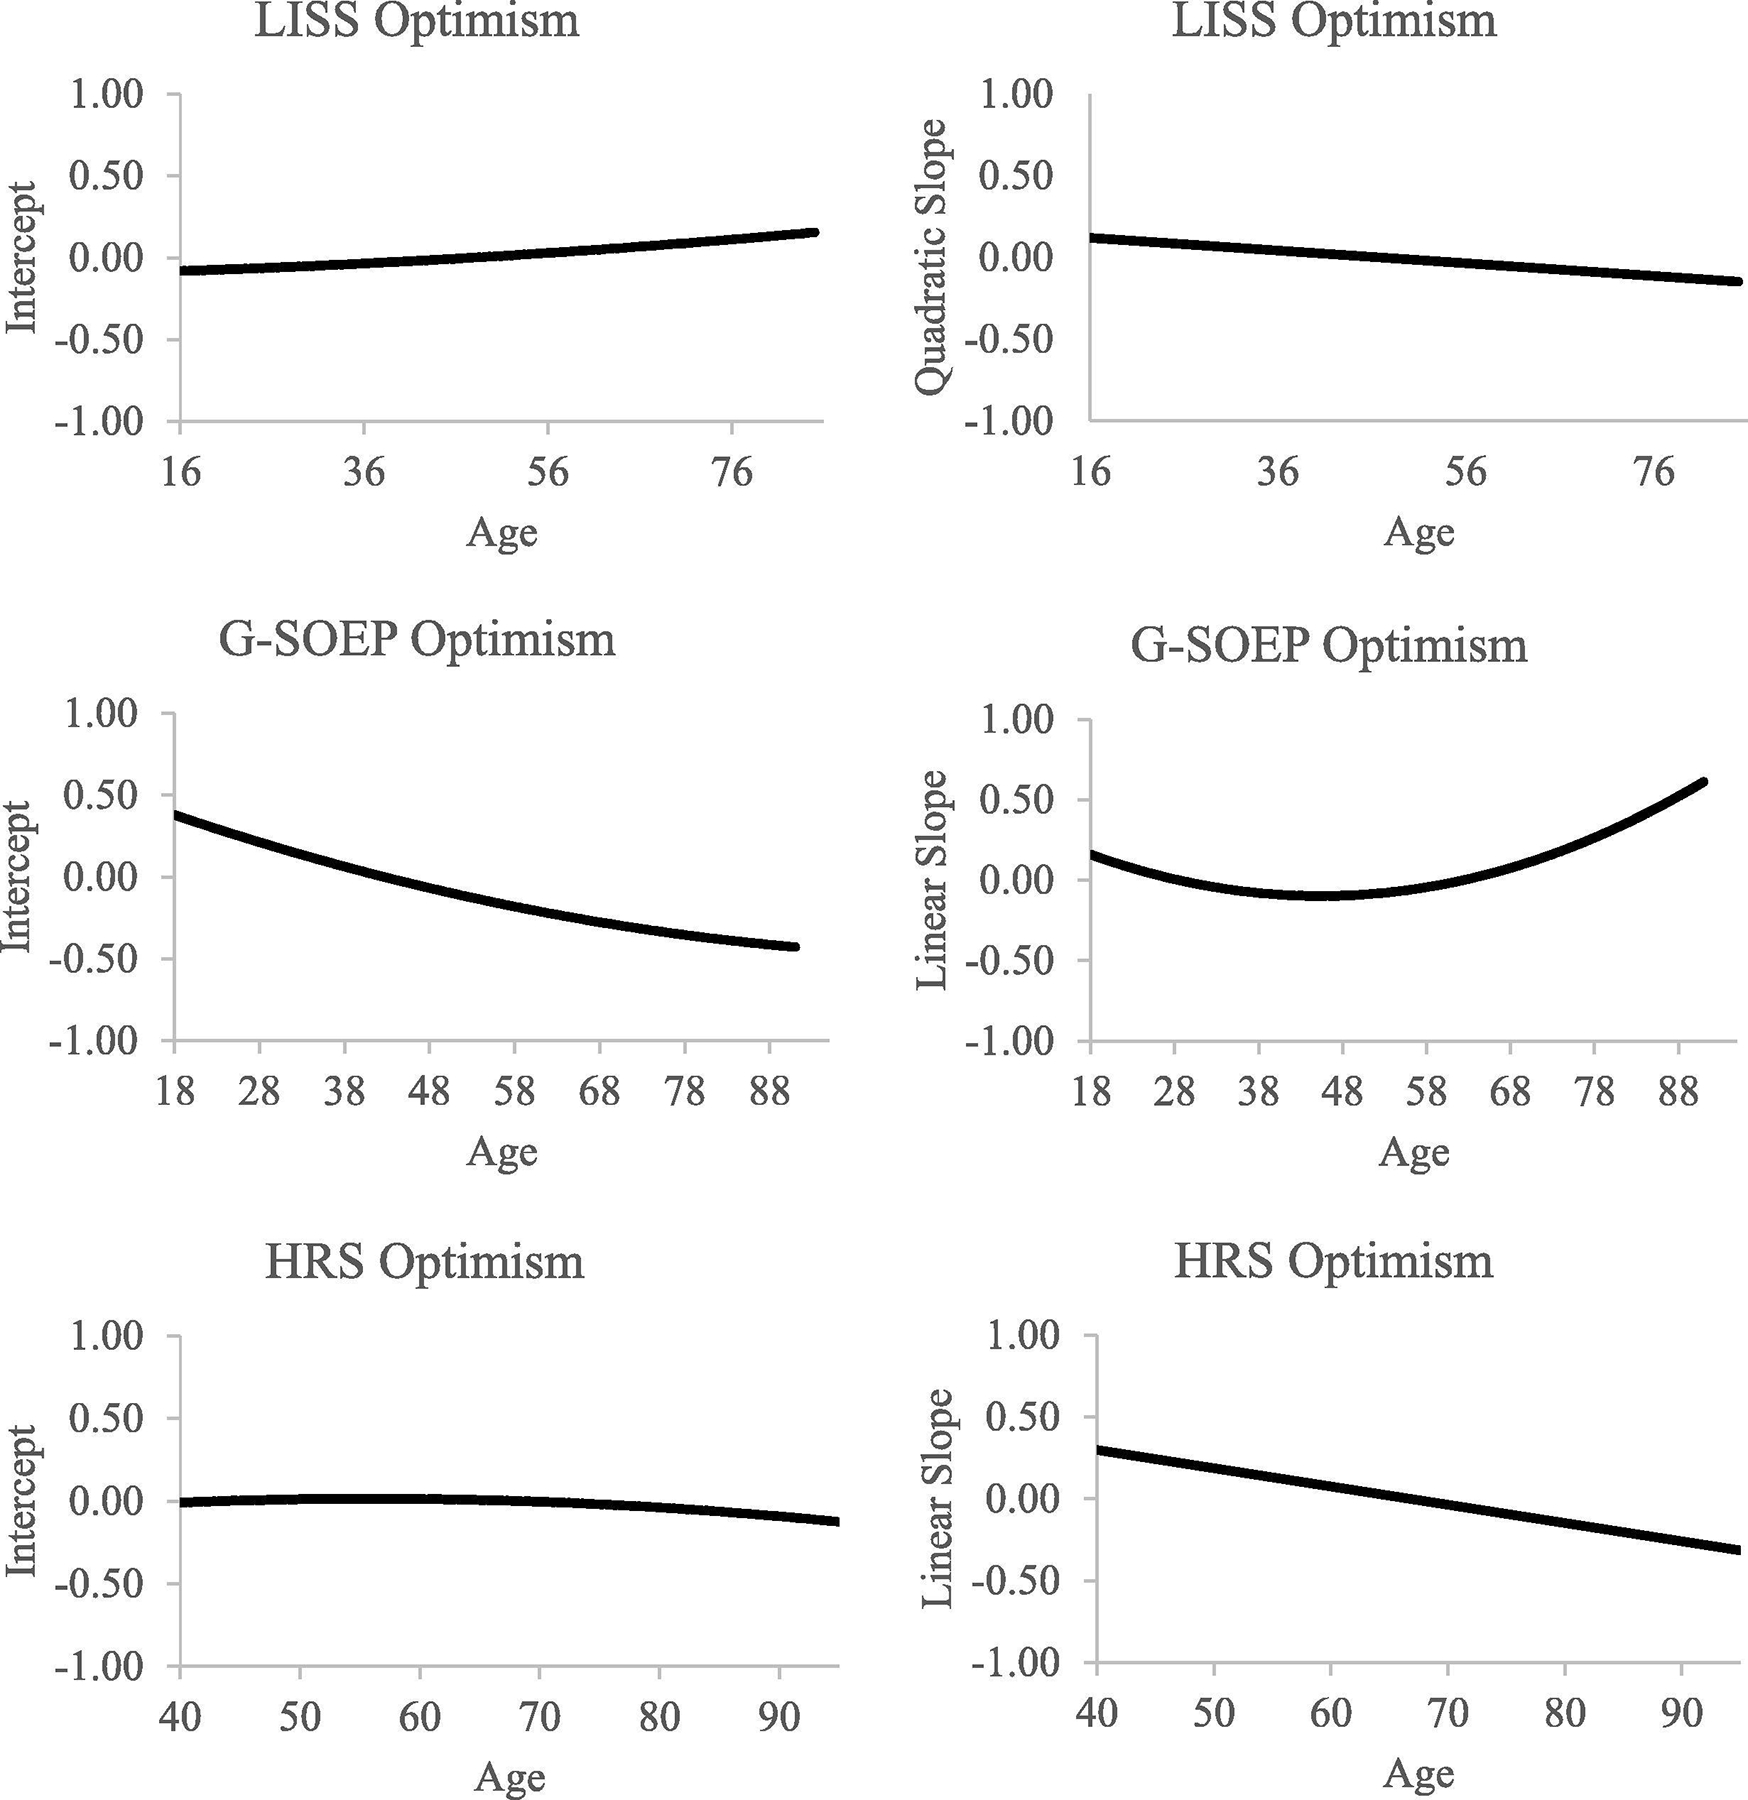
For LISS, age negatively predicted the quadratic slope for optimism (Figure 2d). Examining the effect of age on the quadratic slope for LISS revealed that the quadratic effect was larger for adults aged 16–19 (M = .19; U-shaped), was approximately zero for adults aged 40–49 (M = .03) and 50–59 (M = −.01), and was negative for adults over the age of 60 (M = −.13; inverted U-shaped). As seen in Supplementary Figure 1, adults aged 16–19 declined in optimism from times 1 to 3 before increasing in optimism from times 3 to 7. For G-SOEP, age2 predicted the slope for optimism, such that younger and older adults increased in optimism over time and middle-aged adults did not change much over time (Figure 2e). Age predicted the slope of HRS, suggesting that participants were increasing in optimism until about age 65–70 before declining in optimism (see Figure 2f), again replicating and reproducing previous research (Chopik et al., 2015; Schwaba et al., 2019).
With respect to the control variables, people with higher levels of education were higher in optimism in all three data sets, and in G-SOEP, people with higher levels of education additionally increased in optimism at a slower rate over time. Men were higher in optimism in LISS and experienced greater increases in optimism over time in G-SOEP.
Pessimism.
The results for pessimism can be seen in the lower two panels of Table 4. For LISS, age predicted the intercept of pessimism; for HRS, and age2 predicted the intercept for pessimism. Upon plotting the intercepts by age, we discovered significant curvature in the plotted data. Thus, as a departure from our pre-registered analyses, we ran a supplementary analysis adding age3 as a predictor of intercepts and slopes (see Supplementary Table 4). Indeed, age3 predicted the intercepts for pessimism (but nothing else in the model) and, as a result, we plotted this effect. As seen in Figure 3a, pessimism is higher in younger adults and older adults (compared to middle-aged adults) in LISS. As seen in Figure 3b, younger (i.e., approximately middle-aged) and the oldest-old (for HRS) were more pessimistic compared to young-old in HRS, approximating the pattern seen for optimism in HRS.
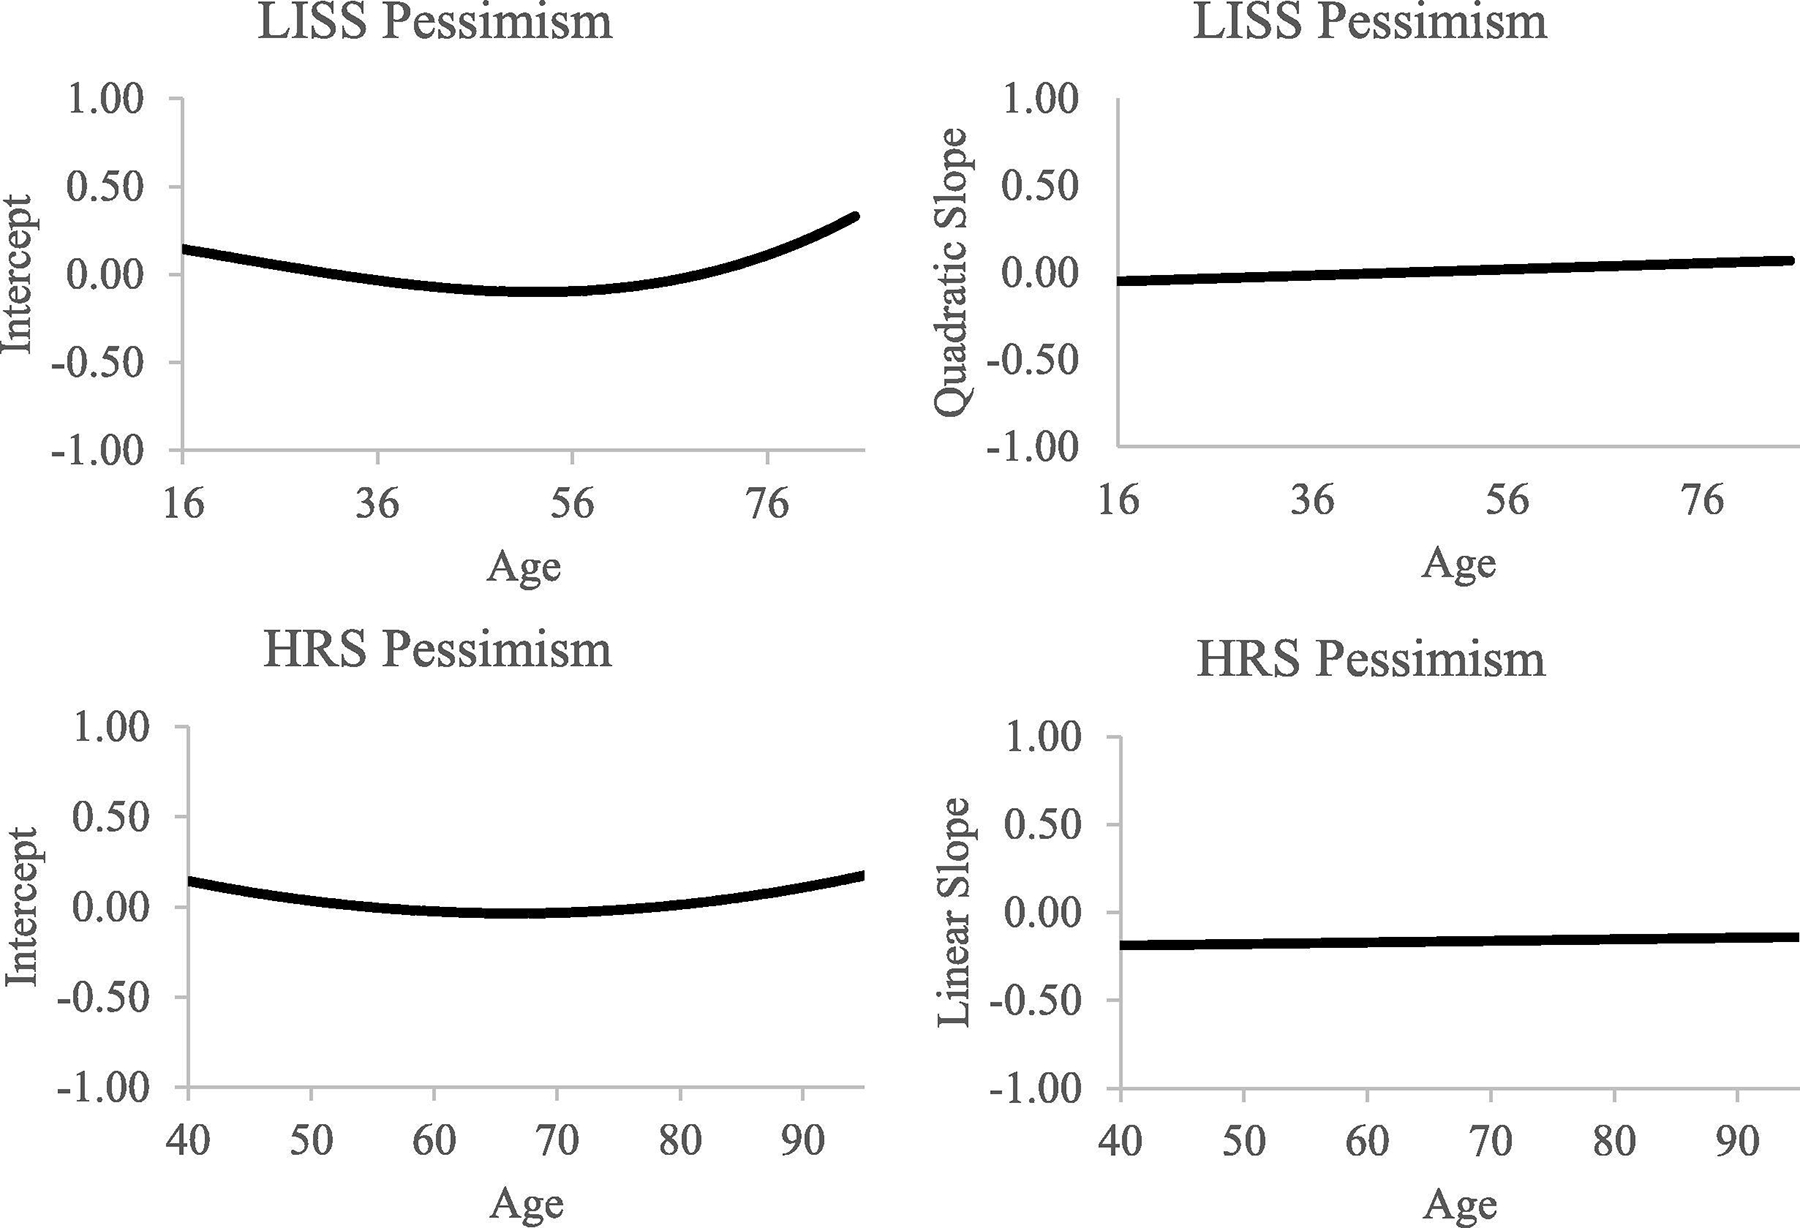
For LISS, age was positively associated with the quadratic slope for pessimism such that the quadratic slope became less negative after young adulthood (Figure 3c). Examining the effect of age on the quadratic slope further revealed that the quadratic effect was negative for participants under the age of 30 (M = −.10; inverted U-shaped) and near zero for people over the age of 30 (M = .02; relatively flat slope), although the effects were still relatively small. As seen in Supplementary Figure 2, adults aged 16–19 were relatively stable in pessimism from time 1 to time 3 before declining from time 3 to time 7. The majority of older age groups were relatively stable in pessimism across the study window. Age predicted the slope for pessimism (for HRS). Although the linear slope of pessimism, on average, was not significantly different from zero (see unconditional model) in HRS, younger adults declined in pessimism at a sharper rate than middle-aged and older adults (see Figure 3d).
As a reminder, pessimism was not measured in G-SOEP.
In LISS and HRS, people with higher levels of education were less pessimistic. In HRS, men were more pessimistic but declined more dramatically in pessimism over time. Also in HRS, people with higher education increased in pessimism more over time.
The influence of life events on optimism and pessimism.
We next added the life events that were present in each data set to the aforementioned models and included the age terms, gender, and education.
Optimism.
The results for the effects of life events on optimism can be found in the lower panels of Supplementary Tables 5 (for LISS), 6 (for G-SOEP), and 7 (for HRS) and are summarized in the left panels of Figures 4 and 5.
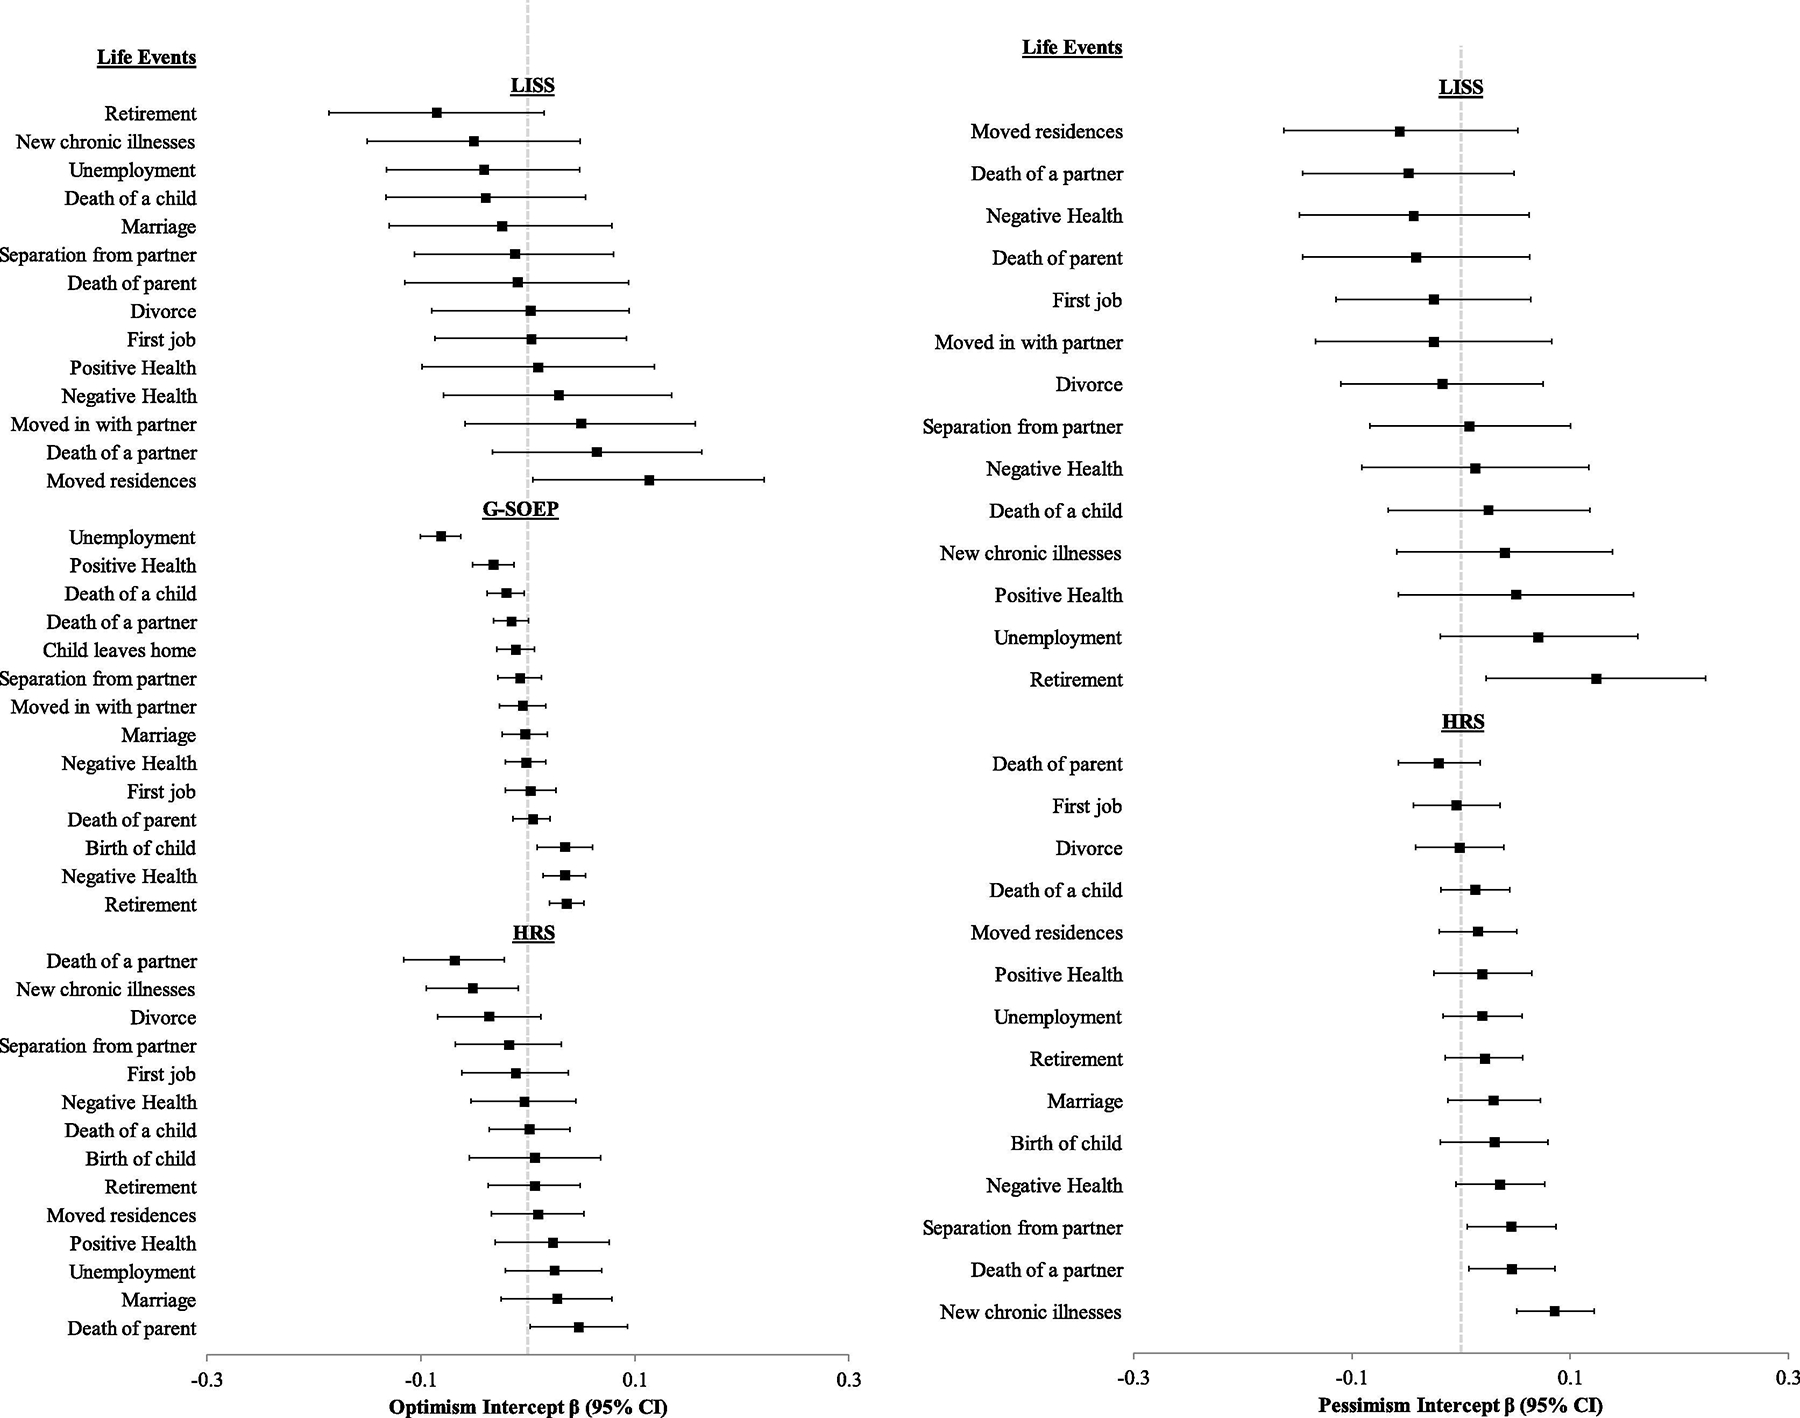
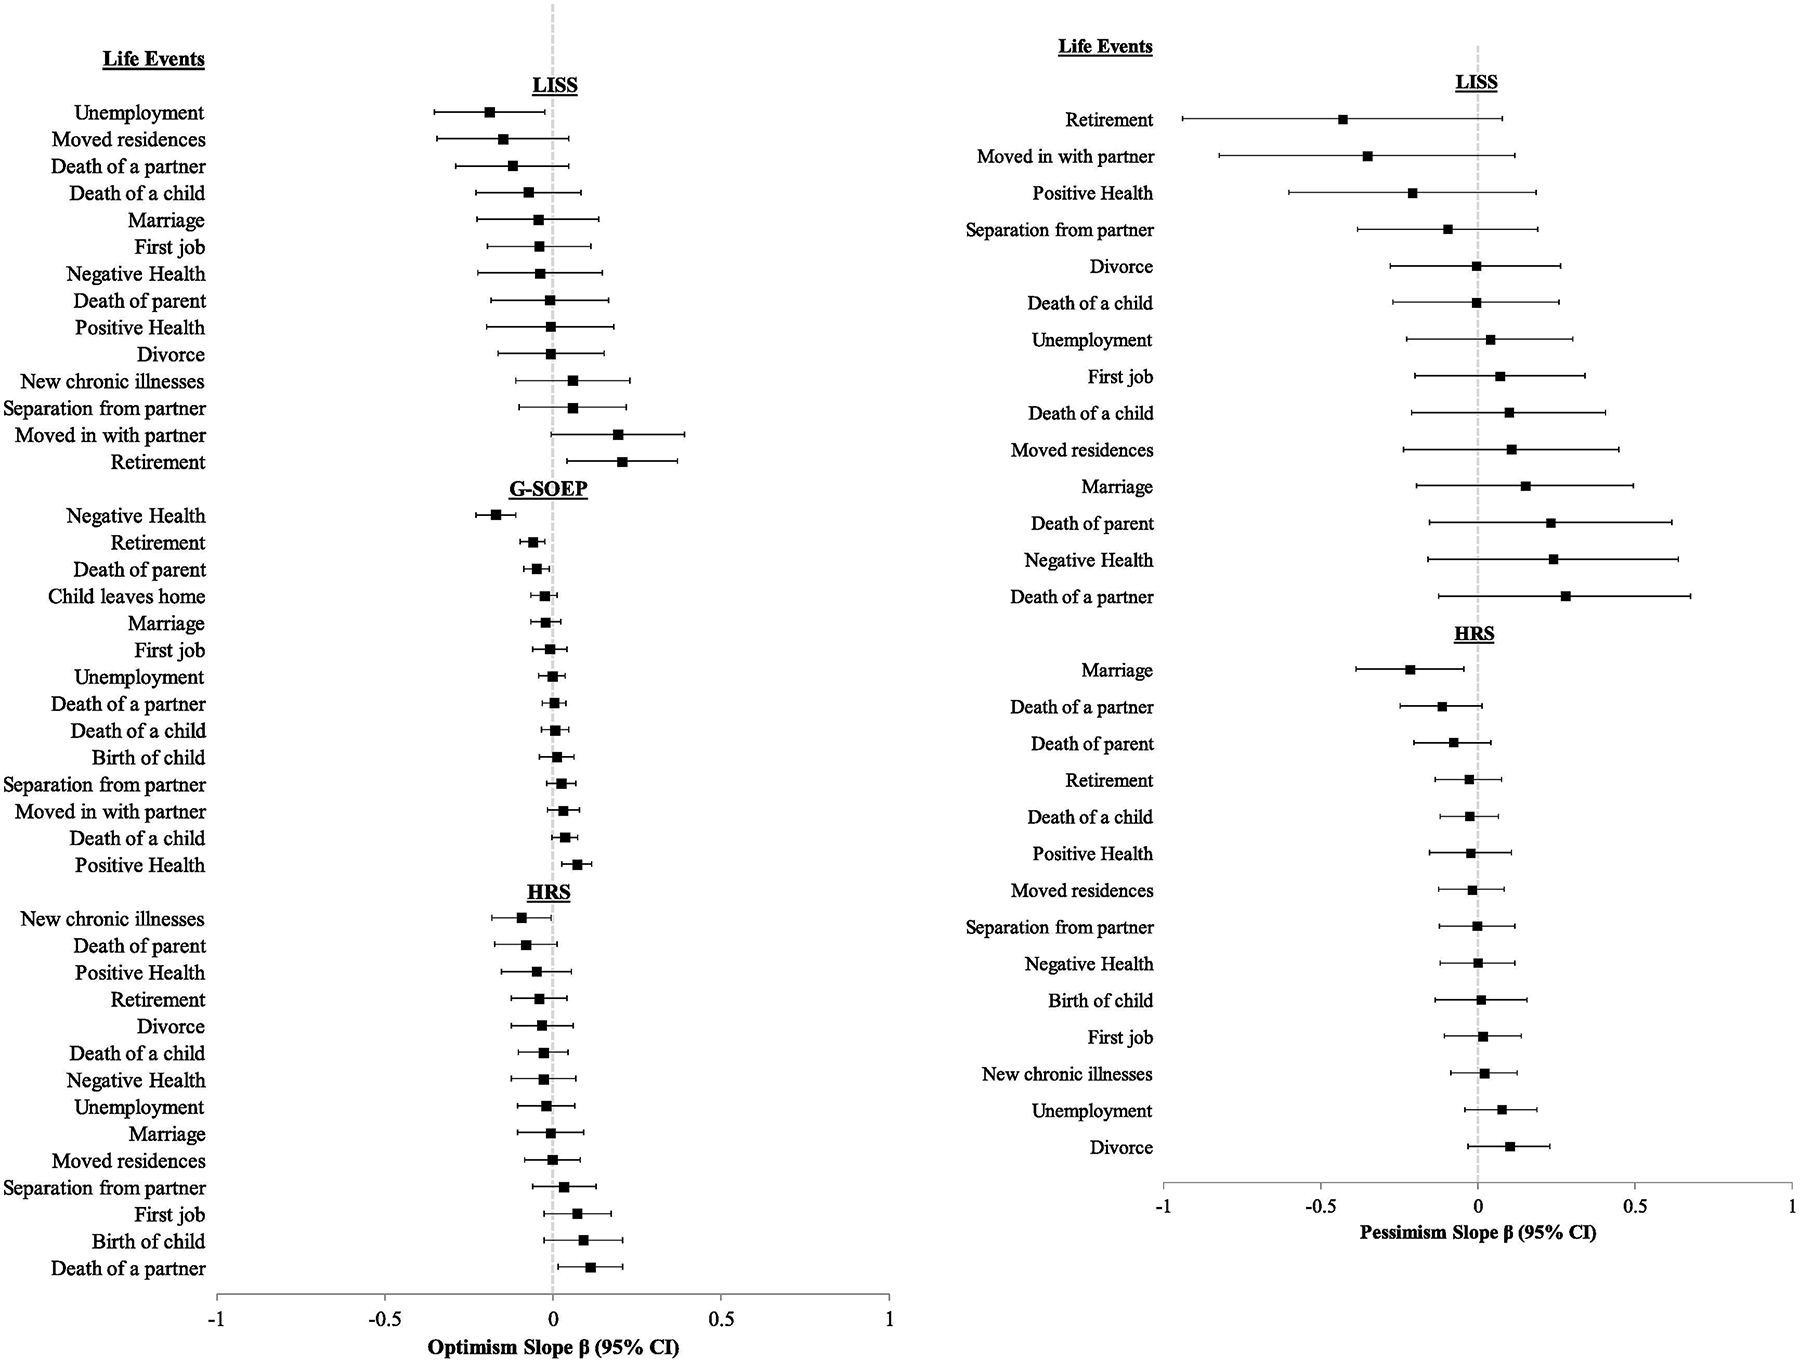
In LISS, optimism was associated with a greater likelihood of moving (β = .11, p =.042). Moving in with a partner (β = .07, p =.047) and retiring (β = .21, p =.007) were associated with more dramatic increases in optimism over time. However, retirement was associated with the quadratic slope of optimism (β = −.20, p =.008), such that people who retired increased in optimism from 2012–2015 before declining in optimism from 2015–2019 (people who did not retire were relatively stable in optimism). Becoming unemployed was associated with flatter increases in optimism over time (β = −.19, p = .017).
In G-SOEP, higher levels of optimism were associated with a higher likelihood of experiencing childbirth (β = .03, p =.009), a lower likelihood of having a child die (β = −.02, p =.021), less positive changes in health (β = −.03, p =.001), more negative changes in health (β = .031, p = .001), a higher likelihood of retiring (β = .04, p < .001), and a lower likelihood of being unemployed (β = −.08, p < .001). Having a parent pass away was associated with shallower increases in optimism (β = −.05, p = .01). Improvements in health were associated with more dramatic increases in optimism (β = .07, p = .001), while worsened health (β = −.17, p < .001) and retirement (β = −.06, p = .001) were associated with shallower increases in optimism.
In HRS, higher optimism was associated with fewer chronic illnesses over time (β = −.05, p = .019), a lower likelihood of their partner dying (β = −.07, p = .004), and — counterintuitively—a higher likelihood of their parent dying (β = .05, p = .041). Being diagnosed with a new chronic illness was associated with more dramatic declines in optimism (β = −.09, p = .026); spousal bereavement was, counterintuitively, associated with less dramatic declines in optimism over time (β = .11, p = .015).
Pessimism.
Results evaluating the effects of life events on pessimism can be found in the lower panels of Supplementary Tables 8 (for LISS5) and 9 (for HRS) and are summarized in the right panels of Figures 4 and 5.
In LISS, higher pessimism was associated with a higher likelihood of retiring (β = .12, p = .016). Moving in with a partner (β = −.35, p = .035) and retiring (β = −.43, p = .001) were associated with declines in pessimism. However, retirement was associated with a quadratic effect of pessimism (β = .39, p = .001), such that people declined in pessimism throughout the study window, particularly from 2015–2019 (people who did not retire were relatively stable in pessimism before declining slightly from 2015–2019).
In HRS, higher pessimism was associated with a higher likelihood of new chronic illnesses over time (β = .09, p < .001), a higher likelihood of experiencing spousal bereavement (β = .05, p = .020), and a higher likelihood of separating from a partner (β = .05, p = .025). Having a partner die was, counterintuitively, associated with declines in pessimism over time (β = −.12, p = .040). Becoming married was associated with declines in pessimism over time (β = −.22, p = .001).
As a reminder, pessimism was not measured in G-SOEP.
Summary
We found some support for our hypotheses in two of our datasets (LISS and HRS). Younger adults were lower in optimism compared to middle-aged adults, then as people aged and approached older adulthood, they began declining in optimism. G-SOEP participants showed a different pattern in which younger adults were higher in optimism and people increased in optimism as they aged. The results with respect to pessimism were more consistent—older adults were highest in pessimism in the two samples and younger adults declined more dramatically in pessimism over time.
In terms of life events predicting intercepts and slopes, we observed a few intuitive results. For example, optimism was often associated with the onset of positive events, including (in HRS) having fewer chronic illnesses, a lower likelihood of spousal bereavement, and (in GSOEP) a lower likelihood of unemployment; increases in optimism were also stymied following the onset of unemployment (in LISS). Likewise, pessimism predicted more chronic illnesses, a higher likelihood of spousal separation and bereavement, and declined when people got married (in HRS). However, there were also several counterintuitive findings in which optimism (pessimism) predicted the onset of ostensibly negative (positive) life events. Further, one standard of evidence for how optimism/pessimism relate to life events is that the findings for a particular life event should be present across the three data sets. Figures 4 and 5 contain forest plots summarizing the effect sizes that the life events had on the intercepts and slopes of optimism/pessimism across all the models. By this standard (i.e., effects that need to replicate across samples), one could conclude that the incidence of life events—completely agnostic to how individuals interpret them (Luhmann et al., 2019; Schwaba et al., 2019)—may be largely unrelated to changes in optimism and pessimism.
Discussion
We examined how optimism and pessimism change across the lifespan and whether life events affect changes in optimism and pessimism. In two samples, we found that middle aged adults were higher in optimism and lower in pessimism compared to younger and older adults. Indeed, younger adults tended to increase in optimism (decrease in pessimism) and older adults tended to decrease in optimism (and increase in pessimism). In the third sample, we observed that younger adults were higher in optimism compared to middle-aged adults who in turn were higher in optimism than older adults, with older adults increasing in optimism over time. The effect of life events on changes in optimism/pessimism were heterogeneous across the samples, with few consistent effects emerging. The current paper is the largest examination of changes in optimism/pessimism conducted to date and is the first to consider such a wide range of life events and how they might affect these changes.
Age Differences and Changes in Optimism and Pessimism
We replicated a number of past studies finding that optimism was lower in younger adulthood and higher in older adulthood (Abraham, 2007; Isaacowitz, 2005; Lennings, 2000; You et al., 2009). We also replicated evidence that optimism tends to increase until middle-age and older adulthood prior to declining through late life (Chopik et al., 2015; Schwaba et al., 2019). Such a pattern can be predicted from theoretical work. Specifically, several theories suggest that an increased focus on emotional well-being and balance is associated with more positive affect across life (Reed & Carstensen, 2012; Ryan & Deci, 2000). However, the challenges and difficulties of older adulthood might interfere with this process, leading to declines in optimism and well-being in later life (Gerstorf, Ram, Estabrook, et al., 2008; Gerstorf et al., 2010; Gerstorf, Ram, Röcke, et al., 2008). The same approximate patterns could be found for pessimism. Our third sample did not show these same patterns. Ultimately, it is unclear why G-SOEP participants showed an opposite pattern. Worth noting is that the other two samples showed a “symmetry” between the age differences in the intercepts and age differences in the slopes. Specifically, younger adults tended to increase in optimism (as they were lower in optimism), middle-aged adults did not significantly change (as they were the “plateau” in HRS), and optimism tended to decline among older adults (who were lower in late life). Thus, age differences in the slopes approximate age differences in the intercepts—younger adults increased in optimism until middle-age before declining.
We discuss this symmetry because the opposite pattern was found in the G-SOEP. Older adults were indeed lower in optimism but they tended to increase in optimism at the most dramatic rate in the sample. Middle-aged adults were actually lower in optimism compared to younger adults. Although rarely discussed explicitly in past research, this asymmetry might suggest the presence of stronger cohort effects in Germany (see also Lucas & Donnellan, 2011), or some other sample-specific characteristics. In other words, it is possible that age differences in the intercept more strongly reflect that Germans who are middle-aged (born from 1940 through 1965) and older adults (born from 1909 through 1940) in 2005 (the first assessment) might be less optimistic than younger adults (i.e., those born after 1965) for some unknown reason. Intergenerational changes in psychological characteristics are often attributable to changing cultural and societal norms, practices, or major societal events and movements (Stewart & Healy, 1989; Twenge, 2000). For example, economic, wartime, or considerable social changes occurring in Germany over the past century might be associated with younger cohorts being more optimistic as these conditions improve on average. Older adults might increase in optimism because recent conditions are an improvement compared to the context in which they grew up. Of course, this explanation is a speculative one—there have been no studies dedicated to the examination of, and explanation of cohort differences in optimism. The debate about cohort versus developmental effects is hotly debated in the field of personality development (Roberts et al., 2010; Trzesniewski et al., 2008; Twenge et al., 2008; Wetzel et al., 2017). Recent theorizing about age, cohort, and period effects in psychological characteristics can provide a useful framework for thinking about how and why the development of optimism and pessimism might vary across cultures and settings (Drewelies et al., 2019; Yang & Land, 2013). Future research can design studies that make it possible to examine how context affects the development of optimism or how heterogeneous these effects might be across samples and subsamples (Schwaba et al., 2019).
Life Events and the Development of Optimism and Pessimism
One mechanism that has been proposed for why psychological characteristics change across the lifespan is the onset of life events. If people experience an ostensibly positive event (or perceive an event to be positive), optimism might increase and pessimism might decrease as a result. We found some support for this idea—optimism increased after moving in with a partner in one sample, increased with improvements in subjective health in another sample, and declined with the onset of chronic illnesses in another. In this way, optimism often increased when ostensibly positive events occurred. However, we did not find consistent effects across the samples—and optimism/pessimism sometimes changed in counterintuitive ways—so we hesitate making a definitive statement about whether life events exert a considerable influence on changes in optimism and pessimism.
Why were life events inconsistent predictors optimism and pessimism over time? There are a number of reasons why life events might not be consistently related to optimism and pessimism. The first reason pertains to the measurement and conceptualization of life events. First, the measurement of life events was restricted to a number of events that were coded as either happening or not. This is a limitation because recent research has proposed a taxonomy suggesting that life events differ on a number of qualitative dimensions. Specifically, Luhmann et al. (2019) posit that life events differ on at least nine characteristics. For example, life events might be conceptualized as being either good or bad, emotionally significant or not, driving changes in worldviews or not, and under a person’s control or not (among other characteristics). Unfortunately, we had only the yes/no occurrence of these life events and not accompanying information on how individuals’ interpreted them. This is particularly important given that optimists often differ from pessimists in their attribution of the controllability of life events and how positively they evaluate life events (Carver et al., 2010; Peterson, 2000; Scheier et al., 1994). This brings us to the second reason why having qualitative information about the life events from a participants’ perspective is clearly valuable. Life events are not universally experienced as good or bad by everyone within a sample. For example, Schwaba et al. (2019) used a more focused summed measure of life events that distinguished between positive and negative life events from a participant’s perspective. In our study, we did have a few of the same life events as Schwaba et al. (2019), but many of our life events were of ambiguous valence. The lack of context and evaluative components from participants makes it difficult to know exactly how participants experienced a life event. All told, when examining the raw impact of life events in the absence of such qualitative information, life events were not consistently related to optimism development, which is consistent with other research finding inconsistent effects of life events on changes in psychological characteristics (Bleidorn et al., 2016; Specht et al., 2011).
Limitations and Future Directions
Our current approach had many strengths. We used three large panel studies from three different countries to examine changes in optimism/pessimism across the lifespan and how optimism/pessimism changed in response to life events. Nevertheless, it is important to acknowledge the limitations of our approach and findings as well. Here, we focus specifically on the measurement of optimism, pessimism, and life events.
First, we set out and pre-registered an examination of how optimism changed over time and how this change was affected by life events. However, in doing our initial measurement evaluation, we found that the LOT-R measure could be better conceptualized as measuring both optimism and pessimism. As previously discussed, there is some confusion over whether the LOT-R is indeed measuring separate constructs of optimism and pessimism (Creed et al., 2002; Steca et al., 2015). Worth noting, there is some evidence to suggest that optimism and pessimism are separable and each have their own heritable components (Chopik et al., 2020; Plomin et al., 1992). However, evidence also suggests that their separability may be attributable to response styles and positively and negatively worded items (that we ostensibly considered to be optimism and pessimism, respectively) rather than being separate constructs (Alessandri et al., 2010). Indeed, it is hard to think about what the “opposite” ends of optimism and pessimism are without invoking descriptors resembling pessimism and optimism, respectively. Such an observation is consistent with the fact that optimism and pessimism are moderately correlated in the LISS (rs > |.34|) and HRS (rs > |.24|). The fact that model fit was poor when considering optimism as a single factor led to the awkward examination and reporting of optimism and pessimism as separate factors. This added a bit of complexity to the paper as it was unclear whether discrepancies in the results for optimism and pessimism within a sample reflected substantive differences between two different constructs or differences that emerged by chance when we split an already short scale into shorter components. Some of the effects of optimism and pessimism reproduced each other (in the case of HRS) but many did not. A thorough examination of the measurement properties of the LOT-R is beyond the scope of the current paper; we elected to model them separately based on guidance from our CFA analyses. Future research can more thoroughly model changes in optimism (and/or pessimism) while considering this methodological issue of the LOT-R, and by examining heterogeneity of results across different optimism inventories (e.g., Hale et al., 1992; Schulman et al., 1989; Schweizer & Koch, 2001).
Second, as already mentioned, the assessment of life events was relatively superficial and narrow in its conceptualization. Future research can examine the characteristics and properties of life events to examine how they affect changes in optimism and pessimism across the lifespan (Luhmann et al., 2019; Schwaba et al., 2019). In examining how life events were associated with the intercepts of optimism/pessimism, we attempted to examine and control for how optimism/pessimism were associated with the onset of various life events. However, this approach is limited because several other characteristics on which participants vary might predict both optimism/pessimism and the occurrence of a life event. Thus, people who experience, versus do not experience, a life event might not be equivalent on psychological and demographic characteristics. One solution to equate these two groups would be to use propensity score matching, which has been used in studies of lifespan development and life events (Buecker et al., 2019; Jackson et al., 2012; Schwaba & Bleidorn, 2019). However, given the limitations of propensity scores, and the uncertainty of our ability to match people prior to actually looking at the data (and the effort it would take to match participants across all the life events), we did not formally pre-register these hypotheses and adopt this approach (Nuttall & Houle, 2008; Streiner & Norman, 2012). However, future research can more deliberately match participants who do and do not experience life events or examine twins who are discrepant on life event experiences so that the causal influence of life events on optimism changes is more clearly estimated (Kandler et al., 2012).
Third, we only looked at the onset of each life event as occurring once over the course of the study (e.g., getting married over the course of the study) rather than sequential or multiple life events (e.g., getting married or divorced twice during follow-up). Previous research has found both selection and socialization effects of life satisfaction and the experience of multiple life events (Luhmann & Eid, 2009). For example, people experience greater declines in life satisfaction if they experience multiple bouts of unemployment, and lower levels of life satisfaction often predict the onset of multiple life events. In the current paper, we found few selection and socialization effects when examining whether life events affected optimism and pessimism. However, future research can examine whether repeated life events, or clusters of events, are associated with optimism and pessimism over time.
Statement on Limitations on Generality
Although these data come from different cultures, we did not expect the findings to differ across the three samples. However, we observed significant heterogeneity across the samples. Such differences in lifespan developmental trajectories across ostensibly similar cultures is not unprecedented (Donnellan & Lucas, 2008). Worth noting, the results can only be interpreted in the context of these particular countries, historical periods of data collection, and the measures/analyses applied here. Nevertheless, we think our findings would be similar in any future replication attempts. Specifically, there is likely heterogeneity in findings with respect to developmental trends (Leahy et al., 2020) and the influence of life events on development (Bleidorn et al., 2016). In this way, our current studies are as limited by generalizability as other secondary data analysis projects.
Conclusion
We examined changes in optimism and pessimism across the lifespan, and how life events predicted these changes, in three large panel studies of adults. In two samples, optimism was lower among younger-adults, higher among middle-aged adults, and lower among older-adults. Patterns of age differences in mean-level change supported this developmental trajectory. However, there was some heterogeneity in these findings as they were not observed in the other data set (i.e., G-SOEP). Life events were inconsistently related to optimism/pessimism. Future research should more carefully conceptualize life events to characterize their role in the development of psychological characteristics across the lifespan.
Supplementary Material
Acknowledgments
This research was supported by grants from the National Institute of Aging (2 R03 AG054705-01A1) and the Templeton Foundation’s Pathways to Character Initiative. This work was pre-registered using the secondary data analysis pre-registration form. WJC conceptualized the study; JO and WJC performed data preparation/analysis, and wrote the report. ESK, TS, MDK, DR, and JS aided in data preparation/analysis and provided crucial comments during the writing process.
Footnotes
Publisher's Disclaimer: This is a PDF file of an unedited manuscript that has been accepted for publication. As a service to our customers we are providing this early version of the manuscript. The manuscript will undergo copyediting, typesetting, and review of the resulting proof before it is published in its final form. Please note that during the production process errors may be discovered which could affect the content, and all legal disclaimers that apply to the journal pertain.
We did not formally distinguish between “positive” and “negative” life events (which has occasionally been done in previous research) because some events may be ambiguous in nature (Schwaba et al., 2019; Specht et al., 2011). For example, a divorce for some individuals could be a welcomed reprieve from a bad relationship. For others, a divorce could be viewed as a personal or relational failure. Indeed, previous research has noted that—and thus often excludes—many events that have ambiguous valence (e.g., retirement, children leaving home; Specht et al., 2011). Instead, we focused our current report on examining how particular life events affect changes in optimism rather than imposing an arbitrary assessment of what we would consider a “positive” and “negative” event for individuals.
The data for the 2019 wave of LISS became available after the review process but prior to our analysis. In the interest of including as much data as possible we elected to include these data, although we acknowledge that the addition of the 2019 data is a departure from our pre-registration.
The single-item optimism measure in the G-SOEP is face valid, but we acknowledge the limitation of using a single-item measure. Our hope is that the use of three studies will provide comprehensive replications using both the ideal and short-form measures of optimism. To assess whether the single-item measure sufficiently overlapped with the longer measure, we collected data from 208 participants from MTurk who filled out the LOT-R (α = .91) and the single-item G-SOEP measure (Mage = 35.75, SD = 11.26; 62.4% Female; 73.1% White). We found that the two measures were highly correlated in this sample (r = .74, p < .001), suggesting that they likely both tap into optimism.
Other analytic models can examine the effects of life events on the development of psychological characteristics. One approach might be to model optimism and life event changes by capitalizing on the within-person variability that occurs when people experience multiple life events within a study period (Laurenceau & Bolger, 2005). Such an approach could examine time-specific effects of life events on optimism. We elected to use a growth curve approach given that many life events (e.g., first job) only occur once or rarely occur twice (e.g., retirement). Further, having several assessment points and sufficient variability in life events would be needed to appropriately model such changes and such data were not readily available.
We ran into convergence issues in our LISS life event models that attempted to predict the quadratic effects of optimism and pessimism. In a departure from our pre-registration, we excluded the predictors of gender, age2, and education for the quadratic slope (βs < |.07|, ps > .19), and the model successfully converged. To maintain consistency across the analyses, we retained these parameters when predicting the intercept and linear slope of optimism/pessimism in LISS.
Contributor Information
William J. Chopik, Michigan State University
Eric S. Kim, University of British Columbia
Ted Schwaba, University of California, Davis.
Michael D. Krämer, German Institute for Economic Research, Freie Universität Berlin
Jacqui Smith, University of Michigan.
References
- Abraham WT (2007). Dispositional optimism and pessimism: Stability, change, and adaptive recovery following life event experiences. Retrospective Theses and Dissertations, 15625 http://lib.dr.iastate.edu/rtd/15625 [Google Scholar]
- Alessandri G, Vecchione M, Fagnani C, Bentler PM, Barbaranelli C, Medda E, Nistico L, Stazi MA, & Caprara GV (2010). Much more than model fitting? Evidence for the heritability of method effect associated with positively worded items of the Life Orientation Test Revised. Structural Equation Modeling, 17(4), 642–653. [Google Scholar]
- Assad KK, Donnellan MB, & Conger RD (2007). Optimism: An enduring resource for romantic relationships. Journal of Personality and Social Psychology, 93(2), 285. [DOI] [PubMed] [Google Scholar]
- Baltes PB, & Baltes MM (1990). Psychological perspectives on successful aging: The model of selective optimization with compensation In Baltes PB & Baltes MM (Eds.), Successful aging: Perspectives from the behavioral sciences (pp. 1–34). Cambridge University Press. [Google Scholar]
- Bleidorn W, Hopwood CJ, & Lucas RE (2016). Life events and personality trait change. Journal of Personality. [DOI] [PubMed] [Google Scholar]
- Bleidorn W, Klimstra TA, Denissen JJA, Rentfrow PJ, Potter J, & Gosling SD (2013). Personality maturation around the world: A cross-cultural examination of social-investment theory. Psychological Science, 24(12), 2530–2540. 10.1177/0956797613498396 [DOI] [PubMed] [Google Scholar]
- Boehm JK, Chen Y, Koga H, Mathur MB, Vie LL, & Kubzansky LD (2018). Is Optimism Associated With Healthier Cardiovascular-Related Behavior?: Meta-Analyses of 3 Health Behaviors. Circulation research, 122(8), 1119–1134. [DOI] [PubMed] [Google Scholar]
- Brunwasser SM, Gillham JE, & Kim ES (2009). A meta-analytic review of the Penn Resiliency Program’s effect on depressive symptoms. Journal of consulting and clinical psychology, 77(6), 1042–1054. 10.1037/a0017671 [DOI] [PMC free article] [PubMed] [Google Scholar]
- Buecker S, Denissen JJA, & luhmann M (2019). A propensity-score matched study of changes in loneliness surrounding major life events. Unpublished Manuscript. https://psyarxiv.com/8sbzy/ [DOI] [PubMed] [Google Scholar]
- Burns MO, & Seligman ME (1989). Explanatory style across the life span: Evidence for stability over 52 years. Journal of Personality and Social Psychology, 56(3), 471–477. 10.1037/0022-3514.56.3.471 [DOI] [PubMed] [Google Scholar]
- Carstensen LL (2006). The influence of a sense of time on human development. Science, 312(5782), 1913–1915. 10.1126/science.1127488 [DOI] [PMC free article] [PubMed] [Google Scholar]
- Carver CS, & Scheier MF (1982). Control theory: A useful conceptual framework for personality–social, clinical, and health psychology. Psychological bulletin, 92(1), 111. [PubMed] [Google Scholar]
- Carver CS, Scheier MF, & Segerstrom SC (2010). Optimism. Clinical Psychology Review, 30(7), 879–889. 10.1016/j.cpr.2010.01.006 [DOI] [PMC free article] [PubMed] [Google Scholar]
- Chang EC, D’Zurilla TJ, & Maydeu-Olivares A (1994). Assessing the dimensionality of optimism and pessimism using a multimeasure approach. Cognitive therapy and research, 18(2), 143–160. [Google Scholar]
- Charles ST (2010). Strength and Vulnerability Integration (SAVI): A model of emotional well-being across adulthood. Psychological bulletin, 136(6), 1068–1091. [DOI] [PMC free article] [PubMed] [Google Scholar]
- Cheung GW, & Rensvold RB (2002). Evaluating goodness-of-fit indexes for testing measurement invariance. Structural Equation Modeling, 9(2), 233–255. [Google Scholar]
- Chopik WJ (2018). Does personality change following spousal bereavement? Journal of Research in Personality, 72, 10–21. 10.1016/j.jrp.2016.08.010 [DOI] [Google Scholar]
- Chopik WJ, Kashy DA, & Oh J (2020). Individual and coordinated changes in optimism and pessimism from mid- to late life: A study of twins. Manuscript submitted for publication. [Google Scholar]
- Chopik WJ, Kim ES, & Smith J (2015). Changes in optimism are associated with changes in health among older adults. Social Psychological and Personality Science, 6, 814–822. [DOI] [PMC free article] [PubMed] [Google Scholar]
- Chopik WJ, Kim ES, & Smith J (2018). An examination of dyadic changes in optimism and physical health over time. Health Psychology, 37, 42–50. [DOI] [PMC free article] [PubMed] [Google Scholar]
- Chopik WJ, & Kitayama S (2018). Personality change across the life span: Insights from a cross-cultural, longitudinal study. Journal of Personality, 86(3), 508–521. [DOI] [PMC free article] [PubMed] [Google Scholar]
- Creed PA, Patton W, & Bartrum D (2002). Multidimensional Properties of the Lot-R: Effects of Optimism and Pessimism on Career and Well-Being Related Variables in Adolescents. Journal of Career Assessment, 10(1), 42–61. 10.1177/1069072702010001003 [DOI] [Google Scholar]
- Deci EL, & Ryan RM (2000). The ‘what’ and ‘why’ of goal pursuits: Human needs and the self-determination of behavior. Psychological Inquiry, 11(4), 227–268. 10.1207/s15327965pli1104_01 [DOI] [Google Scholar]
- DeYoung CG (2015). Cybernetic big five theory. Journal of Research in Personality, 56, 33–58. [Google Scholar]
- Donnellan MB, & Lucas RE (2008). Age differences in the big five across the life span: Evidence from two national samples. Psychol Aging, 23(3), 558–566. 10.1037/a0012897 [DOI] [PMC free article] [PubMed] [Google Scholar]
- Drewelies J, Huxhold O, & Gerstorf D (2019). The role of historical change for adult development and aging: Towards a theoretical framework about the how and the why. Psychol Aging, 34(8), 1021–1039. 10.1037/pag0000423 [DOI] [PubMed] [Google Scholar]
- Forgeard MJC, & Seligman MEP (2012). Seeing the glass half full: A review of the causes and consequences of optimism. Pratiques Psychologiques, 18(2), 107–120. [Google Scholar]
- Fraley RC, & Roberts BW (2005). Patterns of continuity: A dynamic model for conceptualizing the stability of individual differences in psychological constructs across the life course. Psychol Rev, 112(1), 60–74. 10.1037/0033-295x.112.1.60 [DOI] [PubMed] [Google Scholar]
- Freund AM, Napolitano CM, & Rutt JL (2018). Personality development in adulthood: A goal perspective In McAdams DP, SHiner RL, & Tackett JL (Eds.), Handbook of personality development (pp. 313–327). The Guilford Press. [Google Scholar]
- Gawronski KAB, Kim ES, Langa KM, & Kubzansky LD (2016). Dispositional optimism and incidence of cognitive impairment in older adults. Psychosom Med, 78(7), 819–828. 10.1097/PSY.0000000000000345 [DOI] [PMC free article] [PubMed] [Google Scholar]
- Gerstorf D, Ram N, Estabrook R, Schupp J, Wagner GG, & Lindenberger U (2008). Life satisfaction shows terminal decline in old age: Longitudinal evidence from the German Socio-Economic Panel Study (SOEP). Developmental Psychology, 44(4), 1148–1159. 10.1037/0012-1649.44.4.1148 [DOI] [PMC free article] [PubMed] [Google Scholar]
- Gerstorf D, Ram N, Mayraz G, Hidajat M, Lindenberger U, Wagner GG, & Schupp J (2010). Late-Life Decline in Well-Being Across Adulthood in Germany, the UK, and the US: Something is Seriously Wrong at the End of Life. Psychol Aging, 25(2), 477–485. 10.1037/a0017543 [DOI] [PMC free article] [PubMed] [Google Scholar]
- Gerstorf D, Ram N, Röcke C, Lindenberger U, & Smith J (2008). Decline in life satisfaction in old age: Longitudinal evidence for links to distance-to-death. Psychol Aging, 23(1), 154–168. 10.1037/0882-7974.23.1.154 [DOI] [PMC free article] [PubMed] [Google Scholar]
- Gillham JE, Shatté AJ, Reivich KJ, & Seligman ME (2001). Optimism, pessimism, and explanatory style In Chang EC (Ed.), Optimism and pessimism: Implications for theory, research, and practice (pp. 53–75). American Psychological Association. [Google Scholar]
- Hale WD, Fiedler LR, & Cochran CD (1992). The revised Generalized Expectancy for Success Scale: A validity and reliability study. Journal of Clinical Psychology, 48(4), 517–521. [DOI] [PubMed] [Google Scholar]
- Hanssen MM, Peters ML, Vlaeyen JWS, Meevissen YMC, & Vancleef LMG (2013). Optimism lowers pain: Evidence of the causal status and underlying mechanisms. Pain, 154(1), 53–58. 10.1016/j.pain.2012.08.006 [DOI] [PubMed] [Google Scholar]
- Heinonen K, Räikkönen K, & Keltikangas-Järvinen L (2005). Dispositional optimism: Development over 21 years from the perspectives of perceived temperament and mothering. Personality and Individual Differences, 38(2), 425–435. 10.1016/j.paid.2004.04.020 [DOI] [Google Scholar]
- Hu L. t., & Bentler PM (1999). Cutoff criteria for fit indexes in covariance structure analysis: Conventional criteria versus new alternatives. Structural Equation Modeling: A Multidisciplinary Journal, 6(1), 1–55. 10.1080/10705519909540118 [DOI] [Google Scholar]
- Hudson NW, Briley DA, Chopik WJ, & Derringer J (2018). You have to follow through: Attaining behavioral change goals predicts volitional personality change. Journal of Personality and Social Psychology. [DOI] [PubMed] [Google Scholar]
- Isaacowitz DM (2005). Correlates of well-being in adulthood and old age: A tale of two optimisms. Journal of Research in Personality, 39(2), 224–244. [Google Scholar]
- Jackson JJ, Thoemmes F, Jonkmann K, Ludtke O, & Trautwein U (2012). Military training and personality trait development: Does the military make the man, or does the man make the military? Psychological Science, 23(3), 270–277. 10.1177/0956797611423545 [DOI] [PubMed] [Google Scholar]
- Kandler C, Bleidorn W, Riemann R, Angleitner A, & Spinath FM (2012). Life events as environmental states and genetic traits and the role of personality: A longitudinal twin study [journal article]. Behavior genetics, 42(1), 57–72. 10.1007/s10519-011-9491-0 [DOI] [PubMed] [Google Scholar]
- Kim ES, Hagan KA, Grodstein F, DeMeo DL, De Vivo I, & Kubzansky LD (2017). Optimism and Cause-Specific Mortality: A Prospective Cohort Study. American Journal of Epidemiology, 185(1), 21–29. 10.1093/aje/kww182 [DOI] [PMC free article] [PubMed] [Google Scholar]
- Kim ES, Park N, & Peterson C (2011). Dispositional optimism protects older adults from stroke: the Health and Retirement Study. Stroke, 42(10), 2855–2859. 10.1161/strokeaha.111.613448 [DOI] [PubMed] [Google Scholar]
- Kim ES, Smith J, & Kubzansky LD (2014). A prospective study of the association between dispositional optimism and incident heart failure. Circulation: Heart Failure. 10.1161/circheartfailure.113.000644 [DOI] [PMC free article] [PubMed] [Google Scholar]
- Kline RB (2015). Principles and practice of structural equation modeling. Guilford. [Google Scholar]
- Kubzansky LD, Sparrow D, Vokonas P, & Kawachi I (2001). Is the glass half empty or half full? A prospective study of optimism and coronary heart disease in the normative aging study. Psychosom Med, 63(6), 910–916. [DOI] [PubMed] [Google Scholar]
- Laurenceau J-P, & Bolger N (2005). Using Diary Methods to Study Marital and Family Processes. Journal of Family Psychology, 19(1), 86–97. 10.1037/0893-3200.19.1.86 [DOI] [PubMed] [Google Scholar]
- Leahy KE, Chopik WJ, Nye CD, & Donnellan MB (2020). Heterogeneity in age differences in big five personality traits across the lifespan. Manuscript in preparation. [Google Scholar]
- Lennings CJ (2000). Optimism, Satisfaction and Time Perspective in the Elderly. The International Journal of Aging and Human Development, 51(3), 167–181. 10.2190/06gk-wher-37xc-btry [DOI] [PubMed] [Google Scholar]
- Lucas RE, & Donnellan MB (2011). Personality development across the life span: Longitudinal analyses with a national sample from Germany. Journal of Personality and Social Psychology, 101(4), 847–861. 10.1037/a0024298 [DOI] [PubMed] [Google Scholar]
- Lüdtke O, Roberts BW, Trautwein U, & Nagy G (2011). A random walk down university avenue: life paths, life events, and personality trait change at the transition to university life. Journal of Personality and Social Psychology, 101(3), 620–637. 10.1037/a0023743 [DOI] [PMC free article] [PubMed] [Google Scholar]
- Luhmann M, & Eid M (2009). Does it really feel the same? Changes in life satisfaction following repeated life events. Journal of Personality and Social Psychology, 97(2), 363–381. 10.1037/a0015809 [DOI] [PubMed] [Google Scholar]
- Luhmann M, Fassbender I, & Alcock M (2019). A dimensional taxonomy of characteristics of major life events. Manuscript submitted for publication. [DOI] [PubMed] [Google Scholar]
- Malouff JM, & Schutte NS (2017). Can psychological interventions increase optimism? A meta-analysis. The Journal of Positive Psychology, 12(6), 594–604. [Google Scholar]
- Marshall GN, Wortman CB, Kusulas JW, Hervig LK, & Vickers RR Jr (1992). Distinguishing optimism from pessimism: Relations to fundamental dimensions of mood and personality. Journal of Personality and Social Psychology, 62(6), 1067. [Google Scholar]
- Meevissen YMC, Peters ML, & Alberts HJEM (2011). Become more optimistic by imagining a best possible self: Effects of a two week intervention. Journal of Behavior Therapy and Experimental Psychiatry, 42(3), 371–378. 10.1016/j.jbtep.2011.02.012 [DOI] [PubMed] [Google Scholar]
- Mroczek DK, Spiro A, Aldwin CM, Ozer DJ, & Bossé R (1993). Construct validation of optimism and pessimism in older men: Findings from the normative aging study. Health Psychology, 12(5), 406. [DOI] [PubMed] [Google Scholar]
- Muthén LK, & Muthén BO (2017). MPlus version 8 user’s guide. Muthen & Muthen. [Google Scholar]
- Nabi H, Koskenvuo M, Singh-Manoux A, Korkeila J, Suominen S, Korkeila K, Vahtera J, & Kivimäki M (2010). Low pessimism protects against stroke: the Health and Social Support (HeSSup) prospective cohort study. Stroke, 41(1), 187–190. 10.1161/STROKEAHA.109.565440 [DOI] [PMC free article] [PubMed] [Google Scholar]
- Nes LS, & Segerstrom SC (2006). Dispositional optimism and coping: A meta-analytic review. Personality and social psychology review, 10(3), 235–251. 10.1207/s15327957pspr1003_3 [DOI] [PubMed] [Google Scholar]
- Nuttall Gregory A., & Houle Timothy T. (2008). Liars, Damn Liars, and Propensity Scores. Anesthesiology: The Journal of the American Society of Anesthesiologists, 108(1), 3–4. 10.1097/01.anes.0000296718.35703.20 [DOI] [PubMed] [Google Scholar]
- Peters ML, Flink IK, Boersma K, & Linton SJ (2010). Manipulating optimism: Can imagining a best possible self be used to increase positive future expectancies? The Journal of Positive Psychology, 5(3), 204–211. 10.1080/17439761003790963 [DOI] [Google Scholar]
- Peterson C (2000). The future of optimism. American Psychologist, 55(1), 44–55. 10.1037/0003-066X.55.1.44 [DOI] [PubMed] [Google Scholar]
- Peterson C, Park N, & Kim ES (2012). Can optimism decrease the risk of illness and disease among the elderly? Aging Health, 8(1), 5–8. 10.2217/ahe.11.81 [DOI] [Google Scholar]
- Peterson C, Semmel A, von Baeyer C, Abramson LY, Metalsky GI, & Seligman MEP (1982). The Attributional Style Questionnaire [journal article]. Cognitive therapy and research, 6(3), 287–299. 10.1007/bf01173577 [DOI] [Google Scholar]
- Plomin R, Scheier MF, Bergeman CS, & Pedersen NL (1992). Optimism, pessimism and mental health: A twin/adoption analysis. Personality and Individual Differences, 13(8), 921–930. 10.1016/0191-8869(92)90009-e [DOI] [Google Scholar]
- Puri M, & Robinson DT (2007). Optimism and economic choice. Journal of Financial Economics, 86(1), 71–99. [Google Scholar]
- Reed AE, & Carstensen LL (2012). The theory behind the age-related positivity effect. Frontiers in psychology, 3 10.3389/fpsyg.2012.00339 [DOI] [PMC free article] [PubMed] [Google Scholar]
- Richter D, & Kunzmann U (2011). Age differences in three facets of empathy: Performance-based evidence. Psychol Aging, 26(1), 60. [DOI] [PubMed] [Google Scholar]
- Roberts BW, Edmonds G, & Grijalva E (2010). It is developmental me, not generation me: Developmental changes are more important than generational changes in narcissism—Commentary on Trzesniewski & Donnellan (2010). Perspectives on Psychological Science, 5(1), 97–102. 10.1177/1745691609357019 [DOI] [PMC free article] [PubMed] [Google Scholar]
- Roberts BW, Wood D, & Smith JL (2005). Evaluating Five Factor Theory and social investment perspectives on personality trait development. Journal of Research in Personality, 39(1), 166–184. 10.1016/j.jrp.2004.08.002 [DOI] [Google Scholar]
- Roy B, Diez-Roux AV, Seeman T, Ranjit N, Shea S, & Cushman M (2010). Association of optimism and pessimism with inflammation and hemostasis in the Multi-Ethnic Study of Atherosclerosis (MESA). Psychosom Med, 72(2), 134–140. 10.1097/PSY.0b013e3181cb981b [DOI] [PMC free article] [PubMed] [Google Scholar]
- Ryan RM, & Deci EL (2000). Self-determination theory and the facilitation of intrinsic motivation, social development, and well-being. American Psychologist, 55(1), 68–78. [DOI] [PubMed] [Google Scholar]
- Scheier MF, & Carver CS (2018). Dispositional optimism and physical health: A long look back, a quick look forward. American Psychologist, 73(9), 1082–1094. 10.1037/amp0000384 [DOI] [PMC free article] [PubMed] [Google Scholar]
- Scheier MF, Carver CS, & Bridges MW (1994). Distinguishing optimism from neuroticism (and trait anxiety, self-mastery, and self-esteem): A reevaluation of the Life Orientation Test. Journal of Personality and Social Psychology, 67(6), 1063–1078. 10.1037/0022-3514.67.6.1063 [DOI] [PubMed] [Google Scholar]
- Schou I, Ekeberg Ø, Sandvik L, & Ruland CM (2005). Stability in Optimism-Pessimism in Relation to Bad News: A Study of Women With Breast Cancer. Journal of personality assessment, 84(2), 148–154. 10.1207/s15327752jpa8402_04 [DOI] [PubMed] [Google Scholar]
- Schulman P, Castellon C, & Seligman ME (1989). Assessing explanatory style: the content analysis of verbatim explanations and the Attributional Style Questionnaire. Behav Res Ther, 27(5), 505–512. 10.1016/0005-7967(89)90084-3 [DOI] [PubMed] [Google Scholar]
- Schwaba T, & Bleidorn W (2019). Personality trait development across the transition to retirement. Journal of Personality and Social Psychology, 116(4), 651–665. 10.1037/pspp0000179 [DOI] [PubMed] [Google Scholar]
- Schwaba T, Robins RW, Sanghavi PH, & Bleidorn W (2019). Optimism development across adulthood and associations with positive and negative life events. Social Psychological and Personality Science. [Google Scholar]
- Schweizer K, & Koch W (2001). The assessment of components of optimism by POSO-E. Personality and Individual Differences, 31(4), 563–574. 10.1016/S0191-8869(00)00161-6 [DOI] [Google Scholar]
- Segerstrom SC (2007). Optimism and resources: Effects on each other and on health over 10 years. Journal of Research in Personality, 41(4), 772–786. 10.1016/j.jrp.2006.09.004 [DOI] [PMC free article] [PubMed] [Google Scholar]
- Serlachius A, Pulkki-Råback L, Elovainio M, Hintsanen M, Mikkilä V, Laitinen TT, Jokela M, Rosenström T, Josefsson K, & Juonala M (2015). Is dispositional optimism or dispositional pessimism predictive of ideal cardiovascular health? The Young Finns Study. Psychology & health, 30(10), 1221–1239. [DOI] [PubMed] [Google Scholar]
- Specht J, Egloff B, & Schmukle SC (2011). Stability and change of personality across the life course: The impact of age and major life events on mean-level and rank-order stability of the Big Five. Journal of Personality and Social Psychology, 101(4), 862–882. 10.1037/a0024950 [DOI] [PubMed] [Google Scholar]
- Srivastava S, McGonigal KM, Richards JM, Butler EA, & Gross JJ (2006). Optimism in close relationships: How seeing things in a positive light makes them so. Journal of Personality and Social Psychology, 91(1), 143–153. 10.1037/0022-3514.91.1.143 [DOI] [PubMed] [Google Scholar]
- Stanton AL, & Snider PR (1993). Coping with a breast cancer diagnosis: A prospective study. Health Psychology, 12(1), 16–23. 10.1037/0278-6133.12.1.16 [DOI] [PubMed] [Google Scholar]
- Steca P, Monzani D, Greco A, Chiesi F, & Primi C (2015). Item response theory analysis of the life orientation test-revised: age and gender differential item functioning analyses. Assessment, 22(3), 341–350. [DOI] [PubMed] [Google Scholar]
- Stewart AJ, & Healy JM (1989). Linking individual development and social changes. American Psychologist, 44(1), 30–42. 10.1037/0003-066x.44.1.30 [DOI] [Google Scholar]
- Stiegelis HE, Hagedoorn M, Sander-man R, van der Zee KI, Buunk BP, & van den Bergh ACM (2003). Cognitive adaptation: A comparison of cancer patients and healthy references. British Journal of Health Psychology, 8(3), 303–318. 10.1348/135910703322370879 [DOI] [PubMed] [Google Scholar]
- Streiner DL, & Norman GR (2012). The Pros and Cons of Propensity Scores. CHEST, 142(6), 1380–1382. 10.1378/chest.12-1920 [DOI] [PubMed] [Google Scholar]
- Sweeny K, & Krizan Z (2013). Sobering up: A quantitative review of temporal declines in expectations. Psychological bulletin, 139(3), 702–724. 10.1037/a0029951 [DOI] [PubMed] [Google Scholar]
- Terracciano A (2014). Pregnancy, Marriage, and Quitting School Nurture Personality Development? Commentary on Bleidorn, Klimstra, Denissen, Rentfrow, Potter, and Gosling (2013). Psychological Science, 25(4), 1049–1050. 10.1177/0956797613515003 [DOI] [PubMed] [Google Scholar]
- Tindle HA, Chang YF, Kuller LH, Manson JE, Robinson JG, Rosal MC, Siegle GJ, & Matthews KA (2009). Optimism, cynical hostility, and incident coronary heart disease and mortality in the Women’s Health Initiative. Circulation, 120(8), 656–662. 10.1161/circulationaha.108.827642 [DOI] [PMC free article] [PubMed] [Google Scholar]
- Trzesniewski KH, Donnellan MB, & Robins RW (2008). Do today’s young people really think they are so extraordinary?: An examination of secular trends in narcissism and self-enhancement. Psychological Science, 19(2), 181–188. 10.1111/j.1467-9280.2008.02065.x [DOI] [PubMed] [Google Scholar]
- Twenge JM (2000). The age of anxiety? The birth cohort change in anxiety and neuroticism, 1952–1993. Journal of Personality and Social Psychology, 79(6), 1007–1021. 10.1037/0022-3514.79.6.1007 [DOI] [PubMed] [Google Scholar]
- Twenge JM, Konrath SH, Foster JD, Campbell WK, & Bushman BJ (2008). Egos inflating over time: A cross-temporal meta-analysis of the Narcissistic Personality Inventory. Journal of Personality, 76(4), 875–902. 10.1111/j.1467-6494.2008.00507.x [DOI] [PubMed] [Google Scholar]
- Wetzel E, Brown A, Hill PL, Chung JM, Robins RW, & Roberts BW (2017). The narcissism epidemic is dead; long live the narcissism epidemic. Psychological Science, 28(12), 1833–1847. 10.1177/0956797617724208 [DOI] [PubMed] [Google Scholar]
- Yang Y, & Land KC (2013). Age-period-cohort analysis: New models, methods, and empirical applications. CRC Press. [Google Scholar]
- Yong AG, & Pearce S (2013). A beginner’s guide to factor analysis: Focusing on exploratory factor analysis. Tutorials in quantitative methods for psychology, 9(2), 79–94. [Google Scholar]
- You J, Fung HHL, & Isaacowitz DM (2009). Age differences in dispositional optimism: a cross-cultural study. Eur J Ageing, 6(4), 247 10.1007/s10433-009-0130-z [DOI] [PMC free article] [PubMed] [Google Scholar]
Associated Data
This section collects any data citations, data availability statements, or supplementary materials included in this article.