Abstract
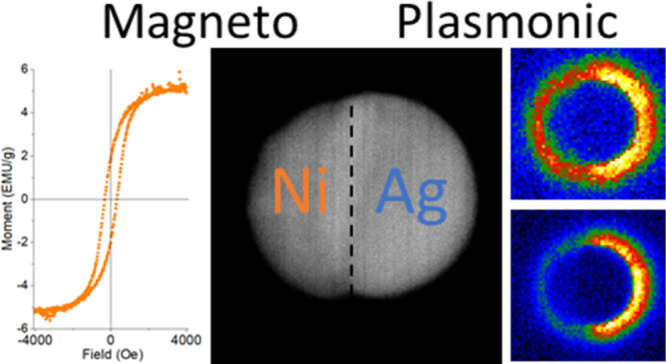
Pulsed laser-induced dewetting (PLiD) of Ag0.5Ni0.5 thin films results in phase-separated bimetallic nanoparticles with size distributions that depend on the initial thin film thickness. Co-sputtering of Ag and Ni is used to generate the as-deposited (AD) nanogranular supersaturated thin films. The magnetic and optical properties of the AD thin films and PLiD nanoparticles are characterized using a vibrating sample magnetometer, optical absorption spectroscopy, and electron energy loss spectroscopy (EELS). Magnetic measurements demonstrate that Ag0.5Ni0.5 nanoparticles are ferromagnetic at room temperature when the nanoparticle diameters are >20 nm and superparamagnetic <20 nm. Optical measurements show that all nanoparticle size distributions possess a local surface plasmon resonance (LSPR) peak that red-shifts with increasing diameter. Following PLiD, a Janus nanoparticle morphology is observed in scanning transmission electron microscopy, and low-loss EELS reveals size-dependent Ag and Ni LSPR dipole modes, while higher order modes appear only in the Ag hemisphere. PLiD of Ag–Ni thin films is shown to be a viable technique to generate bimetallic nanoparticles with both magnetic and plasmonic functionality.
1. Introduction
Nanoparticles possessing magneto-plasmonic bifunctionality have recently emerged as an innovative tool in biomedicine. Magnetic nanoparticles can be used to guide drug delivery, provide contrast in magnetic imaging, and generate heat via an alternating magnetic field,1,2 while plasmonic particles are used for optical imaging, sensing, and drug delivery.3 These two properties can be combined for specific applications utilizing bifunctional magneto-plasmonic nanoparticles, including magnetic resonance imaging,4 magnetic hyperthermia therapy,5 and detection of tumor cells.6,7
Chemical growth techniques1 are most commonly utilized for fabricating magneto-plasmonic nanoparticles; however, another highly robust technique exists: pulsed laser-induced dewetting (PLiD).8−11 PLiD exploits the inherent metastability of a metallic thin film on a substrate. Rapid heating of the thin film (typically less than 20 nm thick), via a nanosecond pulsed laser, generates a random array of spherical caps with a wetting angle dependent on substrate/film interactions. An added degree of control can be achieved by lithographically patterning the metal thin film prior to dewetting in order to design the size, spacing, and location of these nanoparticles.12−16 In lieu of lithography, the initial metal film thickness can be used to influence the resultant nanoparticle size, as thicker films yield a distribution with larger particles. While PLiD nanoparticles are typically exploited on substrates, it is envisaged that free nanoparticles can be released from the substrate via a post-etching or release process.
Nanoparticles exhibiting both plasmonic and magnetic properties have primarily been achieved using a noble metal, Au1,2,5,7 or Ag,17,18 and Fe3–xO41,2,5,7,17,18 or Co,18 respectively. While much research has been conducted on single component metal dewetting, few studies have explored multicomponent dewetting.19−24 In a multi-component system, atomic interactions between dissimilar atoms create chemical instabilities that can compete or synergize with the dynamics observed in single component dewetting. While these interactions add complexity to the nanoparticle self-assembly dynamics, the enhanced functionality, such as bifunctional magneto-plasmonic nanoparticles, has stimulated several groups to explore PLiD of both miscible25 and immiscible23,26 bimetallic systems. The overarching goal is to understand the simultaneous hydrodynamic and chemical energy landscape to create intricate nanoparticle morphologies.
The binary material system investigated here, Ag–Ni, offers significant potential for magneto-plasmonic nanoparticles via PLiD for three primary reasons. First, the individual elemental properties are compelling, with Ag exhibiting strong plasmonic properties, and Ni being a high-moment ferromagnet. Second, both Ag and Ni are biocompatible, allowing their integration into medical treatments. Finally, the thermodynamic mixing behavior of Ag and Ni is interesting in that the alloy has very limited solid solubility with a liquid miscibility gap. Immiscibility across a large temperature range is expected to facilitate the emergence of complex particle morphologies during the liquid phase dewetting process. Depending on the initial film geometry, substrate, and laser heating conditions, various particle architectures can be achieved, including Janus, core–shell, homogeneously dispersed fine grains, and variations thereof.27 Through an improved understanding of multicomponent dewetting, the size and chemical morphology can be tuned to generate specific magnetic and plasmonic properties.
Here, we sputter various thickness Ag0.5Ni0.5 thin films and expose them to 20 ns laser pulses to induce liquid-state dewetting of the films. We correlate the nanoparticle size distribution of the resultant nanoparticles to the as-deposited (AD) film thickness. We then compare the magnetic properties and optical properties of the AD thin films and the PLiD nanoparticle arrays. Finally, low-loss electron energy loss spectroscopy (EELS) for individual Ag–Ni Janus nanoparticles are measured, and the full plasmonic spectra are elucidated as a function of nanoparticle size.
2. Results and Discussion
2.1. Dewetting
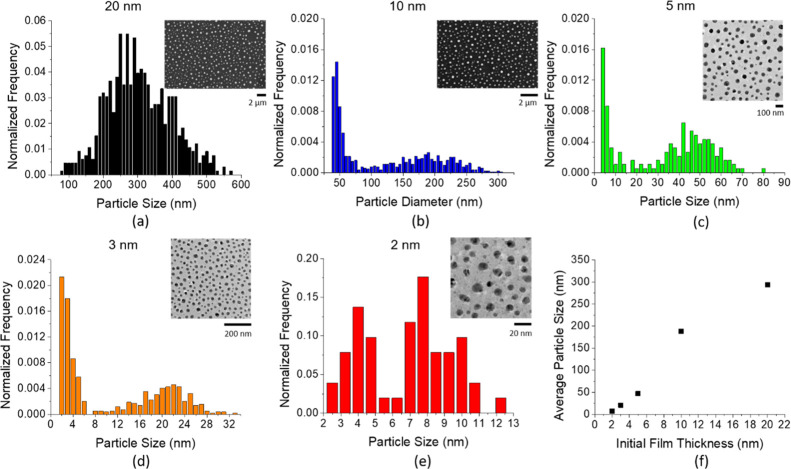
As has been shown previously,28 the AD co-sputtered Ag0.5Ni0.5 films are a nanogranular mixture of supersaturated Ag-rich and Ni-rich grains. The size distribution of the nanoparticles derived from PLiD for five initial film thicknesses is shown in Figure 1. Because of differing resolution requirements, the nanoparticles resulting from the initial film thicknesses of 20 and 10 nm were analyzed with a scanning electron microscope on bulk substrates, while the 5, 3, and 2 nm samples required transmission electron microscopy (TEM) and thus were prepared on suspended membranes. As shown in Figure 1f and as has been demonstrated in numerous materials, controlling the initial film thickness is a convenient tool to control the nanoparticle size, where thinner films produce smaller particles. Except for the 20 nm thick sample, the resultant PLiD nanoparticles exhibit a clear bimodal size distribution.
Figure 1.
(a–e) Particle size distribution of PLiD samples from the initial film thickness of 20, 10, 5, 3, and 2 nm. (f) Average particle size of the larger mode as a function of the initial film thickness.
The hydrodynamic evolution of liquid thin films has been studied in detail and is initiated by instabilities such as spinodal and homogeneous and heterogenous nucleation.8,29−33 Briefly, an instability is nucleated in the liquid film, which grows and intersects the substrate forming a hole, and a circular rim develops. The circular rims accelerate away from the hole center because of a balance of the capillary, inertial, and viscous forces. The circular rims intersect and form a web of rivulets, which subsequently break up into nanoparticles via a Rayleigh–Plateau-like instability mitigated by the substrate. The small nanoparticles typically result from satellite nanoparticles that form in long wavelength Rayleigh–Plateau instabilities.16 Auspiciously, the larger mode should dominate the behavior of nanoparticle distribution because these particles dominate the overall material mass. While multilayer immiscible thin films34 lead to interesting changes in the dewetting instability dynamics, we believe that the nanogranular mixture of supersaturated phases deposited here will obey a more rule-of-mixture during the early phase of the instability as chemical and hydrodynamic instabilities are operative. In future work we will explore this competition via both continuum and molecular dynamics approaches. For convenience in the remaining text, PLiD samples will be commonly referred to by their average sizes of the primary mode, where values 300, 180, 45, 20, and 8 nm are representative of the 20, 10, 5, 3, and 2 nm initial film thicknesses, respectively. As illustrated in the scanning TEM (STEM) image in Figure 1c,d (see the Supporting Information, Figure S1, for enlarged view), a predominantly phase-separated Ag–Ni Janus nanoparticle morphology results from the PLiD versus the nanogranular supersaturated solution of the AD thin film.
2.2. Magnetic Measurements
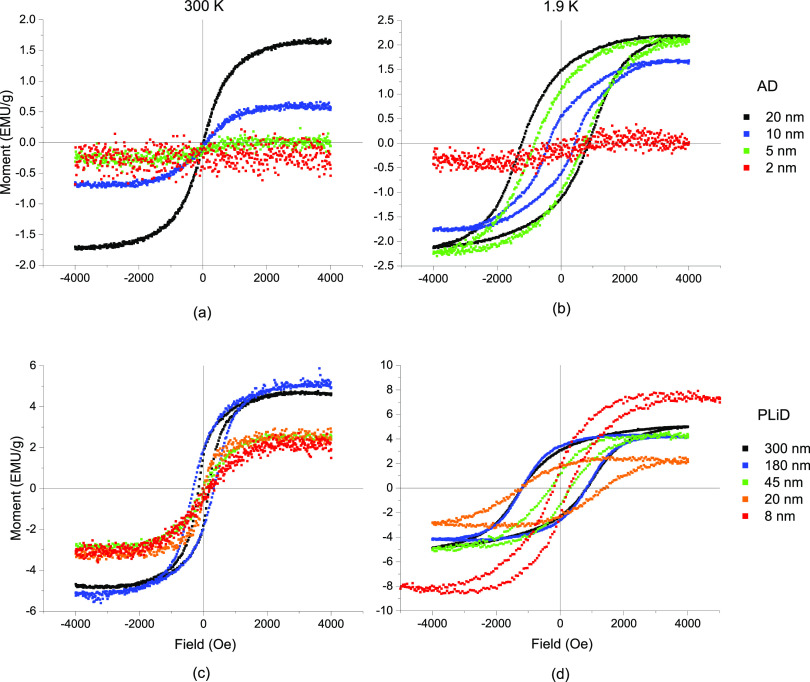
To correlate the AD nanogranular mixture of Ag-rich and Ni-rich supersaturated solutions in the AD thin films to the phase-separated PLiD nanoparticles, magnetization versus magnetic field (M–H) curves of the AD Ag0.5Ni0.5 thin films (a,b) and nanoparticles generated by PLiD (c,d) are demonstrated in Figure 2. The plots show the M–H results for thin films at 300 K (a,c) and 1.9 K (b,d). The five curves correspond to the different AD film thicknesses (a,b), which correlate to a peak in the nanoparticle size distribution (c,d), as illustrated in Figure 1.
Figure 2.
(a,b) Moment vs field plots measured at 300 and 1.9 K for the AD films and the (c,d) PLiD nanoparticles also at 300 and 1.9 K.
Excluding the 2 nm thick film, which has a signal below the noise level of the vibrating sample magnetometer, all AD films (Figure 2c) are superparamagnetic at 300 K, as indicated by the closed hysteresis loop and sigmoidal field response. At 1.9 K (Figure 2b), the AD films behave as ferromagnets, with the 2 nm film demonstrating a slight diamagnetic tilt, likely from the substrate. Thus, it can be deduced that the blocking temperature, TB, is somewhere between these two temperatures. M–H results at additional temperatures (see Figure S2 in the Supporting Information) indicate that TB is approximately 200 K for the 20 nm film, 50 K for the 10 nm film, and 1.9 K for the 5 nm film.
Another trend observed, as shown in Figure 2b–d, is the establishment of an exchange bias in the hysteresis loops, such that they are not centered about the zero field. This is most likely an indication of oxidation at the surface of the nanoparticles and the AD film, which leads to the formation of the antiferromagnetic NiO phase. While the Néel temperature of NiO is far above room temperature (525 K), the thin surface oxide does not possess sufficient anisotropy to bias the hysteresis loop and is likely below its blocking temperature as well. Upon cooling, the thermal fluctuations become suppressed, stabilizing the ordering of the antiferromagnet and establishing the exchange bias.
At 300 K, Figure 2c shows that the larger particles (180 and 300 nm) are ferromagnetic, as is evidenced by the open hysteresis loop. The behavior observed in the 45 nm particles, however, is much more subtle, as the measured coercivity is significantly reduced; the coercivity is on the order of 50 Oe (45 nm) compared to 600 Oe (180 nm) and 300 Oe (300 nm). The reduction in coercivity in the 45 nm sample is likely an indication that this particle size is near the single domain transition. For smaller particles, the reversal occurs by a coherent rotation mechanism, while larger particles reverse by a domain nucleation–propagation mechanism. There is an expected loss in coercivity as the reversal mechanism becomes coherent rotation, which is recovered in the multiple domain regime.35,36
The two smallest nanoparticle distributions are superparamagnetic at 300 K, as indicated by the sigmoidal and closed hysteresis loops. In this regime, the product of the magnetic anisotropy and magnetic volume is comparable to the thermal energy, resulting in a coherent alignment of the moments within the nanoparticle but a lack of long-term stability of their collective orientation. Thus, it appears that at 300 K the superparamagnetic transition occurs somewhere between 20 and 45 nm in the bimetallic Ag50Ni50 nanoparticles. Pure Ni nanoparticles have been found to exhibit room-temperature superparamagnetism below a critical diameter of ≈30 nm which agrees well with the observed results.36Figure 2d shows the M–H loops measured at 1.9 K and illustrates that at this temperature all the samples exhibit coercivity. This indicates that even for the 8 nm nanoparticles, the superparamagnetic-to-ferromagnetic transition occurs above 1.9 K.
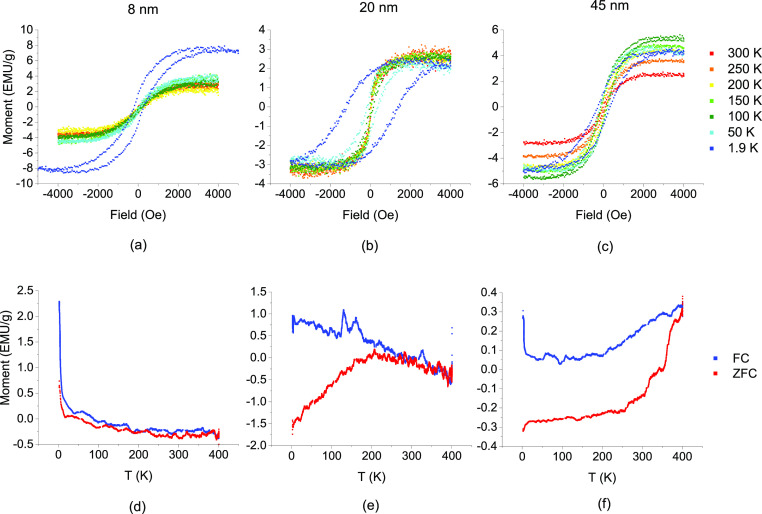
As shown in Figure 3a–c, the M–H plots are included at test temperatures from 1.9 K up to 300 K for the 45, 20, and 8 nm PLID nanoparticles. The 8 nm particles demonstrate a clear superparamagnetic transition between 1.9 and 50 K, while the 20 nm particles have a transition between 150 and 200 K, and the 45 nm particles exhibit no superparamagnetic transition up to 300 K. To more accurately determine the blocking temperatures, Figure 3d–f is a plot of the magnetic moment as a function of temperature for the 8, 20, and 45 nm particles. The zero field cooled (ZFC) and field cooled (FC) curves for the 8 nm sample are effectively indistinguishable except the lowest temperatures. The convergence of these curves indicates the magnetic blocking temperature and identifies it as residing in this low-temperature regime for the 8 nm sample. By comparison, the 20 and 45 nm samples, the ZFC/FC curves are separated until 200 and 400 K, respectively, owing to their larger effective magnetic volume. Above the blocking temperature, the sample behaves as a superparamagnet, with a closed hysteresis loop, which opens up to have a non-zero coercivity cooling through the blocking temperature. Indeed, this is observed in the coercivity loops, panels a–c, that for the 8 nm sample, only the coldest loop is open, for the 20 nm sample, the loop is open below 200 K, and for the 45 nm sample, the loop is open for all measured temperatures. Experimental values are compared against the calculated values, as determined by eq 1, where KU is the magnetocrystalline anisotropy of nickel (5.7 × 10³ J/m3), V is the particle volume, KB is the Boltzmann constant, τ is the observation time (2 s), and τ0 is the characteristic flipping time, assumed to be 10–9 s
| 1 |
Figure 3.
(a–c) Moment vs field plots as a function of testing temperature for nanoparticles with sizes of 8, 20, and 45 nm and (d–f) moment vs T plots showing the FC and ZFC for particle sizes of 8, 20, and 45 nm.
The calculated TB for the 8 nm particles is 5 K, and therefore, the measurements starting at 2 K leave too little temperature range to resolve the “bump.” This is consistent with Figure 3d, which shows an up-swing in the M–T curve but no bump, and Figure 3a, which shows that at 1.9 K the nanoparticles are below TB. Figure 3e demonstrates a much more pronounced peak, in this case at approximately 200 K, again in agreement with the corresponding M–H plot. However, the calculated value for TB is lower at 80 K. The experimentally determined TB will be sensitive to the largest particles, and therefore, it is not surprising that the experimental value is larger than the calculated. Finally, the 45 nm particles show no blocking temperature, even up to 400 K, consistent with Figure 3c. Calculating TB for the 45 nm particles indicates a temperature of 982 K, higher than the Currie temperature of Ni.
2.3. Optical Transmission
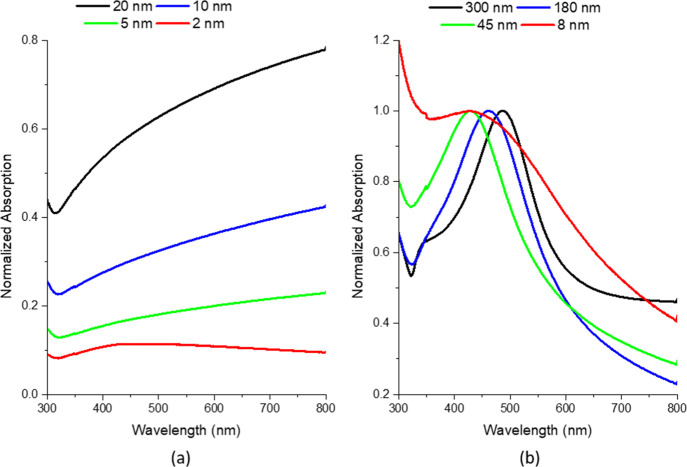
To correlate the AD nanogranular mixture of Ag-rich and Ni-rich supersaturated solutions in the AD thin films to the phase-separated PLiD nanoparticles, optical transmission spectroscopy measurements on AD films and PLiD nanoparticle arrays were also performed. Figure 4 illustrates optical absorption spectra for AD films (a) and PLiD samples (b). The AD films exhibit no plasmon peaks except in the 2 nm thick film, where a broad peak is observed at 425 nm (2.92 eV). Here, a peak is observed because the 2 nm thick film is not continuous and instead form isolated islands of materials. As film thickness increases, the film is continuous by 5 nm thick, and beyond this, the absorption increases because of the high imaginary index of refraction of both silver and nickel in this wavelength range.
Figure 4.
Transmission absorption spectra for (a) AD films denoted by their thicknesses and (b) PLiD samples denoted by their peaks in the resultant particle size distribution.
In the PLiD samples, all four particle diameters produce a plasmon peak in the range of 400–550 nm (3.10–2.25 eV). There is the expected blue-shift with decreasing particle diameter, as observed in EELS, from the 300 nm through the 45 nm nanoparticles. From 45 to 8 nm, there is a slight shift in the peak position back to lower energies; however, there is a significant degree of broadening observed for the 8 nm particles. This broadening obscures the location of the peak and is likely due to increased scattering from the extremely small size of the nanoparticles. The peak breadth of the 300, 180, and 45 nm samples is quite similar which is surprising due to the variation in particle size distribution, as observed in Figure 1.
2.4. EELS
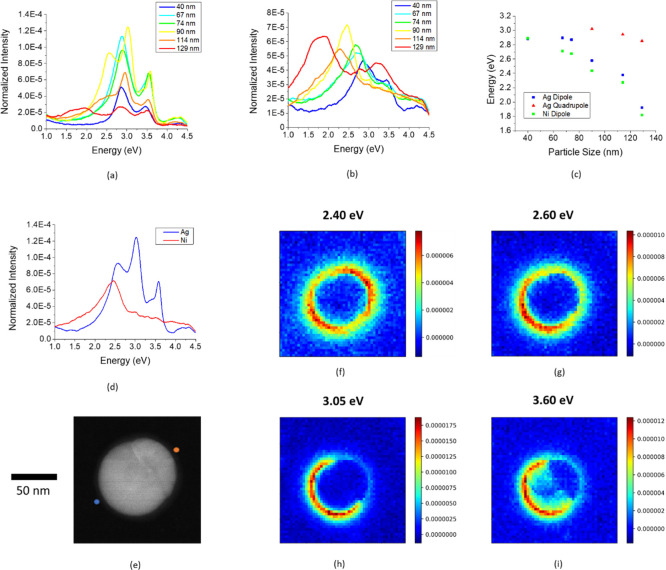
In addition to absorption measurements of PLiD nanoparticle arrays, STEM and low-loss EELS were measured on several individual nanoparticles. The most commonly observed particle morphology revealed in the dark field scanning TEM is a Janus particle (see Figure 5e for high angle annular dark field STEM image). Interestingly, while the ensemble composition is ∼Ag0.5Ni0.5, the individual nanoparticle composition can vary based on the dewetting dynamics. The slower cooling time associated with the thin suspended membranes allows ample time for the kinetics to drive the particles to what appears to be an equilibrium Janus morphology. Low-loss EELS is a useful tool to measure the full plasmonic spectrum of plasmonic nanostructures. The Ag–Ni Janus particle morphology yields obvious differences when probing the two sides of a nanoparticle; the EELS spectra for the Ag and Ni sides as a function of particle diameter are included in Figure 5a,b. It is interesting to note that a relatively strong local surface plasmon resonance (LSPR) peak is observed in the Ni hemispheres, which is not expected as Ni is plasmonically inactive. Sachan et al. noted in the Ag–Co/Fe system that narrow and intense plasmon peaks emerge on the ferromagnetic Co/Fe regions of Ag–Co/Fe nanoparticles produced via PLiD.37 It was suggested38 that the Ag region of the nanoparticle hybridizes with the magnetic Co/Fe region via either a dipole–dipole coupling or via a Fano-interference effect.
Figure 5.
(a) EELS spectra from a probe position on the Ag hemisphere as a function of particle size, (b) EELS spectra from a probe position on the Ni hemisphere as a function of particle size, (c) peak position of Ag and Ni dipole, and Ag quadrupole as a function of particle size, (d) EELS spectra for 90 nm particle probed at Ag and Ni ends, (e) STEM image of 90 nm Ag–Ni Janus particle, and (f–i) EELS spectrum images demonstrating the plasmon modes of the 90 nm particle shown in (e).
In the smallest nanoparticles, probing the Ag hemisphere excites two LSPR peaks beyond the Ag bulk plasmon (located at ≈3.8 eV): the dipole at 2.9 eV and the quasiplanar mode, which is a mixture of higher order modes with an energy of ≈3.5 eV. As particle size increases, the expected red-shift of the dipole peak occurs where the 129 nm nanoparticle exhibits a dipole peak at an energy of 1.9 eV. In addition to the dipole shift, as the particle size increases, the quadrupole first becomes distinguishable from the quasiplanar mode in the 90 nm nanoparticle and then also red-shifts at larger sizes. No other higher order modes emerge from the quasiplanar mode. When probing the Ag side of the 90 and 114 nm particles, the peak positions of the dipole, quadrupole, and quasiplanar modes are in very good agreement with the reported peak positions for a pure Ag 100 nm particle.39
When probing the Ni side of the nanoparticles, there is an LSPR (dipole) that is slightly shifted to lower energy relative to the Ag dipole, which is consistent with the Ni dielectric constant. This approximate offset is maintained across all nanoparticle sizes. Because the Ni surface plasmon is significantly damped relative to the silver, identification of any modes beyond the dipole is much more challenging relative to the silver side. There is, however, an additional peak at ≈2.8 eV for the 129 nm particle when probed on the Ni side. The peak position of the Ag dipole and quadrupole, along with the Ni dipole is plotted as a function of particle size, as shown in Figure 5c.
The individual point spectra for the Ag and Ni hemispheres of the 90 nm particle are included in Figure 4d (see Figure S3 in the Supporting Information for STEM images). Figure 5e–i shows the HAADF STEM image of the 90 nm nanoparticle and the associated EELS maps for this particle to visualize the LSPR modes. Each map is associated with a specific energy window, and the color contrast indicates the relative intensity in the chosen energy range. The lowest energy map at 2.4 eV demonstrates the Ni dipole where the intensity is elevated all around the particle and is a maximum at the Ag and Ni ends; the peak on the Ag end is due to the fact that the Ag dipole peak has an appreciable signal at 2.4 eV. The Ag dipole, 2.6 eV, possesses a similar signature, however, the intensity is much lower on the Ni side. The final two maps (Figure 5h,i) show the Ag quadrupole and the Ag quasiplanar modes. Both modes are brightest around the Ag hemisphere. The primary difference between the two modes is that the quadrupole near field extends farther from the nanoparticle surface, whereas the quasiplanar mode has a much stronger signature in the bulk.
3. Conclusions
Magnetic and optical characterization has demonstrated that Ag–Ni nanoparticles fabricated via PLiD possess interesting magneto-plasmonic bifunctionality. The initially nanogranular continuous 2D thin films are composed of an Ag-enriched supersaturated solid solution and a Ni-enriched supersaturated solid solution. The Ag–Ni films form Ag–Ni nanoparticles on various substrates following photothermal nanosecond pulsed laser heating. Varying the thickness of the Ag0.5Ni0.5 thin films prior to dewetting provided good control over nanoparticle size distributions. By controlling the size of the nanoparticles, room-temperature magnetic properties can be tailored from ferromagnetic (>20 nm) to superparamagnetic (<20 nm). Additional trends, such as a transition from a single to multidomain magnetic regime, and the superparamagnetic transition temperature were also demonstrated. Optically, STEM EELS and optical absorption measurements show the expected trend of red-shifting the LSPR peak with the increasing nanoparticle size. The samples fabricated for STEM EELS demonstrated Ag–Ni Janus particles as the dominant nanoparticle morphology. These Janus nanoparticles were found to possess an LSPR dipole peak at an energy corresponding to both Ag and Ni, depending on the hemisphere where the sample is probed. The Ni hemispheres in general have more damped and lower energy LSPRs, whereas the stronger LSPRs in the Ag hemispheres exhibit a clear dipole, quadrupole, and quasiplanar modes at larger particle sizes.
4. Methods
4.1. Materials
Ag0.5Ni0.5 thin films were synthesized via radio frequency magnetron co-sputtering. A base pressure of <4 × 10⁻⁷ Torr was achieved for all samples, and sputtering was conducted at a pressure of 5 mTorr with an Ar flow rate of 25 sccm. Forward powers of 70 and 40 W were used for Ni and Ag targets, respectively, to ensure an ∼50/50 composition (confirmed via energy-dispersion X-ray spectroscopy). The AD film forms as a supersaturated nanocrystalline solid solution.28
Films of 20, 10, 5, 3, and 2 nm were deposited on various substrates and tested AD as well as following PLiD. Magnetic samples were deposited on 100 mm diameter, 500 μm thick Si wafers coated with 100 nm of thermally grown SiO2 to act as thermal and chemical insulating layers. The samples prepared for optical transmission testing were deposited on 100 mm diameter, 500 μm thick quartz substrates. Finally, TEM and EELS samples were deposited on commercial 20 nm thick, 50 μm × 50 μm SiO2 membranes.
Nanoparticles were formed through PLiD using a krypton fluoride excimer laser with a wavelength of 248 nm. The laser has a Gaussian temporal distribution with a full width at half-maximum of ≈20 ns. The samples were subjected to 10 pulses with a fluence of approximately 170 mJ/cm2 for samples deposited on the 100 nm SiO2/silicon wafers, and 1 pulse at ≈50 mJ/cm2 on TEM membrane samples. Because of the significant difference in substrate heat conduction, more pulses at higher fluence were required for the 100 nm SiO2/silicon wafers to achieve a similar stage of dewetting as was achieved with a single pulse at lower fluence on the 20 nm SiO2 suspended membrane.
4.2. Vibrating Sample Magnetometer
The magnetic properties of AgNi were characterized using a vibrating sample magnetometer on a PPMS DynaCool. The magnetization versus temperature curve was measured by ZFC and FC from 1.9 to 400 K with an external magnetic field of 50 Oe. The measurement time per point was 2 s. The magnetic hysteresis loop of the sample proceeded from −4000 to 4000 Oe at temperatures between 2 and 300 K.
4.3. Transmission
Optical transmission spectroscopy was conducted on AD thin films and PLiD samples. A 10 mm aperture was used for the AD films, while a 1 mm aperture was used following laser treatment. The wavelength range of 200–1000 nm was used.
4.4. EELS
Low-loss EELS and spectrum images were taken using a Nion aberration-corrected high-energy-resolution monochromated EELS–STEM operated at an accelerating voltage of 60 kV. The convergence and collection semiangles used for the spectrum acquisition were 30 and 15 mrad, respectively. The energy resolution (full width at half-maximum of the zero-loss peak) was approximately 20 meV. The EEL spectra presented in Figure 4 were normalized to the zero-loss peak.
Acknowledgments
P.D.R. and D.A.G. acknowledge support from the National Science Foundation (CBET-1603780). I.N.V and J.D.F. acknowledge support from the US Department of Energy (DOE) under grant number KC 0403040 ERKCZ01. G.P. acknowledges the National Science Foundation (NSF DMR 1709275). D.A.G. (Gilbert) and N.T. acknowledge support from the DOE Early Career Program and National Science Foundation (NSF 2028542). All the authors acknowledge that the absorption and EELS measurements was conducted at the Center for Nanophase Materials Sciences, which is a DOE Office of Science User Facility.
Supporting Information Available
The Supporting Information is available free of charge at https://pubs.acs.org/doi/10.1021/acsomega.0c02894.
Enlarged TEM images of 3 and 5 nm samples, STEM images of all nanoparticles measured for EELS, and magnetic hysteresis loops for 10 and 20 nm films as a function of testing temperature (PDF)
The authors declare no competing financial interest.
Supplementary Material
References
- Nguyen T.; Mammeri F.; Ammar S. Iron Oxide and Gold Based Magneto-Plasmonic Nanostructures for Medical Applications: A Review. Nanomaterials 2018, 8, 149. 10.3390/nano8030149. [DOI] [PMC free article] [PubMed] [Google Scholar]
- Tomitaka A.; Arami H.; Raymond A.; Yndart A.; Kaushik A.; Jayant R. D.; Takemura Y.; Cai Y.; Toborek M.; Nair M. Development of Magneto-Plasmonic Nanoparticles for Multimodal Image-Guided Therapy to the Brain. Nanoscale 2017, 9, 764–773. 10.1039/C6NR07520G. [DOI] [PMC free article] [PubMed] [Google Scholar]
- Kretschmer F.; Mühlig S.; Hoeppener S.; Winter A.; Hager M. D.; Rockstuhl C.; Pertsch T.; Schubert U. S. Survey of Plasmonic Nanoparticles: From Synthesis to Application. Part. Part. Syst. Charact. 2014, 31, 721–744. 10.1002/ppsc.201300309. [DOI] [Google Scholar]
- Maksymov I. S. Magneto-Plasmonic Nanoantennas: Basics and Applications. Rev. Phys. 2016, 1, 36–51. 10.1016/j.revip.2016.03.002. [DOI] [Google Scholar]
- Urries I.; Muñoz C.; Gomez L.; Marquina C.; Sebastian V.; Arruebo M.; Santamaria J. Magneto-Plasmonic Nanoparticles as Theranostic Platforms for Magnetic Resonance Imaging, Drug Delivery and NIR Hyperthermia Applications. Nanoscale 2014, 6, 9230–9240. 10.1039/C4NR01588F. [DOI] [PubMed] [Google Scholar]
- Ovejero J. G.; Yoon S. J.; Li J.; Mayoral A.; Gao X.; O’Donnell M.; García M. A.; Herrasti P.; Hernando A. Synthesis of Hybrid Magneto-Plasmonic Nanoparticles with Potential Use in Photoacoustic Detection of Circulating Tumor Cells. Microchim. Acta 2018, 185, 130. 10.1007/s00604-017-2637-x. [DOI] [PubMed] [Google Scholar]
- Wu C.-H.; Cook J.; Emelianov S.; Sokolov K. Multimodal Magneto-Plasmonic Nanoclusters for Biomedical Applications. Adv. Funct. Mater. 2014, 24, 6862–6871. 10.1002/adfm.201401806. [DOI] [Google Scholar]
- Bischof J.; Scherer D.; Herminghaus S.; Leiderer P. Dewetting Modes of Thin Metallic Films: Nucleation of Holes and Spinodal Dewetting. Phys. Rev. Lett. 1996, 77, 1536–1539. 10.1103/PhysRevLett.77.1536. [DOI] [PubMed] [Google Scholar]
- Jiran E.; Thompson C. V. Capillary Instabilities in Thin, Continuous Films. Thin Solid Films 1992, 208, 23–28. 10.1016/0040-6090(92)90941-4. [DOI] [Google Scholar]
- Diez J. A.; Kondic L. On the Breakup of Fluid Films of Finite and Infinite Extent. Phys. Fluids 2007, 19, 072107. 10.1063/1.2749515. [DOI] [Google Scholar]
- Diez J. A.; González A. G.; Kondic L. On the Breakup of Fluid Rivulets. Phys. Fluids 2009, 21, 082105. 10.1063/1.3211248. [DOI] [Google Scholar]
- Wu Y.; Fowlkes J. D.; Roberts N. A.; Diez J. A.; Kondic L.; González A. G.; Rack P. D. Competing Liquid Phase Instabilities during Pulsed Laser Induced Self-Assembly of Copper Rings into Ordered Nanoparticle Arrays on SiO2. Langmuir 2011, 27, 13314–13323. 10.1021/la203165v. [DOI] [PubMed] [Google Scholar]
- Fowlkes J. D.; Kondic L.; Diez J. A.; González A. G.; Wu Y.; Roberts N. A.; Rack P. D.; McCold C. E. Parallel Assembly of Particles and Wires on Substrates by Dictating Instability Evolution in Liquid Metal Films. Nanoscale 2012, 4, 7376–7382. 10.1039/C2NR31637D. [DOI] [PubMed] [Google Scholar]
- Rack P. D.; Guan Y.; Fowlkes J. D.; Melechko A. V.; Simpson M. L. Pulsed Laser Dewetting of Patterned Thin Metal Films: A Means of Directed Assembly. Appl. Phys. Lett. 2008, 92, 223108. 10.1063/1.2939436. [DOI] [Google Scholar]
- Kondic L.; Diez J. A.; Rack P. D.; Guan Y.; Fowlkes J. D. Nanoparticle Assembly via the Dewetting of Patterned Thin Metal Lines: Understanding the Instability Mechanisms. Phys. Rev. E 2009, 79, 026302. 10.1103/PhysRevE.79.026302. [DOI] [PubMed] [Google Scholar]
- Fowlkes J. D.; Kondic L.; Diez J.; Wu Y.; Rack P. D. Self- versus Directed- Assembly of Nanoparticles via Pulsed Laser Induced Dewetting of Patterned Metal Films. Nano Lett. 2011, 11, 2478–2485. 10.1021/nl200921c. [DOI] [PubMed] [Google Scholar]
- Chen M.; Kim Y. N.; Lee H. M.; Li C.; Cho S. O. Multifunctional Magnetic Silver Nanoshells with Sandwichlike Nanostructures. J. Phys. Chem. C 2008, 112, 8870–8874. 10.1021/jp800649b. [DOI] [Google Scholar]
- Hamidi S. M.; Oskuei M. A. Magneto-Plasmonic Effect in Cobalt Thin Film Incorporating Core–Shell Ag@Au Nanoparticles. J. Supercond. Novel Magn. 2014, 27, 1469–1472. 10.1007/s10948-013-2449-0. [DOI] [Google Scholar]
- Oh Y.; Lee J.; Lee M. Fabrication of Ag-Au Bimetallic Nanoparticles by Laser-Induced Dewetting of Bilayer Films. Appl. Surf. Sci. 2018, 434, 1293–1299. 10.1016/j.apsusc.2017.11.245. [DOI] [Google Scholar]
- Qiu G.; Ng S. P.; Wu C.-M. L. Bimetallic Au-Ag Alloy Nanoislands for Highly Sensitive Localized Surface Plasmon Resonance Biosensing. Sens. Actuators, B 2018, 265, 459–467. 10.1016/j.snb.2018.03.066. [DOI] [Google Scholar]
- Sachan R.; Malasi A.; Yadavali S.; Griffey B.; Dunlap J.; Duscher G.; Kalyanaraman R. Laser-Induced Self-Assembled Nanostructures on Electron-Transparent Substrates. Part. Part. Syst. Charact. 2015, 32, 476–482. 10.1002/ppsc.201400183. [DOI] [Google Scholar]
- Sachan R.; Yadavali S.; Shirato N.; Krishna H.; Ramos V.; Duscher G.; Pennycook S. J.; Gangopadhyay A. K.; Garcia H.; Kalyanaraman R. Self-Organized Bimetallic Ag–Co Nanoparticles with Tunable Localized Surface Plasmons Showing High Environmental Stability and Sensitivity. Nanotechnology 2012, 23, 275604. 10.1088/0957-4484/23/27/275604. [DOI] [PubMed] [Google Scholar]
- McKeown J. T.; Wu Y.; Fowlkes J. D.; Rack P. D.; Campbell G. H. Simultaneous In-Situ Synthesis and Characterization of Co@Cu Core-Shell Nanoparticle Arrays. Adv. Mater. 2015, 27, 1060–1065. 10.1002/adma.201404374. [DOI] [PubMed] [Google Scholar]
- Wu Y.; Fowlkes J. D.; Rack P. D. The Optical Properties of Cu-Ni Nanoparticles Produced via Pulsed Laser Dewetting of Ultrathin Films: The Effect of Nanoparticle Size and Composition on the Plasmon Response. J. Mater. Res. 2011, 26, 277–287. 10.1557/jmr.2010.9. [DOI] [Google Scholar]
- Fowlkes J. D.; Wu Y.; Rack P. D. Directed Assembly of Bimetallic Nanoparticles by Pulsed-Laser-Induced Dewetting: A Unique Time and Length Scale Regime. ACS Appl. Mater. Interfaces 2010, 2, 2153–2161. 10.1021/am100417x. [DOI] [Google Scholar]
- Allaire R. H.; Dhakane A.; Emery R.; Ganesh P.; Rack P. D.; Kondic L.; Cummings L.; Fuentes-Cabrera M. Surface, Interface, and Temperature Effects on the Phase Separation and Nanoparticle Self Assembly of Bi-Metallic Ni0.5Ag0.5: A Molecular Dynamics Study. Nanomaterials 2019, 9, 1040. 10.3390/nano9071040. [DOI] [PMC free article] [PubMed] [Google Scholar]
- Mueller C. M.; Murthy R. R.; Bourgeois M. R.; Schatz G. C. Thermodynamic Determination of Bimetallic Particle Geometry: Suitability of Poorly Miscible Alloys for Surface-Enhanced Raman. J. Phys. Chem. C 2020, 124, 3287–3296. 10.1021/acs.jpcc.9b10889. [DOI] [Google Scholar]
- Wu Y.; Liu C.; Moore T. M.; Magel G. A.; Garfinkel D. A.; Camden J. P.; Stanford M. G.; Duscher G.; Rack P. D. Exploring Photothermal Pathways via in Situ Laser Heating in the Transmission Electron Microscope: Recrystallization, Grain Growth, Phase Separation, and Dewetting in Ag0.5Ni0.5 Thin Films. Microsc. Microanal. 2018, 24, 647–656. 10.1017/S1431927618015465. [DOI] [PubMed] [Google Scholar]
- Favazza C.; Kalyanaraman R.; Sureshkumar R. Robust Nanopatterning by Laser-Induced Dewetting of Metal Nanofilms. Nanotechnology 2006, 17, 4229. 10.1088/0957-4484/17/16/038. [DOI] [PubMed] [Google Scholar]
- Krishna H.; Sachan R.; Strader J.; Favazza C.; Khenner M.; Kalyanaraman R. Thickness-Dependent Spontaneous Dewetting Morphology of Ultrathin Ag Films. Nanotechnology 2010, 21, 155601. 10.1088/0957-4484/21/15/155601. [DOI] [PubMed] [Google Scholar]
- Yadavali S.; Khenner M.; Kalyanaraman R. Pulsed Laser Dewetting of Au Films: Experiments and Modeling of Nanoscale Behavior. J. Mater. Res. 2013, 28, 1715–1723. 10.1557/jmr.2013.90. [DOI] [Google Scholar]
- Herminghaus S.; Jacobs K.; Mecke K.; Bischof J.; Fery A.; Ibn-Elhaj M.; Schlagowski S. Spinodal Dewetting in Liquid Crystal and Liquid Metal Films. Science 1998, 282, 916–919. 10.1126/science.282.5390.916. [DOI] [PubMed] [Google Scholar]
- McKeown J. T.; Roberts N. A.; Fowlkes J. D.; Wu Y.; LaGrange T.; Reed B. W.; Campbell G. H.; Rack P. D. Real-Time Observation of Nanosecond Liquid-Phase Assembly of Nickel Nanoparticles via Pulsed-Laser Heating. Langmuir 2012, 28, 17168–17175. 10.1021/la303657e. [DOI] [PubMed] [Google Scholar]
- Krishna H.; Shirato N.; Yadavali S.; Sachan R.; Strader J.; Kalyanaraman R. Self-Organization of Nanoscale Multilayer Liquid Metal Films: Experiment and Theory. ACS Nano 2011, 5, 470–476. 10.1021/nn1022632. [DOI] [PubMed] [Google Scholar]
- Jeong U.; Teng X.; Wang Y.; Yang H.; Xia Y. Superparamagnetic Colloids: Controlled Synthesis and Niche Applications. Adv. Mater. 2007, 19, 33–60. 10.1002/adma.200600674. [DOI] [Google Scholar]
- Krishnan K. M. Biomedical Nanomagnetics: A Spin Through Possibilities in Imaging, Diagnostics, and Therapy. IEEE Trans. Magn. 2010, 46, 2523–2558. 10.1109/TMAG.2010.2046907. [DOI] [PMC free article] [PubMed] [Google Scholar]
- Sachan R.; Malasi A.; Ge J.; Yadavali S.; Krishna H.; Gangopadhyay A.; Garcia H.; Duscher G.; Kalyanaraman R. Ferroplasmons: Intense Localized Surface Plasmons in Metal-Ferromagnetic Nanoparticles. ACS Nano 2014, 8, 9790–9798. 10.1021/nn5031719. [DOI] [PubMed] [Google Scholar]
- Passarelli N.; Pérez L. A.; Coronado E. A. Plasmonic Interactions: From Molecular Plasmonics and Fano Resonances to Ferroplasmons. ACS Nano 2014, 8, 9723–9728. 10.1021/nn505145v. [DOI] [PubMed] [Google Scholar]
- Wu Y.; Li G.; Cherqui C.; Bigelow N. W.; Thakkar N.; Masiello D. J.; Camden J. P.; Rack P. D. Electron Energy Loss Spectroscopy Study of the Full Plasmonic Spectrum of Self-Assembled Au–Ag Alloy Nanoparticles: Unraveling Size, Composition, and Substrate Effects. ACS Photonics 2016, 3, 130–138. 10.1021/acsphotonics.5b00548. [DOI] [Google Scholar]
Associated Data
This section collects any data citations, data availability statements, or supplementary materials included in this article.


