Abstract
Purpose
To assess the influence of limbal metabolic support on corneal edema during scleral-lens (SL) and soft-contact-lens (SCL) wear for healthy lens wearers.
Methods
A two-dimensional (2D) model of the cornea and sclera was designed on Comsol Multiphysics 5.4 along with SL and SCL architectures to mimic lens-wear induced hypoxia. The cornea is suffused with oxygen and metabolites from the limbus and aqueous humor. Air oxygen is supplied from and carbon dioxide is expelled to the atmosphere. Lens-oxygen permeability (Dk) was adjusted to investigate lens-wear safety against edema in different wear conditions. The 2D concentrations of oxygen, carbon dioxide, bicarbonate, lactate, sodium, chloride, glucose, and pH are quantified. Central-to-peripheral swelling of the cornea is determined by the change in stromal hydration caused by changing metabolite concentrations at the endothelium during hypoxia.
Results
The metabolic model assesses central-to-peripheral corneal swelling with different types of lenses, and oxygen Dks. Limbal metabolic support reduces edema from the periphery to approximately 1 mm away from the central cornea. Despite thicker lens designs, the peripheral cornea exhibits practically zero swelling due to limbal metabolic support.
Conclusions
The metabolic model accurately predicts central-to-peripheral corneal edema with various contact-lens designs, post-lens tear-film thicknesses, and lens oxygen Dk values. Despite the thicker periphery of most contact-lens designs, lactate and bicarbonate support from the limbus significantly reduces peripheral and mid-peripheral corneal edema, whereas oxygen has a lesser effect.
Translational Relevance
By utilizing metabolic kinetics, we provide a 2D computational tool to predict oxygenation safety across the entire cornea with various types and designs of contact lenses.
Keywords: contact lens, corneal edema, hypoxia, corneal metabolism, scleral lens, soft contact lens, oxygen, finite element modeling, limbus, limbal metabolic support
Introduction
Contact lenses can impede oxygenation of the cornea. Two prominent methods of assessing corneal hypoxia with contact-lens wear are (1) to measure corneal edema caused by hypoxia,1,2 or (2) to quantify oxygen-tension profiles mathematically by utilizing oxygen-utilization kinetics and diffusion properties of the cornea, tear film, and contact lens.3–8 Although mathematical determination of oxygen-tension profiles continues, oxygen-concentration profiles in-and-of themselves do not address contact-lens wear safety. That is, wear safety gauged only by oxygen is inexact because oxygen tension profiles alone do not establish corneal swelling.
Conversely, corneal edema provides a direct gauge of hypoxia.2 For soft contact lenses (SCLs), Holden and Mertz1 determined the minimum oxygen transmissibility (Dk/L), that is, lens oxygen permeability (Dk) divided by lens thickness (L), required to avoid central corneal swelling. Their study was re-evaluated by Harvitt and Bonanno7 to suggest safe wear for a lens oxygen Dk/L of 35 hBarrer/cm (i.e., hectoBarrer/cm) for the open eye and of 125 hBarrer/cm for the closed eye. These recommendations, however, apply only to SCL wear and are not applicable to scleral-lens (SL) wear, which includes additional resistances to oxygen transport due to increased lens and post-lens tear-film (PoLTF) thicknesses.
To connect mathematical oxygen-tension profiles and clinical-edema measurements, Leung et al.9 devised a metabolic model that directly predicts corneal swelling through reactive-diffusive transport of metabolic products and the hydration pump-leak mechanism of Maurice.10 Leung et al.9 focused on SCLs. Kim et al.11 later extended that work to SL. Both analyses are one-dimensional (1D) and quantify only central corneal edema. They do, however, successfully predict measured central corneal edema.9,11
Despite the extensive studies on contact-lens wear and hypoxia, essentially all focus on central corneal edema despite the approximately 35% thicker peripheral cornea that requires higher oxygen demand.12–15 Moreover, oxygen support from limbal vasculature further differentiates oxygen demands of the peripheral and central cornea.16 Clinically, instrumental limitations result in less reliable measurement of edema at the periphery than at the center.17–22 Despite the limitations in measuring noncentral corneal edema, several authors conclude that the peripheral cornea exhibits less edema than does the central cornea with similar lens oxygen Dk/L.23–26 Mathematically, Alvord et al.12 and Takatori and Radke14 calculated the oxygen-tension profiles from central-to-peripheral cornea. However, Alvord et al.12 did not quantify metabolite transport to determine corneal edema, and Takatori and Radke14 did not assess the effect of metabolite support from the vascularized limbus.
To understand the effects of metabolic support from the limbus and the higher metabolic demand of the mid-peripheral and peripheral cornea during SCL and SL wear on corneal edema, we extend the 1D works of Leung et al.9 and Kim et al.11 to incorporate metabolic support from the limbus. Specifically, we account for metabolic transport from central to/from the peripheral cornea, as well as air oxygen and carbon dioxide to/from the aqueous humor. In so doing, we provide a new tool to predict the oxygenation safety of contact lenses across the entire cornea.
Methods
Lens and Corneo-Scleral Architecture
Figure 1 discloses the geometric parameters of the cornea and sclera along with the designed two-dimensional (2D) corneo-scleral architechture.12,27,28 Geometric designs, and later metabolic species transport and swelling calculations, are computed using the Comsol Multiphysics 5.4 platform (Comsol, Inc., Burlington, MA). Triangular meshes are utilized in the finite-element analysis. Element size for the mesh is based on the default settings of Comsol. Thicknesses are determined radially.14,26 Although the human cornea is not precisely symmetric, the small variance in the corneal-thickness profile does not result in significant swelling differences between inferior, superior, nasal, and temporal corneal regions. Therefore, a symmetric 2D model provides precise central-to-peripheral swelling profiles.
Figure 1.
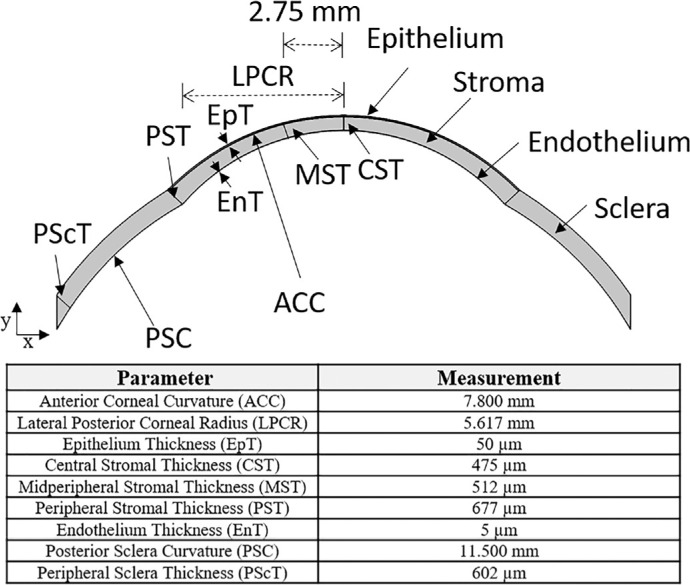
Designed 2D corneo-scleral model. Curvature and thickness parameters of the cornea and the sclera are based on those of Alvord et al.,12 Grytz et al.,27 and Sridhar.28 The peripheral cornea is approximately 35% thicker than that of the central cornea, and the sclera is thinner farther away from the cornea. All corneal thicknesses are reported radially.
Two different types of lenses, SCL and SL, are modeled to assess central-to-peripheral edema with lens wear. Thickness profiles of lens and PoLTF used are shown in Figure 2 for the SCL and the SL over the corneal region. With SCLs, central and peripheral lens thicknesses are set as 100 and 180 µm, respectively.29 As illustrated in Figure 2, lens thickness increases from the center to the periphery. The SCL lateral radius is 7.1 mm, and the PoLTF thickness is 3 µm.8,30,31 Pre-lens tear-film (PrLTF) thickness for both lenses is also set at 3 µm.8,11,30,31 With SLs, the thickness profile mimics that of a Jupiter Scleral Lens (15.6-mm diameter; 97 Barrer; 1.44 refractive index; –6.00 diopter) measured with a Phasefocus high-precision Lens Profiler (Phasefocus Ltd., Sheffield, UK). Lens thickness was asymmetric, but the difference was minimal. For the chosen SL architecture, central-settled PoLTF thickness is taken as 410 µm. PoLTF thicknesses elsewhere were determined from the geometry of the lens and the cornea. Central-settled PoLTF thickness for the SL was chosen as a steep fit to assess the safety of the worst-case scenario for SL wear.32 Because oxygen Dk/L of SCL and SL vary with the changing thickness of the lens, the oxygen Dk of the lens was varied in our calculations as it is a material property commonly reported by lens manufacturers.
Figure 2.
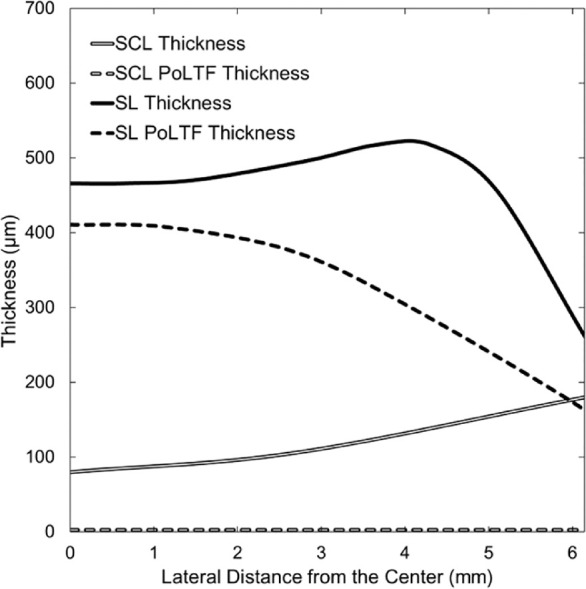
Thickness profiles of SL and SCL with respective PoLTF thicknesses. The horizontal axis is the lateral distance from the central cornea (0 mm) to the peripheral cornea (6.15 mm) with the reference point (horizontal axis = 0) being the central cornea at the anterior epithelial surface. The vertical axis represents thickness values determined radially. Thickness profiles were obtained from literature, determined, or measured.8,11,29–31
Mathematical Metabolic Model
The metabolic-edema model is explained in detail elsewhere9,11; only specifics regarding the 2D model and a brief nonmathematical summary are provided here. Conceptually, hypoxia-induced edema occurs when diminished oxygen concentration shifts glucose metabolism from aerobic to anaerobic. Increased production of lactate and hydrogen ions follows according to the anaerobic reaction
| (1) |
Bicarbonate ions buffer the resulting increase in acidity according to the equilibrium reaction
| (2) |
The net result is an increase in lactate ions and a decrease in bicarbonate ions because of diminished oxygen supply. Equations 1 and 2 occur throughout the cornea. The decrease in bicarbonate and increase in lactate ions near the endothelium alter the local osmotic pressure imbibing water through the pump-leak process.33,34 Accordingly, hypoxia results in higher water retention in the stroma and corneal edema.11
The existing 1D metabolic-swelling models of Leung et al.9 and Kim et al.11 calculate edema at the center of the cornea only. They do not consider lateral transport of metabolites,9,11 nor is there metabolic supply/withdrawal from the limbus. In our 2D analysis, lens and PoLTF thicknesses vary from the center to the periphery. Metabolite diffusion occurs in both lateral (x axis in Fig. 1) and sagittal (y axis in Fig. 1) directions. Previous Nernst-Planck equations are extended to 2D as follows
| (3) |
Here, Ji is the vector flux of species i, ∇ is the 2D gradient operator in rectangular coordinates (see Appendix A), Di is the diffusion constant for species i, Ci is the concentration of species i, zi is the valence of species i, F is the Faraday's constant, R is the ideal gas constant, T is the temperature, and ψ is the electric potential relative to the tear film. Equation 3 neglects the small water flux across the cornea.11,35 Subscripts i represent the six metabolites directly related to aerobic and anaerobic metabolism, as well as sodium chloride.9 Metabolites of interest are oxygen, carbon dioxide, bicarbonate, lactate, glucose, and hydrogen ion. Sodium and chloride ions maintain electroneutrality. Temperature is that of the human body: 310.15 K. Diffusion constants are available elsewhere.9,11 Conservation equations for all aqueous species are expressed in 2D by replacing 1D differentials with the gradient operator. All modified equations are summarized in Appendix A.
Information on metabolic supply/withdrawal from the limbus is required in 2D with the introduction of the corneal periphery. Because the limbus is vascularized, metabolic concentrations of the limbus are based on that of blood, as given in the Table.36–40 The electric potential of the sclera is determined numerically from electroneutrality and the zero-current condition described in Leung et al.9 In our 2D analysis, reflection coefficients of bicarbonate and lactate ions are 0.53 and 0.65, respectively, compared with those of Leung et al.9 Remaining parameters, equations, and boundary conditions are unchanged from previous works and can be found in Kim et al.11
Table.
Boundary Conditions at the Limbus.
Comparison to Measured Corneal Edema
The metabolic model compares well to measured central corneal edema in percentage swelling versus oxygen Dk/L curves for SCLs1,9 and for SLs.11,41 Available periphery or mid-periphery swelling curves are sparse. Instrument imprecision results in less reliable measurement of edema at the periphery than at the center because of the limitations of eye fixation and determination of a repeatable noncentral location before and after lens wear.17–22 By using ocular coherence tomography, Hitzenberger et al.42 determined that the error of noncentral corneal thickness is twice that of the central cornea. These limitations also apply to the Schiempflug camera and to ultrasound pachymetry that are also used to measure corneal thickness in vivo. Measurement uncertainty for the earlier mentioned instruments at the noncentral cornea is approximately 6 to 10 µm or 1% to 1.5% of the peripheral corneal thickness.43–45 Consequently, available instrumentation cannot reliably detect 0% to 2% swelling of open-eye lens wear at the noncentral cornea.
Nevertheless, Wang et al.26 provide reliable measurement of central-to-peripheral corneal edema. These authors impose extreme hypoxic conditions by employing SCLs with low central oxygen Dk/L (i.e., 2.2 hBarrer/cm) worn on patched eyes. These conditions produce more than 4% swelling everywhere on the cornea and, therefore, allow accurate swelling comparison between the central and peripheral cornea. Comparisons of the data of Wang et al.26 to our metabolic model are given in Figure 3 for three lens-thickness profiles: thicker near the periphery (solid line) as illustrated in Figure 2, constant thickness (dashed line), and thinner near the periphery (dotted line). Error bars in Figure 3 are based on the standard deviations provided by Wang et al.26 of 3.1% and 2.6% at the center and periphery, respectively. Wang et al.26 provide only the central oxygen Dk/L and no lens thickness profile to assess the noncentral oxygen Dk/L. An SCL that thins toward the periphery agrees better with the experimental data, although lenses that either are of constant thickness or that thicken somewhat toward the periphery provide acceptable agreement. Additionally, under extreme hypoxic conditions, swelling is very sensitive to small changes in oxygen tension.11 Thus, our proposed 2D metabolic model agrees well with clinical central-corneal-edema measurements,1,9,11,41 and with the swelling-profile data of Wang et al.26 using consistent parameters.
Figure 3.
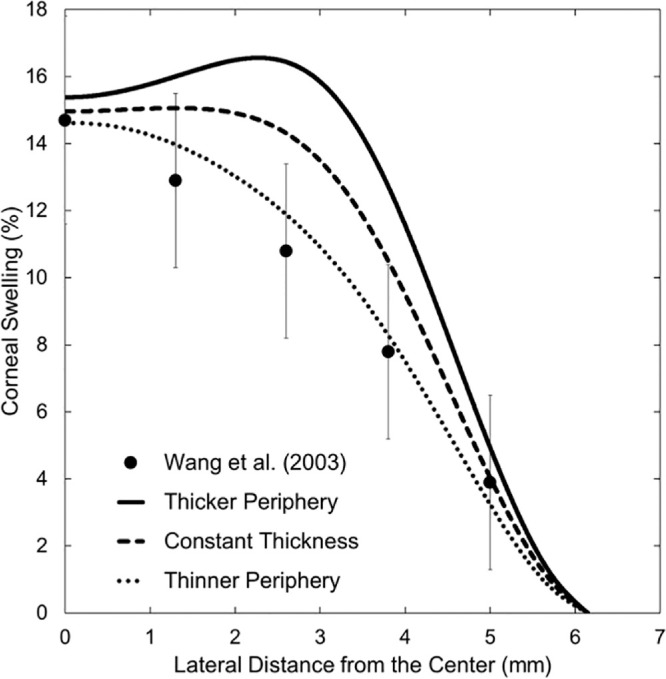
Metabolic-model comparison to the experimental corneal-swelling profile of Wang et al.26 for hydroxyethyl methacrylate SCLs with central oxygen transmissibility of 2.2 hBarrer/cm. Results for three thickness profiles are shown: thickening near the periphery (solid line), constant thickness (dashed line), and thinning near the periphery (dotted line). Filled circles and the associated error bars correspond to measurements by Wang et al.26 Horizontal axis is the lateral distance from the central cornea to the peripheral cornea, with the reference point (horizontal axis = 0) being the central cornea at the anterior epithelial surface. Vertical axis is local percentage corneal swelling due to lens wear.
Results
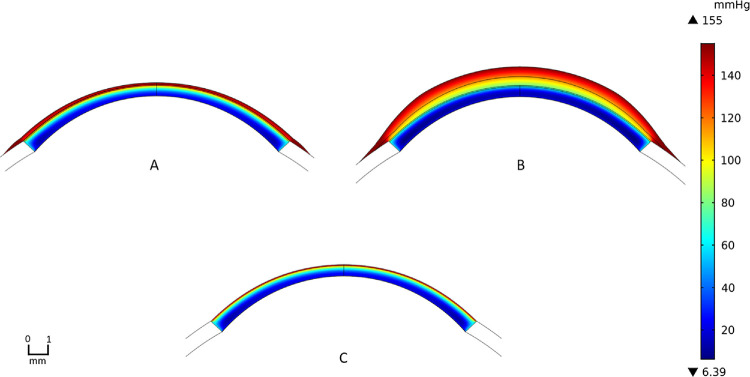
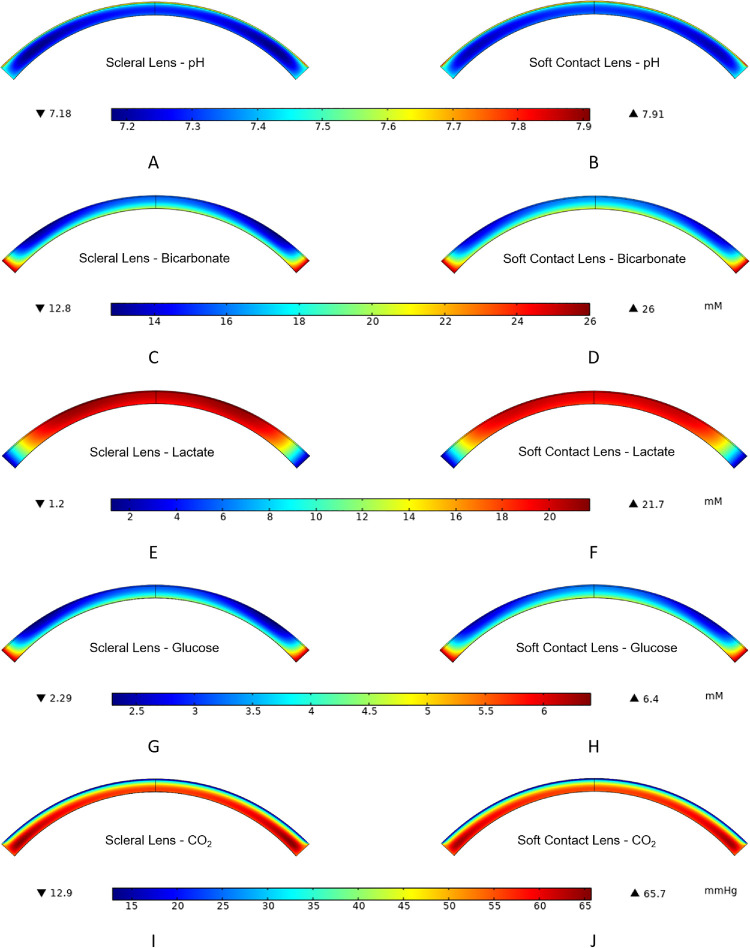
Figure 4 provides oxygen-tension contours for SL and SCL wear for the parameters described in Methods and with an oxygen Dk of 100 Barrer. We define the central-corneal region as up to 1 mm laterally away from the center of the anterior epithelium surface, the mid-peripheral region as 1 to 5 mm laterally away, and the peripheral region as greater than 5 mm laterally away to the limbus. SL wear exhibits more oxygen deprivation in Figure 4 because the resistance to oxygen transport from the environment is higher than that for SCL wear. Oxygen supply from the limbus to the cornea is qualitatively apparent with both types of lens wear. Figure 5 provides concentration contours of the remaining metabolites directly related to aerobic and anaerobic metabolic reactions for SL and SCL wear with 100 Barrer oxygen Dk. Visually, SCL wear exhibits higher levels of bicarbonate, glucose, and pH and lower levels of carbon dioxide and lactate than does SL wear throughout the cornea. These findings are anticipated because of the larger oxygen transport resistances of SLs versus SCLs.
Figure 4.
2D oxygen-tension contours for contact lens and corneal system: (A) is SCL wear, (B) is SL wear, and (C) is no lens wear. Contour for the sclera is not displayed as the oxygen tension is set to be that of the blood. Oxygen permeabilities for both lenses are 100 Barrer. Lens and PoLTF thickness profiles are provided in Figure 2. Colors are interpreted from the vertical bar on the right. Red color indicates high oxygen tension and navy color indicates low oxygen tension. The unit of oxygen tension is mm Hg.
Figure 5.
Corneal contour graphs for bicarbonate, lactate, glucose, pH, and carbon dioxide for the cornea during SL wear (A, C, E, G, I) and SCL wear (B, D, F, H, J). Oxygen permeability for both lenses is 100 Barrer; thickness profiles are provided in Figure 2. Only profiles in the cornea are provided, as the transport of most metabolites across the lens is minimal; the concentrations at the sclera are set to those of blood. The color legend for each row is directly below that respective row. Red color indicates high concentration, tension, or pH; and navy color indicates low concentration, tension, or pH. The unit of carbon-dioxide tension is mm Hg. Units of glucose, bicarbonate, and lactate are millimolar (mM).
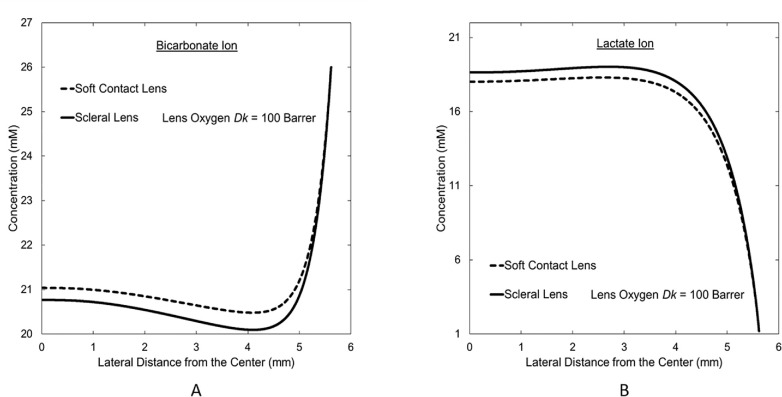
Figure 6 displays concentration profiles of lactate and bicarbonate ions from central-to-peripheral cornea at the endothelium for SL and SCL wear. Because SL wear incurs larger hypoxia than does SCL wear, these concentration profiles demonstrate that, in obedience to Equations 1 and 2, increased hypoxia increases lactate concentration at the endothelium, whereas bicarbonate concentration decreases. In both profiles, the effect of hypoxia decreases in the peripheral region due to limbal support. The limbus provides bicarbonate to the cornea and removes lactate. Similarly, glucose is supplied from the limbus, whereas hydrogen ions are removed from the cornea to the limbus. Meanwhile, oxygen and carbon dioxide concentrations at the endothelium correspond to those of the aqueous humor due to minimal resistance to the transport of these two metabolites between the aqueous humor and the endothelium. The peripheral-region endothelium undergoes very little change in metabolic concentrations during hypoxia, whereas significant change occurs in the central region. The significant metabolic concentrations change across the central corneal region but not in the peripheral region during hypoxia is the reason for reduced peripheral swelling despite the greater peripheral resistance to oxygen transport from the atmosphere with some lenses (e.g. SCL in Fig. 2) and the thicker cornea in the periphery.
Figure 6.
Central-to-peripheral concentration profiles at the endothelium for (A) bicarbonate and (B) lactate ions during SCL and SL wear. Vertical axis is the concentration in millimolar (mM). Horizontal axis is the lateral distance from the central cornea with the reference point (horizontal axis = 0) being the central cornea at the endothelial-anterior chamber interface.
Figure 7 provides swelling profiles calculated for the SL and SCL of two oxygen Dk values with and without limbal metabolic support. Interestingly, limbal metabolic support has a significant effect on mid-peripheral- and peripheral-region swellings, whereas no effect is evident in the central corneal region. Without limbal support, peripheral swelling with SL wear evidences a value greater than physiological overnight swelling of 4%. For both SL and SCL wear, maximum swelling occurs in the mid-peripheral region (i.e., 3–4 mm laterally away from the central cornea at the anterior epithelium surface). The location of the maximum swelling with lens wear depends on lens and PoLTF thicknesses because the localized swelling is determined by a combination of limbal metabolic support, of difference in localized oxygen demand of the cornea, and of different localized oxygen supply throughout the lens due to different lens oxygen Dk/L and PoLTF thickness profile. Maximum swelling, however, is shallow with minimal difference to that of the central cornea.
Figure 7.
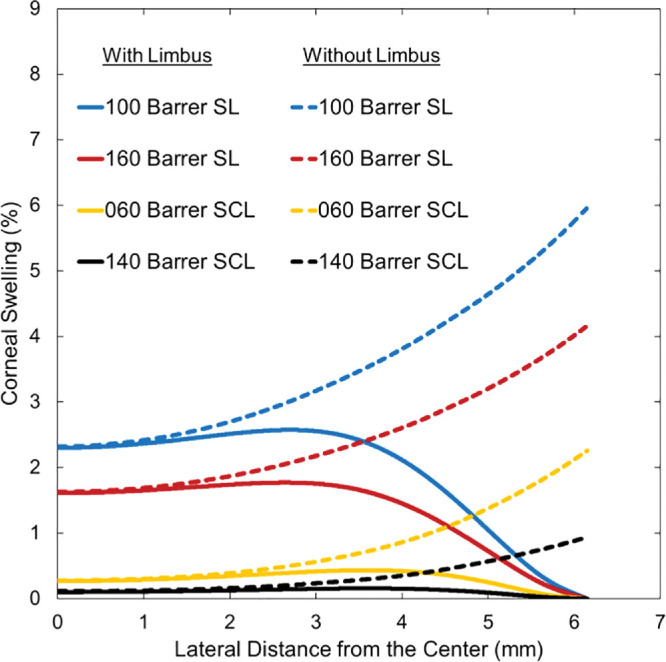
Corneal-swelling profiles from the center (horizontal axis = 0) to the peripheral cornea (horizontal axis = 6.15 mm) for SCL and SL wear. Solid lines represent predicted swelling with limbal metabolic support, whereas dashed lines represent predicted swelling without limbal metabolic support. Horizontal axis is the lateral distance from the central cornea to the peripheral cornea, with the reference point (horizontal axis = 0) being the central cornea at the anterior epithelial surface. Vertical axis is percentage of corneal swelling due to lens wear. Oxygen permeabilities of 100 and 160 Barrer for SLs are red and blue lines, respectively. Oxygen permeabilities of 60 and 140 Barrer for SCLs are yellow and black lines, respectively.
To assess whether limbal oxygen supply is the primary contributor to minimizing mid-peripheral- and peripheral-region swellings of the cornea during lens wear, comparative calculations were performed between no metabolic support, oxygen only support, and total metabolic support from the limbus. Results for a 100-Barrer oxygen Dk for SL wear are shown in Figure 8. There is no difference in swelling across the central corneal region because the effect of the limbus reaches only to the mid-peripheral region. Oxygen support from the limbus reduces peripheral swelling by approximately 1%, whereas the remaining 5% of the peripheral swelling is reduced by remaining metabolites, specifically lactate and bicarbonate ions. In fact, most of the 5% support from nonoxygen metabolites comes from supply of bicarbonate and removal of lactate ions from the limbus. Although the percentage of swelling reduced by limbal support varies with the lens oxygen Dk/L and type, the significant effect of limbal bicarbonate and lactate support is consistent for all types of lens designs.
Figure 8.
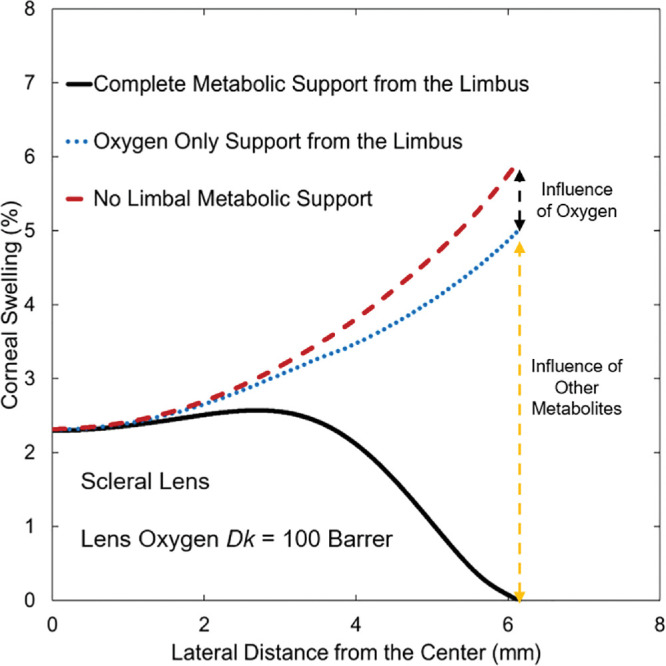
Predicted central-to-peripheral corneal-swelling profiles for 100-Barrer oxygen permeability SL wear indicating the contributions from limbal support. Horizontal axis is the lateral distance from the central cornea to the peripheral cornea, with the reference point (horizontal axis = 0) being the central cornea at the anterior epithelial surface. Vertical axis is percentage of corneal swelling. Red dashed line is for no metabolic support from the limbus; blue dashed line is for only oxygen support from the limbus; black line is for total metabolic support from the limbus.
Discussion
Figures 4 and 5 show expected metabolic behavior to different hypoxic conditions. Despite the same oxygen Dk of both lens types, the thicker lens and PoLTF of SLs result in increased resistance for oxygen delivery to the cornea. Thus SL wear shifts metabolism to more anaerobic reaction per Equation 1 than does SCL wear. This is apparent in Figures 5 and 6 in which there is a higher concentration of lactate and a lower concentration of bicarbonate with SL wear than with SCL wear. The changes in lactate and bicarbonate concentrations during hypoxia regulate the pump-leak mechanism and control swelling of the cornea.9 Therefore, oxygen supply from the atmosphere has an indirect effect on reducing swelling of the cornea. Lactate and bicarbonate concentrations primarily regulate edema.
Because the cornea thickens from the center to the periphery, the demand for oxygen rises in the peripheral region relative to that in the central region.14 Without limbal metabolic support, corneal swelling is the least at the center and grows steeply toward the periphery, as shown by the dashed lines in Figure 7. Reduction of this rapid rise is accomplished by metabolic support from the limbus. Supply of oxygen from the limbus indirectly reduces edema in the mid-peripheral and peripheral cornea similar to oxygen supply from the atmosphere. Figure 8, however, reveals that the effect of increased oxygenation from the limbus on edema is minor compared with the direct supply of bicarbonate and removal of lactate ions from the limbus. Surprisingly, the influence of limbal support in reducing edema is observed from the periphery to approximately 1 mm laterally away from the central cornea. Predicted corneal swelling profiles in Figure 7 show that limbal metabolic support has a significant effect in regulating stromal swelling for all types of contact-lens wear.
Papas16 reported that limbal blood flow increases during hypoxia. His observation is consistent with our findings. Because concentration differences between the limbal vasculature and the peripheral cornea is greater during corneal hypoxia, blood cells in the limbus deplete nutrients and carry away excess lactate at a faster rate than during normoxia. The body increases limbal blood circulation to expose more metabolite-fresh blood cells. Faster blood flow during contact-lens wear, quantified by Chen et al., further supports this explanation.46 Limbal metabolic support rather far into the cornea is not inconsistent with neovascularization during prolonged hypoxia. Even though the peripheral cornea is adequately suffused by the limbus, the limbal effect on edema is minimal at approximately 1 mm laterally away from the central cornea. Therefore, if the mid-peripheral region and/or the central corneal region is chronically hypoxic where the limbus cannot provide adequate support, new blood vessels will form in the peripheral region to provide sufficient nutrients to the central hypoxic regions.
Figure 7 reveals that the maximum swelling of the cornea occurs in the mid-peripheral region of the cornea. However, for current commercial contact lenses, oxygen Dk/Ls of the lens center and the mid-peripheral region are not different enough to cause a meaningful difference in swelling compared with that at the center during open-eye wear. That is, the maximum in swelling is shallow. Previous clinical1,32,41,47 and mathematical-modeling efforts9,11 of central corneal edema, therefore, provide satisfactory gauges of maximum edema during contact-lens wear for open eye. However, as the effect of oxygen tension on edema is significantly greater during extreme hypoxic states (e.g., closed-eye with lens oxygen Dk/L <20 hBarrer/cm for SL and <15 hBarrer/cm for SCL wear),1,11 a small difference in lens oxygen Dk/L from the center to mid-periphery may result in a large difference in edema between those regions if the cornea is undergoing significant hypoxia. For example, the model predicts a difference of approximately 1% swelling between dashed and dotted lines at approximately 1 mm away from the central cornea in Figure 3 despite a small difference of oxygen Dk/L (e.g., <0.5 hBarrer/cm) in that region. Because lens oxygen Dk/L can vary by more than 2 hBarrer/cm between the center and the mid-peripheral regions based on our SL thickness profile (Fig. 2), this could result in a significant difference in localized swelling. Therefore, detailed analyses of central-to-peripheral corneal edema may be warranted for closed-eye lens wear, as well as for lenses with significant regional variations in lens oxygen Dk/L.
We examined here only two different lens types with two different oxygen Dk/L. However, our model is capable of testing any lens type, design, shape, and oxygen Dk, as well as any PoLTF thickness profile. Also possible is the calculation of overnight lens-wear swelling. Metabolic support from the limbus with overnight lens wear behaves similarly to open-eye wear: 0% peripheral swelling with the central and mid-peripheral regions exhibiting greater than 4% swelling due to increased hypoxia. Our current model applies to healthy lens wearers with a healthy endothelium and limbus. However, with more information on diseased eye's metabolic transport through the endothelium and limbus, the metabolic model can be extended to determine lens-wear swelling for nonhealthy eyes.
Currently, the metabolic model does not incorporate tear exchange occurring with SCL wear48 and potential tear circulation11,49 with SL wear. Both mechanisms potentially provide additional support for oxygen delivery to the cornea. As wear of polymethyl methacrylate lenses, which have significantly more tear exchange than SCLs,48 results in more frequent cases of corneal hazing than during SCL wear,50 fresh tear exchange at the periphery with SCL wear cannot be a significant source of oxygen. For SL wear, one-third of the subjects from Tse et al.49 showed no fresh tear entering the PoLTF at the periphery (i.e., no tear exchange). There was no significant swelling differences between those subjects with and without tear exchange. However, tear circulation within the PoLTF for SL wear (Appendix B in Kim et al.11) redistributes oxygen from higher lens-oxygen Dk/L regions to lower lens-oxygen Dk/L regions. Further understanding is needed on the amount of oxygen delivered through tear exchange with SCL wear and on tear circulation within the PoLTF for SL wear. Because both mechanisms aid transport of oxygen to the cornea, our metabolic model provides a conservative estimate of corneal swelling.
To our knowledge, the proposed metabolic-edema model provides the first quantitative assessment of limbal metabolic support in reducing mid-peripheral and peripheral corneal edema. Corneal edema with contact-lens wear results in different localized swelling. Differences in localized swelling arise from the combined effects of oxygen Dk/L of the lens, PoLTF thickness profile, difference in localized oxygen demand of the cornea, and metabolic support from the limbus and anterior chamber. Because of the possibility of considerable lateral variations in swelling due to significant localized differences in lens oxygen Dk/L (e.g., with multi-Dk component contact lenses) and because of the possibility of small changes in oxygen Dk/L causing drastic changes in corneal swelling during sleep,11 it is prudent to consider localized corneal edema when assessing lens-wear safety for contact lenses with embedded components or during closed-eye wear.
Acknowledgments
Supported by Roberta J. Smith Research Fund (MCL), and UCB CRC Unrestricted Fund (MCL). Publication made possible in part by support from the Berkeley Research Impact Initiative (BRII) sponsored by the UC Berkeley Library.
Disclosure: Y.H. Kim, None; M.C. Lin, None; C.J. Radke, None
Appendix A. Appendix A. 2D Metabolic Conservation Equations
This appendix extends the 1D metabolic model of Leung et al.9 to 2D. Only those variables that have changed are introduced. We neglect water flow through the cornea so that use of the dry coordinate, ξ, is not necessary.9,11
Metabolic conservation of oxygen in the cornea is given in Equation A1; the conservation equation for oxygen in the PoLTF, contact lens, and the PrLTF is given in Equation A2. The difference in conservation equations between the different regions owes to the lack of metabolism in the PoLTF, the contact lens, and the PrLTF. A more detailed explanation can be found in the previously published work.9
| (A1) |
| (A2) |
Here JO is the 2D vector molar flux of the oxygen and is the 2D vector gradient operator with êx and êy the unit normal vectors in the lateral and sagittal rectangular directions, respectively. The dot following each gradient operator represents the scalar or inner product of two vectors. To ensure both sagittal and lateral transport of oxygen, the differential equations account for both directions, rather than just for the sagittal axis. Maximum baseline oxygen reaction rates for different corneal regions, , are given in Chhabra et al.8 while remaining variables in Equation A1 are defined in Leung et al.9
Conservation equations for sodium and chloride ions in the cornea read
| (A3) |
where JNa and JCl are vector molar fluxes for sodium and chloride ions, respectively. Because salt transport is minimal across the lens for SCLs and nonexistent for SLs, we do not need conservation statements for the lens, PoLTF, and PrLTF regions.
Conservation of lactate ion in the cornea is given by
| (A4) |
where JL is the vector molar flux for lactate ion. Minimum baseline lactate reaction rates, , for different corneal regions are given in Chhabra et al.8 Remaining variables in Equation A4 are defined in Leung et al.9 There are no corresponding equations for the lens, PoLTF, and PrLTF as metabolism is absent.
Conservation of glucose in the cornea is expressed by
| (A5) |
where JG is the vector molar flux of glucose. Glucose concentration is negligible in the remaining regions.
Coupled conservation expression for hydrogen and bicarbonate ions provided in Equation A6 follows the same derivation as those in previous works.9,11
| (A6) |
where JH and JB are the vector molar fluxes for hydrogen and bicarbonate ions, respectively. Buffering equilibrium reactions in the cornea remain the same as in Leung et al.9 We neglect bicarbonate buffering in the remaining regions. The small change in bicarbonate ion within the PoLTF has a small effect on the swelling.11
Conservation of carbon dioxide obeys the expressions
| (A7) |
and
| (A8) |
where JC is the vector molar flux for carbon dioxide. Similar to bicarbonate transport, we neglect carbon-dioxide buffering outside the cornea.
References
- 1. Holden BA, Mertz GW.. Critical oxygen levels to avoid corneal edema for daily and extended wear contact lenses. Invest Ophthalmol Vis Sci. 1984; 25: 1161–1167. [PubMed] [Google Scholar]
- 2. Polse KA, Mandell RB.. Critical oxygen tension at the corneal surface. Arch Ophthalmol. 1970; 84: 505–508. [DOI] [PubMed] [Google Scholar]
- 3. Fatt I. Steady-state distribution of oxygen and carbon dioxide in the in vivo cornea. II. The open eye in nitrogen and the covered eye. Exp Eye Res. 1968; 7: 413–430. [DOI] [PubMed] [Google Scholar]
- 4. Fatt I, Bieber MT.. The steady-state distribution of oxygen and carbon dioxide in the in vivo cornea. I. The open eye in air and the closed eye. Exp Eye Res. 1968; 7: 103–112. [DOI] [PubMed] [Google Scholar]
- 5. Fatt I, Freeman RD, Lin D. Oxygen tension distributions in the cornea: a re-examination. Exp Eye Res. 1974; 18: 357–365. [DOI] [PubMed] [Google Scholar]
- 6. Fatt I, Lin D.. Spatial distribution of oxygen in the cornea of a closed eye wearing a gas permeable contact lens. Curr Eye Res. 1985; 4: 723–724. [DOI] [PubMed] [Google Scholar]
- 7. Harvitt DM, Bonanno JA.. Re-evaluation of the oxygen diffusion model for predicting minimum contact lens Dk/t values needed to avoid corneal anoxia. Optom Vis Sci. 1999; 76: 712–719. [DOI] [PubMed] [Google Scholar]
- 8. Chhabra M, Prausnitz JM, Radke CJ. Modeling corneal metabolism and oxygen transport during contact lens wear. Optom Vis Sci. 2009; 86: 454–466. [DOI] [PubMed] [Google Scholar]
- 9. Leung BK, Bonanno JA, Radke CJ. Oxygen-deficient metabolism and corneal edema. Prog Retin Eye Res. 2011; 30: 471–492. [DOI] [PMC free article] [PubMed] [Google Scholar]
- 10. Maurice DM. The location of the fluid pump in the cornea. J Physiol. 1972; 221: 43–54. [DOI] [PMC free article] [PubMed] [Google Scholar]
- 11. Kim YH, Tan B, Lin MC, Radke CJ. Central corneal edema with scleral-lens wear. Curr Eye Res. 2018; 43: 1305–1315. [DOI] [PubMed] [Google Scholar]
- 12. Alvord LA, Hall WJ, Keyes LD, Morgan CF, Winterton LC. Corneal oxygen distribution with contact lens wear. Cornea. 2007; 26: 654–664. [DOI] [PubMed] [Google Scholar]
- 13. Feizi S, Jafarinasab MR, Karimian F, Hasanpour H, Masudi A. Central and peripheral corneal thickness measurement in normal and keratoconic eyes using three corneal pachymeters. J Ophthalmic Vis Res. 2014; 9: 296–304. [DOI] [PMC free article] [PubMed] [Google Scholar]
- 14. Takatori SC, Radke CJ.. A quasi-2-dimensional model for respiration of the cornea with soft contact lens wear. Cornea. 2012; 31: 405–417. [DOI] [PubMed] [Google Scholar]
- 15. Waltman ST. The cornea. In: Moses RA, ed. Alder's Physiology of the Eye. 7th ed. Maryland Heights, MO: C.V. Mosby Co; 1981: 38–48. [Google Scholar]
- 16. Papas EB. The role of hypoxia in the limbal vascular response to soft contact lens wear. Eye Contact Lens Sci Clin Pract. 2003; 29: S72–S74. [DOI] [PubMed] [Google Scholar]
- 17. Martin R, de Juan V, Rodriguez G, Fonseca S, Martin S. Contact lens-induced corneal peripheral swelling: orbscan repeatability. Optom Vis Sci. 2009; 86: 340–349. [DOI] [PubMed] [Google Scholar]
- 18. Dunne MCM, Davies LN, Wolffsohn J. Accuracy of cornea and lens biometry using anterior segment optical coherence tomography. J Biomed Opt. 2007; 12: 064023. [DOI] [PubMed] [Google Scholar]
- 19. Marsich MM, Bullimore MA.. The repeatability of corneal thickness measures. Cornea. 2000; 19: 792–795. [DOI] [PubMed] [Google Scholar]
- 20. Lam AK, Chen D. Pentacam pachometry: comparison with non-contact specular microscopy on the central cornea and inter-session repeatability on the peripheral cornea. Clin Exp Optom. 2007; 90: 108–114. [DOI] [PubMed] [Google Scholar]
- 21. Miranda MA, Radhakrishnan H, O'Donnell C. Repeatability of corneal thickness measured using an oculus pentacam. Optom Vis Sci. 2009; 86: 266–272. [DOI] [PubMed] [Google Scholar]
- 22. Westphal V, Rollins AM, Radhakrishnan S, Izatt JA. Correction of geometric and refractive image distortions in optical coherence tomography applying Fermat's principle. Opt Express. 2002; 10: 397–404. [DOI] [PubMed] [Google Scholar]
- 23. Herse P, Akakura N, Ooi C. Topographical cornea edema: an update. Acta Ophthalmol. 1993; 71: 539–543. [DOI] [PubMed] [Google Scholar]
- 24. Bonanno JA, Polse KA.. Central and peripheral corneal swelling accompanying soft lens extended wear. Am J Optom Physiol Opt. 1985; 62: 74–81. [DOI] [PubMed] [Google Scholar]
- 25. Holden BA, McNally JJ, Mertz GW. Topographical corneal oedema. Acta Ophthalmol. 1985; 63: 684–691. [DOI] [PubMed] [Google Scholar]
- 26. Wang J, Fonn D, Simpson TL. Topographical thickness of the epithelium and total cornea after hydrogel and PMMA contact lens wear with eye closure. Invest Ophthalmol Vis Sci. 2003; 44: 1070–1074. [DOI] [PubMed] [Google Scholar]
- 27. Grytz R, Meschke G, Jonas JB. The collagen fibril architecture in the lamina cribrosa and peripapillary sclera predicted by a computational remodeling approach. Biomech Model Mechanobiol. 2011; 10: 371–382. [DOI] [PubMed] [Google Scholar]
- 28. Sridhar MS. Anatomy of cornea and ocular surface. Indian J Ophthalmol. 2018; 66: 190–194. [DOI] [PMC free article] [PubMed] [Google Scholar]
- 29. Lira M, Pereira C, Real Oliveira MECD, Castanheira EMS. Importance of contact lens power and thickness in oxygen transmissibility. Cont Lens Anterior Eye. 2015; 38: 120–126. [DOI] [PubMed] [Google Scholar]
- 30. Wang J, Fonn D, Simpson TL, Jones L. Precorneal and pre- and postlens tear film thickness measured indirectly with optical coherence tomography. Invest Ophthalmol Vis Sci. 2003; 44: 2524–2528. [DOI] [PubMed] [Google Scholar]
- 31. Nichols JJ, King-Smith PE.. Thickness of the pre- and post-contact lens tear film measured in vivo by interferometry. Invest Ophthalmol Vis Sci. 2003; 44: 68–77. [DOI] [PubMed] [Google Scholar]
- 32. Tan B, Zhou Y, Yuen TL, Lin K, Michaud L, Lin MC. Effects of scleral-lens tear clearance on corneal edema and post-lens tear dynamics: a pilot study. Optom Vis Sci. 2018; 95: 481–490. [DOI] [PubMed] [Google Scholar]
- 33. Kuang K, Xu M, Koniarek J, Fischbarg J. Effects of ambient bicarbonate, phosphate and carbonic anhydrase inhibitors on fluid transport across rabbit corneal endothelium. Exp Eye Res. 1990; 50: 487–493. [DOI] [PubMed] [Google Scholar]
- 34. Klyce SD. Stromal lactate accumulation can account for corneal oedema osmotically following epithelial hypoxia in the rabbit. J Physiol. 1981; 321: 49–64. [DOI] [PMC free article] [PubMed] [Google Scholar]
- 35. Li L, Tighe B.. Numerical simulation of corneal transport processes. J R Soc Interface. 2006; 3: 303–310. [DOI] [PMC free article] [PubMed] [Google Scholar]
- 36. US Food and Drug Association. Investigations operations manual 2019: blood serum chemistry–normal values. 2019: Appendix C 6-7. Available at: https://www.fda.gov/media/75271/download. Accessed September 03, 2019.
- 37. Goodwin ML, Harris JE, Hernandez A, Gladden LB. Blood lactate measurements and analysis during exercise: a guide for clinicians. J Diabetes Sci Technol. 2007; 1: 558–569. [DOI] [PMC free article] [PubMed] [Google Scholar]
- 38. Brennan NA. Beyond flux: total corneal oxygen consumption as an index of corneal oxygenation during contact lens wear. Optom Vis Sci. 2005; 82: 467–472. [DOI] [PubMed] [Google Scholar]
- 39. Bonanno JA, Polse KA.. Corneal acidosis during contact lens wear: effects of hypoxia and CO2. Invest Ophthalmol Vis Sci. 1987; 28: 1514–1520. [PubMed] [Google Scholar]
- 40. Giasson C, Bonanno JA.. Corneal epithelial and aqueous humor acidification during in vivo contact lens wear in rabbits. Invest Ophthalmol Vis Sci. 1994; 35: 851–861. [PubMed] [Google Scholar]
- 41. Tan B, Tse V, Kim YH, Lin K, Zhou Y, Lin MC. Effects of scleral-lens oxygen transmissibility on corneal thickness: a pilot study. Cont Lens Anterior Eye. 2019; 42: 366–372. [DOI] [PubMed] [Google Scholar]
- 42. Hitzenberger CK, Baumgartner A, Drexler W, Fercher AF. Interferometric measurement of corneal thickness with micrometer precision. Am J Ophthalmol. 1994; 118: 468–476. [DOI] [PubMed] [Google Scholar]
- 43. Oculus. Oculus Pentacam HR interpretation guide. 3rd ed. Available at: https://www.pentacam.com/fileadmin/user_upload/pentacam.de/downloads/interpretations-leitfaden/interpretation_guideline_3rd_edition_0915.pdf. Accessed August 08, 2018.
- 44. Tomey Inc. Operation Manual Handy Pachymeter SP-100. Available at: http://www.frankshospitalworkshop.com/equipment/documents/ophthalmology/user_manuals/Tomey%20SP-100%20Pachymeter%20-%20User%20manual.pdf. Accessed August 08, 2018.
- 45. Tan B, Graham AD, Tsechpenakis G, Lin MC. A novel analytical method using OCT to describe the corneoscleral junction. Optom Vis Sci. 2014; 91: 650–657. [DOI] [PubMed] [Google Scholar]
- 46. Chen W, Xu Z, Jiang H, Zhou J, Wang L, Wang J. Altered bulbar conjunctival microcirculation in response to contact lens wear. Eye Contact Lens. 2017; 43: 95–99. [DOI] [PMC free article] [PubMed] [Google Scholar]
- 47. Vincent SJ, Alonso-Caneiro D, Collins MJ, et al.. Hypoxic corneal changes following eight hours of scleral contact lens wear. Optom Vis Sci. 2016; 93: 293–299. [DOI] [PubMed] [Google Scholar]
- 48. Creech JL, Chauhan A, Radke CJ. Dispersive mixing in the posterior tear film under a soft contact lens. Ind Eng Chem Res. 2001; 40: 3015–3026. [Google Scholar]
- 49. Tse V, Tan B, Kim YH, Zhou Y, Lin MC. Tear dynamics under scleral lenses. Cont Lens Anterior Eye. 2019; 42: 43–48. [DOI] [PubMed] [Google Scholar]
- 50. Efron N. Contact lens-induced corneal oedema. Optician. 1996; 211: 1–8. [Google Scholar]


