

SUMMARY
Heterotrimeric G-proteins (Gαβγ) are the main transducers of signals from GPCRs, thereby mediating the action of countless natural stimuli and therapeutic agents. However, there are currently no robust approaches to directly measure the activity of endogenous G-proteins in cells. Here, we describe a suite of optical biosensors that detect endogenous active G-proteins with sub-second resolution in live cells. Using a modular design principle, we developed genetically-encoded, unimolecular biosensors for endogenous Gα-GTP and free Gβγ: the two active species of heterotrimeric G-proteins. This design was leveraged to generate biosensors with specificity for different heterotrimeric G-proteins or for other G-proteins like Rho GTPases. Versatility was further validated by implementing the biosensors in multiple contexts, from characterizing cancer-associated G-protein mutants to neurotransmitter signaling in primary neurons. Overall, the versatile biosensor design introduced here enables the study of the activity of endogenous G-proteins in live cells with high fidelity, temporal resolution, and convenience.
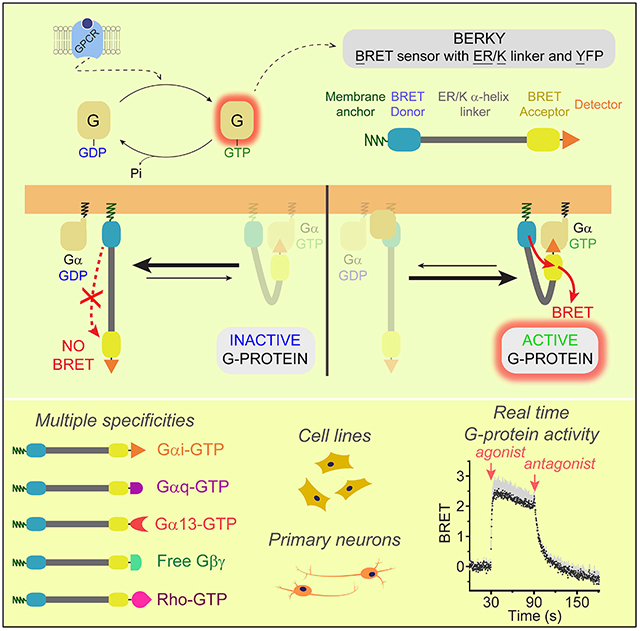
Graphical Abstract
In Brief
A suite of modular optical biosensors enables detection of G protein activity in live cells in contexts ranging from tumor cells to primary neurons.
INTRODUCTION
GPCRs are a large family of membrane proteins that initiate cellular responses to a wide range of extracellular signals, like neurotransmitters, hormones or photons (Gilman, 1987). Consequently, they are critical for many physiological processes and their dysregulation frequently leads to human disease (Dorsam and Gutkind, 2007; Farfel et al., 1999; Gilman, 1987; O'Hayre et al., 2013), which is also in agreement with the fact that >30% of FDAapproved drugs target GPCRs (Sriram and Insel, 2018). The main mechanism of action of GPCRs is through the activation of heterotrimeric G-proteins, although mounting evidence indicates that they can also signal through coupling to arrestins (Weis and Kobilka, 2018). The defining event in G-protein activation is the exchange of GDP for GTP on the Gα subunit of Gαβγ heterotrimers, which is catalyzed by the Guanine-nucleotide Exchange Factor (GEF) activity of ligand-activated GPCRs. A consequence of nucleotide exchange is that Gα-GTP and Gβγ dissociate (or rearrange), such that both become active signaling species competent for engaging their respective effectors. In broad strokes, the specific signaling pathways modulated by Gα-GTP subunits depend on the G-protein family to which they belong (Gi/o, Gq/11, G12/13, and Gs based on structural conservation). Signaling is turned off by the intrinsic GTPase activity of Gα, leading to re-association of Gα with Gβγ. In addition, the duration and amplitude of G-protein signaling is controlled by many accessory proteins that bind G-proteins and add layers of complexity to the regulation of their activity (De Vries et al., 2000; Dohlman and Thorner, 1997; Druey et al., 1996; Ross and Wilkie, 2000; Siderovski and Willard, 2005). This includes Guanine-nucleotide Dissociation Inhibitors (GDIs) (Sato et al., 2006; Willard et al., 2004), which bind Gα and lock it in an inactive GDP-bound state, and GTPase-Activating Proteins (GAPs) (Ross and Wilkie, 2000), which accelerate the rate of GTP hydrolysis by Gα, as well as other regulators like non-receptor GEFs (Cismowski et al., 2000; DiGiacomo et al., 2018; Garcia-Marcos et al., 2009, 2015; Tall, 2013).
Developing tools to monitor G-protein activity with high fidelity and precision is crucial to elucidate the mode of action of many neurotransmitters, hormones or drugs, and to discover novel therapeutic agents. Studying downstream events (e.g., second messengers) as a proxy for G-protein activation has significant caveats, as fidelity is compromised by pathway crosstalk and signal amplification events. Historically, the development of ratiometric Fluorescence or Bioluminescence Resonance Energy Transfer (FRET or BRET) biosensors allowed a more direct, sensitive and precise measurement of G-protein activity in live cells (Lohse et al., 2012). Early studies showed that fusing FRET or BRET donor/acceptor pairs to Gα and Gβγ enabled the detection of GPCR-mediated G-protein activation (Bunemann et al., 2003; Gales et al., 2006; Gibson and Gilman, 2006; Janetopoulos et al., 2001). The rationale behind the design of these biosensors is that RET is highly dependent on the distance and orientation of donor and acceptor molecules, such that Gα-Gβγ dissociation and/or rearrangement upon activation leads to changes in FRET or BRET. Another RET biosensor design was introduced later (Hollins et al., 2009), in which activation-induced Gα-Gβγ dissociation was detected using the C-terminal region of GRK3 fused to a RET donor as a separate “detector module” for free Gβγ tagged with a RET acceptor.
Despite the tremendous utility of RET-based biosensors for trimeric G-protein activity developed to date, they still have significant limitations. Current RET-based biosensors can only measure Gα-Gβγ subunit dissociation but not Gα-GTP formation, which would be the most direct readout of the defining event in GPCR-mediated activation, i.e. nucleotide exchange. Although Gα-Gβγ rearrangement and nucleotide exchange on Gα tend to correlate, there are modes of G-protein regulation that cannot be captured by looking at Gα-Gβγ rearrangement alone. For example, GoLoco GDIs are believed to modulate GPCR signaling by blocking Gα-GTP formation while promoting Gα-Gβγ dissociation (Willard et al., 2004), and Ric-8 non-receptor GEFs promote Gα-GTP formation only on monomeric Gα but not on Gα-Gβγ complexes (Tall et al., 2003). Another major caveat is that existing RET-based biosensors require the overexpression of exogenous G-proteins (usually tagged with bulky fluorescent or luminescent proteins) to detect their activity, which compromises the fidelity of readouts. In other words, the inclusion of G-proteins as integral biosensor components precludes the direct assessment of the activity of endogenous G-proteins in their native, physiological environment in the cell. Moreover, these biosensors require the simultaneous overexpression of three to four genetic components: Gα, Gβ, Gγ, and, sometimes (Hollins et al., 2009), a detector module, which limits their use to systems in which genetic manipulation is easy. Consequently, the vast majority of work with G-protein biosensors uses easily transfectable cell lines (e.g., HEK293), which are not necessarily relevant for many physiological processes controlled by GPCRs and leading in most cases to the need for overexpressing exogenous GPCRs. As a consequence, the ultimate goal of translating discoveries on the cell biology and pharmacology of GPCR signaling into clinically relevant applications is compromised.
To our knowledge, there is no biosensor capable of detecting endogenous active G-proteins under fully native conditions (e.g., with endogenous GPCRs). We set out to develop RET-based ratiometric biosensors for detecting endogenous, bona fide active G-protein species (i.e. both Gα-GTP and free Gβγ) in live cells. Here, we start by describing the design of a bi-molecular BRET biosensor that can detect exogenous Gα-GTP species of the Gi/o family with high fidelity, specificity and temporal resolution. Then, we convert this Gα-GTP probe into a unimolecular design to demonstrate that a biosensor made of a single genetic component can quantitatively detect the activation of endogenously expressed G-proteins without compromising downstream signaling. By leveraging this two-step approach and the modular design of our biosensors, we further developed additional biosensors for endogenous Gα-GTP species of the Gq/11 or G12/13 families, for endogenous free Gβγ, or even for G-proteins not directly coupled to GPCRs. We implemented our suite of biosensors to capture modes of G-protein modulation untractable by preexisting biosensors, to define the properties of previously uncharacterized cancer-associated G-protein mutants, and to directly detect the activation of many endogenous GPCR/G-protein complexes across several cell types, including physiologically relevant models such as primary neuronal cultures.
RESULTS AND DISCUSSION
Direct and specific detection of Gαi-GTP
Our first goal was to develop a probe to detect Gα-GTP species as a direct measure of G-protein activity. For this, we sought to identify suitable biosensor components in a bi-molecular BRET format with exogenously expressed G-proteins. We envisioned the design of a bi-molecular BRET-based biosensor for Gαi-GTP inspired by a previously described free Gβγ biosensor (Hollins et al., 2009). A BRET acceptor (yellow fluorescent protein, YFP) is inserted into Gαi at an internal position that does not compromise activity (helical domain b/c loop) (Gibson and Gilman, 2006), and the BRET donor nanoluciferase (Nluc) (Hall et al., 2012) is fused to a separate “detector module” with a membrane targeting sequence. We reasoned that the ideal detector module should (i) bind Gαi-GTP but not Gαi-GDP or other Gα proteins to have specificity, (ii) bind with high affinity (but reversibly) to be sensitive, and (iii) have little or no effect on the activity of the target G-protein to report activity with fidelity (Fig. 1A). Through mining the literature we identified the synthetic peptide KB-1753 as a candidate that fulfills all of these criteria (Johnston et al., 2006). KB-1753 binds reversibly to GTP-loaded Gαi1, 2 or 3 (Kd ~1 μM) but not to Gαi-GDP or other Gα subunits, and has no impact on intrinsic nucleotide exchange or hydrolysis by Gαi (Johnston et al., 2006). HEK293T cells co-expressing KB-1753-Nluc and Gαi3-YFP/Gβγ displayed a rapid increase in BRET upon agonist-mediated activation of the GPCR α2A-adrenergic receptor (α2A-AR), which rapidly returned to basal levels upon antagonist addition (Fig. 1A, B). Agonist dose-dependence curves (Fig. 1B, C) revealed an EC50 similar to previously reported values using other readouts or the ligand-receptor binding constant (Harding et al., 2018). Equivalent observations were made with another Gi-coupled GPCR, the μ-opioid receptor (MOR) (Fig. S1A, B). These results show that the newly designed Gαi-GTP biosensor can detect GPCR-regulated G-protein activity with high fidelity and sensitivity, as it captures characteristic rapid kinetics of G-protein activation/ deactivation, and agonist potency.
Figure 1. Direct detection of GTP-bound Gαi in cells.
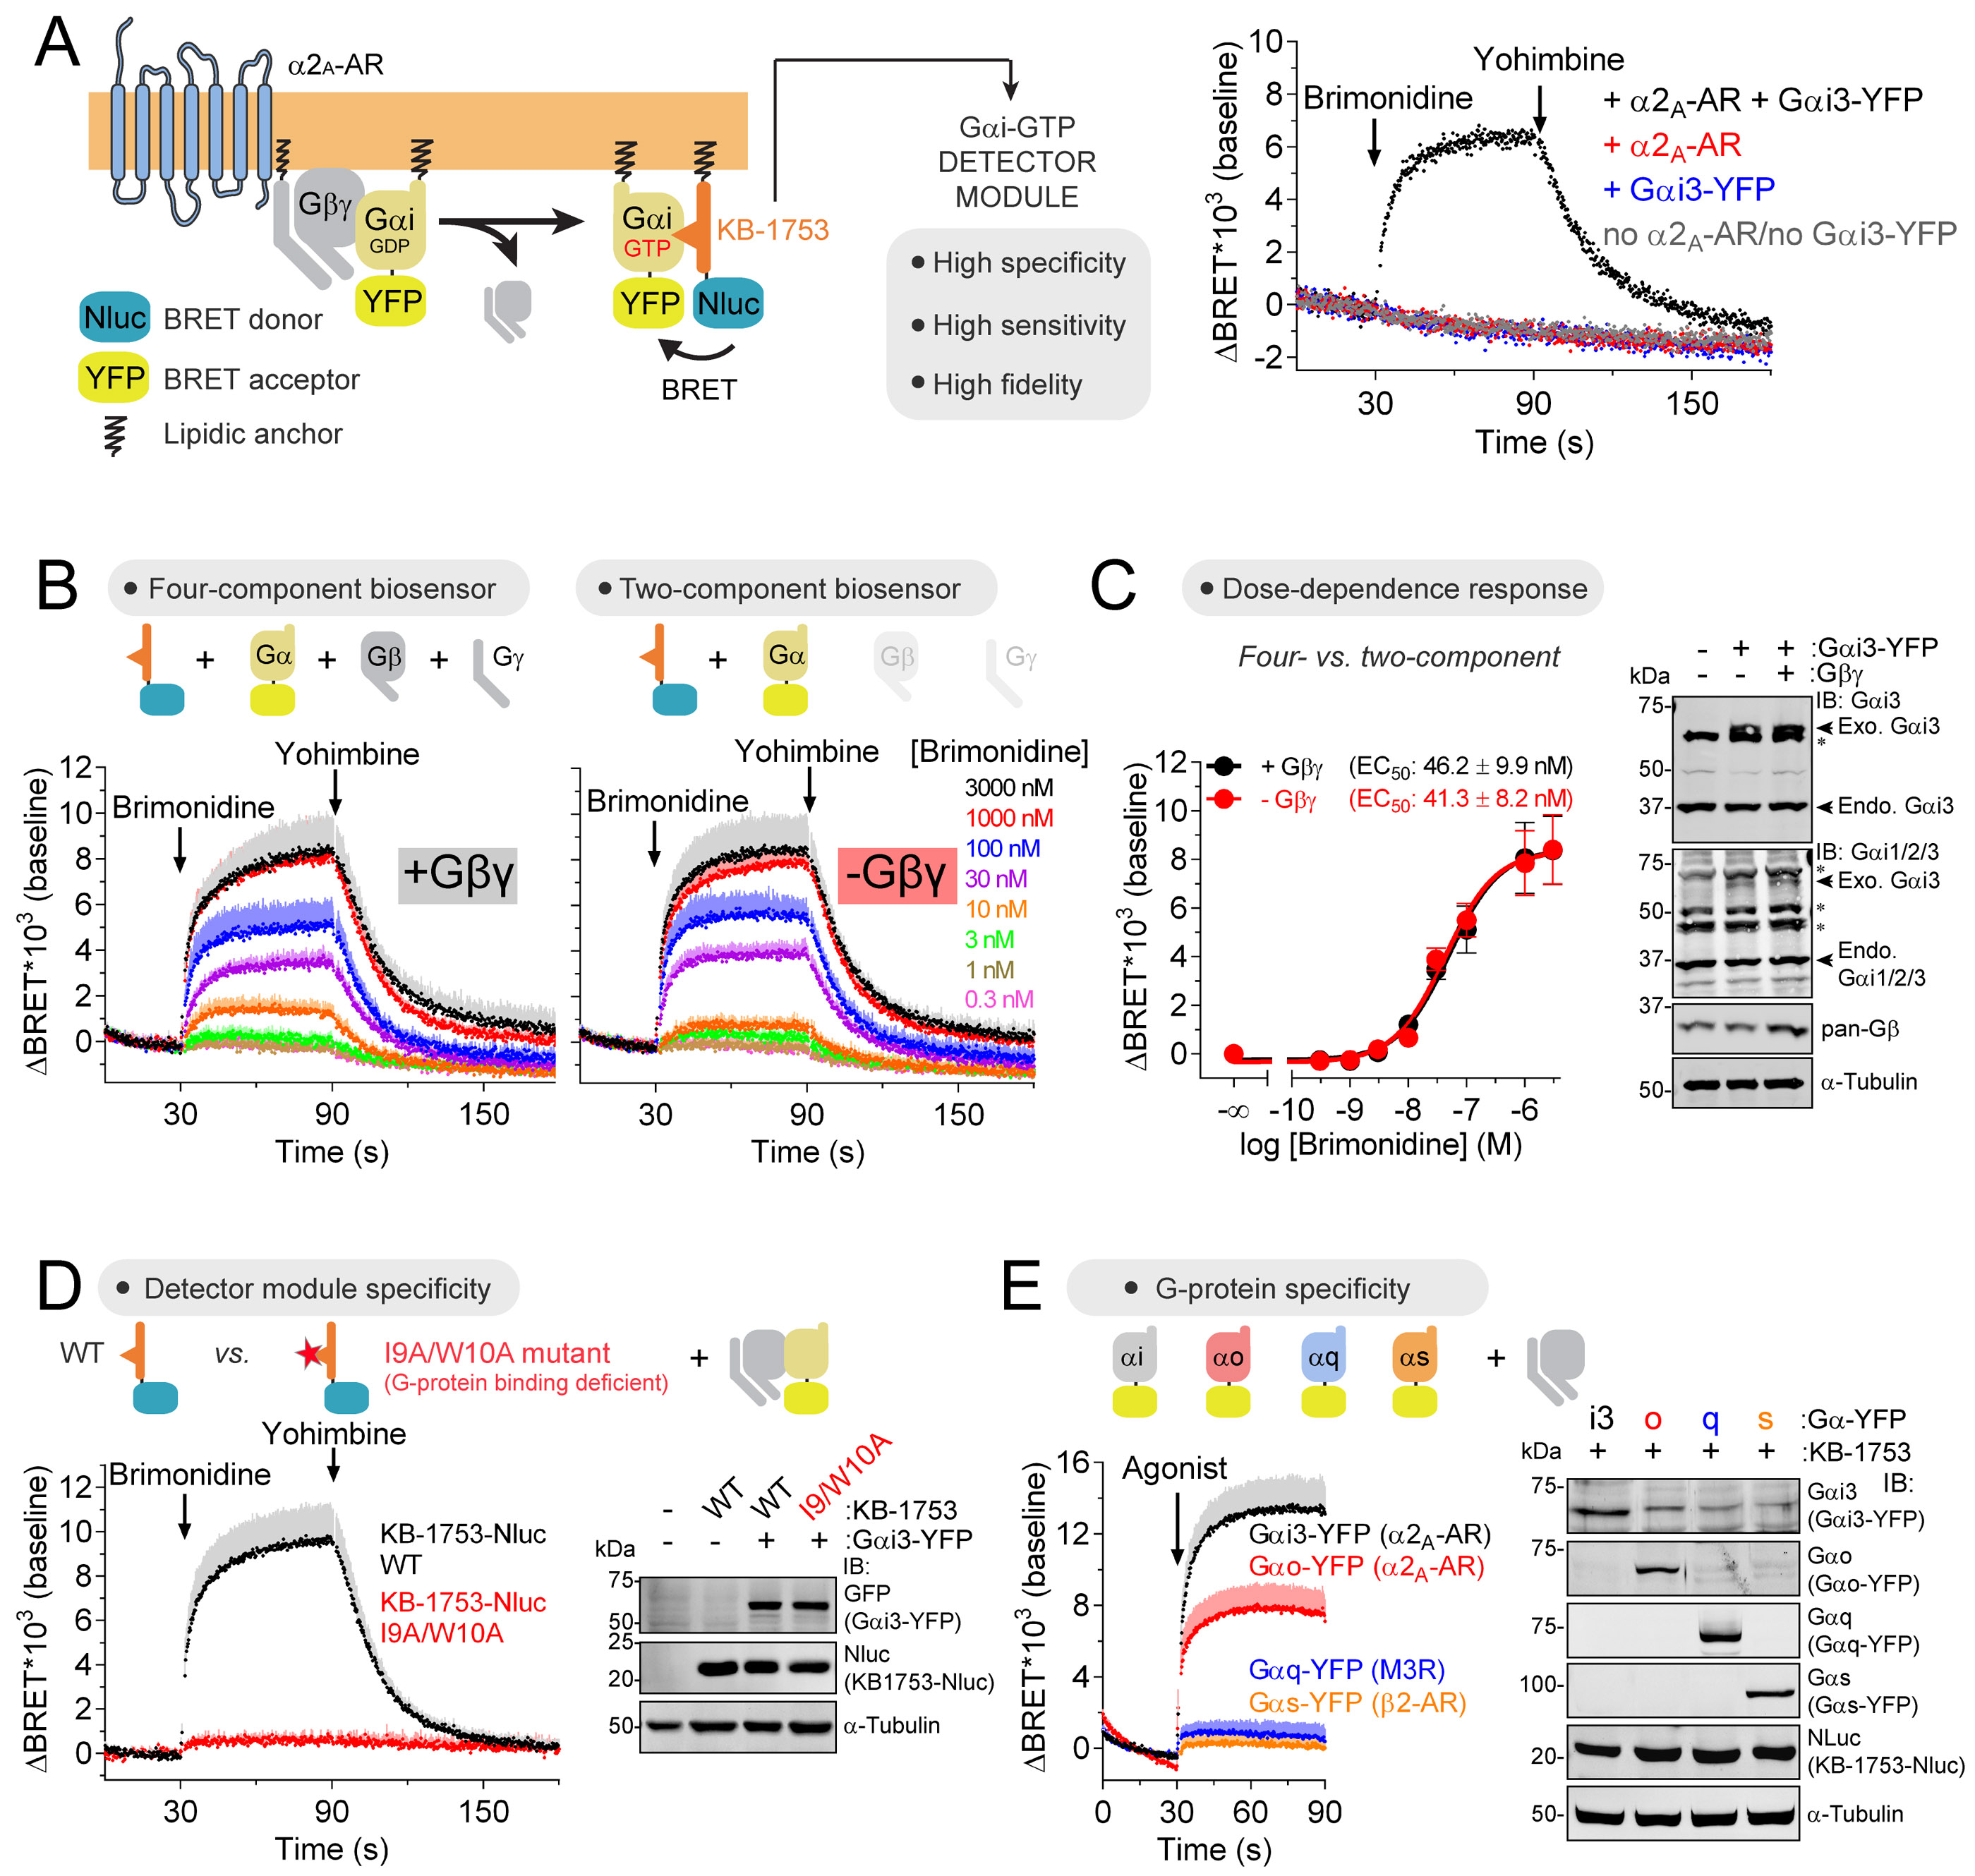
(A) Gαi-GTP biosensor design principle and representative traces of BRET measurements in HEK293T cells expressing KB-1753-Nluc along with the indicated constructs. Brimonidine= 0.1 μM/ Yohimbine= 100 μM.
(B, C) Agonist dose-dependent Gαi-GTP responses using four- or two-component biosensors in HEK293T cells expressing α2A-AR. Mean ± S.E.M, n= 4. In B, S.E.M. is displayed as bars of lighter color tone than data points and only in the positive direction for clarity. Exo.= exogenous, Endo.= endogenous, *= non-specific immunoreactive band.
(D) Loss of Gαi-GTP response upon mutation of KB-1753-Nluc. Brimonidine= 1 μM/ Yohimbine= 100 μM. Mean ± S.E.M, n= 3-6.
(E) Detection of Gαi-GTP and Gαo-GTP but not Gαq-GTP or Gαs-GTP responses by KB-1753-Nluc upon GPCR agonist stimulation. Cells expressing G-proteins with the indicated cognate GPCRs were agonist-stimulated as follows: Gαi3/Gαo, 5 μM brimonidine; Gαq, 100 μM carbachol; Gαs, 100 μM isoproterenol. Mean ± S.E.M, n= 4.
See also Figure S1.
We wondered whether the number of genetic components used for this biosensor design could be reduced in half by eliminating Gβ and Gγ from the co-transfections with Gαi3-YFP and KB-1753-Nluc. Indeed, the responses to α2A-AR (Fig. 1B, C) or MOR (Fig. S1A, B) stimulation were the same in cells with or without Gβ/Gγ co-transfection. This suggests that exogenously expressed Gαi3-YFP associates with endogenous Gβγ subunits to yield functional Gαβγ trimers that are activated by GPCRs, and that overexpression of Gβ and Gγ can be omitted. We also found that co-expression of the Gαi chaperone Ric-8A increased Gαi3-YFP expression and associated BRET responses, but that this effect was too marginal to warrant its inclusion as an additional genetic component of the biosensor system (Fig. S1D).
We confirmed the specificity of the biosensor by showing that a KB-1753 mutation known to disrupt G-protein binding (Johnston et al., 2006) also prevented agonist-induced BRET increase upon GPCR stimulation (Fig. 1D, Fig. S1C). Moreover, BRET responses were observed in cells expressing Gα-subunits of the Gi/o family (Gαi3-YFP and Gαo-YFP) but not of other families, such as Gαq-YFP or Gαs-YFP, upon stimulation of their cognate GPCRs (Fig. 1E), despite confirmation of robust Gq or Gs activation using a free Gβγ biosensor that is agnostic to the Gα subtype (Hollins et al., 2009; Masuho et al., 2015) (Fig. S1E). Overall, these controls rule out that BRET responses observed with the Gαi3-YFP/ KB-1753 pair are due to non-specific interactions between these membrane-associated components, indicating instead that the BRET responses reflect specific interactions between the KB-1753 detector module and its target G-protein.
Gαi-GTP biosensor directly monitors the GDI activity of GoLoco motifs
As a proof of principle for the utility of the Gαi-GTP biosensor to capture features of G-protein regulation not captured by Gα-Gβγ dissociation biosensors, we implemented it to study the function of GoLoco motifs. These are protein sequences that confer GDI activity towards Gαi proteins in vitro, i.e. they block the formation of Gαi-GTP by precluding nucleotide exchange (Sato et al., 2006; Willard et al., 2004). However, GoLoco motifs also cause the dissociation of Gβγ from Gαi in the absence of nucleotide exchange (Ghosh et al., 2003; Webb et al., 2005). To date, it has not been possible to directly determine if GoLoco motifs work as GDIs in cells to preclude Gαi-GTP formation. To address this point, we used a previously described (Parag-Sharma et al., 2016) synthetic biology approach to control the activity of the GoLoco motif of RGS12 (R12-GoLoco) (Kimple et al., 2002) in HEK293T cells expressing either Gαi-GTP or free Gβγ biosensors (Fig. 2A). Essentially, we used rapamycin-induced dimerization to “activate” R12-GoLoco by recruiting it from the cytosol to membranes, thereby bringing the G-protein regulator in close proximity to its membrane-bound substrate Gαi (Parag-Sharma et al., 2016) (Fig. 2A). Consistent with the previously reported ability of GoLoco motifs to dissociate Gα-Gβγ in vitro and promote Gβγ-dependent signaling in yeast, rapamycin caused a rapid BRET increase in cells expressing the free Gβγ biosensor (Fig. 2B). In contrast, no change in BRET was observed upon rapamycin stimulation of cells expressing the Gαi-GTP biosensor (Fig. 2B). Together, these findings indicate that R12-GoLoco can promote the release of Gβγ in the absence of nucleotide exchange. Next, we investigated the effects of R12-GoLoco under conditions of active nucleotide exchange (Fig. 2C). Although R12-GoLoco is a GDI in vitro and would be expected to dampen GPCR-initiated G-protein activity, we found that addition of rapamycin after GPCR stimulation further enhanced the BRET response in cells expressing the free Gβγ biosensor (Fig. 2C). This can be explained by the ability of GoLoco motifs to further promote Gα-Gβγ dissociation independent of nucleotide exchange (Fig. 2B). Only in cells expressing the Gαi-GTP biosensor we captured the inhibition of GPCR-mediated activation that would be expected from a GDI (Fig. 2C), thereby providing direct evidence in cells for the GDI activity of GoLoco motifs previously characterized biochemically in vitro. These results indicate that Gαi-GTP biosensors can capture modes of G-protein regulation in cells that cannot be captured by biosensors that detect Gα-Gβγ dissociation, such as the GDI activity of GoLoco motifs.
Figure 2. Differential regulation of free Gβγ and Gαi-GTP levels by GoLoco motifs.
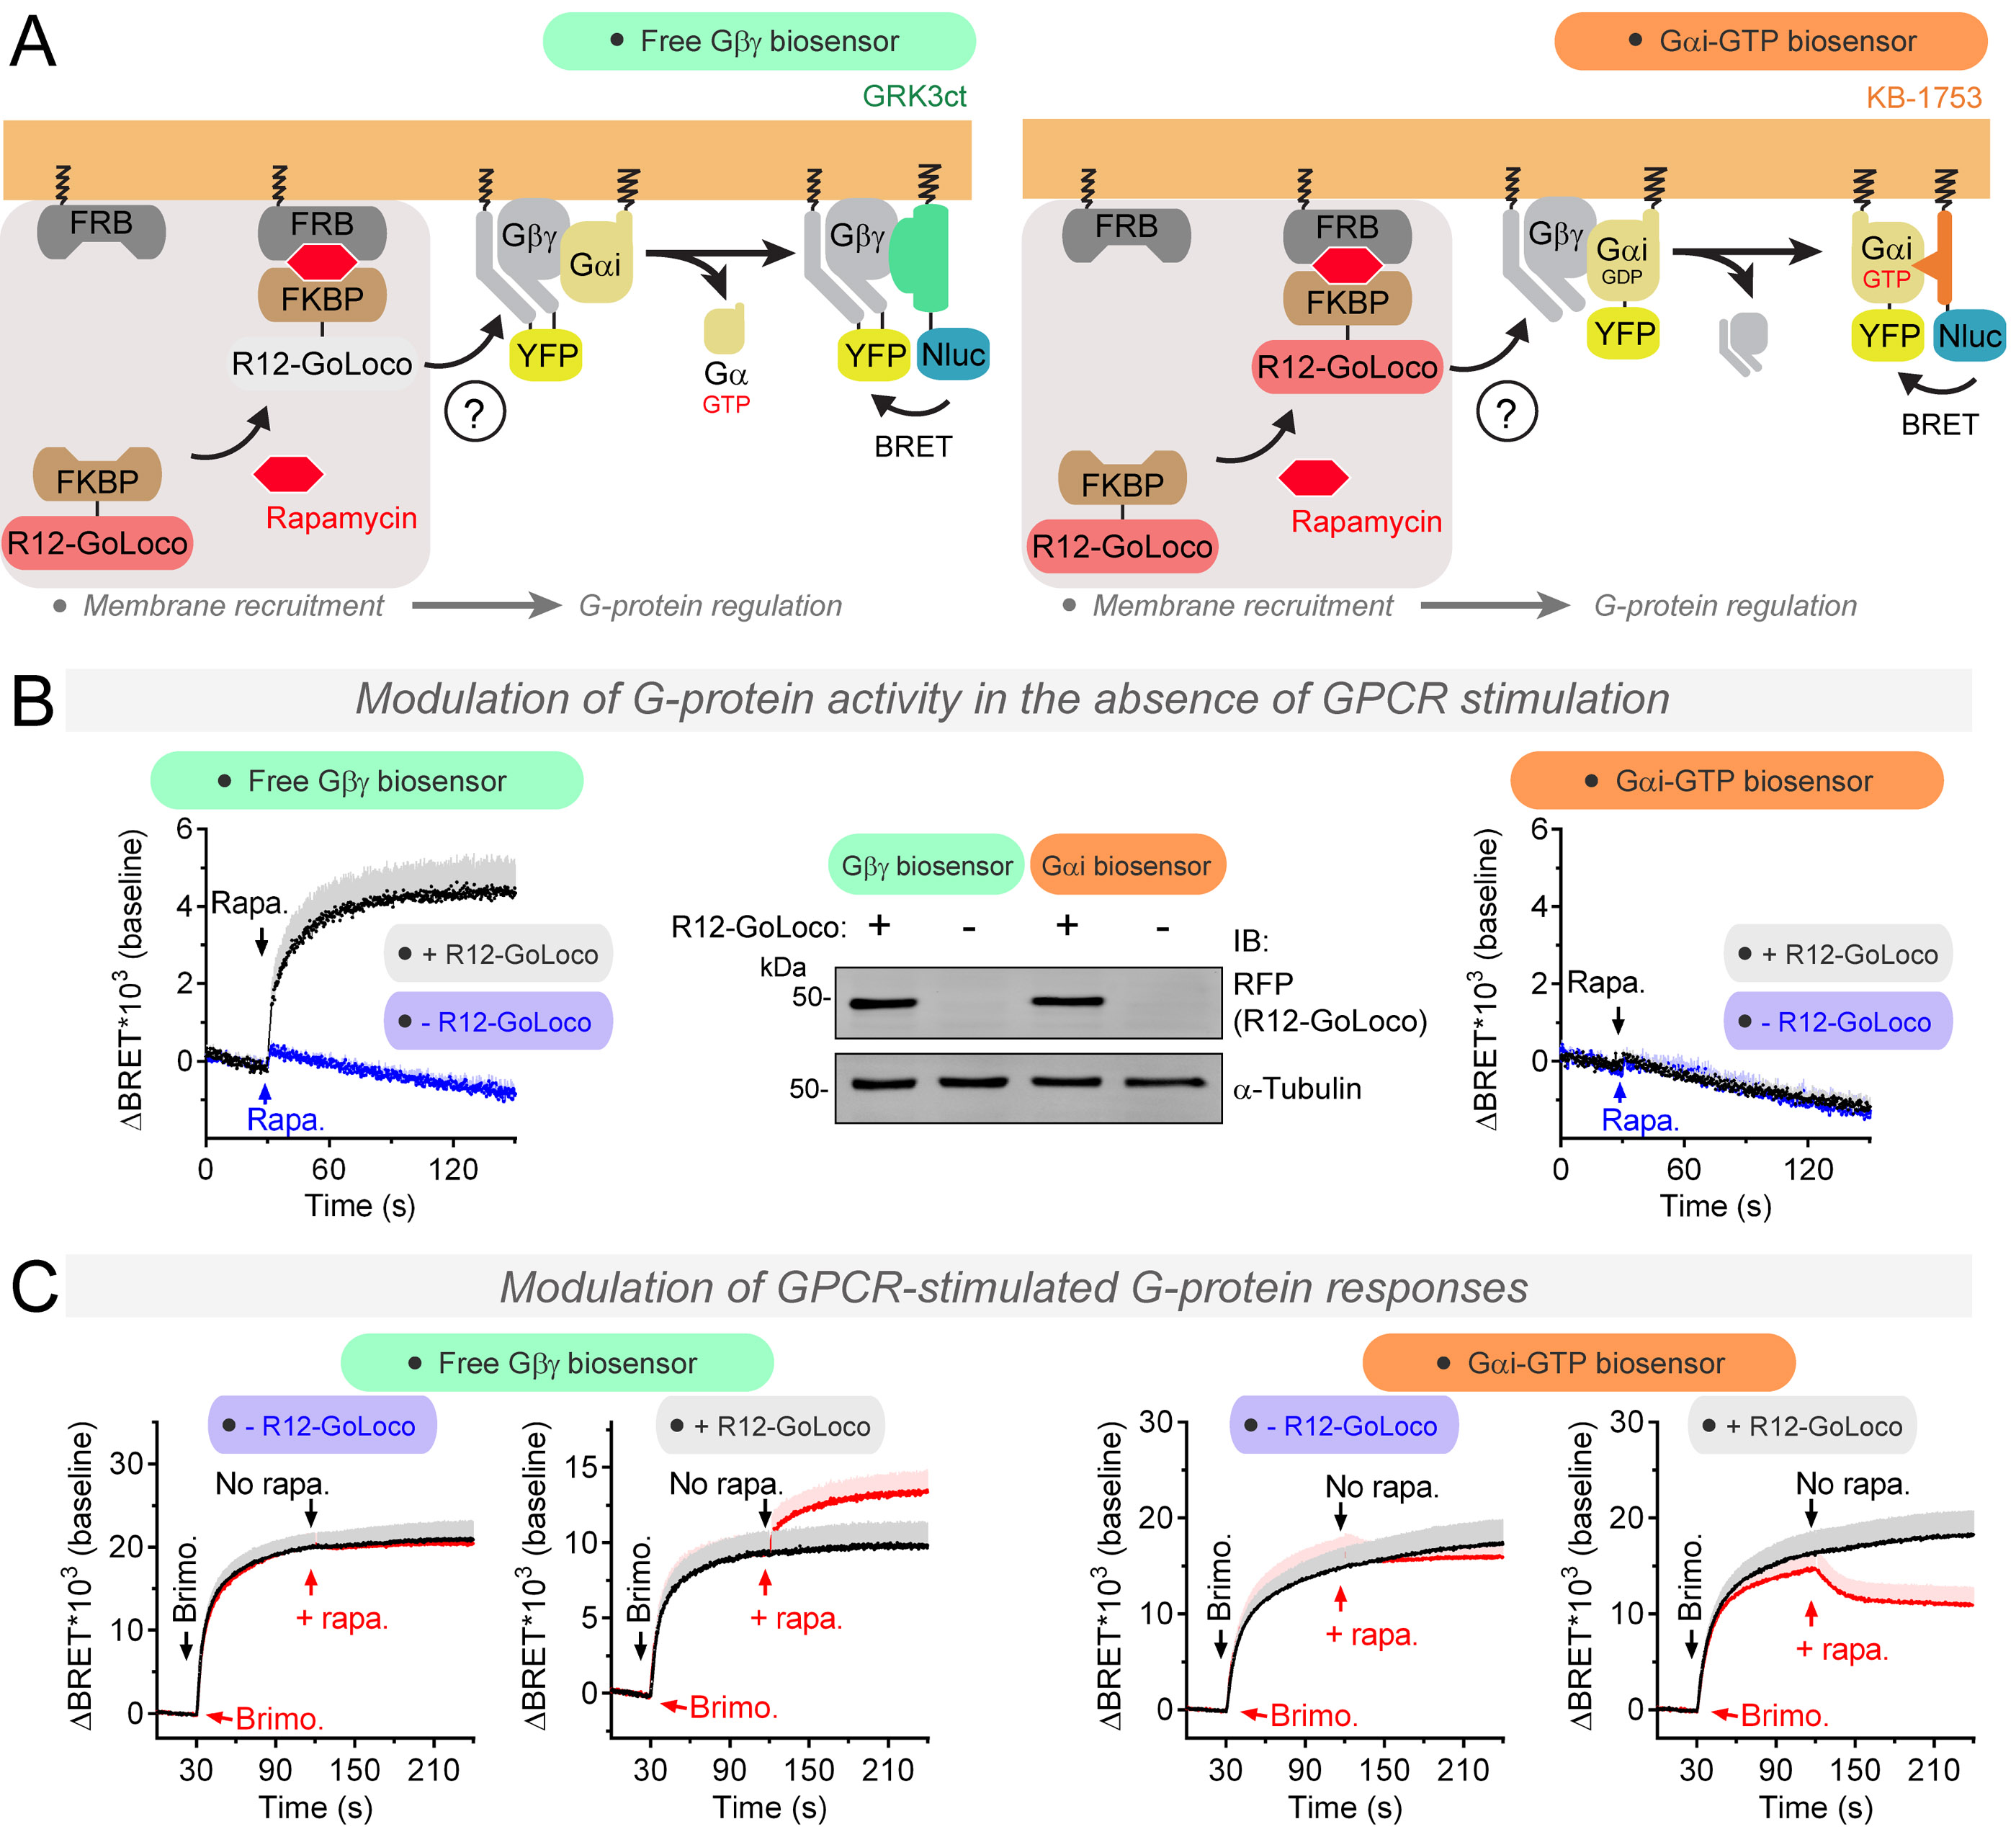
(A) Real-time measurement of free Gβγ or Gαi-GTP levels in cells upon rapamycin-induced rapid recruitment of the R12-GoLoco GDI to cell membranes.
(B) Membrane recruitment of R12-GoLoco promotes Gβγ release from Gαi-Gβγ trimers but does not change basal levels of Gα-GTP in HEK293T cells. Mean ± S.E.M, n= 4. Rapa.= rapamycin.
(C) Membrane recruitment of R12-GoLoco diminishes GPCR-stimulated (α2A-AR) levels of Gαi-GTP in cells, whereas it further promotes the dissociation of Gαi-Gβγ trimers in HEK293T cells. Mean ± S.E.M, n= 3-5. Brimo.= Brimonidine 3 nM.
Rational design of unimolecular G-protein activity biosensors
The bi-molecular BRET system described above to detect Gαi-GTP still relies on exogenously expressed G-proteins. Our next goal was to develop a biosensor that could detect the activity of endogenously expressed G-proteins, for which we envisioned the design of unimolecular biosensors. This design is based on the unique properties of the so-called “ER/K a-helices” (Sivaramakrishnan and Spudich, 2011), which tend to exist in a fully extended conformation that spans tens of nanometers, but also display low frequency stochastic bending that brings the two ends of the helix in close proximity (Fig. 3A). The ratio of “bent” vs. “open” conformation species can be increased by external constraints, like the interaction between two protein domains attached to the ends of the ER/K helix (Sivaramakrishnan and Spudich, 2011; Swanson and Sivaramakrishnan, 2014). We reasoned that this could be exploited to make unimolecular G-protein activity BRET biosensors based on two principles of design by modules. First, the ER/K α-helix (~10 nm) would function as a linker between the BRET donor and acceptor modules (Nluc and YFP, respectively) to minimize BRET under resting conditions (Fig. 3A). Second, a membrane-anchoring sequence and an active G-protein detector module (e.g. KB-1753) would be fused at opposite ends of the biosensor. Because G-protein activation occurs on cell membranes, we reasoned that this design would favor the “bent” conformation of the ER/K linker when the detector module binds to active G-protein species on membranes (Fig. 3A). In turn, the bent conformation of the ER/K linker would bring the BRET donor and acceptor modules in closer proximity, resulting in increased BRET (Fig. 3A). We named this design “BERKY”, for “BRET biosensor with ER/K linker and YFP”.
Figure 3. Detection of endogenous Gαi-GTP in cells with a unimolecular biosensor.
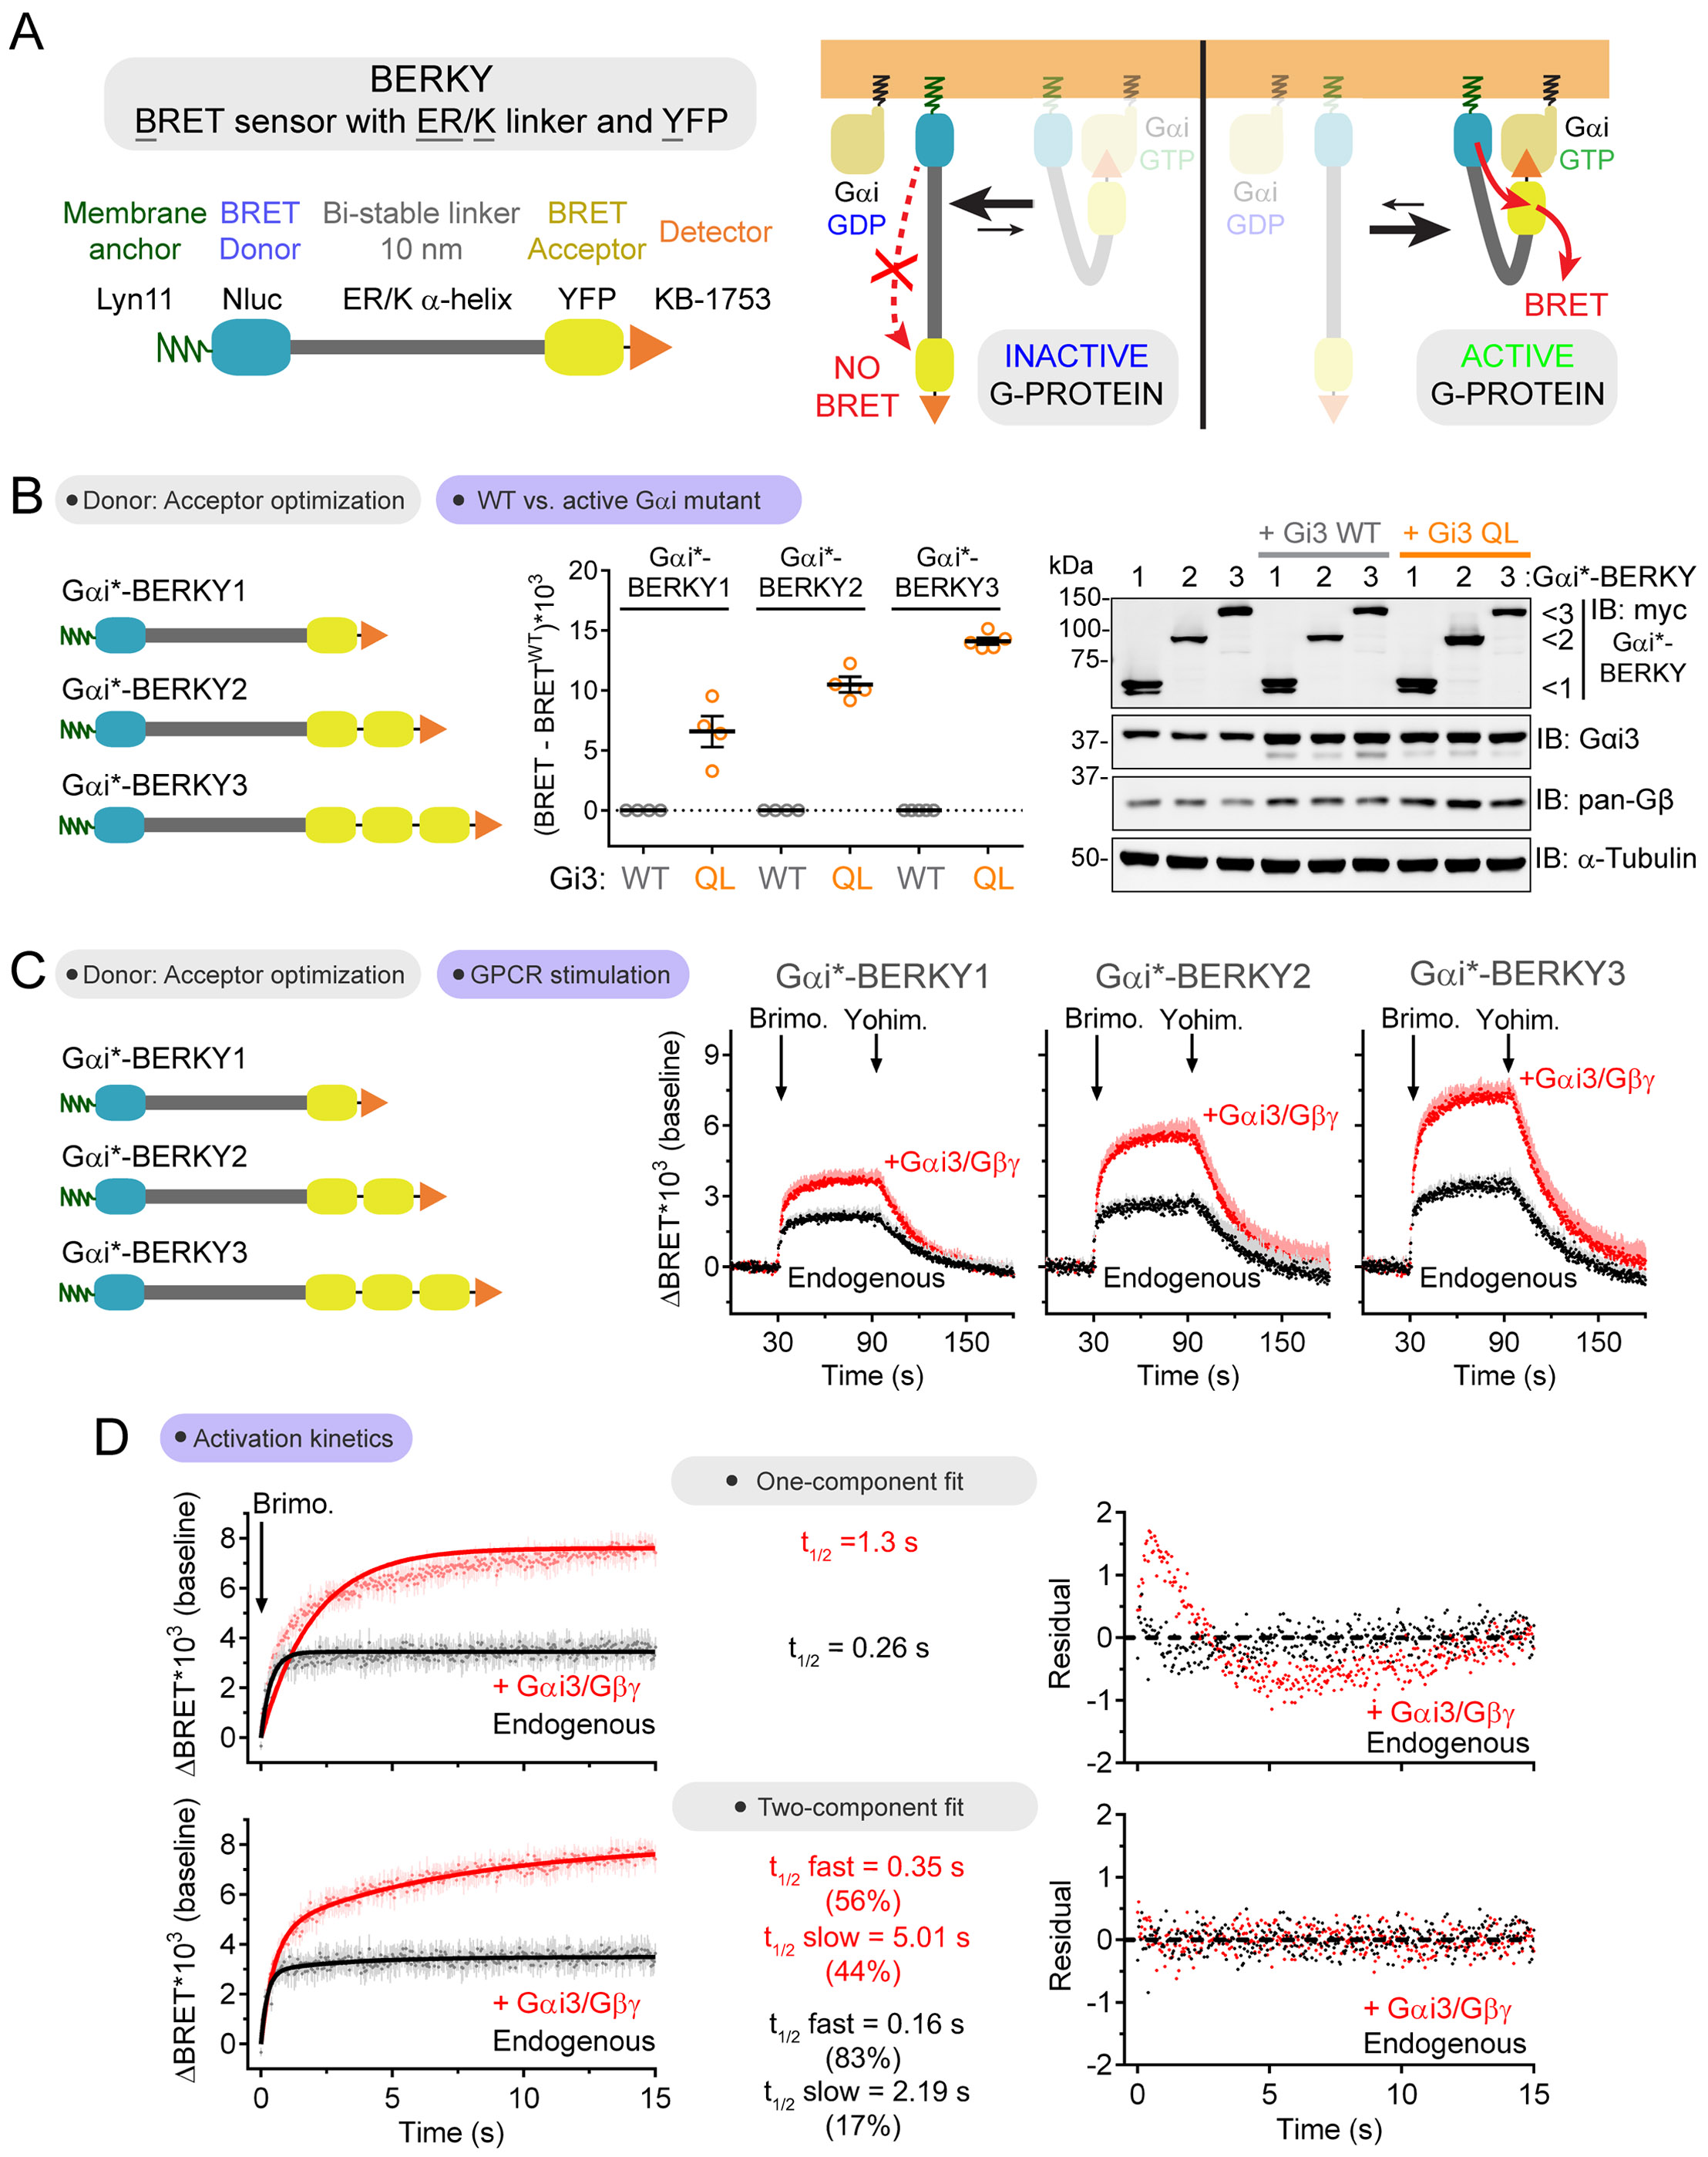
(A) Modular design of a unimolecular biosensor for Gαi-GTP (=Gαi*) and the rationale for BRET enhancement upon G-protein activation.
(B, C) Increasing the number of BRET acceptor modules (YFP) relative to donor modules (Nluc) per Gαi*-BERKY biosensor molecule enhances the BRET increases observed upon expression of a constitutively active G-protein mutant (Gi3 QL, in B) or upon GPCR stimulation (α2A-AR, in C). Mean ± S.E.M, n= 3-5.
(D) Gαi activation kinetics were determined in HEK293T cells expressing Gαi*-BERKY3 with or without Gαi3/Gβγ overexpression upon GPCR stimulation (α2A-AR, 5 μM brimonidine). Data points are mean ± S.E.M. (n= 4) and solid lines are fits to one-component exponential curves (top) or two-component exponential curves (bottom). Residual plots for each of the curve fits are shown on the right.
See also Figure S2.
Validation of a unimolecular biosensor that detects endogenous Gαi-GTP
We first assessed the properties of a BERKY biosensor for Gαi-GTP (Gαi*-BERKY) constructed with the previously validated detector module KB-1753 (Fig. 1). For this, we coexpressed the biosensor with Gi3 WT, which is GDP-bound under resting conditions, or Gi3 Q204L mutant (QL), which is GTPase deficient and constitutively bound to GTP (Fig. 3B). We also compared constructs with one, two or three YFPs (Gαi*-BERKY1, Gαi*-BERKY2 and Gαi*-BERKY3, respectively) to investigate if increasing the acceptor to donor ratio per biosensor molecule could improve the dynamic range and performance. We found that BRET was higher in HEK293T cells expressing Gi3 QL compared to cells expressing Gi3 WT, and that the difference in amplitude was proportional to the number of acceptor modules (YFP) in BERKY (Fig. 3B). Next, we carried out kinetic BRET measurements with cells expressing exogenous Gi3 WT or only endogenous G-proteins. We found that α2A-AR (Fig. 3C) or MOR (Fig. S2A) stimulation led to a rapid increase in BRET that was reversed upon addition of an antagonist both in cells expressing exogenous Gi3 and in cells expressing only endogenous G-proteins, albeit with larger amplitude for the former compared to the latter. Consistent with the steadystate measurements using Gi3 QL (Fig. 3B), the amplitude of the α2A-AR-mediated responses was proportional to the number of BRET acceptor modules per biosensor (Fig. 3C), indicating that Gαi*-BERKY3 had the most robust performance. Next, we assessed the specificity of the observed response by using pertussis toxin (Ptx), which specifically ADP-ribosylates Gi proteins to prevent their coupling to GPCRs. We found that α2A-AR-stimulated BRET increases were completely blunted after pre-treatment with Ptx (Fig. S2B), but not affected in cells expressing a Ptx-insensitive Gαi3 mutant (Fig. S2C). These results indicate that Gαi*-BERKY3 can specifically measure the activation of endogenous Gi proteins in cells.
We also attempted an alternative Gαi*-BERKY3 design by replacing the KB-1753 detector module by another related peptide, KB-1746, previously reported to also recognize Gα-GTP species of the Gi/o family (Johnston et al., 2008). However, this alternative biosensor design failed to report any response in cells expressing Gi/o proteins (Fig. S2D).
Since it has not been possible in the past to directly measure the activation properties of endogenously expressed Gi, we carried out a detailed analysis of its activation kinetics using Gαi*-BERKY3 and compared it to the activation kinetics in cells expressing exogenous Gαi3/Gβγ upon stimulation of α2A-AR. Endogenous Gi activation data fitted well to a one-component exponential association curve, from which we determined an activation half-time (t1/2) of ~250 ms (Fig. 3D). On the other hand, cells expressing exogenous Gi proteins displayed slower rates of activation, with a t1/2 of ~1300 ms, which is consistent with previously reported values using overexpressed, fluorescently-tagged Gi proteins in FRET measurements with the same GPCR (Bunemann et al., 2003). Moreover, activation data in cells expressing exogenous Gi proteins displayed significant deviations from the fit to a one-component exponential association curve (Fig. 3D). Instead, these data fit better to a two-component exponential association curve (Fig. 3D), which revealed a fast component with a t1/2 similar to that measured for activation of endogenous G-proteins (i.e. ~350 ms) and a slow component with t1/2 in the range of several seconds. We ruled out that the slower activation kinetics in cells expressing exogenous Gi is due to excess Gβγ subunits that might dampen activation, as we found that expression of Gβγ alone did not alter the activation kinetics compared to cells only expressing endogenous G-proteins (Fig. S2E). Also, in G-protein dose-dependence studies, we found slower activation kinetics even when low amounts of exogenous Gi3 are expressed (Fig. S2F). We speculate that the fast component of the activation kinetics could represent a pool of G-proteins that is readily accessible and rapidly activated by GPCRs, whereas the slow component arises from activation of G-proteins that are only accessed once the GPCR progressively disengages from already activated G-proteins. This could explain why for endogenous G-proteins, the two component fit is only marginally better than the one component fit and why the contribution of the slow component in the two component fit is minimal (~15%) (Fig. 3D), whereas in the presence of additional exogenous G-proteins the two component fit is much better than the one component fit and the contribution of the slow component in the two component fit is much more pronounced (~50%) (Fig. 3D). Regardless of this speculation, our side-by-side comparison with the same biosensor, i.e. Gαi*-BERKY3, reveals that G-protein activation kinetics are distorted upon expression of exogenous G-proteins.
Direct and specific detection of Gαq-GTP and Gα13-GTP
Next, we set out to develop additional probes to detect Gα-GTP species from families other than Gi/o as a direct measure of activation of G-proteins. Analogous to the approach for Gαi-GTP, this was done in a bi-molecular BRET format with exogenously expressed G-proteins as a step that preceded the BERKY design with endogenously expressed G-proteins. First, we sought to identify a detector module for Gαq-GTP (Gq/11 family). Following the same specificity, sensitivity and fidelity criteria as for Gαi (Fig. 4A), we reasoned that the RGS homology (RH) domain of GRK2 (GRK2RH) could serve as the detector module for GTP-bound Gαq as it binds specifically and with high affinity to active Gq/11 α-subunits without perturbing their intrinsic ability to bind or hydrolyze nucleotides (Carman et al., 1999; Day et al., 2004; Sterne-Marr et al., 2003; Tesmer et al., 2005). Indeed, co-expression of internally-tagged Gαq-YFP with GRK2RH-Nluc resulted in a BRET biosensor with properties analogous to those of the Gαi-GTP biosensor. First, it reported rapid activation upon M3 muscarinic receptor (M3R) stimulation (Fig. 4A, B). This BRET response was sustained for at least 15 min (Fig. S3A), but could be rapidly reversed to baseline upon addition of a GPCR antagonist (Fig. 4A, B). The Gαq-GTP response was also agonist dose dependent (Fig. 4B, C), did not require the co-expression of Gβ/Gγ for robust performance (Fig. 4B, C), and could be reproduced by stimulation of a second Gq-coupled GPCR (α1A-AR, Fig. S3B). Specificity was further supported by loss of response upon introduction of a GRK2 mutation previously reported to prevent Gαq binding (Day et al., 2004) (Fig. 4D), and by lack of response upon GPCR-mediated activation of Gαs, Gαi3 or Gαo (Fig. 4E).
Figure 4. Direct detection of GTP-bound Gαq in cells.
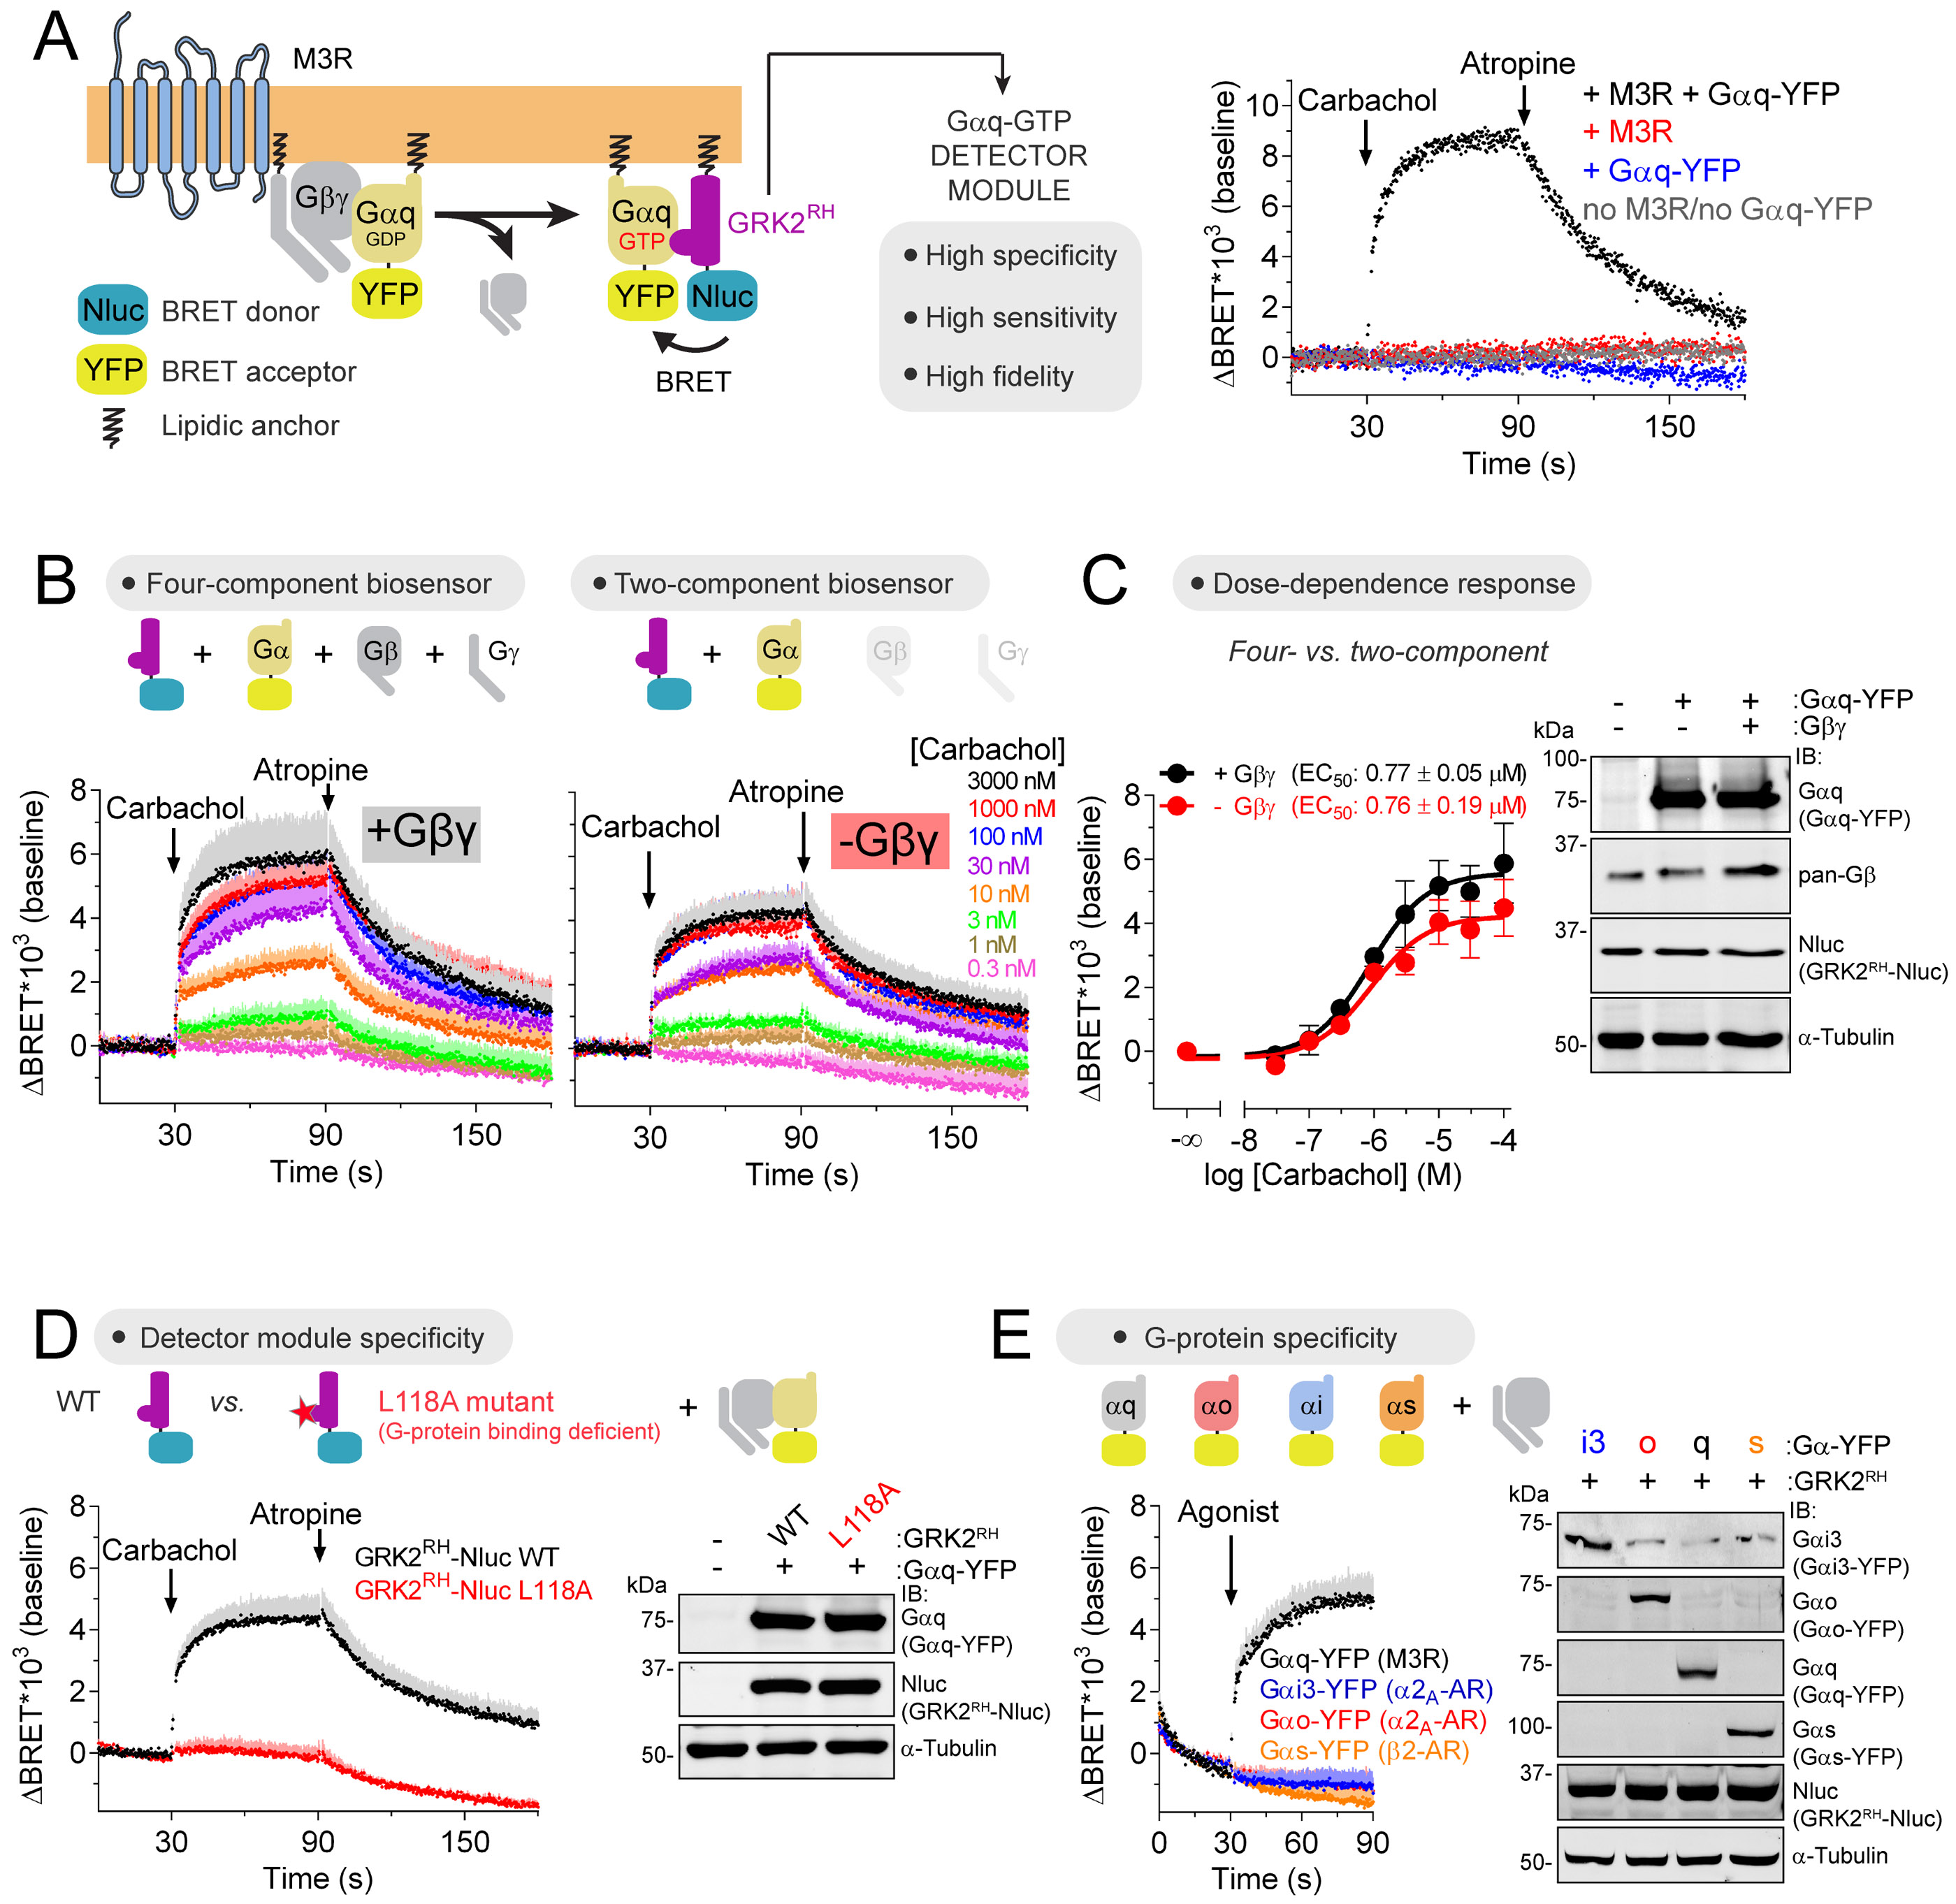
(A) Gαq-GTP biosensor design principle and representative traces of BRET measurements in HEK293T cells expressing GRK2RH-Nluc along with the indicated constructs. Carbachol= 100 μM/ Atropine= 100 μM.
(B, C) Agonist dose-dependent Gαq-GTP responses using four- or two-component biosensors in HEK293T cells expressing M3R. Mean ± S.E.M, n= 4-6.
(D) Loss of Gαq-GTP response upon mutation of GRK2RH-Nluc. Carbachol= 30 μM/ Atropine= 100 μM. Mean ± S.E.M, n= 3-7.
(E) Detection of Gαq-GTP but not Gαi3-GTP, Gαo-GTP or Gαs-GTP responses by GRK2rh-Nluc upon GPCR agonist stimulation. Cells expressing G-proteins with the indicated cognate GPCRs were agonist-stimulated as follows: Gαq, 100 μM carbachol; Gαi3/Gαo, 5 μM brimonidine; Gαs, 100 μM isoproterenol. Mean ± S.E.M, n= 3-5.
We also confirmed robust, dose-dependent, reversible and specific detection of Gα13-GTP (G12/13 family) with or without co-transfection of Gβ and Gγ (Fig. S4) by using an analogous bi-molecular BRET biosensor that leverages as detector module the RH domain of PDZ-RhoGEF (PRGRH), which binds specifically to Gα13-GTP with high affinity but without affecting G-protein enzymatic activity (Chen et al., 2008; Wells et al., 2002).
Taken together, these findings show that Gα-GTP formed from three different G-protein families (Gi/o, Gq/11 and G12/13) can be specifically detected with sensitivity and fidelity using a biosensor design of only two genetic components: Gα internally tagged with a YFP and a Gα-GTP detector module fused to Nluc.
Gαq-GTP biosensor reveals the properties of cancer-associated mutations at Gαq R247
To further showcase the utility of Gα-GTP probes for direct detection of G-protein activity, we implemented the Gαq-GTP biosensor to characterize cancer-associated Gαq mutants (Fig. 5A). We used previously characterized cancer mutations of Q209 and R183 to benchmark the biosensor and picked uncharacterized mutations of R247 for further investigation. Although R247 mutations are not as frequent as Q209 or R183 mutations (Cerami et al., 2012), which are causative of a large fraction of uveal melanomas (Chua et al., 2017) and Sturge-Weber syndrome (Shirley et al., 2013), this amino acid is in a position near the nucleotide binding pocket fully conserved across all mammalian Gα proteins (Fig. 5A), and genetic evidence in C. elegans suggests that its mutation might yield a gain of function (egl-30(tg26) genotype (Doi and Iwasaki, 2002)). As expected, mutants Q209L and R183C exhibited high levels of BRET under unstimulated conditions and failed to elicit significant increases upon maximal stimulation of the GPCR M3R in HEK293T cells (Fig. 5B, C), which is consistent with their previously reported constitutive activity due to deficient GTPase activity. Also in agreement with previous characterizations, the constitutive activity of R183C but not of Q209L was partially suppressed by RGS8, a GAP for Gαq, in unstimulated cells (Berman et al., 1996). For R247Q and R247L mutants, we found that although basal BRET was not increased and they invoked BRET responses similar to wild-type (WT), their GPCR-mediated response was not affected by RGS8, whereas it was decreased ~50% for WT (Fig. 5B). These results suggested that R247 mutants might be insensitive to the GAP activity of RGS proteins despite not having high constitutive activity. We leveraged the kinetic resolution and sensitivity of the Gαq-GTP biosensor to further investigate this point, resulting in two observations that were consistent with GAP-insensitivity. One, the rate of deactivation upon addition of a GPCR antagonist was slower for R247 mutants (Fig. 5D), and, two, there was a leftward shift of the agonist dose-dependence curve (Fig. 5E) compared to WT. Since these features closely resemble observations with a previously described synthetic mutant that specifically precludes RGS binding to G-proteins (Lambert et al., 2010; Lan et al., 1998), we tested whether R247 mutants also have impaired RGS binding and found that they do not bind to the RGS protein GAIP (Fig. 5F). Although the precise impact of Gαq R247 mutants in cancer progression remains to be elucidated, our findings suggest that they have a gain of function due to a mechanism different from any other characterized Gαq oncogenic mutant. Instead of favoring activation by blunting the intrinsic GTPase activity of Gαq, the R247 mutations favor activation by rendering Gαq insensitive to the GAP activity of RGS proteins. Thus, the Gαq-GTP biosensor can be implemented to gain mechanistic insights into G-protein dysregulation in cancer.
Figure 5. Characterization of cancer-associated G-protein mutants with a Gαq-GTP biosensor.
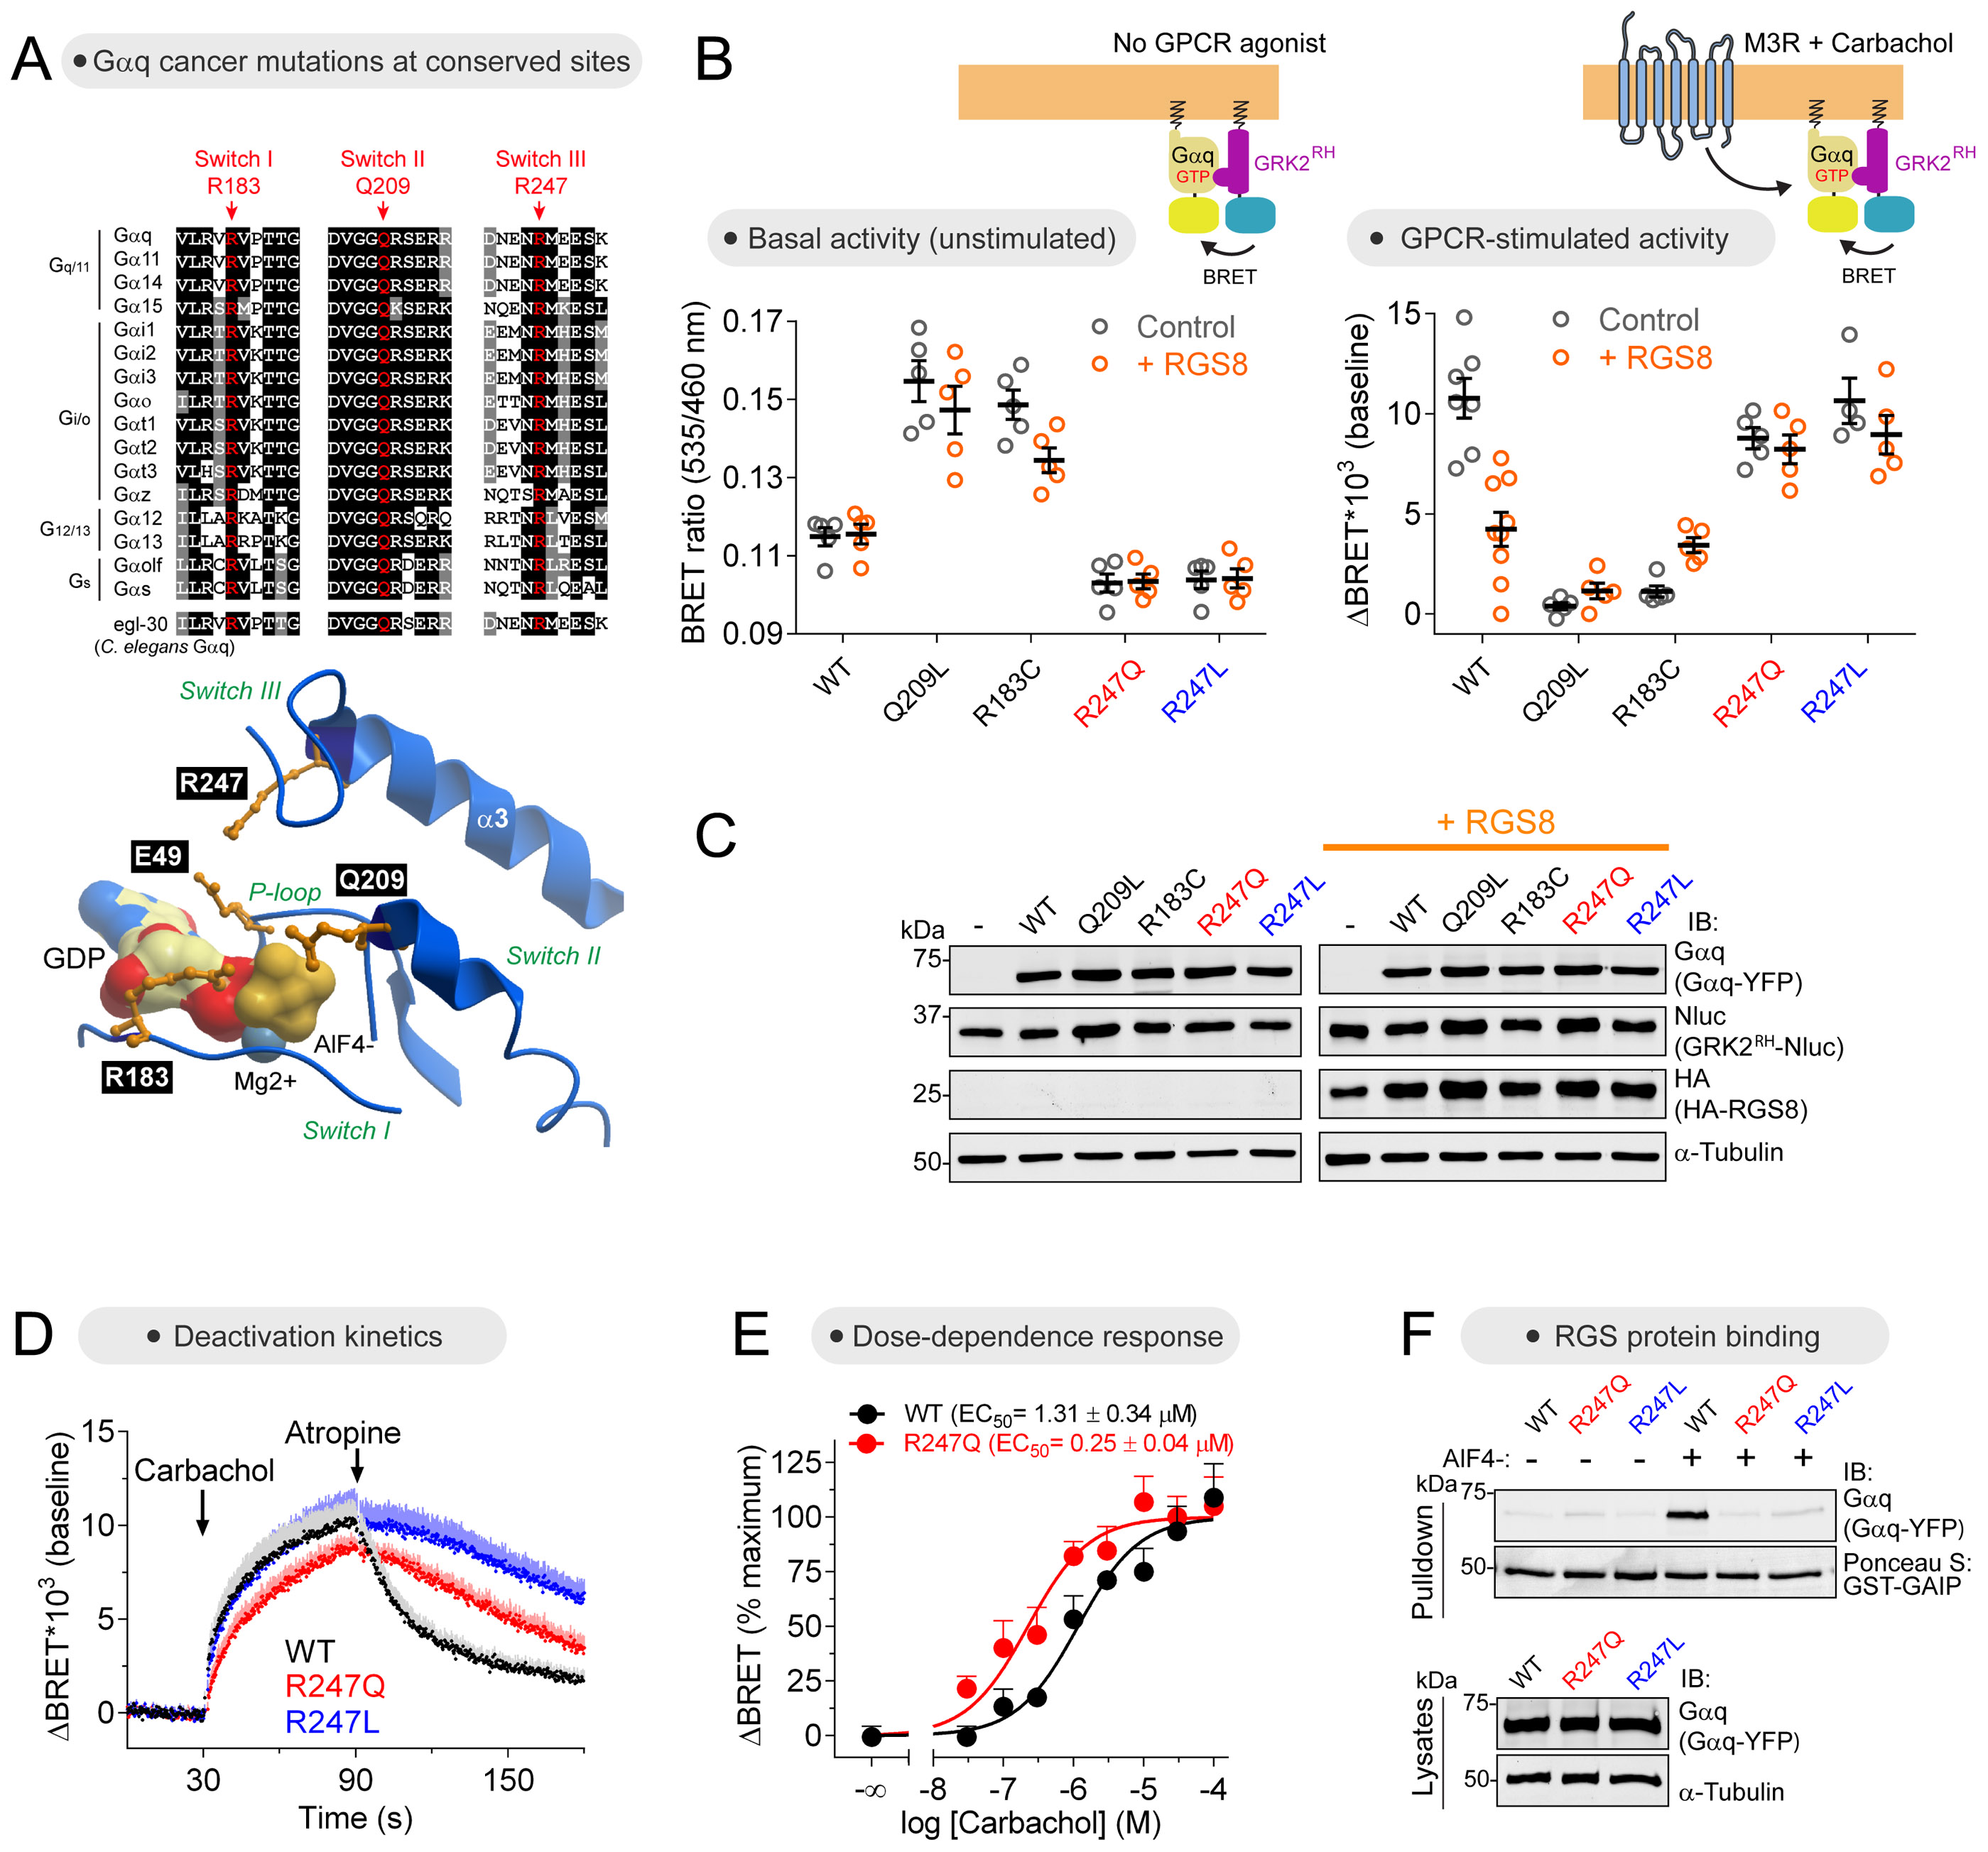
(A) Alignment of Gα Switch regions showing in red three fully conserved positions that are mutated in Gαq in cancer. Three dimensional model of Gαq (PDB: 3OHM) showing the position of selected residues around the nucleotide binding site.
(B, C) Different activation properties of cancer-associated Gαq mutants as determined by the Gαq-GTP biosensor GRK2RH-Nluc. Gαq-GTP levels were determined with and without GPCR stimulation (M3R, carbachol 100 μM) and in the absence (grey) or presence (orange) of the GAP RGS8. Mean ± S.E.M, n= 4-9.
(D) R247 mutants deactivate more slowly than Gαq WT upon termination of GPCR stimulation as determined by the Gαq-GTP biosensor GRK2RH-Nluc. Mean ± S.E.M, n= 4-5. Carbachol, 100 μM; Atropine, 100 μM.
(E) Carbachol activates Gαq R247Q 5-fold more potently than Gαq WT as determined by the Gαq-GTP biosensor GRK2RH-Nluc. Mean ± S.E.M, n= 4.
(F) Gαq R247 mutants do not bind to the RGS protein GAIP. Binding to immobilized GST-GAIP was determined in the absence or presence of AlF4−, which induces the G-protein activation transition-state conformation recognized by RGS proteins. One experiment of n>3.
See also Figure S5.
Gα13-GTP biosensor reveals hyperactive G13 mutants in bladder cancer
Next, we pursued the implementation of the Gα13-GTP biosensor to characterize other cancer mutations. Mining data in cBioportal (Cerami et al., 2012), we noticed that Gα13 is mutated in bladder cancer with moderate frequency (~2%), and that R200 appears to be a mutation hotspot (Fig. S5A). R200 is in a position conserved across all mammalian Gα proteins, and its mutation in other Gα proteins renders them oncogenic due to hyperactivation (e.g. it is the same position as R183 in Gαq described above) (Landis et al., 1989; Lyons et al., 1990; Pace et al., 1991; Van Raamsdonk et al., 2009). We tested the hypothesis that R200 mutation in Gα13 also results in G-protein hyperactivation by using our Gα13-GTP biosensor. We found that R200G and R200K cancer mutants caused a marked increase in BRET similar to that observed for an artificial GTPase-deficient mutant (Q226L) that causes G-protein hyperactivation and oncogenic transformation (Voyno-Yasenetskaya et al., 1994; Xu et al., 1994) and that stimulation of a cognate GPCR did not enhance BRET for any of the mutants (Fig. S5B, C), indicating that they are constitutively active. We confirmed that R200 mutants lead to enhanced activation of downstream signaling targets by using a transcriptional reporter known to be activated by a G12/13-dependent pathway (O'Hayre et al., 2016) (Fig. S5D). These findings suggest that Gα13 R200 mutants are hyperactive, thereby showcasing the power of the Gα13-GTP biosensor to reveal signaling functions of cancer-associated mutants.
Modular design of unimolecular biosensors for different active G protein species
Since the unimolecular “BERKY” biosensor relies on a modular design (Fig. 3), we asked whether replacing the “detector module” specific for Gαi-GTP (i.e. KB-1753) would be sufficient to generate unimolecular biosensors for other G-protein active species. The resulting unimolecular biosensors could then be used to detect the activation of different endogenous G-proteins. For this, we leveraged the previous characterization of other detector modules in bi-molecular BRET biosensors, like GRK2RH and PRGRH (Fig. 4, Fig. S4). Replacing KB-1753 by GRK2RH resulted in the Gαq-GTP biosensor Gαq*-BERKY3 (Fig. 6A), which reported a reversible increase in BRET upon M3R stimulation of HEK293T cells overexpressing exogenous Gαq or expressing only endogenous G-proteins. The Gq/11 specific inhibitor YM-254890 completely blunted the response, thereby confirming specificity. Similarly, implementation of PRGRH as the detector module resulted in Gα13*-BERKY3 (Fig. 6B), which reported a BRET increase upon stimulation of PAR1 in HEK293T cells overexpressing exogenous Gα13 or, to a lesser extent, in cells expressing only endogenous G-proteins. Taken together, these results indicate that the unimolecular BERKY biosensor design can be adapted to detect endogenous Gα-GTP species from three different G-protein families (Gi/o, Gq/11 and G12/13).
Figure 6. Detection of endogenous Gαq-GTP, Gα13-GTP, free Gβγ and Rho-GTP in cells with unimolecular biosensors.
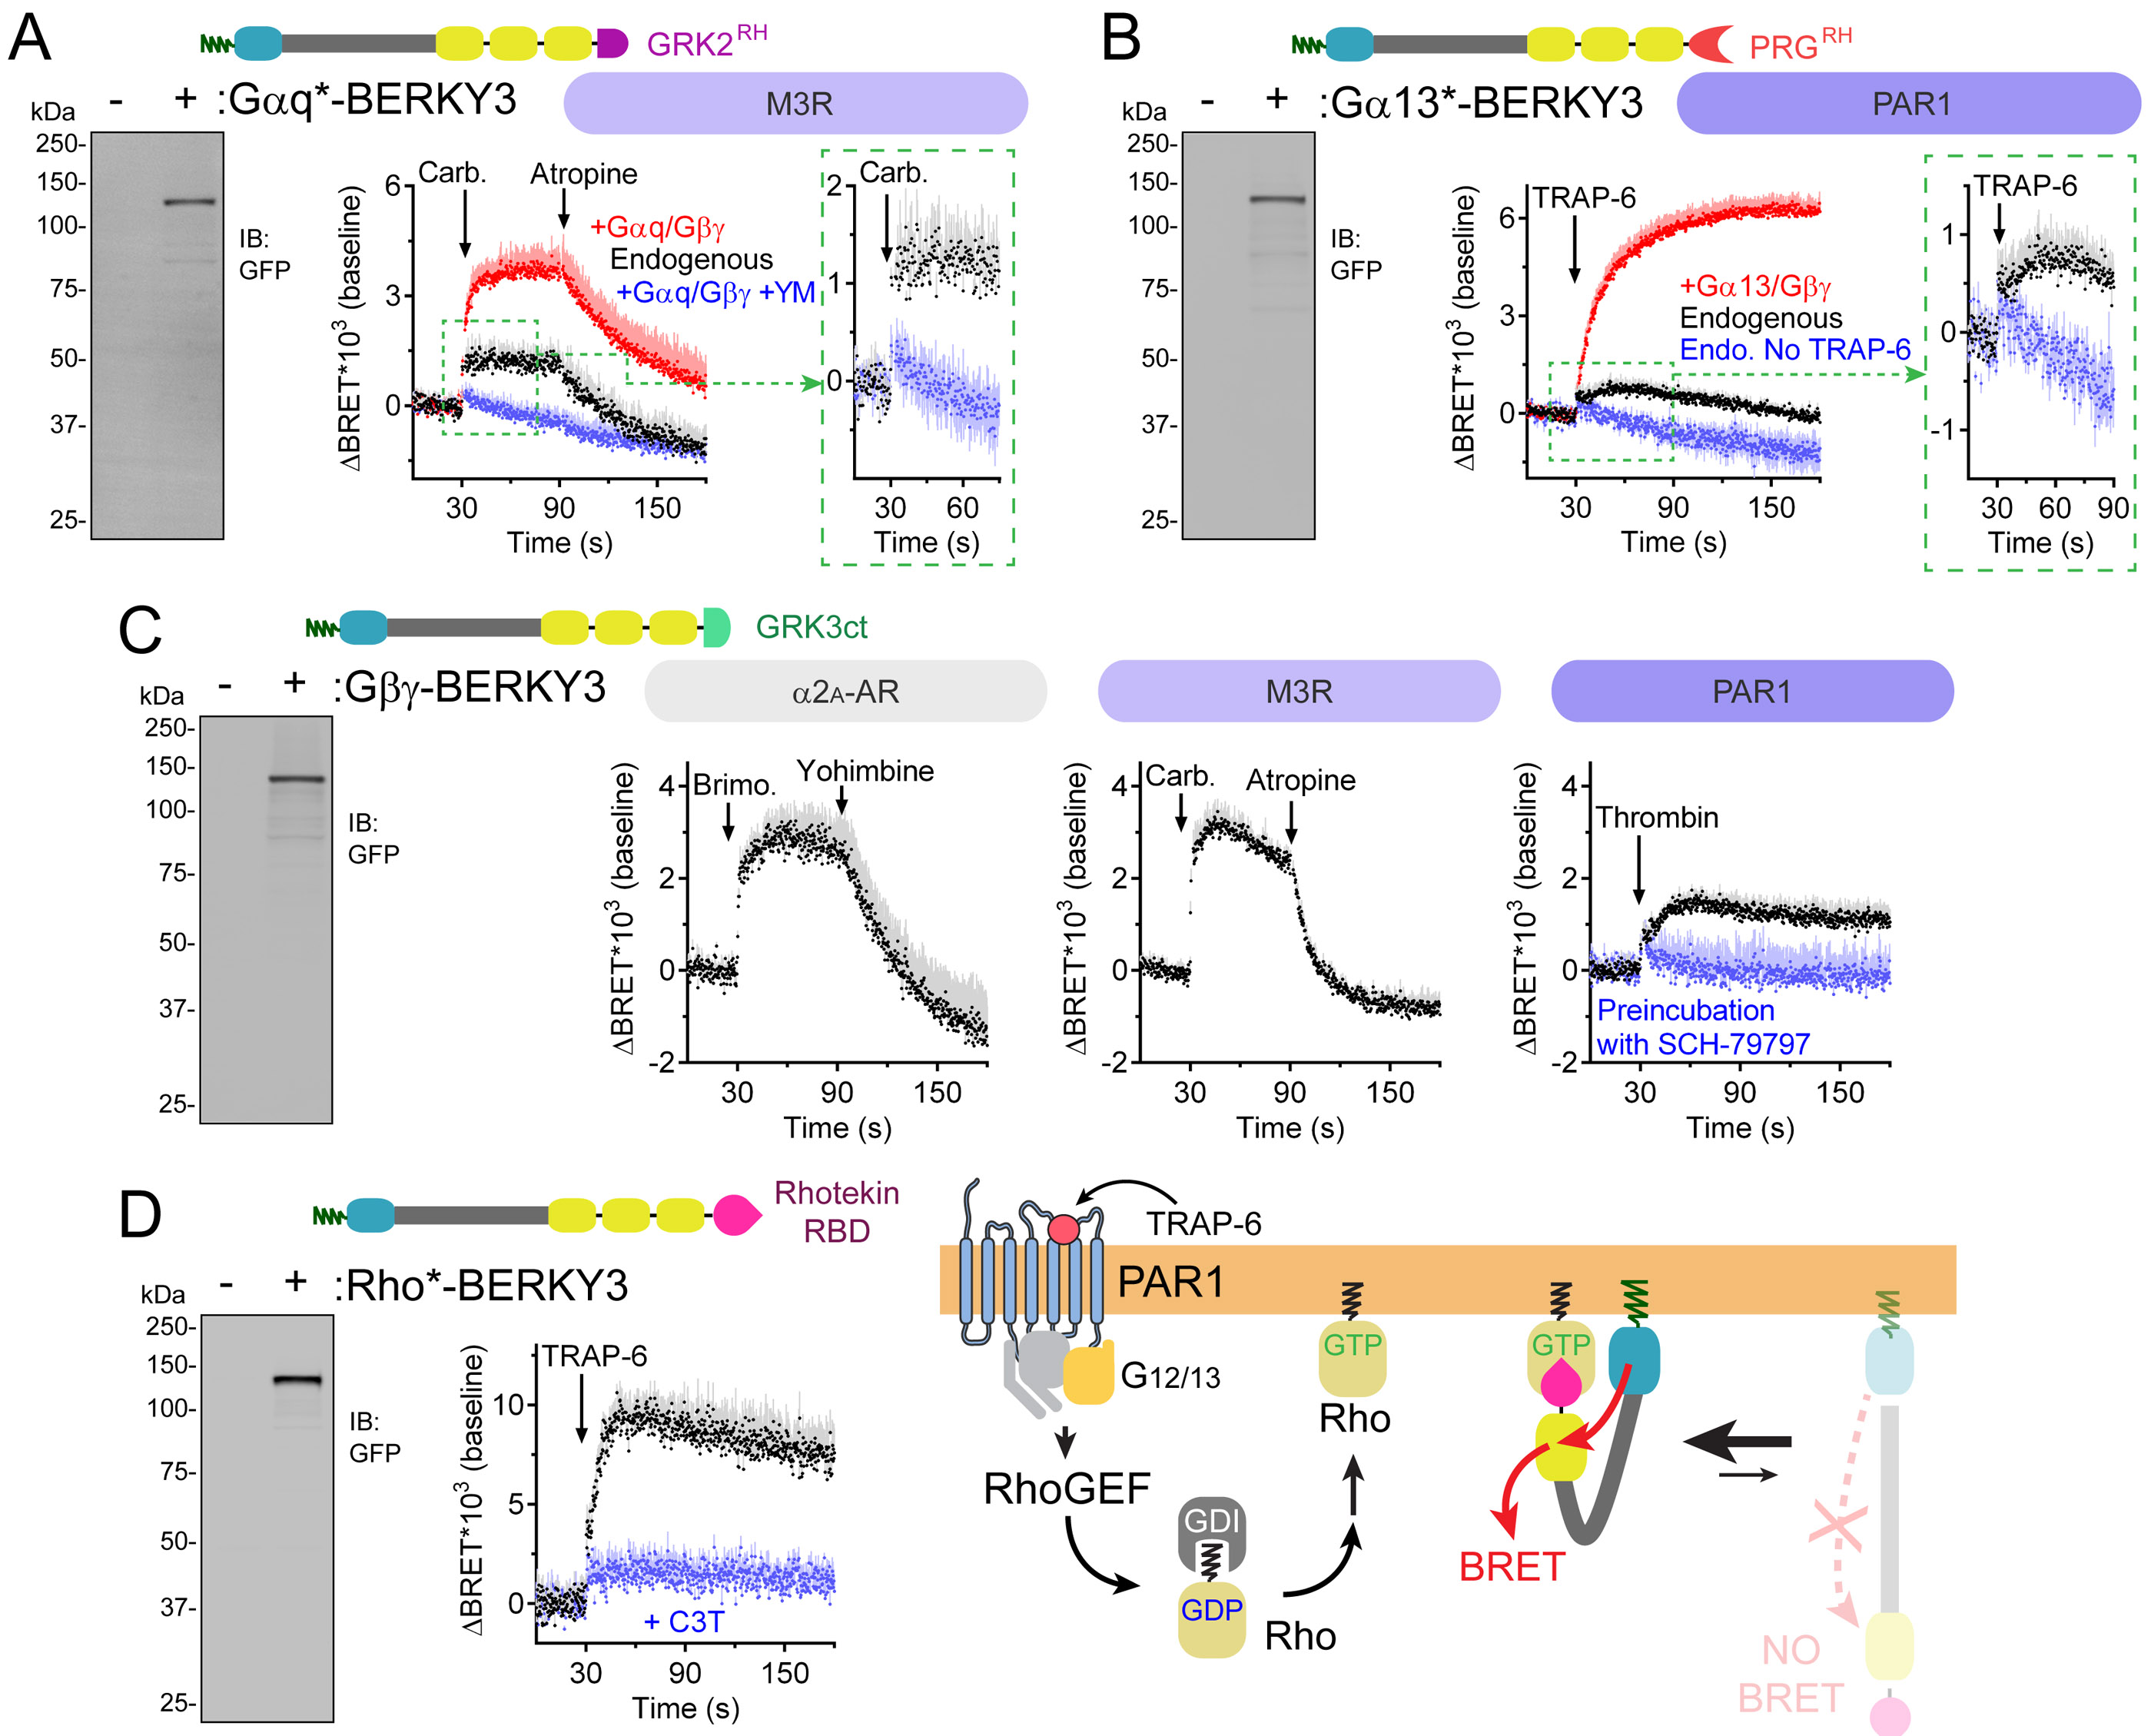
(A) BRET response detected with Gαq*-BERKY3 upon M3R modulation in HEK293T cells expressing exogenous Gαq/Gβγ or only endogenous G-proteins. BRET of cells expressing exogenous Gαq/Gβγ and pre-treated with 10 μM YM-254890 for 10 min is shown in blue. Carbachol= 100 μM/ Atropine= 100 μM. Mean ± S.E.M, n= 4.
(B) BRET response detected with Gα13*-BERKY3 upon PAR1 stimulation in HEK293T cells expressing exogenous Gα13/Gβγ or only endogenous G-proteins. BRET of unstimulated cells (blue) is shown for reference. TRAP-6= 30 μM. Mean ± S.E.M, n= 4-6.
(C) BRET responses detected with Gβγ-BERKY3 upon modulation of α2A-AR, M3R, or PAR1, as indicated, in HEK293T cells expressing only endogenous G-proteins. Brimonidine= 5 μM; Yohimbine= 25 μM; Carbachol= 100 μM; Atropine= 100 μM; Thrombin= 1 U/ml; SCH-79797= 40 μM. Mean ± S.E.M, n= 3-4.
(D) BRET responses detected with Rho*-BERKY3 upon PAR1 stimulation in HEK293T cells co-transfected (blue) or not (black) with the Rho inhibitor C3 toxin (C3T). TRAP-6= 30 μM. Mean ± S.E.M, n= 4.
We reasoned that a similar approach could also be implemented to create a unimolecular BERKY biosensor for free Gβγ, thus allowing the detection of another active signaling species of endogenously expressed trimeric G-proteins. For this, we used the C-terminal region of GRK3 (GRK3ct) as the detector module to generate Gβγ-BERKY3 (Fig. 6C). This biosensor worked as expected, as we observed a reversible increase in BRET upon α2A-AR stimulation of HEK293T cells expressing only endogenous G-proteins (Fig. 6C). Since free Gβγ subunits are in principle formed upon activation of any G-protein, we reasoned that Gβγ-BERKY3 might detect activation downstream of diverse GPCRs, including those that do not couple preferentially to Gi/o. Consistent with this idea, we detected a BRET increase in cells expressing Gβγ-BERKY3 (and no exogenous G protein) in response to stimulation of the GPCRs M3R and PAR1 (Fig. 6C). We also found that the formation of free Gβγ occurred at a rate indistinguishable from that of Gαi-GTP formation (t1/2 ~200 ms) as determined by Gβγ-BERKY3 and Gαi*-BERKY3, respectively (Fig. S2G). These results provide direct evidence that nucleotide exchange and Gα-Gβγ dissociation occur simultaneously, at least within the subsecond resolution of our assay, upon GPCR-catalyzed activation of endogenous G-proteins.
Finally, we expanded our BERKY design implementation to another class of G-proteins: Rho GTPases. For this, we used the RBD domain of Rhotekin as the detector module for Rho-GTP (Fig. 6D). We found that activation of the GPCR PAR1, which is known to activate a G12/13-RhoA signaling axis (O'Hayre et al., 2016), led to increased BRET in cells expressing the Rho*-BERKY3 biosensor (Fig. 6D). This response was abrogated by co-expressing the C3 toxin of Clostridium botulinum (C3T), a well-characterized inhibitor of Rho GTPases, thereby demonstrating that Rho*-BERKY3 specifically detects activation of endogenous Rho GTPases.
Detection of G protein activity under fully native conditions in cells
Evidence presented so far shows that BERKY biosensors can detect the activation of endogenously expressed G-proteins, yet in the presence of exogenous GPCRs. To test if BERKY biosensors can detect activation of endogenous G-proteins by endogenous GPCRs, we turned to HeLa cells, which express endogenous α2-AR’s (Gibson and Gilman, 2006). Transient transfection of Gαi*-BERKY3 in HeLa cells yielded measurable, reversible BRET responses upon α2-AR stimulation (Fig. S6A), so we generated HeLa cell lines stably expressing Gαi*-BERKY3 or Gβγ-BERKY3 by lentiviral transduction for increased reproducibility (Fig. 7A, Fig. S6B-C). We found that stimulation of these cells with an α2-AR agonist led to a dose-dependent (EC50 ~ 10 nM) rapid increase in BRET (Fig. 7B, C). Both Gαi-GTP- and Gβγ-dependent responses were reverted by an α2-AR antagonist and completely blunted by Ptx (Fig. 7B, C), confirming the expected specificity of the biosensors. Using a different cell line, SH-SY5Y, we found that Gαi*-BERKY3 and Gβγ-BERKY3 can also detect activation of endogenous G-proteins upon stimulation of two different GPCRs endogenously expressed in these cells (Levitt et al., 2011): the MOR and the delta opioid receptor (DOR, Fig. S7A-C). Similarly, Gq-specific activation could be detected by Gαq*-BERKY3 upon stimulation of muscarinic receptors endogenously expressed in SH-SY5Y cells (Fig. S7A, D). Taken together, these findings demonstrate that BERKY family biosensors can detect multiple endogenous G-protein active species in different cell types, and in response to different endogenous GPCRs.
Figure 7. Detection of endogenous G-protein activation by endogenous GPCRs in cell lines and primary neurons.
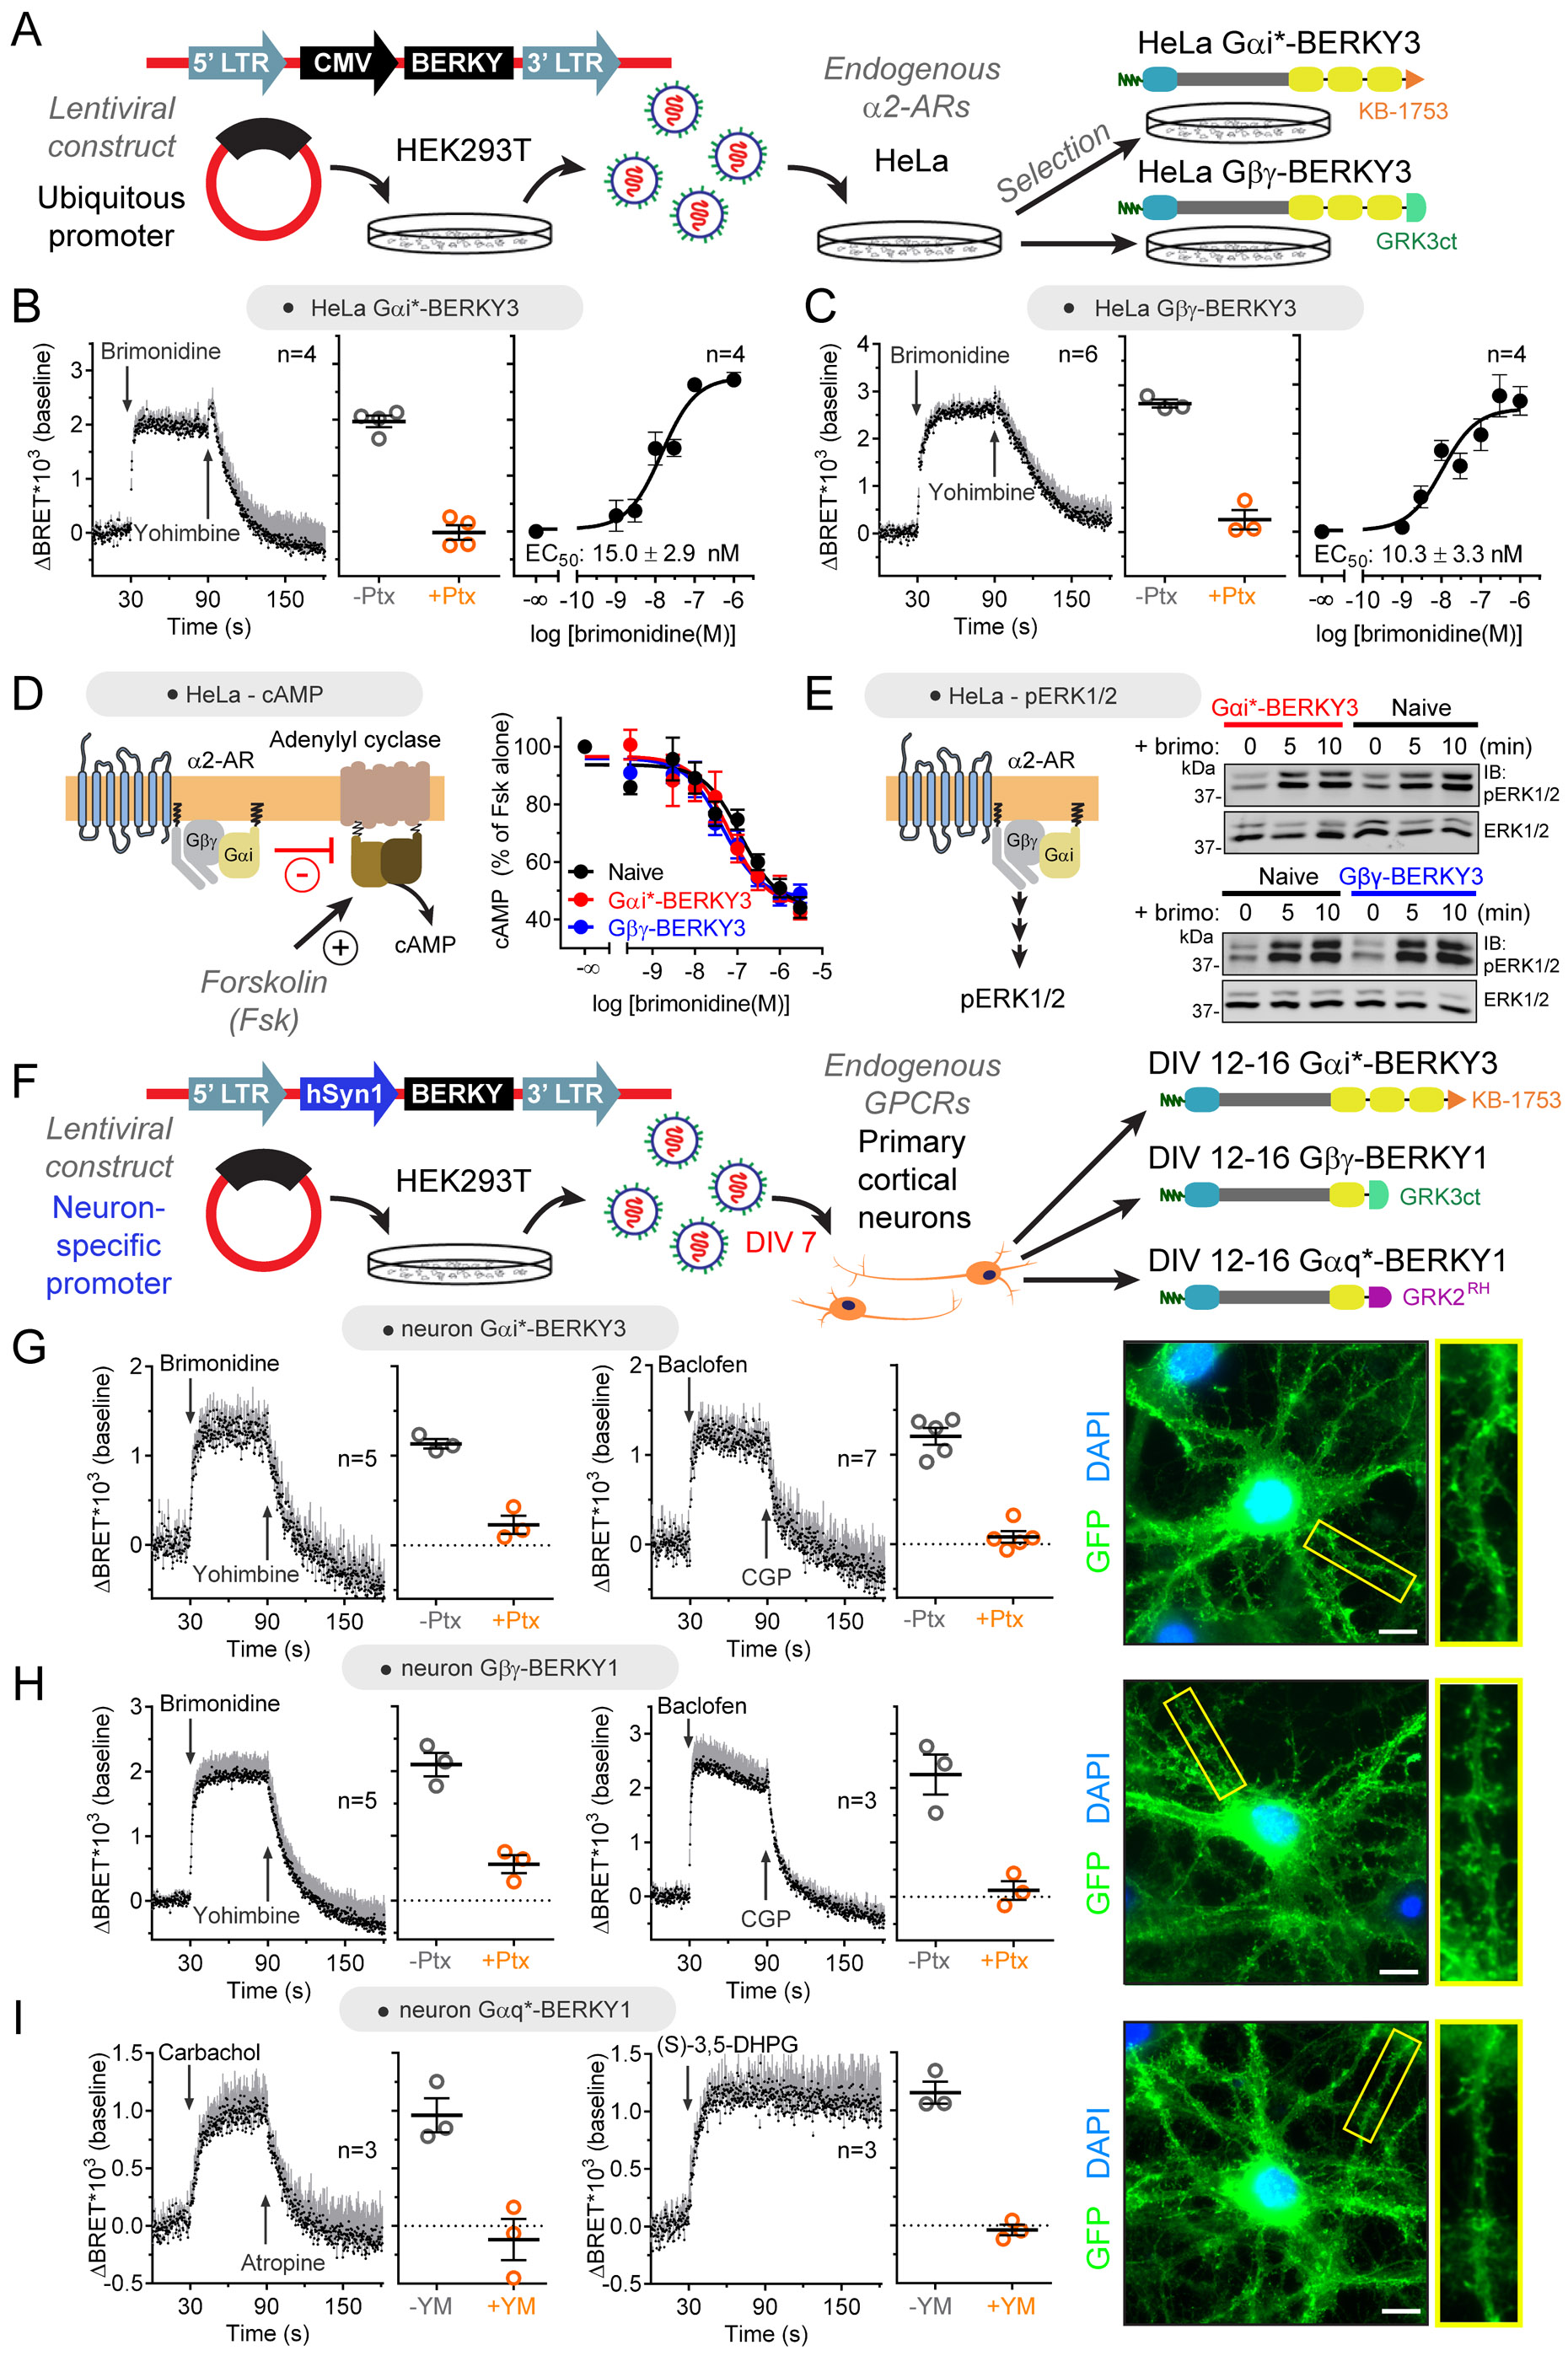
(A) Generation of HeLa cell lines stably expressing Gαi*-BERKY3 or Gβγ-BERKY3 to monitor G-protein activation upon activation of endogenously expressed α2-ARs.
(B, C) Endogenous Gαi-GTP (in B) or free Gβγ (in C) BRET responses detected by BERKY biosensors upon stimulation of endogenous α2-ARs in HeLa cells are reversible, pertussis toxin (Ptx)-sensitive and dose-dependent. Unless otherwise indicated brimonidine was 5 μM. Yohimbine= 25 μM. Ptx= 0.2 μg/ml overnight. Mean ± S.E.M.
(D, E) Expression of Gαi*-BERKY3 or Gβγ-BERKY3 does not affect downstream Gi-dependent signaling upon stimulation of endogenous α2-ARs in HeLa cells. cAMP levels were determined upon stimulation with the indicated concentrations of brimonidine in cells pretreated with 10 μM forskolin (in D), and pERK1/2 levels were determined by immunoblotting upon stimulation with 3 μM brimonidine (in E).
(F) Acute lentiviral transduction of primary cortical neurons with Gαi*-BERKY3, Gβγ-BERKY1, or Gαq*-BERKY1 constructs to monitor G-protein activation upon stimulation of endogenously expressed GPCRs. DIV= days in vitro.
(G, H, I) Endogenous Gαi-GTP (in G), free Gβγ (in H), or Gαq-GTP (in I) BRET responses detected by BERKY biosensors upon stimulation of endogenous GPCRs in primary cortical neurons. Responses to α2-AR (brimonidine, 5 μM) or GABABR (baclofen, 100 μM) are blocked by pertussis toxin (Ptx, 0.2 μg/ml overnight preincubation), and responses to muscarinic receptors (carbachol, 100 μM) or class I metabotropic glutamate receptors ((S)-3,5-DHPG, 100 μM) are blocked by YM-254890 (YM, 10 μM, 10 min preincubation). Yohimbine= 25 μM; CGP 54626 (CGP) = 1 μM (in H) or 10 μM (in G); Atropine, 100 μM. Mean ± S.E.M. Wide-field fluorescence images of immunostained neurons show broad distribution of BERKY biosensors throughout the soma and dendrites. Scale bar= 10 μm.
See also Figure S7.
An inherent property of any biosensor is that it interacts with the target species it detects, raising the question of whether it interferes with the normal function of such target. As a proof-of-principle to address this possibility, we assessed if Gαi*-BERKY3 or Gβγ-BERKY3 interfere with Gi-dependent signaling in HeLa cells upon α2-AR stimulation. We measured cAMP and phospho-ERK1/2 (pERK), which have been previously shown to be controlled by Gαi-GTP and free Gβγ, respectively, upon activation of α2-AR (Koch et al., 1994; Leyme et al., 2017). Using the same HeLa cell lines as those used to detect G-protein activity by BRET (Fig. 7A, B, C), we found that neither Gαi*-BERKY3 nor Gβγ-BERKY3 alter α2-AR-mediated cAMP inhibition (Fig. 7D) or pERK1/2 activation (Fig. 7E) responses. This indicates that expression of Gαi*-BERKY3 or Gβγ-BERKY3 at levels that permit detecting the activity of endogenous G-proteins does not interfere significantly with G-protein signaling in cells.
Given the ability of Gαi*-BERKY3 and Gβγ-BERKY3 to detect the activity of endogenous G-proteins in cell lines, we set out to determine if they would also be powerful enough to detect it in a more physiologically relevant system. We chose primary cultures of cortical neurons, as they recapitulate many of the cell-autonomous physiological responses of neurons, including the GPCR/G-protein signaling machinery responsible for slow (metabotropic) neuromodulation. We acutely transduced cortical neurons with lentiviruses for the expression of Gαi*-BERKY3, Gβγ-BERKY1, or Gαq*-BERKY1 under a neuron-specific promoter (human Synapsin, hSyn) and measured BRET upon GPCR modulation (Fig. 7F). Stimulation of α2-AR (brimonidine), or GABAB receptors (baclofen) elicited a rapid increase in BRET in neurons expressing either Gαi*-BERKY3 or Gβγ-BERKY1 (Fig. 7G, H), which was reverted upon addition of an antagonist for each respective GPCR. These responses were blunted by Ptx (Fig. 7G, H), thereby confirming that the measured BRET responses report the activation of endogenous Gi proteins. Similar observations were made with other variants of the Gαi-GTP biosensor (Fig. S7E) or upon modulation of adenosine receptors in neurons expressing Gβγ-BERKY1 (Fig. S7F). We also observed responses to agonists for muscarinic (carbachol) or class I glutamate metabotropic receptors ((S)-3,5-DHPG) in neurons expressing Gαq*-BERKY1 (Fig. 7I), which were blunted by the Gq/11 inhibitor YM-254890. Taken together, these results show that BERKY biosensors can detect specifically the activation of endogenous G-proteins in neurons in response to activation of many different types of neurotransmitter receptors.
Conclusions and future perspectives
The G-protein activity biosensors described here have numerous capabilities and features not afforded by other biosensors. An important capability is the detection of activation of endogenous G-proteins, even upon stimulation of endogenous GPCRs, without measurable disturbance of normal G-protein signaling. Moreover, we presented biosensors that are unimolecular, which facilitates their implementation because only one genetic component has to be introduced in cells. This is showcased here by their implementation in four different cell types, including primary cultured neurons that are typically considered poorly tractable for genetic manipulation. Furthermore, both the unimolecular and bimolecular Gα biosensors developed here can directly detect Gα-GTP, which is highly complementary to currently used biosensors that can only monitor Gα-Gβγ dissociation. This idea is supported by our proof of principle experiments showing the utility of Gα-GTP biosensors to dissect mechanisms of G-protein modulation by regulators or by disease-associated mutations. Finally, the modular design of the biosensors described here makes them well suited for customization, adaptation and/or optimization. Overall, the capabilities afforded by our suite of biosensors could be leveraged for GPCR drug development by allowing the study of G-protein activation in greater depth and in more physiologically relevant systems.
Nevertheless, some limitations of these biosensors’ design should be kept in mind. For example, there is room for improvement in the dynamic range of the BERKY unimolecular biosensors when compared to their bi-molecular biosensor counterparts. However, we note that the BERKY biosensor design presented here was not subject to a thorough optimization, which could include exploring different dipole orientations of the BRET donor and acceptor, implementing longer ER/K α-helices (Sivaramakrishnan and Spudich, 2011), or modifying the flexible linkers between individual modules. Also, although the modularity of the biosensor design is a positive feature that allowed us to develop a suite of related probes, identifying the right detector modules can prove challenging. For example, we found that a Gα13-GTP biosensor based on the RH domain of p115-RhoGEF was less robust than the one based on PRGRH (Fig. S4B) and we are yet to identify a detector module for Gαs-GTP. Finally, the biosensors described here have good temporal resolution (sub-second), but no spatial resolution. A reasonable future goal is to convert these BRET biosensors into imaging-compatible probes based on FRET, which, again, should be greatly facilitated by the modular nature of the BERKY design.
Although our BERKY biosensors can detect the activation of endogenously expressed G-proteins, one potential concern is whether this reflects their true endogenous activity not modified by the presence of the biosensor. Expression of the biosensors at high levels could alter normal G-protein signaling because the detector modules utilized occlude the effector binding sites on their cognate G-protein targets. Although this is a general unavoidable caveat for virtually any biosensor, we provide direct evidence that expression of BERKY biosensors at low levels, yet sufficient to allow robust detection of endogenous responses, does not have a measurable interference with downstream signaling (Fig. 7A-F).
GPCRs not only signal by coupling to G-proteins, but also to arrestins (Weis and Kobilka, 2018). However, current biosensors for arrestin activation require exogenous arrestin expression, and, barring exceptions (Lee et al., 2016; Nuber et al., 2016), they also rely on bulky tags. Complementing biosensors that detect the activity of endogenous G-proteins with biosensors for endogenous arrestins would be very useful to rigorously probe into the concept of ligand-induced biased signaling (Wisler et al., 2018).
In summary, here we have presented a toolkit that allows the investigation of G-protein activity in cells with unprecedented fidelity by using rational design principles that can be implemented to develop new or optimized biosensors in the future.
STAR Methods
RESOURCE AVAILABILITY
Lead Contact
Further information and requests for resources and reagents should be directed to and will be fulfilled by the Lead Contact, Mikel Garcia-Marcos (mgm1@bu.edu).
Materials Availability
All unique reagents generated in this study are available from the Lead Contact but we may require a completed Materials Transfer Agreement if there is potential for commercial application.
Data and Code Availability
Original data for Gαi3 immunoblots in the paper is available as a Mendeley dataset (http://dx.doi.org/10.17632/n3s5g457fm.1)
EXPERIMENTAL MODEL AND SUBJECT DETAILS
Cell lines
HEK293T cells (ATCC cat# CRL-3216,) and HeLa cells (ATCC cat# CCL-2) were grown at 37°C, 5% CO2 in DMEM supplemented with 10% FBS, 100 U/ml penicillin, 100 μg/ml streptomycin, and 1% L-glutamine. SH-SY5Y cells (ATCC cat# CRL-2266) were grown at 37°C, 5% CO2 in DMEM supplemented with 100 U/ml penicillin, 100 μg/ml streptomycin, 1% L-glutamine, and 15% heat-inactivated FBS.
Mouse primary cortical neuron culture
Cortical neurons were isolated from neonatal mouse (C57BL/6, Charles River, Strain code 027) brains as previously described (Kaech and Banker, 2006) with modifications. All animal procedures were approved by the Institutional Animal Care and Use Committee (IACUC) at Boston University School of Medicine. Newborn mouse pups (P0) were euthanized by decapitation, brains removed from the skull, and placed in cold HBSS. The cerebrum was detached from other brain regions under a stereomicroscope by removal of the olfactory bulb and cerebellum, the brain removed from the meninges and separated into hemispheres, and the cortex dissected out with forceps. The cortex was minced into approximately 1-2 mm pieces using a sterile razor blade, and digested with 0.05% Trypsin in HBSS for 10 min at 37 °C. Trypsinized tissue was washed three times with HBSS to remove trypsin, and resuspended in DMEM supplemented with 10% FBS, 100 U/ml penicillin, 100 μg/ml streptomycin, and 1% L-glutamine (complete DMEM) before passing through a sterile 40 μm cell strainer (Fisherbrand, cat# 22363547) to obtain a cell suspension. Approximately 50,000-75,000 cells were plated on 5 mm diameter coverslips (coated overnight with 0.1 mg/mL poly-L-lysine hydrobromide, and washed 3x with HBSS) and placed in 96-well plates containing complete DMEM for 4 h, before replacing one half of the media with Neurobasal media (Gibco, cat# 21103049) with B-27 supplement (Gibco, cat# 17504001) and 1x Glutamax-I (Gibco, cat# 35050061) (complete neural medium). On day in vitro 3 (DIV3), one half of the media was replaced with complete neural media supplemented with 5 μM AraC. Beginning DIV5, half of the media was replaced by fresh complete neural medium every other day.
METHOD DETAILS
Plasmids
The plasmid encoding KB-1753-Nluc (pcDNA3.1-mas-KB-1753-Nluc) was generated by replacing the GRK3ct sequence of pcDNA3.1-mas-GRK3ct-NanoLuc (Masuho et al., 2015) by digestion with HindIII/BamHI and subsequent insertion of the KB-1753 sequence (SSRGYYHGIWVGEEGRLSR) flanked with a Gly-Gly linker on each end. A similar approach was followed to generate the plasmids encoding GRK2RH-Nluc (pcDNA3.1-masGRK2RH-Nluc), p115RH-Nluc (pcDNA3.1-mas-p115RH-Nluc) and PRGRH-Nluc (pcDNA3.1-mas-PRGRH-Nluc). Essentially, the RGS homology (RH) domain from bovine GRK2 (aa 45-178), human p115-RhoGEF (aa 43-250, RH domain lacking the N-terminal extension that confers GAP activity (Chen et al., 2003)) or rat PDZ-RhoGEF (aa 307-508) replaced the position originally used by the GRK3ct cassette in pcDNA3.1-masGRK3ct-NanoLuc. Plasmids encoding untagged and split Venus-tagged Gβ1 and Gγ2 (pcDNA3.1-Gβ1, pcDNA3.1-Gγ2, pcDNA3.1-Venus(155-239)-Gβ1, pcDNA3.1-Venus(1-155)-Gγ2) have been described previously (Hollins et al., 2009). Plasmids encoding Gαq-YFP (wild-type and Q209P mutant) and Gαi3-YFP have been described previously (Marivin et al., 2016; Maziarz et al., 2018b; Qin et al., 2011), and plasmids encoding YFP-tagged Gαs and Gαo were obtained from Addgene (Yost et al., 2007). Plasmids encoding untagged Gαi3 and untagged Gαo have been described previously (Garcia-Marcos et al., 2011; Ghosh et al., 2008). Plasmid pcDNA3.1-Gα13(EE)-YFP encoding Gα13 internally-tagged with the Citrine variant of YFP in the b/c loop was generated by first introducing a SacII restriction site after amino acid P131 into pcDNA3.1-Gα13(EE) and then inserting Citrine, flanked by a GSG linker on each end, at this site by Gibson assembly. The plasmid encoding α2A-AR (pcDNA3-α2A/D-AR) has been described previously (Oner et al., 2010) and the plasmids for β2-AR (Tang et al., 1999) and PAR1 (Ishii et al., 1993) were obtained from Addgene. Plasmid pmRFP-FKBP-RGS12-GL encoding FKBP-R12-GoLoco was constructed by replacing the pseudojanin sequence between the NruI/BamHI sites of pmRFP-FKBP-pseudojanin (Addgene, #37999) by mouse RGS12 amino acids 1185-1221 (DEAEEFFELISKAQSNRADDQRGLLRKEDLVLPEFLR). Plasmid pmRFP-FKBP-Ric-8A encoding Ric-8A tagged with RFP and FKBP was constructed by replacing the pseudojanin sequence between the NruI/BamHI sites of pmRFP-FKBP-pseudojanin (Addgene, #37999) by rat Ric-8A amino acids 12-492. The plasmid encoding Lyn11-FRB has been described previously (Parag-Sharma et al., 2016). The plasmid encoding the pertussis toxin insensitive C351I mutant of Gαi3 (p3xFLAG-CMV-14-Gαi3 C351I) was generated by mutating codon 351 and by placing a stop codon before the 3XFLAG tag of p3xFLAG-CMV-14-Gαi3 (Garcia-Marcos et al., 2010). The plasmid for the bacterial expression of GST-fused GAIP (pGEX-KG-GAIP) has been described previously (De Vries et al., 1995). Plasmids encoding M3R, M4R, RGS8, Gα13(EE) and Gαs (pcDNA3.1-3xHA-M3R, pcDNA3.1-3xHA-M4R, pcDNA3.1-3xHA-ADRA1A, pcDNA3.1(−) 3xHA-RGS8, pcDNA3.1-Gα13(EE), and pcDNA3.1-Gαs (short)) were obtained from the cDNA Resource Center at Bloomsburg University. The plasmids encoding MOR (pcDNA3.1-MOR-FLAG) has been described previously (Masuho et al., 2015).
Plasmids encoding BERKY biosensors were generated sequentially from a synthetic DNA fragment containing the following elements (from N- to C-terminus of the protein sequence): Lyn11 / Nluc / ER/K α-helix / YFP (Citrine variant) / KB-1753 / myc-tag. Each of these elements was separated by glycine-rich linkers and unique restriction sites, and the ER/K α-helix sequence was obtained from pcDNA-FRT-FAK-kinase10 (Addgene #59123) (Ritt et al., 2013). A full sequence of this and other BERKY constructs is provided in Data S1. This synthetic DNA was inserted between the NheI/XbaI sites in pcDNA3.1(+) to generate pcDNA3.1-Gαi*-BERKY1. pcDNA3.1-Gαi*-BERKY2 and pcDNA3.1-Gαi*-BERKY3 were generated sequentially by inserting a first YFP into a BamHI site of Gαi*-BERKY1 and a second one into the AscI site of Gαi*-BERKY2. Plasmid pcDNA3.1-KB-1746-BERKY3 was constructed by inserting the KB-1746 sequence (SSSYSEHCQRWGCYARLSR) into XhoI-digested pcDNA3.1-Gαi*-BERKY3 by Gibson assembly, which results in the replacement of the KB-1753 sequence. Plasmids pcDNA3.1-Gαq*-BERKY3, pcDNA3.1-Gα13*-BERKY3, pcDNA3.1-Gβγ-BERKY3, and pcDNA3.1-Rho*-BERKY3 were generated by inserting GRK2RH, PRGRH, GRK3ct, or Rhotekin’s RBD (amino acids 7-89), respectively, followed by a stop codon into XhoI-digested pcDNA3.1-Gαi*-BERKY3, which results in the replacement of the KB-1753 sequence and myc tag. Lentiviral plasmids encoding Gαi*-BERKY3 (pLVX-IRES-Gαi*-BERKY3), Gαq*-BERKY3 (pLVX-IRES-Gαq*-BERKY3), and Gβγ-BERKY3 (pLVX-IREβγ-BERKY3) under the control of the CMV promoter were generated by PCR amplification from their respective pcDNA3.1-based plasmids (including NheI/XbaI flanking sites that remained intact in the final construct) and insertion into the Xhol site of pLVX-IRES-Hyg (Clontech, cat# 632185) by Gibson assembly. The lentiviral constructs encoding Gαi*-BERKY1 and Gαi*-BERKY3 under the control of human synapsin (hSyn) promoter (pLenti-hSyn-Gαi*-BERKY1 and pLenti-hSyn-Gαi*-BERKY3, respectively) were constructed by inserting the respective NheI-XbaI fragment from pcDNA3.1-Gαi*-BERKY1 or pcDNA3.1-Gαi*-BERKY3 (encompassing the entire biosensor sequence) between the AgeI and EcoRI sites of pLenti-hSynapsin-Cre-WPRE (Addgene #86641, (Sakurai et al., 2016)) by Gibson assembly, such that both sites were destroyed and replaced by NheI/GCCACC in the 5’ end and XbaI/AgeI in the 3’ end, respectively. The lentiviral construct encoding Gβγ-BERKY1 (pLenti-hSyn-Gβγ-BERKY1) was designed by inserting the GRK3ct coding sequence followed by a stop codon between the AgeI sites of pLenti-hSyn-Gαi*-BERKY1, which results in the replacement of the KB-1753 sequence and myc tag. The construct encoding Gαq*-BERKY1 (pLenti-hSyn-Gαq*-BERKY1) was designed in two steps. First, GRK2rh followed by a stop codon was inserted into Xhol-digested pcDNA3.1-Gαi*-BERKY1 to generate pcDNA3.1-Gαq*-BERKY1, which was then used to transfer the biosensor sequence flanked by NheI and XbaI into pLenti-hSynapsin-Cre-WPRE using an approach analogous to that described above for pLenti-hSyn-Gβγ-BERKY1. All plasmids were purified from DH5α bacteria. All point mutations were generated using QuikChange II (Agilent, #200523).
Bioluminescence Resonance Energy Transfer (BRET) measurements in HEK293T and SH-SY5Y cells
HEK293T cells were seeded on 6-well plates (~400,000 cells/well) coated with 0.1% gelatin, transfected ~24 h later using the calcium phosphate method. For experiments with bi-molecular biosensors consisting of YFP-tagged Gα proteins and Nluc-fused detector modules (Fig. 1, Fig. 2, Fig. 4, Fig. 5, Fig. S1, Fig. S3, Fig. S4, and Fig. S5), cells were transfected with the following amounts of plasmid DNA per well of the constructs indicated in the corresponding figures: 0.5-1 μg for Gαi3-YFP, Gαq-YFP (except in Fig. S2A, which was 0.25 μg), Gαs-YFP, Gαo-YFP or Gα13-YFP, 0.025-0.2 μg for mas-KB-1753-Nluc, and 0.05-0.2 μg for mas-GRK2RH-Nluc, mas-p115RH-Nluc and mas-PRGRH-Nluc. Essentially, optimal donor: acceptor ratios were roughly estimated to be between 1:10 and 1:20 in preliminary experiments by empirically measuring receptor-mediated responses, and occasionally re-titrated due to minor changes in experimental conditions like batch of plasmid preparations or transfection reagents. When included, 0.2 μg of plasmid DNA were transfected for Gβ1 and Gγ2. For experiments with bi-molecular Gβγ biosensors (Fig. 2, Fig. S1E), cells were transfected as follows: 0.5-1 μg for Gαi3, Gαq, Gαs, or Gαo, 0.2 μg for VC-Gβ1 and VN-Gγ2, and 0.2 μg of mas-GRK3ct-Nluc. For experiments shown in Fig. 2 and Fig. S1D, cells were transfected with 3 μg for Lyn11-FRB and 0.1 μg for FKBP-R12-GoLoco or 0.05 μg for Ric-8A plasmids in addition to the rest of the BRET biosensor components and GPCRs. For experiments with unimolecular BERKY biosensors (Fig. 3, Fig. 6, and Fig. S2), HEK293T cells were transfected with 0.1-0.2 μg of plasmid DNA per well for Gαi*-BERKY1, Gαi*-BERKY2, Gαi*-BERKY3, KB-1746-BERKY3, Gαq*-BERKY3, Gα13*-BERKY3 or Gβγ-BERKY3. For experiments with Rho*-BERKY3, cells were transfected with 0.025 μθ of plasmid DNA per well. When included, 0.2 μθ of plasmid DNA were transfected for Gβ1 and Gy2, and 1 μθ for Gαi3, Gαi3 C351I, Gαo, Gαq or Gα13, except in Fig. S2F, for which different amounts of Gαi3 were transfected as indicated. The amount for all GPCR plasmid constructs was 0.2 μg per well.
Approximately 18-24 h after transfection, cells were washed with PBS, harvested by gentle scraping, and centrifuged for 5 min at 550 x g. Cells were resuspended in assay buffer (140 mM NaCl, 5 mM KCl, 1 mM MgCl2, 1 mM CaCl2, 0.37 mM NaH2PO4, 20 mM HEPES pH 7.4, 0.1% glucose) at a concentration of 1 million cells/ml. 25,000-50,000 cells were added to a white opaque 96-well plate (Opti-Plate, Perkin Elmer) and mixed with the nanoluciferase substrate Nano-Glo (Promega cat# N1120, final dilution 1:200) for 2 min before measuring luminescence signals in a POLARstar OMEGA plate reader (BMG Labtech) at 28 °C. Luminescence was measured at 460 ± 40 nm and 535 ± 10 nm, and BRET was calculated as the ratio between the emission intensity at 535 ± 10 nm divided by the emission intensity at 460 ± 40 nm. For kinetic BRET measurements, luminescence signals were measured every 0.24 seconds for the duration of the experiment, except for experiments in Fig. 2D, and Fig S2E-G to determine G-protein activation kinetics, in which measurements were done every 0.04 seconds. Reagents were added to the wells during live measurements using injectors. BRET data are presented as the difference from baseline BRET signal (average of 30 seconds pre-stimulation). For experiments with Rho*-BERKY3 (Fig. 6D), BRET measurements were carried out with adherent cells by carrying out the modified protocol described next. The day after transfection 12,500-25,000 cells were re-seeded on white opaque 96-well plates coated with 0.1% gelatin, in the presence of DMEM supplemented with 10% FBS, 100 U/ml penicillin, 100 μg/ml streptomycin, and 1% L-glutamine. After 3 h at 37 °C in 5% CO2, media was changed for assay buffer and incubated under the same conditions for 45 min. Cells were equilibrated to room temperature for 15 min before performing BRET measurements as described above. For calculations of BRET response amplitude determined from kinetic experiments, differences were calculated between the pre-stimulation baseline BRET signal and the maximal activation after agonist stimulation (typically between 60-90 s). For endpoint BRET measurements shown in Fig. 5B, and Fig. S5B, luminescence was read consecutively three times every 30 seconds and the resulting BRET ratio (535nm luminescence / 460 nm luminescence) values averaged. BRET measurements in SH-SY5Y stable cell lines (see “Generation of cell lines stably expressing unimolecular biosensors” below) shown in Fig. S7 were performed essentially as described above for HEK293T cells, except that cells were seeded on 35 mm plates (~900,000 cells/plate) and harvested after approximately 24 h as described above. At the end of some BRET experiments, a separate aliquot of the same pool of cells used for the luminescence measurements was centrifuged for 1 min at 14,000 x g and pellets stored at −20 °C for subsequent immunoblot analysis (see “Protein electrophoresis and Immunoblotting” section below).
In Vitro protein binding assays
Protein-protein binding assays with purified GST-fused constructs and proteins expressed in mammalian cells were performed essentially as previously described (Maziarz et al., 2018b). Approximately two million HEK293T cells were seeded on 100 mm dishes and transfected the following day using the calcium phosphate method with 3 μg of plasmids encoding Gαq-YFP (WT or R247L mutants). Twenty-four hours after transfection, cells were lysed on ice with lysis buffer (20 mM Hepes, pH 7.2, 125 mM K(CH3COO), 0.4% (v:v) TritonX-100, 1 mM DTT, 10 mM β-glycerophosphate, 30 μM GDP and 0.5 mM Na3VO4 supplemented with a protease inhibitor [SigmaFAST, cat# S8830]). For some conditions, the lysis buffer was supplemented with 30 μM AlCl3, 10 mM NaF and 10 mM MgCl2 (AlF4- condition). Cell lysates were cleared (14,000 x g, 10 min) and used as the source of soluble protein ligands for immobilized GST-fused proteins in pulldown assays. GST-GAIP purification from BL21(DE3) bacteria was carried out exactly as described previously (Maziarz et al., 2018b). GST-GAIP (7.5 μg per condition) was immobilized on glutathione-agarose beads for 90 min at room temperature in PBS. Beads were washed twice with PBS and resuspended in 400 μl of binding buffer (50 mM Tris-HCl, pH 7.4, 100 mM NaCl, 0.4% (v:v) NP-40, 5 mM EDTA, 30 μM GDP, 2 mM DTT), which in some cases was supplemented with 30 μM AlCl3, 10 mM NaF and 10 mM MgCl2 (AlF4 condition). After addition of cleared HEK293T cell lysates (~400 μg of total protein), tubes were incubated 90 minutes at 4 °C with constant rotation. Beads were rapidly washed four times with 1 ml of wash buffer (4.3 mM Na2HPO4, 1.4 mM KH2PO4, pH 7.4, 137 mM NaCl, 2.7 mM KCl, 0.1% (v/v) Tween-20, 30 μM GDP, 5 mM EDTA, 1 mM DTT), which in some cases was supplemented with 30 μM AlCl3, 10 mM NaF and 10 mM MgCl2 (AlF4− condition). Resinbound proteins were eluted with Laemmli sample buffer by incubation at 37 °C for 10 min and stored at −20 °C for subsequent immunoblot analysis (see “Protein electrophoresis and Immunoblotting’ section below).
Serum Response Element (SRE) reporter assays
SRE reporter assays were performed as previously described (Maziarz et al., 2018b) with minor modifications. Briefly, HEK293T cells were seeded on 6-well plates (~350,000 cells per well) and transfected 16-24 h later with plasmids pGL3-SRE.L (0.5 μg, (Wells et al., 2001)) and pCMV-Beta (0.5 μg), along with plasmids for the expression of Gα13-YFP (WT or mutants, 0.2-0.4 μg per well) using the calcium phosphate method. Approximately 6 h after transfection, media was replaced by DMEM containing 0.5% FBS. 16-24 h after transfection, cells were washed with PBS and harvested by gentle scraping followed by centrifugation. Approximately 80% of the cells from one well were pelleted and stored at −20 °C for subsequent immunoblot analysis (see “Protein electrophoresis and Immunoblotting’ section below). The remaining 20% of the cells were lysed in 60 μl of lysis buffer (Promega, Cat #E2920) for measurement of firefly luciferase and β-galactosidase activity. Fifty μl of the lysates were transferred to wells of a white 96-well OptiPlate (Perkin-Elmer, cat# 6005290) for the determination of firefly luciferase activity using the Dual-Glo Luciferase Assay System (Promega, Cat# E2920) following the manufacturer’s instructions. Five μl of the lysates were transferred to wells of a black 96-well OptiPlate (Perkin-Elmer, cat# 6005270) and incubated with 100 μL of the fluorogenic substrate fluorescein di-β-D-galactopyranoside (FDG) (10 μM diluted in 100 mM sodium phosphate buffer, pH 7.5, 1 mM MgCl2, β-mercaptoethanol)) for the determination of β-galactosidase activity following a previously described protocol (Maziarz et al., 2018a). Briefly, fluorescence (Excitation 485 ± 10 nm; Emission 528 ± 10 nm) was measured in a BioTek Synergy H1 plate reader at 30°C every 2 minutes for 90 minutes, and β-galactosidase activity was determined by the fluorescence signal at a time point within the linear portion of the curve, typically between 40-60 min from the beginning of the measurement. For each sample, luciferase activity was normalized to β-galactosidase activity, and SRE activation was calculated as the fold-change of normalized luciferase activity relative to activity of cells expressing a control plasmid (pcDNA3.1).
Generation of cell lines stably expressing unimolecular biosensors
Cell lines stably expressing Gαi*-BERKY3, Gβγ-BERKY3, or Gαq*-BERKY3 were generated by lentiviral transduction following previously described procedures with minor modifications (Leyme et al., 2015). Lentivirus packaging was performed in HEK293T cells by co-transfection of the lentiviral plasmid encoding Gαi*-BERKY3, Gβγ-BERKY3, or Gαq*-BERKY3 (in the pLVX-IRES-Hyg backbone) with the packaging plasmids pSPAX2 (Addgene #12260) and pMD2.G (Addgene #12259) at a 1:1:0.5 ratio. Approximately 6 h after transfection the media was changed, and ~42 h later, lentivirus-containing media were collected, centrifuged at 500 x g for 3 min, and passed through a 0.45 μm PES filter. HeLa cells or SH-SY5Y cells seeded in 6-well plates (~200,000 cells / well) were incubated with the supernatant of Gαi*-BERKY3− , Gβγ-BERKY3−, or Gαq*-BERKY3-packaged lentivirus (mixed 1:1 with fresh media) for 2 days, followed by selection with 200 μg/ml hygromycin. All surviving clones were pooled and maintained in the presence of 100 μg/ml hygromycin.
cAMP measurements
Naive HeLa cells, or HeLa cells stably expressing Gαi*-BERKY3 or Gβγ-BERKY3, were seeded in 6-well plates (~400,000 cells / well). After 16-18 h, cells were washed with PBS, resuspended in assay buffer (140 mM NaCl, 5 mM KCl, 1 mM MgCl2, 1 mM CaCl2, 0.37 mM NaH2PO4, 20 mM HEPES pH 7.4, 0.1% glucose), centrifuged for 5 min at 1000 x g, and resuspended at a density of 2 million cells /ml of assay buffer supplemented with 0.1% BSA and 1 mM IBMX. After incubation at room temperature for 15 min, cells were stimulated with forskolin (10 μM) for 5 min followed by treatment with different concentrations (0-3000 nM) of brimonidine for 10 min. cAMP was quantified using the LANCE cAMP kit (PerkinElmer, Cat # AD0262) with modifications. Briefly, cells were lysed with the Detection Buffer provided by the kit, and boiled for 3 min at 95°C. All subsequent steps were carried out at room temperature. Following a centrifugation of 3 min at 5,000 x g to sediment particulate material, aliquots of the supernatant were transferred to duplicate wells of a white flat-bottom 384-well ProxiPlate (Perkin Elmer, cat # 6008280) and incubated with anti-cAMP antibody for 30 min. Then, Eu-W8044-streptavidin and biotin-cAMP tracer were added to the wells and after 1 h incubation TRFRET was measured in a TECAN Infinite M1000 (excitation 317 nm, emission 620 and 665 nm). For each experiment, cAMP was quantified by comparison to a standard curve prepared in duplicate.
ERK1/2 phosphorylation measurements
Naive HeLa cells, or HeLa cells stably expressing Gαi*-BERKY3 or Gβγ-BERKY3, were seeded in 35 mm plates (~ 200,000 cells/plate). After 24 h, media was replaced with DMEM containing 0.2% FBS. After 16-18 h, cells were treated with 3 μM brimonidine for 5 or 10 min. Stimulation was stopped by placing the plates on ice, washing rapidly with cold PBS, and adding lysis buffer (20 mM Hepes, pH 7.2, 5 mM Mg(CH3COO)2, 125 mM K(CH3COO), 0.4% (v:v) TritonX-100, 1 mM DTT, 10 mM β-glycerophosphate, and 0.5 mM Na3VO4 supplemented with a protease inhibitor cocktail [SigmaFAST, cat# S8830]). The same procedure was carried out for untreated cells at time zero to harvest unstimulated controls. Cells in cold lysis buffer were harvested by scraping, transferred to cold microcentrifuge tubes, and the lysates were cleared by centrifugation and subject to SDS-PAGE and immunoblotting as described in “Protein Electrophoresis and Immunoblotting.”
Lentiviral transduction of primary cortical neurons
For the transduction of cultured neurons, lentiviruses were concentrated after large scale packaging as described next. HEK293T cells (Lenti-X 293T, Cat# 632180, Takara Bio) were plated in 150 mm diameter dishes (~2.5 million cells / dish) and cultured at 37°C, 5% CO2 in DMEM supplemented with 10% FBS, 100 U/ml penicillin, 100 μg/ml streptomycin, and 1% L-glutamine. After 16-24 h, cells were co-transfected with plasmids encoding Gαi*-BERKY3, Gαi*-BERKY1, Gβγ-BERKY1, or Gαq*-BERKY1 (27 μg / dish) along with the packaging plasmid psPAX2 (18 μg / dish) and the envelope plasmid pMD2.G (11.25 μg / dish) using the polyethylenimine (PEI) method (Longo et al., 2013) at a 2:1 PEI:DNA ratio. Approximately 16 h after transfection, media was replaced with serum-free media. Lentivirus containing media was collected 24 and 48 h after the initial media change (~70 ml per dish and 4 dishes for each construct). Media was centrifuged for 5 min at 900 x g and filtered through a 0.45 μm sterile PES filter. Filtered media was centrifuged for ~12 h at 17,200 x g at 4°C (Sorvall RC6+, ThermoScientific F12-6x500 LEX rotor) to sediment lentiviral particles. Pellets were washed and gently resuspended in 1 ml of PBS and centrifuged at 50,000 x g for 1 h at 4°C (Beckman Optima MAX-E, TLA-55 rotor). Pellets were resuspended in 500 μl of PBS to obtain concentrated lentiviral stocks that were stored at −80°C in aliquots. Each aliquot was thawed only once for subsequent experiments. Primary cortical neurons were transduced with lentiviruses encoding Gαi*-BERKY3, Gαi*-BERKY1, Gβγ-BERKY1, or Gαq*-BERKY1 on DIV7-8 by replacing one half of the media with complete neural media containing lentivirus (final 1:200 dilution) for 1 h, followed by another replacement of one half of the media with fresh complete neural media. Neurons were cultured as described above until experiments were performed at DIV12-16.
BRET measurements in HeLa cells and mouse cortical neurons
HeLa cells stably expressing Gαi*-BERKY3 or Gβγ-BERKY3 were seeded on poly-L-lysine-coated 5 mm coverslips (~35,000 cells/ coverslip) placed on 96-well plates and allowed to grow in complete media for 16-24 h before BRET measurements. For measurements with mouse cortical neurons, coverslips of cells transduced with lentiviruses as described above in the section “Lentiviral transduction of primary cortical neurons” were processed on DIV 12-16. For each individual measurement, cells were washed with assay buffer (140 mM NaCl, 5 mM KCl, 1 mM MgCl2, 1 mM CaCl2, 0.37 mM NaH2PO4, 20 mM HEPES pH 7.4, 0.1% glucose) and the corresponding coverslip transferred to a new well containing assay buffer for an equilibration incubation of 10-20 min (for Hela cells) or 2-10 min (for neurons) at room temperature in assay buffer. Then, coverslips were transferred to white opaque 96-well plates containing assay buffer and Nano-Glo (final dilution 1:200), and BRET measurements carried out in a POLARstar OMEGA plate reader (BMG Labtech) at 28 °C as described above in the section “Bioluminescence Resonance Energy Transfer (BRET) measurements in HEK293T and SH-SY5Y cells”. BRET measurements with transiently transfected HeLa cells in suspension shown in Fig. S6A were also performed as described for HEK293T and SH-SY5Y cells, except that cells were transfected with 1 μg of Gαi*-BERKY3 plasmid DNA using Lipofectamine LTX reagent and following the manufacturer’s instructions.
Immunofluorescence
SH-SY5Y cells, HeLa cells, or primary cortical neurons grown on glass coverslips were fixed with 4% paraformaldehyde diluted in PBS for 10 min at room temperature. Cells were washed 3 times with PBS, permeabilized for 5 min in PBS containing 0.25% (v/v) Triton X-100, and incubated in blocking solution (5% (v/v) normal goat serum, 0.1% (v/v) Triton X-100 in PBS) for 1 hour. Cells were incubated overnight at 4°C with primary antibody diluted in blocking solution (mouse monoclonal GFP antibody, Santa Cruz, sc-9996, 1:100). Coverslips were washed 3 times with PBS and incubated for 1 hour at room temperature with secondary antibody diluted in blocking solution (goat anti-mouse Alexa Fluor 488, Invitrogen A11017, 1:400). Coverslips were stained with DAPI (1 μg/mL in PBS) for 5 min, washed 3 times in PBS and mounted in ProLong Diamond Antifade (Invitrogen P36965). For experiments with HeLa cells (Fig. S6) and SH-SY5Y cells (Fig. S7), a Zeiss LSM 700 confocal microscope was used to obtain optical sections of 0.29 μm thickness along the Z axis with a 63X oil-immersion objective (numerical aperture [NA] = 1.4; working distance = 0.19 mm) using the ZEN software. For experiments with primary cortical neurons (Fig. 7), images were obtained with a Zeiss AxioObserver D1 wide-field microscope with a 100X oil-immersion objective (numerical aperture [NA] = 1.4; working distance = 0.17 mm) using the ZEN software. Images were adjusted for brightness/contrast and assembled for presentation using ImageJ, Photoshop and Illustrator softwares (Adobe).
Protein electrophoresis and immunoblotting
Pellets of HEK293T cells used in BRET or SRE experiments, or HeLa cells used in ERK1/2 phosphorylation experiments, were resuspended on ice with lysis buffer (20 mM Hepes, pH 7.2, 5 mM Mg(CH3COO)2, 125 mM K(CH3COO), 0.4% (v:v) TritonX-100, 1 mM DTT, 10 mM β-glycerophosphate, and 0.5 mM Na3VO4 supplemented with a protease inhibitor cocktail [SigmaFAST, cat# S8830]). Lysates were cleared by centrifugation (10 min at 14,000 x g, 4°C) and boiled for 5 minutes in Laemmli sample buffer before protein separation by SDS-PAGE and electrophoretic transfer to PVDF membranes for 2 h. For in vitro protein-protein binding experiments, membranes were stained with Ponceau S solution (0.1% w/v Ponceau S in 5% v/v acetic acid) and imaged on a flatbed scanner prior to further immunoblotting. PVDF membranes were blocked with PBS supplemented with 5% non-fat dry milk (or 5% BSA for ERK1/2 experiments) for 1 hour, and then incubated sequentially with primary and secondary antibodies. Primary antibody dilutions were as follows: Gαi1/2/3, 1:250; pan-Gβ, 1:250; α-tubulin, 1:2,500; Nluc, 1:1,000 (Hall et al., 2012); Gαo, 1:250; Gαq, 1:1,000; Gαs, 1:250; HA, 1:1,000; GFP, 1:1,000; RFP, 1:1,000; Myc, 1:1,000; pERK1/2 (T202/Y204), 1:1,000; and ERK1/2, 1:100. Two different primary antibodies for Gαi3 were used as follows: Gαi3 (Santa Cruz Biotechnology) was used at 1:250 dilution in Fig. 1C and Fig 3B; Gαi3 (Aviva Systems Biology) was used at 1:1,000 dilution in Fig. 1E, Fig. 4E, and Fig. S2F. Secondary antibodies (goat anti-rabbit conjugated to AlexaFluor 680 (Life Technologies) or goat anti-mouse conjugated to IRDye 800 (LI-COR Biosciences)) were used at 1:10,000. Infrared imaging of immunoblots was performed according to manufacturer’s recommendations using an Odyssey infrared imaging system (LI-COR Biosciences). Images were processed using the ImageJ software (NIH) and assembled for presentation using Photoshop and Illustrator software (Adobe).
QUANTIFICATION AND STATISTICAL ANALYSIS
All experiments were performed at least three times, as indicated in the figure legends, and, unless otherwise indicated, they are presented as averages ± the standard error of the mean (S.E.M). For the sake of clarity, in the presentation of kinetic BRET measurements the S.E.M. is only presented in the positive direction and displayed as bars of a lighter color tone than that of its corresponding data points. For experiments in Fig. 3D, and Fig S2E-G to determine G-protein activation kinetics, data were fit either to a one-phase exponential (“one-component”) or to a two-phase exponential (“two-component”) equation in GraphPad Prism using least squares fit. Related parameters (half-times (t1/2), percentage distribution among two components of the fit) and residuals were also determined in GraphPad Prism. EC50 values were also determined in GraphPad Prism by fitting dose-dependence responses to a three-parameter sigmoidal curve (assuming a Hill slope of 1). Protein structure images displayed in Fig. 5A and Fig. S5A were prepared in ICM (Molsoft LLC., San Diego, CA). The data displayed in the lollipop plot of Fig. S5A were obtained through cBioportal by querying the term GNA13 on December 31st, 2019 in all the datasets classified as Bladder Urothelial Carcinoma.
Supplementary Material
Figure S1. Related to Figure 1. Detection of G-protein activation by different GPCRs with Gαi-GTP or free Gβγ biosensors and effect of Ric-8A on Gαi3-YFP.
(A, B) Agonist dose-dependent Gαi-GTP responses using four- or two-component biosensors in HEK293T cells expressing MOR. Naloxone= 100 μM. Mean ± S.E.M, n= 3. (C) Loss of Gαi-GTP response upon mutation of KB-1753-Nluc in HEK293T cells expressing either four- or two-component biosensors. DAMGO= 10 μM; Naloxone= 100 μM. One representative experiment of at least 3.
(D) Co-expression of Ric-8A modestly increases the expression of Gαi3-YFP and enhances BRET signals detected with KB-1753-Nluc with and without GPCR stimulation. BRET measurements were carried out in HEK293T cells with or without GPCR stimulation (M4R, Carbachol= 100 μM) and with or without Ric-8A co-expression. Mean ± S.E.M, n= 3. (E) Top: diagram showing the principle for the free Gβγ bio6sensor. Upon GPCR stimulation, YFP-tagged Gβγ is relieved from Gα-mediated sequestration, which then permits its association with Nluc-tagged GRK3ct and results in the subsequent increase in BRET. Bottom: BRET measurements confirming the release of Gβγ from Gαi, Gαo, Gαq or Gαs. Cells expressing G-proteins with the indicated cognate GPCRs were agonist-stimulated as follows: Gαi3/Gαo, 5 μM brimonidine; Gαq, 100 μM carbachol; Gαs, 10 μM isoproterenol. Mean ± S.E.M, n= 5.
Figure S2. Related to Figure 3. Gαi*-BERKY3 BRET reports endogenous Gi activation upon stimulation of different GPCRs. (A) BRET response upon MOR stimulation in HEK293T cells expressing Gαi*-BERKY3 in the absence (“Endogenous”) or presence of Gαi3/Gβγ overexpression. DAMGO= 10 μM; Naloxone= 100 μM. Mean ± S.E.M, n= 5. (B) Pertussis toxin (Ptx) treatment (0.2 μg/ml overnight) abolishes Gαi*-BERKY3 BRET responses detected in HEK293T cells expressing exogenous Gαi3/Gβγ or only endogenous G-proteins upon α2A-AR stimulation (brimonidine, 5 μM). Mean ± S.E.M, n= 3-5. (C) Pertussis toxin (Ptx) treatment (0.2 μg/ml overnight) does not diminish Gαi*-BERKY3 BRET responses detected in HEK293T cells expressing the Ptx-insensitive mutant Gαi3 C351I upon α2A-AR stimulation (brimonidine, 5 μM). Mean ± S.E.M, n= 3. (D) BERKY3 biosensors containing the KB-1746 peptide sequence instead of the KB-1753 peptide sequence as detector module fail to detect activation of Gi/o proteins. BERKY biosensor designs with different detector modules are shown on the left, and representative traces comparing side by side BRET responses detected with each biosensor in HEK293T cells expressing the indicated G-proteins and the α2A-AR are shown on the right. Brimonidine= 5 μM; Yohimbine= 25 μM. (E) Endogenous Gαi activation kinetics determined by Gαi*-BERKY3 BRET are not affected by expression of exogenous Gβγ. Gαi activation kinetics were determined in HEK293T cells expressing Gαi*-BERKY3 in the absence and presence of Gβγ overexpression (but no Gα) upon GPCR stimulation (α2A-AR, 5 μM brimonidine). Data points are mean ± S.E.M. and solid lines are fits to one-component exponential curves (n= 3-4). Residual plot of the curve fit is shown in the middle panel, and a representative immunoblot confirming the expression of different components is shown on the right. (F) Expression of exogenous Gαi3 alters Gαi activation kinetics and amplitude in a dose-dependent manner as determined by Gαi*-BERKY3 BRET. Gαi activation kinetics were determined in HEK293T cells expressing Gαi*-BERKY3 in presence of different amounts of Gαi3 (as indicated) and constant Gβγ. Data points are mean ± S.E.M. and solid lines are fits to one-component exponential curves (n= 4). Comparison of response amplitude (black) and t1/2 (red) for different amounts of Gαi3 is shown in the middle panel, and a representative immunoblot confirming the expression of different components is shown on the right. (G) Formation of Gα-GTP and formation of free Gβγ proceed with similar kinetics upon GPCR stimulation. Gαi*-BERKY3 or Gβγ-BERKY3 BRET kinetics were determined in HEK293T cells expressing only endogenous G proteins upon GPCR stimulation (a2A-AR, 5 μM brimonidine). Data points are mean ± S.E.M. and solid lines are fits to one-component exponential curves (n= 3). Residual plot of the curve fit is shown in the middle panel, and a representative immunoblot confirming the expression of different components is shown on the right.
Figure S3. Related to Figure 4. Direct detection of GTP-bound Gαq in cells upon long-term stimulation of the M3R or upon stimulation of the α1A-AR.
(A) Carbachol stimulation of the M3R leads to a sustained Gαq-GTP BRET response for over 15 minutes. HEK293T cells expressing the M3R and the components of the Gαq-GTP biosensor were stimulated with carbachol (100 μM, black trace) or left unstimulated (grey trace). One representative experiment of two is shown.
(B) HEK293T cells expressing the M3R or the α1A-AR and the components of the Gαq-GTP biosensor were stimulated with carbachol (100 μM) or phenylephrine (10 μM), respectively. Immunoblots on the bottom show the expression of the two GPCRs and different components of the biosensor system. Mean ± S.E.M, n= 3.
Figure S4. Related to Figure 4. Direct detection of GTP-bound Gα13 in cells.
(A) Gα13-GTP biosensor design principle and representative traces of BRET measurements in HEK293T cells expressing PRGRH-Nluc along with the indicated constructs. BRET response in “+Gα13-YFP” condition without exogenous PAR1 expression likely reflects stimulation of endogenous PAR1 receptors, as previously reported by others with another biosensor of Gα13 activity using the same cell line (PMID: 26628681).. TRAP-6= 30 μM.
(B) PRGRH-Nluc biosensor detects more robust Gα13 BRET responses than p115RH-Nluc in HEK293T cells expressing exogenous PAR1. TRAP-6= 30 μM. Mean ± S.E.M, n= 3.
(C) PRGRH-Nluc biosensor detects agonist dose-dependent Gα13-GTP responses in HEK293T cells expressing PAR1. Mean ± S.E.M, n= 3.
(D) Gα13-GTP BRET responses are reversible and can be detected similarly with either four- or two-component biosensors. HEK293T cells expressing the PAR1 and the indicated components of PRGRH-Nluc biosensors were stimulated with TRAP-6 (1 μM) and in some cases (blue traces) subsequently treated with the antagonist SCH-79797 (10 μM). Mean ± S.E.M, n= 3-4.
(E) Detection of Gα13-GTP but not Gαq-GTP, Gαi3-GTP or Gαs-GTP responses by PRGRH-Nluc upon GPCR agonist stimulation. Cells expressing G-proteins with the indicated cognate GPCRs were agonist-stimulated as follows: Gα13, 10 μM TRAP-6; Gαq, 100 μM carbachol; Gαi3, 10 μM brimonidine; Gαs, 10 μM isoproterenol. Mean ± S.E.M, n= 3.
Figure S5. Related to Figure 5. Characterization of cancer-associated G-protein mutants with a Gα13-GTP biosensor.
(A) Lollipop plot of Gα13 residues mutated in bladder cancer and three dimensional model of Gα13 (PDB: 3AB3) showing the position of selected residues around the nucleotide binding site.
(B) Cancer-associated Gα13 mutants R200K and R200G are constitutively active as determined by the Gα13-GTP biosensor PRGRH-Nluc in HEK293T cells. Mean ± S.E.M, n= 4.
(C) Stimulation of exogenously expressed PAR1 activates Gα13 WT but not Gα13 mutants R200K and R200G as determined by the Gα13-GTP biosensor PRGRH-Nluc in HEK293T cells. Mean ± S.E.M, n= 3.
(D) Cancer-associated Gα13 mutants R200K and R200G are constitutively active as determined by a luciferase reporter of a modified Serum Response Element (SRE) in HEK293T cells. Mean ± S.E.M, n= 3.
Figure S6. Related to Figure 7. Gαi*-BERKY3 BRET response in transiently transfected HeLa cells and cellular localization of Gαi*-BERKY3 and Gβγ-BERKY3 biosensors expressed in HeLa cells.
(A) Transiently transfected Gαi*-BERKY3 detects endogenous G-protein activation by endogenous α2-AR in HeLa. HeLa cells were harvested 24 hours after transfection and rapidly assayed in suspension. Brimonidine= 5 μM; Yohimbine= 25 μM. Mean ± S.E.M, n= 3.
(B, C) HeLa cell lines stably expressing Gαi*-BERKY3 or Gβγ-BERKY3 biosensors generated as depicted in Fig. 7A were imaged by confocal immunofluorescence microscopy. Arrowheads indicate accumulation of signal at the cell periphery, presumably the cell membrane.
Figure S7. Related to Figure 7. Detection of endogenous G-protein activation by multiple endogenous GPCRs in SH-SY5Y cells and primary neurons.
(A) Generation of SH-SY5Y cell lines stably expressing Gαi*-BERKY3, Gβγ-BERKY3 or Gαq*-BERKY3 to monitor G-protein activation upon stimulation of endogenously expressed MOR, DOR, or M3R.
(B, C, D) Endogenous Gαi-GTP (in B), free Gβγ (in C), or Gαq-GTP (in D) BRET responses detected by BERKY biosensors upon stimulation of endogenous GPCRs in SH-SY5Y cells. Mean ± S.E.M. of the number of experiments (n) indicated in the figures. DAMGO= 1 μM; SNC80= 10 μM; Naloxone= 100 μM; Carbachol= 1 mM; Atropine= 100 μM; YM-254890= 10 μM (10 min preincubation). Confocal immunofluorescence images of representative cells expressing BERKY biosensors are shown on the right. Arrowheads indicate accumulation of signal at the cell periphery, presumably the cell membrane.
(E, F) Endogenous Gαi-GTP (in E) or endogenous free Gβγ (in F) BRET responses detected upon stimulation of endogenous GPCRs in primary cortical neurons (DIV 12-16) transduced with Gαi*-BERKY1 or Gβγ-BERKY1, respectively. Responses to α2-AR (brimonidine, 5 μM), GABABR (baclofen, 100 μM) or adenosine receptors (adenoside, 10 μM; NECA, 10 μM) are blocked by pertussis toxin (Ptx, 0.2 μg/ml overnight preincubation). Yohimbine= 25 μM; CGP 54626 (CGP)= 10 μM; DPCPX= 1 μM. Mean ± S.E.M., n= 3-5.
Data S1. Related to STAR Methods. DNA sequences of BERKY constructs.
Highlights.
Optical biosensors directly detect active G-proteins in real-time in live cells
Unimolecular sensors report activity of natively expressed GPCR/G-proteins
Versatile modular design allowed customization for multiple G-protein specificities
Proof-of-principle implementation for cancer and neurobiology applications
ACKNOWLEDGEMENTS:
This work was supported by NIH grants R21MH118745, R01GM136132, and R01GM130120 (to MG-M). MM was supported by an American Cancer Society- Funding Hope Postdoctoral Fellowship, PF-19-084-01-CDD. We thank K. Martemyanov (Scripps Research Institute), N. Lambert (Augusta University), P. Wedegaertner (Thomas Jefferson University), J. Blumer and S. Lanier (Medical University of South Carolina), Mathew Layne (Boston University), and Richard Neubig (Michigan State University) for providing plasmids. We thank Vincent DiGiacomo for cloning the plasmid encoding Gα13-YFP, and Lance Encell (Promega) for kindly providing the nanoluciferase antibody. We thank A. Amelio and K. Parag-Sharma (University of North Carolina, Chapel Hill) for providing the Lenti-X 293T cell line and related protocols of lentiviral production.
Footnotes
Publisher's Disclaimer: This is a PDF file of an article that has undergone enhancements after acceptance, such as the addition of a cover page and metadata, and formatting for readability, but it is not yet the definitive version of record. This version will undergo additional copyediting, typesetting and review before it is published in its final form, but we are providing this version to give early visibility of the article. Please note that, during the production process, errors may be discovered which could affect the content, and all legal disclaimers that apply to the journal pertain.
CONFLICT OF INTEREST: MG-M is listed as an inventor in a provisional patent filed by Boston University related to the content of this manuscript.
REFERENCES
- Berman DM, Wilkie TM, and Gilman AG (1996). GAIP and RGS4 are GTPase-activating proteins for the Gi subfamily of G protein alpha subunits. Cell 86, 445–452. [DOI] [PubMed] [Google Scholar]
- Bunemann M, Frank M, and Lohse MJ (2003). Gi protein activation in intact cells involves subunit rearrangement rather than dissociation. Proceedings of the National Academy of Sciences of the United States of America 100, 16077–16082. [DOI] [PMC free article] [PubMed] [Google Scholar]
- Carman CV, Parent JL, Day PW, Pronin AN, Sternweis PM, Wedegaertner PB, Gilman AG, Benovic JL, and Kozasa T (1999). Selective regulation of Galpha(q/11) by an RGS domain in the G protein-coupled receptor kinase, GRK2. The Journal of biological chemistry 274, 34483–34492. [DOI] [PubMed] [Google Scholar]
- Cerami E, Gao J, Dogrusoz U, Gross BE, Sumer SO, Aksoy BA, Jacobsen A, Byrne CJ, Heuer ML, Larsson E, et al. (2012). The cBio cancer genomics portal: an open platform for exploring multidimensional cancer genomics data. Cancer discovery 2, 401–404. [DOI] [PMC free article] [PubMed] [Google Scholar]
- Chen Z, Singer WD, Danesh SM, Sternweis PC, and Sprang SR (2008). Recognition of the activated states of Galpha13 by the rgRGS domain of PDZRhoGEF. Structure 16, 1532–1543. [DOI] [PMC free article] [PubMed] [Google Scholar]
- Chen Z, Singer WD, Wells CD, Sprang SR, and Sternweis PC (2003). Mapping the Galpha13 binding interface of the rgRGS domain of p115RhoGEF. The Journal of biological chemistry 278, 9912–9919. [DOI] [PubMed] [Google Scholar]
- Chua V, Lapadula D, Randolph C, Benovic JL, Wedegaertner PB, and Aplin AE (2017). Dysregulated GPCR Signaling and Therapeutic Options in Uveal Melanoma. Molecular cancer research : MCR 15, 501–506. [DOI] [PMC free article] [PubMed] [Google Scholar]
- Cismowski MJ, Ma C, Ribas C, Xie X, Spruyt M, Lizano JS, Lanier SM, and Duzic E (2000). Activation of heterotrimeric G-protein signaling by a ras-related protein. Implications for signal integration. The Journal of biological chemistry 275, 23421–23424. [DOI] [PubMed] [Google Scholar]
- Day PW, Tesmer JJ, Sterne-Marr R, Freeman LC, Benovic JL, and Wedegaertner PB (2004). Characterization of the GRK2 binding site of Galphaq. The Journal of biological chemistry 279, 53643–53652. [DOI] [PMC free article] [PubMed] [Google Scholar]
- De Vries L, Mousli M, Wurmser A, and Farquhar MG (1995). GAIP, a protein that specifically interacts with the trimeric G protein G alpha i3, is a member of a protein family with a highly conserved core domain. Proceedings of the National Academy of Sciences of the United States of America 92, 11916–11920. [DOI] [PMC free article] [PubMed] [Google Scholar]
- De Vries L, Zheng B, Fischer T, Elenko E, and Farquhar MG (2000). The regulator of G protein signaling family. Annual review of pharmacology and toxicology 40, 235–271. [DOI] [PubMed] [Google Scholar]
- DiGiacomo V, Marivin A, and Garcia-Marcos M (2018). When Heterotrimeric G Proteins Are Not Activated by G Protein-Coupled Receptors: Structural Insights and Evolutionary Conservation. Biochemistry 57, 255–257. [DOI] [PMC free article] [PubMed] [Google Scholar]
- Dohlman HG, and Thorner J (1997). RGS proteins and signaling by heterotrimeric G proteins. The Journal of biological chemistry 272, 3871–3874. [DOI] [PubMed] [Google Scholar]
- Doi M, and Iwasaki K (2002). Regulation of retrograde signaling at neuromuscular junctions by the novel C2 domain protein AEX-1. Neuron 33, 249–259. [DOI] [PubMed] [Google Scholar]
- Dorsam RT, and Gutkind JS (2007). G-protein-coupled receptors and cancer. Nature reviews 7, 79–94. [DOI] [PubMed] [Google Scholar]
- Druey KM, Blumer KJ, Kang VH, and Kehrl JH (1996). Inhibition of G-protein-mediated MAP kinase activation by a new mammalian gene family. Nature 379, 742–746. [DOI] [PubMed] [Google Scholar]
- Farfel Z, Bourne HR, and Iiri T (1999). The expanding spectrum of G protein diseases. The New England journal of medicine 340, 1012–1020. [DOI] [PubMed] [Google Scholar]
- Gales C, Van Durm JJ, Schaak S, Pontier S, Percherancier Y, Audet M, Paris H, and Bouvier M (2006). Probing the activation-promoted structural rearrangements in preassembled receptor-G protein complexes. Nature structural & molecular biology 13, 778–786. [DOI] [PubMed] [Google Scholar]
- Garcia-Marcos M, Ghosh P, Ear J, and Farquhar MG (2010). A structural determinant that renders G alpha(i) sensitive to activation by GIV/girdin is required to promote cell migration. The Journal of biological chemistry 285, 12765–12777. [DOI] [PMC free article] [PubMed] [Google Scholar]
- Garcia-Marcos M, Ghosh P, and Farquhar MG (2009). GIV is a nonreceptor GEF for G alpha i with a unique motif that regulates Akt signaling. Proceedings of the National Academy of Sciences of the United States of America 106, 3178–3183. [DOI] [PMC free article] [PubMed] [Google Scholar]
- Garcia-Marcos M, Ghosh P, and Farquhar MG (2011). Molecular basis of a novel oncogenic mutation in GNAO1. Oncogene 30, 2691–2696. [DOI] [PMC free article] [PubMed] [Google Scholar]
- Garcia-Marcos M, Ghosh P, and Farquhar MG (2015). GIV/Girdin transmits signals from multiple receptors by triggering trimeric G protein activation. The Journal of biological chemistry 290, 6697–6704. [DOI] [PMC free article] [PubMed] [Google Scholar]
- Ghosh M, Peterson YK, Lanier SM, and Smrcka AV (2003). Receptor- and nucleotide exchange-independent mechanisms for promoting G protein subunit dissociation. The Journal of biological chemistry 278, 34747–34750. [DOI] [PubMed] [Google Scholar]
- Ghosh P, Garcia-Marcos M, Bornheimer SJ, and Farquhar MG (2008). Activation of Galphai3 triggers cell migration via regulation of GIV. The Journal of cell biology 182, 381–393. [DOI] [PMC free article] [PubMed] [Google Scholar]
- Gibson SK, and Gilman AG (2006). Gialpha and Gbeta subunits both define selectivity of G protein activation by alpha2-adrenergic receptors. Proceedings of the National Academy of Sciences of the United States of America 103, 212–217. [DOI] [PMC free article] [PubMed] [Google Scholar]
- Gilman AG (1987). G proteins: transducers of receptor-generated signals. Annual review of biochemistry 56, 615–649. [DOI] [PubMed] [Google Scholar]
- Hall MP, Unch J, Binkowski BF, Valley MP, Butler BL, Wood MG, Otto P, Zimmerman K, Vidugiris G, Machleidt T, et al. (2012). Engineered luciferase reporter from a deep sea shrimp utilizing a novel imidazopyrazinone substrate. ACS chemical biology 7, 1848–1857. [DOI] [PMC free article] [PubMed] [Google Scholar]
- Harding SD, Sharman JL, Faccenda E, Southan C, Pawson AJ, Ireland S, Gray AJG, Bruce L, Alexander SPH, Anderton S, et al. (2018). The IUPHAR/BPS Guide to PHARMACOLOGY in 2018: updates and expansion to encompass the new guide to IMMUNOPHARMACOLOGY. Nucleic acids research 46, D1091–D1106. [DOI] [PMC free article] [PubMed] [Google Scholar]
- Hollins B, Kuravi S, Digby GJ, and Lambert NA (2009). The c-terminus of GRK3 indicates rapid dissociation of G protein heterotrimers. Cellular signalling 21, 1015–1021. [DOI] [PMC free article] [PubMed] [Google Scholar]
- Ishii K, Hein L, Kobilka B, and Coughlin SR (1993). Kinetics of thrombin receptor cleavage on intact cells. Relation to signaling. The Journal of biological chemistry 268, 9780–9786. [PubMed] [Google Scholar]
- Janetopoulos C, Jin T, and Devreotes P (2001). Receptor-mediated activation of heterotrimeric G-proteins in living cells. Science 291, 2408–2411. [DOI] [PubMed] [Google Scholar]
- Johnston CA, Lobanova ES, Shavkunov AS, Low J, Ramer JK, Blaesius R, Fredericks Z, Willard FS, Kuhlman B, Arshavsky VY, et al. (2006). Minimal determinants for binding activated G alpha from the structure of a G alpha(i1)-peptide dimer. Biochemistry 45, 11390–11400. [DOI] [PMC free article] [PubMed] [Google Scholar]
- Johnston CA, Willard FS, Ramer JK, Blaesius R, Roques CN, and Siderovski DP (2008). State-selective binding peptides for heterotrimeric G-protein subunits: novel tools for investigating G-protein signaling dynamics. Combinatorial chemistry & high throughput screening 11, 370–381. [DOI] [PMC free article] [PubMed] [Google Scholar]
- Kimple RJ, Kimple ME, Betts L, Sondek J, and Siderovski DP (2002). Structural determinants for GoLoco-induced inhibition of nucleotide release by Galpha subunits. Nature 416, 878–881. [DOI] [PubMed] [Google Scholar]
- Koch WJ, Hawes BE, Allen LF, and Lefkowitz RJ (1994). Direct evidence that Gi-coupled receptor stimulation of mitogen-activated protein kinase is mediated by G beta gamma activation of p21ras. Proceedings of the National Academy of Sciences of the United States of America 91, 12706–12710. [DOI] [PMC free article] [PubMed] [Google Scholar]
- Lambert NA, Johnston CA, Cappell SD, Kuravi S, Kimple AJ, Willard FS, and Siderovski DP (2010). Regulators of G-protein signaling accelerate GPCR signaling kinetics and govern sensitivity solely by accelerating GTPase activity. Proceedings of the National Academy of Sciences of the United States of America 107, 7066–7071. [DOI] [PMC free article] [PubMed] [Google Scholar]
- Lan KL, Sarvazyan NA, Taussig R, Mackenzie RG, DiBello PR, Dohlman HG, and Neubig RR (1998). A point mutation in Galphao and Galphai1 blocks interaction with regulator of G protein signaling proteins. The Journal of biological chemistry 273, 12794–12797. [DOI] [PubMed] [Google Scholar]
- Landis CA, Masters SB, Spada A, Pace AM, Bourne HR, and Vallar L (1989). GTPase inhibiting mutations activate the alpha chain of Gs and stimulate adenylyl cyclase in human pituitary tumours. Nature 340, 692–696. [DOI] [PubMed] [Google Scholar]
- Lee MH, Appleton KM, Strungs EG, Kwon JY, Morinelli TA, Peterson YK, Laporte SA, and Luttrell LM (2016). The conformational signature of beta-arrestin2 predicts its trafficking and signalling functions. Nature 531, 665–668. [DOI] [PMC free article] [PubMed] [Google Scholar]
- Levitt ES, Purington LC, and Traynor JR (2011). Gi/o-coupled receptors compete for signaling to adenylyl cyclase in SH-SY5Y cells and reduce opioid-mediated cAMP overshoot. Mol Pharmacol 79, 461–471. [DOI] [PMC free article] [PubMed] [Google Scholar]
- Leyme A, Marivin A, Maziarz M, DiGiacomo V, Papakonstantinou MP, Patel PP, Blanco-Canosa JB, Walawalkar IA, Rodriguez-Davila G, Dominguez I, et al. (2017). Specific inhibition of GPCR-independent G protein signaling by a rationally engineered protein. Proceedings of the National Academy of Sciences of the United States of America 114, E10319–E10328. [DOI] [PMC free article] [PubMed] [Google Scholar]
- Leyme A, Marivin A, Perez-Gutierrez L, Nguyen LT, and Garcia-Marcos M (2015). Integrins activate trimeric G proteins via the nonreceptor protein GIV/Girdin. The Journal of cell biology 210, 1165–1184. [DOI] [PMC free article] [PubMed] [Google Scholar]
- Lohse MJ, Nuber S, and Hoffmann C (2012). Fluorescence/bioluminescence resonance energy transfer techniques to study G-protein-coupled receptor activation and signaling. Pharmacological reviews 64, 299–336. [DOI] [PubMed] [Google Scholar]
- Longo PA, Kavran JM, Kim MS, and Leahy DJ (2013). Transient mammalian cell transfection with polyethylenimine (PEI). Methods in enzymology 529, 227–240. [DOI] [PMC free article] [PubMed] [Google Scholar]
- Lyons J, Landis CA, Harsh G, Vallar L, Grunewald K, Feichtinger H, Duh QY, Clark OH, Kawasaki E, Bourne HR, et al. (1990). Two G protein oncogenes in human endocrine tumors. Science 249, 655–659. [DOI] [PubMed] [Google Scholar]
- Marivin A, Leyme A, Parag-Sharma K, DiGiacomo V, Cheung AY, Nguyen LT, Dominguez I, and Garcia-Marcos M (2016). Dominant-negative Galpha subunits are a mechanism of dysregulated heterotrimeric G protein signaling in human disease. Science signaling 9, ra37. [DOI] [PMC free article] [PubMed] [Google Scholar]
- Masuho I, Ostrovskaya O, Kramer GM, Jones CD, Xie K, and Martemyanov KA (2015). Distinct profiles of functional discrimination among G proteins determine the actions of G protein-coupled receptors. Science signaling 8, ra123. [DOI] [PMC free article] [PubMed] [Google Scholar]
- Maziarz M, Broselid S, DiGiacomo V, Park JC, Luebbers A, Garcia-Navarrete L, Blanco-Canosa JB, Baillie GS, and Garcia-Marcos M (2018a). A biochemical and genetic discovery pipeline identifies PLCdelta4b as a nonreceptor activator of heterotrimeric G-proteins. The Journal of biological chemistry 293, 16964–16983. [DOI] [PMC free article] [PubMed] [Google Scholar]
- Maziarz M, Leyme A, Marivin A, Luebbers A, Patel PP, Chen Z, Sprang SR, and Garcia-Marcos M (2018b). Atypical activation of the G protein Galphaq by the oncogenic mutation Q209P. The Journal of biological chemistry 293, 19586–19599. [DOI] [PMC free article] [PubMed] [Google Scholar]
- Nuber S, Zabel U, Lorenz K, Nuber A, Milligan G, Tobin AB, Lohse MJ, and Hoffmann C (2016). beta-Arrestin biosensors reveal a rapid, receptor-dependent activation/deactivation cycle. Nature 531, 661–664. [DOI] [PMC free article] [PubMed] [Google Scholar]
- O'Hayre M, Inoue A, Kufareva I, Wang Z, Mikelis CM, Drummond RA, Avino S, Finkel K, Kalim KW, DiPasquale G, et al. (2016). Inactivating mutations in GNA13 and RHOA in Burkitt's lymphoma and diffuse large B-cell lymphoma: a tumor suppressor function for the Galpha13/RhoA axis in B cells. Oncogene 35, 3771–3780. [DOI] [PMC free article] [PubMed] [Google Scholar]
- O'Hayre M, Vazquez-Prado J, Kufareva I, Stawiski EW, Handel TM, Seshagiri S, and Gutkind JS (2013). The emerging mutational landscape of G proteins and G-protein-coupled receptors in cancer. Nature reviews 13, 412–424. [DOI] [PMC free article] [PubMed] [Google Scholar]
- Oner SS, An N, Vural A, Breton B, Bouvier M, Blumer JB, and Lanier SM (2010). Regulation of the AGS3.G{alpha}i signaling complex by a seven-transmembrane span receptor. The Journal of biological chemistry 285, 33949–33958. [DOI] [PMC free article] [PubMed] [Google Scholar]
- Pace AM, Wong YH, and Bourne HR (1991). A mutant alpha subunit of Gi2 induces neoplastic transformation of Rat-1 cells. Proceedings of the National Academy of Sciences of the United States of America 88, 7031–7035. [DOI] [PMC free article] [PubMed] [Google Scholar]
- Parag-Sharma K, Leyme A, DiGiacomo V, Marivin A, Broselid S, and Garcia-Marcos M (2016). Membrane Recruitment of the Non-receptor Protein GIV/Girdin (Galpha-interacting, Vesicle-associated Protein/Girdin) Is Sufficient for Activating Heterotrimeric G Protein Signaling. The Journal of biological chemistry 291, 27098–27111. [DOI] [PMC free article] [PubMed] [Google Scholar]
- Qin K, Dong C, Wu G, and Lambert NA (2011). Inactive-state preassembly of G(q)-coupled receptors and G(q) heterotrimers. Nature chemical biology 7, 740–747. [DOI] [PMC free article] [PubMed] [Google Scholar]
- Ritt M, Guan JL, and Sivaramakrishnan S (2013). Visualizing and manipulating focal adhesion kinase regulation in live cells. The Journal of biological chemistry 288, 8875–8886. [DOI] [PMC free article] [PubMed] [Google Scholar]
- Ross EM, and Wilkie TM (2000). GTPase-activating proteins for heterotrimeric G proteins: regulators of G protein signaling (RGS) and RGS-like proteins. Annual review of biochemistry 69, 795–827. [DOI] [PubMed] [Google Scholar]
- Sakurai K, Zhao S, Takatoh J, Rodriguez E, Lu J, Leavitt AD, Fu M, Han BX, and Wang F (2016). Capturing and Manipulating Activated Neuronal Ensembles with CANE Delineates a Hypothalamic Social-Fear Circuit. Neuron 92, 739–753. [DOI] [PMC free article] [PubMed] [Google Scholar]
- Sato M, Blumer JB, Simon V, and Lanier SM (2006). Accessory proteins for G proteins: partners in signaling. Annual review of pharmacology and toxicology 46, 151–187. [DOI] [PubMed] [Google Scholar]
- Shirley MD, Tang H, Gallione CJ, Baugher JD, Frelin LP, Cohen B, North PE, Marchuk DA, Comi AM, and Pevsner J (2013). Sturge-Weber syndrome and port-wine stains caused by somatic mutation in GNAQ. The New England journal of medicine 368, 1971–1979. [DOI] [PMC free article] [PubMed] [Google Scholar]
- Siderovski DP, and Willard FS (2005). The GAPs, GEFs, and GDIs of heterotrimeric G-protein alpha subunits. International journal of biological sciences 1, 51–66. [DOI] [PMC free article] [PubMed] [Google Scholar]
- Sivaramakrishnan S, and Spudich JA (2011). Systematic control of protein interaction using a modular ER/K alpha-helix linker. Proceedings of the National Academy of Sciences of the United States of America 108, 20467–20472. [DOI] [PMC free article] [PubMed] [Google Scholar]
- Sriram K, and Insel PA (2018). GPCRs as targets for approved drugs: How many targets and how many drugs? Mol Pharmacol, January 3. pii: mol.117.111062. doi: 111010.111124/mol.111117.111062. [DOI] [PMC free article] [PubMed] [Google Scholar]
- Sterne-Marr R, Tesmer JJ, Day PW, Stracquatanio RP, Cilente JA, O'Connor KE, Pronin AN, Benovic JL, and Wedegaertner PB (2003). G protein-coupled receptor Kinase 2/G alpha q/11 interaction. A novel surface on a regulator of G protein signaling homology domain for binding G alpha subunits. The Journal of biological chemistry 278, 6050–6058. [DOI] [PubMed] [Google Scholar]
- Swanson CJ, and Sivaramakrishnan S (2014). Harnessing the unique structural properties of isolated alpha-helices. The Journal of biological chemistry 289, 25460–25467. [DOI] [PMC free article] [PubMed] [Google Scholar]
- Tall GG (2013). Ric-8 regulation of heterotrimeric G proteins. Journal of receptor and signal transduction research 33, 139–143. [DOI] [PMC free article] [PubMed] [Google Scholar]
- Tall GG, Krumins AM, and Gilman AG (2003). Mammalian Ric-8A (synembryn) is a heterotrimeric Galpha protein guanine nucleotide exchange factor. The Journal of biological chemistry 278, 8356–8362. [DOI] [PubMed] [Google Scholar]
- Tang Y, Hu LA, Miller WE, Ringstad N, Hall RA, Pitcher JA, DeCamilli P, and Lefkowitz RJ (1999). Identification of the endophilins (SH3p4/p8/p13) as novel binding partners for the beta1-adrenergic receptor. Proceedings of the National Academy of Sciences of the United States of America 96, 12559–12564. [DOI] [PMC free article] [PubMed] [Google Scholar]
- Tesmer VM, Kawano T, Shankaranarayanan A, Kozasa T, and Tesmer JJ (2005). Snapshot of activated G proteins at the membrane: the Galphaq-GRK2-Gbetagamma complex. Science 310, 1686–1690. [DOI] [PubMed] [Google Scholar]
- Van Raamsdonk CD, Bezrookove V, Green G, Bauer J, Gaugler L, O'Brien JM, Simpson EM, Barsh GS, and Bastian BC (2009). Frequent somatic mutations of GNAQ in uveal melanoma and blue naevi. Nature 457, 599–602. [DOI] [PMC free article] [PubMed] [Google Scholar]
- Voyno-Yasenetskaya TA, Pace AM, and Bourne HR (1994). Mutant alpha subunits of G12 and G13 proteins induce neoplastic transformation of Rat-1 fibroblasts. Oncogene 9, 2559–2565. [PubMed] [Google Scholar]
- Webb CK, McCudden CR, Willard FS, Kimple RJ, Siderovski DP, and Oxford GS (2005). D2 dopamine receptor activation of potassium channels is selectively decoupled by Galpha-specific GoLoco motif peptides. Journal of neurochemistry 92, 1408–1418. [DOI] [PubMed] [Google Scholar]
- Weis WI, and Kobilka BK (2018). The Molecular Basis of G Protein-Coupled Receptor Activation. Annual review of biochemistry 87, 897–919. [DOI] [PMC free article] [PubMed] [Google Scholar]
- Wells C, Jiang X, Gutowski S, and Sternweis PC (2002). Functional characterization of p115 RhoGEF. Methods in enzymology 345, 371–382. [DOI] [PubMed] [Google Scholar]
- Wells CD, Gutowski S, Bollag G, and Sternweis PC (2001). Identification of potential mechanisms for regulation of p115 RhoGEF through analysis of endogenous and mutant forms of the exchange factor. The Journal of biological chemistry 276, 28897–28905. [DOI] [PubMed] [Google Scholar]
- Willard FS, Kimple RJ, and Siderovski DP (2004). Return of the GDI: the GoLoco motif in cell division. Annual review of biochemistry 73, 925–951. [DOI] [PubMed] [Google Scholar]
- Wisler JW, Rockman HA, and Lefkowitz RJ (2018). Biased G Protein-Coupled Receptor Signaling: Changing the Paradigm of Drug Discovery. Circulation 137, 2315–2317. [DOI] [PMC free article] [PubMed] [Google Scholar]
- Xu N, Voyno-Yasenetskaya T, and Gutkind JS (1994). Potent transforming activity of the G13 alpha subunit defines a novel family of oncogenes. Biochemical and biophysical research communications 201, 603–609. [DOI] [PubMed] [Google Scholar]
- Yost EA, Mervine SM, Sabo JL, Hynes TR, and Berlot CH (2007). Live cell analysis of G protein beta5 complex formation, function, and targeting. Molecular pharmacology 72, 812–825. [DOI] [PubMed] [Google Scholar]
Associated Data
This section collects any data citations, data availability statements, or supplementary materials included in this article.
Supplementary Materials
Figure S1. Related to Figure 1. Detection of G-protein activation by different GPCRs with Gαi-GTP or free Gβγ biosensors and effect of Ric-8A on Gαi3-YFP.
(A, B) Agonist dose-dependent Gαi-GTP responses using four- or two-component biosensors in HEK293T cells expressing MOR. Naloxone= 100 μM. Mean ± S.E.M, n= 3. (C) Loss of Gαi-GTP response upon mutation of KB-1753-Nluc in HEK293T cells expressing either four- or two-component biosensors. DAMGO= 10 μM; Naloxone= 100 μM. One representative experiment of at least 3.
(D) Co-expression of Ric-8A modestly increases the expression of Gαi3-YFP and enhances BRET signals detected with KB-1753-Nluc with and without GPCR stimulation. BRET measurements were carried out in HEK293T cells with or without GPCR stimulation (M4R, Carbachol= 100 μM) and with or without Ric-8A co-expression. Mean ± S.E.M, n= 3. (E) Top: diagram showing the principle for the free Gβγ bio6sensor. Upon GPCR stimulation, YFP-tagged Gβγ is relieved from Gα-mediated sequestration, which then permits its association with Nluc-tagged GRK3ct and results in the subsequent increase in BRET. Bottom: BRET measurements confirming the release of Gβγ from Gαi, Gαo, Gαq or Gαs. Cells expressing G-proteins with the indicated cognate GPCRs were agonist-stimulated as follows: Gαi3/Gαo, 5 μM brimonidine; Gαq, 100 μM carbachol; Gαs, 10 μM isoproterenol. Mean ± S.E.M, n= 5.
Figure S2. Related to Figure 3. Gαi*-BERKY3 BRET reports endogenous Gi activation upon stimulation of different GPCRs. (A) BRET response upon MOR stimulation in HEK293T cells expressing Gαi*-BERKY3 in the absence (“Endogenous”) or presence of Gαi3/Gβγ overexpression. DAMGO= 10 μM; Naloxone= 100 μM. Mean ± S.E.M, n= 5. (B) Pertussis toxin (Ptx) treatment (0.2 μg/ml overnight) abolishes Gαi*-BERKY3 BRET responses detected in HEK293T cells expressing exogenous Gαi3/Gβγ or only endogenous G-proteins upon α2A-AR stimulation (brimonidine, 5 μM). Mean ± S.E.M, n= 3-5. (C) Pertussis toxin (Ptx) treatment (0.2 μg/ml overnight) does not diminish Gαi*-BERKY3 BRET responses detected in HEK293T cells expressing the Ptx-insensitive mutant Gαi3 C351I upon α2A-AR stimulation (brimonidine, 5 μM). Mean ± S.E.M, n= 3. (D) BERKY3 biosensors containing the KB-1746 peptide sequence instead of the KB-1753 peptide sequence as detector module fail to detect activation of Gi/o proteins. BERKY biosensor designs with different detector modules are shown on the left, and representative traces comparing side by side BRET responses detected with each biosensor in HEK293T cells expressing the indicated G-proteins and the α2A-AR are shown on the right. Brimonidine= 5 μM; Yohimbine= 25 μM. (E) Endogenous Gαi activation kinetics determined by Gαi*-BERKY3 BRET are not affected by expression of exogenous Gβγ. Gαi activation kinetics were determined in HEK293T cells expressing Gαi*-BERKY3 in the absence and presence of Gβγ overexpression (but no Gα) upon GPCR stimulation (α2A-AR, 5 μM brimonidine). Data points are mean ± S.E.M. and solid lines are fits to one-component exponential curves (n= 3-4). Residual plot of the curve fit is shown in the middle panel, and a representative immunoblot confirming the expression of different components is shown on the right. (F) Expression of exogenous Gαi3 alters Gαi activation kinetics and amplitude in a dose-dependent manner as determined by Gαi*-BERKY3 BRET. Gαi activation kinetics were determined in HEK293T cells expressing Gαi*-BERKY3 in presence of different amounts of Gαi3 (as indicated) and constant Gβγ. Data points are mean ± S.E.M. and solid lines are fits to one-component exponential curves (n= 4). Comparison of response amplitude (black) and t1/2 (red) for different amounts of Gαi3 is shown in the middle panel, and a representative immunoblot confirming the expression of different components is shown on the right. (G) Formation of Gα-GTP and formation of free Gβγ proceed with similar kinetics upon GPCR stimulation. Gαi*-BERKY3 or Gβγ-BERKY3 BRET kinetics were determined in HEK293T cells expressing only endogenous G proteins upon GPCR stimulation (a2A-AR, 5 μM brimonidine). Data points are mean ± S.E.M. and solid lines are fits to one-component exponential curves (n= 3). Residual plot of the curve fit is shown in the middle panel, and a representative immunoblot confirming the expression of different components is shown on the right.
Figure S3. Related to Figure 4. Direct detection of GTP-bound Gαq in cells upon long-term stimulation of the M3R or upon stimulation of the α1A-AR.
(A) Carbachol stimulation of the M3R leads to a sustained Gαq-GTP BRET response for over 15 minutes. HEK293T cells expressing the M3R and the components of the Gαq-GTP biosensor were stimulated with carbachol (100 μM, black trace) or left unstimulated (grey trace). One representative experiment of two is shown.
(B) HEK293T cells expressing the M3R or the α1A-AR and the components of the Gαq-GTP biosensor were stimulated with carbachol (100 μM) or phenylephrine (10 μM), respectively. Immunoblots on the bottom show the expression of the two GPCRs and different components of the biosensor system. Mean ± S.E.M, n= 3.
Figure S4. Related to Figure 4. Direct detection of GTP-bound Gα13 in cells.
(A) Gα13-GTP biosensor design principle and representative traces of BRET measurements in HEK293T cells expressing PRGRH-Nluc along with the indicated constructs. BRET response in “+Gα13-YFP” condition without exogenous PAR1 expression likely reflects stimulation of endogenous PAR1 receptors, as previously reported by others with another biosensor of Gα13 activity using the same cell line (PMID: 26628681).. TRAP-6= 30 μM.
(B) PRGRH-Nluc biosensor detects more robust Gα13 BRET responses than p115RH-Nluc in HEK293T cells expressing exogenous PAR1. TRAP-6= 30 μM. Mean ± S.E.M, n= 3.
(C) PRGRH-Nluc biosensor detects agonist dose-dependent Gα13-GTP responses in HEK293T cells expressing PAR1. Mean ± S.E.M, n= 3.
(D) Gα13-GTP BRET responses are reversible and can be detected similarly with either four- or two-component biosensors. HEK293T cells expressing the PAR1 and the indicated components of PRGRH-Nluc biosensors were stimulated with TRAP-6 (1 μM) and in some cases (blue traces) subsequently treated with the antagonist SCH-79797 (10 μM). Mean ± S.E.M, n= 3-4.
(E) Detection of Gα13-GTP but not Gαq-GTP, Gαi3-GTP or Gαs-GTP responses by PRGRH-Nluc upon GPCR agonist stimulation. Cells expressing G-proteins with the indicated cognate GPCRs were agonist-stimulated as follows: Gα13, 10 μM TRAP-6; Gαq, 100 μM carbachol; Gαi3, 10 μM brimonidine; Gαs, 10 μM isoproterenol. Mean ± S.E.M, n= 3.
Figure S5. Related to Figure 5. Characterization of cancer-associated G-protein mutants with a Gα13-GTP biosensor.
(A) Lollipop plot of Gα13 residues mutated in bladder cancer and three dimensional model of Gα13 (PDB: 3AB3) showing the position of selected residues around the nucleotide binding site.
(B) Cancer-associated Gα13 mutants R200K and R200G are constitutively active as determined by the Gα13-GTP biosensor PRGRH-Nluc in HEK293T cells. Mean ± S.E.M, n= 4.
(C) Stimulation of exogenously expressed PAR1 activates Gα13 WT but not Gα13 mutants R200K and R200G as determined by the Gα13-GTP biosensor PRGRH-Nluc in HEK293T cells. Mean ± S.E.M, n= 3.
(D) Cancer-associated Gα13 mutants R200K and R200G are constitutively active as determined by a luciferase reporter of a modified Serum Response Element (SRE) in HEK293T cells. Mean ± S.E.M, n= 3.
Figure S6. Related to Figure 7. Gαi*-BERKY3 BRET response in transiently transfected HeLa cells and cellular localization of Gαi*-BERKY3 and Gβγ-BERKY3 biosensors expressed in HeLa cells.
(A) Transiently transfected Gαi*-BERKY3 detects endogenous G-protein activation by endogenous α2-AR in HeLa. HeLa cells were harvested 24 hours after transfection and rapidly assayed in suspension. Brimonidine= 5 μM; Yohimbine= 25 μM. Mean ± S.E.M, n= 3.
(B, C) HeLa cell lines stably expressing Gαi*-BERKY3 or Gβγ-BERKY3 biosensors generated as depicted in Fig. 7A were imaged by confocal immunofluorescence microscopy. Arrowheads indicate accumulation of signal at the cell periphery, presumably the cell membrane.
Figure S7. Related to Figure 7. Detection of endogenous G-protein activation by multiple endogenous GPCRs in SH-SY5Y cells and primary neurons.
(A) Generation of SH-SY5Y cell lines stably expressing Gαi*-BERKY3, Gβγ-BERKY3 or Gαq*-BERKY3 to monitor G-protein activation upon stimulation of endogenously expressed MOR, DOR, or M3R.
(B, C, D) Endogenous Gαi-GTP (in B), free Gβγ (in C), or Gαq-GTP (in D) BRET responses detected by BERKY biosensors upon stimulation of endogenous GPCRs in SH-SY5Y cells. Mean ± S.E.M. of the number of experiments (n) indicated in the figures. DAMGO= 1 μM; SNC80= 10 μM; Naloxone= 100 μM; Carbachol= 1 mM; Atropine= 100 μM; YM-254890= 10 μM (10 min preincubation). Confocal immunofluorescence images of representative cells expressing BERKY biosensors are shown on the right. Arrowheads indicate accumulation of signal at the cell periphery, presumably the cell membrane.
(E, F) Endogenous Gαi-GTP (in E) or endogenous free Gβγ (in F) BRET responses detected upon stimulation of endogenous GPCRs in primary cortical neurons (DIV 12-16) transduced with Gαi*-BERKY1 or Gβγ-BERKY1, respectively. Responses to α2-AR (brimonidine, 5 μM), GABABR (baclofen, 100 μM) or adenosine receptors (adenoside, 10 μM; NECA, 10 μM) are blocked by pertussis toxin (Ptx, 0.2 μg/ml overnight preincubation). Yohimbine= 25 μM; CGP 54626 (CGP)= 10 μM; DPCPX= 1 μM. Mean ± S.E.M., n= 3-5.
Data S1. Related to STAR Methods. DNA sequences of BERKY constructs.
Data Availability Statement
Original data for Gαi3 immunoblots in the paper is available as a Mendeley dataset (http://dx.doi.org/10.17632/n3s5g457fm.1)