

Summary
Checkpoint blockade with antibodies specific for the PD-1 and CTLA-4 inhibitory receptors can induce durable responses in a wide range of human cancers. However, the immunological mechanisms responsible for severe inflammatory side effects remain poorly understood. Here we report a comprehensive single cell analysis of immune cell populations in colitis, a common and severe side effect of checkpoint blockade. We observed a striking accumulation of CD8 T cells with highly cytotoxic and proliferative states and no evidence of regulatory T cell depletion. T cell receptor (TCR) sequence analysis demonstrated that a substantial fraction of colitis-associated CD8 T cells originated from tissue-resident populations, explaining the frequently early onset of colitis symptoms following treatment initiation. Our analysis also identified cytokines, chemokines and surface receptors that could serve as therapeutic targets for colitis and potentially other inflammatory side effects of checkpoint blockade.
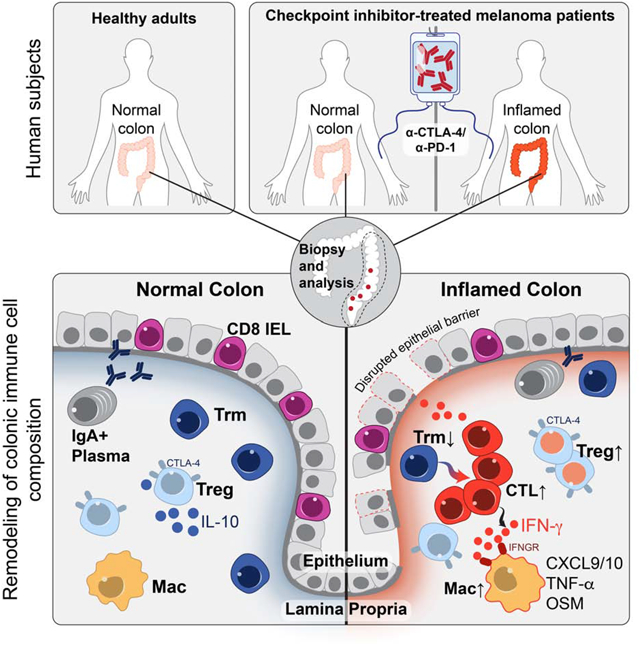
Graphical Abstract
In Brief
Single cell analyses of immune checkpoint blockade-associated colitis patient samples reveal an enrichment of regulatory T cells in colitic lesions and nominate inflammatory pathways for potential therapeutic intervention.
Introduction
Monoclonal antibodies targeting the CTLA-4 or PD-1/PD-L1 pathways can induce durable responses in a wide range of human malignancies but can also induce inflammatory toxicities collectively referred to as immune-related adverse events (irAEs). These irAEs can affect any organ system and remain a major limitation of checkpoint inhibition (Larkin et al., 2015; Postow et al., 2015; Postow et al., 2018). Nearly 60% of patients treated with a combination of PD-1 and CTLA-4 antibodies develop severe, treatment-limiting toxicities (Dougan, 2017; Dougan and Pietropaolo, 2020). The cellular and molecular mechanisms of these immune-related toxicities are not well understood, precluding their optimal clinical management. The most common toxicities occur at barrier sites, including the gastrointestinal (GI) mucosa and liver, skin and lungs (Dougan and Pietropaolo, 2020). CPI-induced colitis (abbreviated as +CPI colitis) is among the most frequent severe irAEs and is an important cause of treatment discontinuation, particularly in patients receiving a CTLA-4 blocking mAb (ipilimumab) alone or in combination with a PD-1 blocking mAb (nivolumab).
CTLA-4 appears to play a more central role than PD-1 or PD-L1 in gut homeostasis (Joosse et al., 2019; Kuehn et al., 2014; Zeissig et al., 2015). Mild colitis is common in patients receiving ipilimumab, with diarrhea affecting nearly half of the patients on high dose or combination therapy (Hodi et al., 2010). Severe colon inflammation is less frequent, but still occurs in 10–20% of patients, and can be life-threatening (Dougan, 2017; Postow et al., 2018). +CPI colitis is frequently characterized by continuous inflammation from the anus to the cecum, and histopathological analysis identified a high proportion of lymphocytes and increased numbers of apoptotic epithelial cells (Coutzac et al., 2017; Grover and Srivastava, 2019; Zhang et al., 2020). Although mucosal inflammation induced by CPIs most frequently involves the colon, approximately a quarter of patients with colitis also have inflammation in the small intestine (enteritis) (Downey et al., 2007; Hughes et al., 2019; Zhang et al., 2020). As with most other severe irAEs, current management of CPI colitis includes high-dose, systemic corticosteroids and CPI discontinuation (Postow et al., 2018). Preliminary clinical data indicate that TNFα blockade can be efficacious for the treatment of +CPI colitis resistant to corticosteroids (Badran et al., 2019). The influence of systemic corticosteroids on anti-tumor responses is presently unknown; corticosteroids induce apoptosis of proliferating T cells, and retrospective data suggest that high-dose corticosteroids may diminish optimal therapeutic responses (Arbour et al., 2018; Faje et al., 2018). The development of alternative treatment approaches targeting inflammatory pathways specific to +CPI colitis without impairing anti-tumor immunity is therefore of crucial importance.
The immunological mechanisms of irAEs have been difficult to study because colitis and other irAEs are not observed in murine tumor models treated with checkpoint inhibitors (Curran et al., 2010). This project was therefore designed to directly study the cellular and molecular mechanisms of colitis as an example of a common and frequently severe irAE. We studied recently diagnosed colitis patients who had not yet received drug treatment for this irAE and used diagnostic tissue biopsies for a comprehensive analysis of immune cell populations by single-cell RNA-sequencing (scRNA-seq) and multi-spectral flow cytometry. This approach led to the discovery of cellular and molecular pathways in +CPI colitis as well as the identification of potential therapeutic targets for this important side effect of cancer immunotherapy.
Results
Study design
We present the first in depth cellular and molecular analysis of immune cell populations in an irAE induced by checkpoint inhibition therapy, with a specific focus on CPI colitis. Immune cell populations were comprehensively studied using two complementary approaches: 5’ barcoded scRNA-seq as a discovery tool and multi-spectral flow cytometry for quantification of cell populations and markers at the protein level (Figure 1A). We performed these studies in three patient populations: 1. CPI-treated melanoma patients with histologically confirmed colitis (n=8, +CPI colitis). 2. Healthy adults of similar age undergoing screening colonoscopies (n=8, Control). 3. CPI-treated melanoma patients who underwent endoscopic evaluation for suspected +CPI colitis but were found to have normal colonic mucosa both endoscopically and histologically (n=6, +CPI no-colitis) (Figure 1B). This group of drug-exposed patients without colitis was evenly split between patients who had or did not have inflammation of the small intestine (enteritis) (Hughes et al., 2019). Our study design thus allowed us to distinguish molecular changes induced by drug exposure from the actual disease process. All CPI-treated patients had been recently treated with CTLA-4 and PD-1 antibodies, except for one patient in each group who received anti-CTLA-4 monotherapy (Figure 1B, Table S1,2). Biopsies were obtained soon after development of colitis symptoms (average of 4.5 days, maximum of 13 days) from three major regions of the lower gastrointestinal (GI) tract, predominantly spanning the descending colon through the rectum (Figure 1A). Only a single patient in the cohort received corticosteroids prior to biopsy (Table S3). Tissue specimens were enzymatically digested to liberate cells from both the lamina propria (LP) and epithelial layer, which also contains intraepithelial lymphocytes (IEL). We sequentially isolated live CD45+ mononuclear cells as well as CD3+ T cells by Fluorescence-activated cell sorting (FACS) for scRNA-seq using 10X Genomics 5’ barcoding technology (Figure 1A, S1A).
Figure 1. Global analysis of immune cell populations in CPI-colitis.

A) Workflow showing biopsy collection sites and processing of single-cell suspensions for scRNA-seq and flow cytometry. Biopsies were obtained from the following colon segments: R=rectum, S=sigmoidal, D=descending.
B) Summary of patient cohorts for scRNA-seq analysis. See Tables S1–5 for detailed information.
C) Identification of colon CD45+ immune cell clusters across all samples (n=5–6 subjects per cohort).
D) Violin plots showing expression of canonical marker genes across clusters, y-axis represents the normalized gene expression value. See Table S6 all marker genes.
E) Distribution of CD45+ immune cells across clusters colored based on patient groups.
F) Cell cluster frequency shown as a fraction of total cells for each patient.
G) Quantification of immune cell distribution across clusters and comparison of patient groups. For each cluster, the average fraction of cells from each patient group is shown, after normalization for total input cell numbers per patient (see Methods). Average and S.E.M. shown for each patient group. Statistical analysis compares control and +CPI colitis patient groups. *p<0.05, **p<0.01, two-sided Wilcoxon test.
H) Flow cytometry analysis of CD3+ T cells in colon biopsies (% of live CD45+ cells) in all patients (n=7–10 subjects per group, see Table S5 for details on analyzed cases). *p<0.05, ***p<0.001, one-way ANOVA test.
I) Comparison of T cell frequencies as determined by flow cytometry (% of live CD45+ cells) versus scRNA-seq (% of live CD45+ MNC cells) and fit with a linear regression model.
Global analysis of immune cell populations in +CPI colitis
We prepared scRNA-seq libraries from CD45+ immune cells for 16 patients (n=6 +CPI colitis, n=5 +CPI no colitis, n=5 Control) which provided highly-quality transcriptomes for a total of 51,652 cells (Figure 1B, S1B). Data integration revealed 16 distinct clusters comprising all expected immune cell populations, including T cells, B cells, IgA+ plasma B cells, myeloid cells, mast cells and ILCs (neutrophils were excluded by FACS due to their incompatibility with the 10X Genomics platform) (Figure 1C, D, S1C). Each cluster contained cells from all patients, indicating the absence of major patient-specific batch effects (Figure 1E, F). The most striking changes between +CPI colitis and control groups were observed in the T cell compartment, which was represented by six clusters in this CD45+ dataset. In particular, we observed substantial shifts in the structure of T cell populations: in colitis compared to control cases, we identified a striking increase in the fraction of T cells in clusters 15 (CD8+ CTL, cytotoxicity signature) and 16 (cycling T cells) (Figure 1E–G, S1D). T cell populations in both control groups (+CPI no colitis and control) were significantly different from those in colitis patients, indicating that these changes in T cell populations were related to the disease state rather than drug exposure (Figure 1E, S1D). Similar changes in T cell clusters were observed in colitis patients exposed to different CPI drugs, including monotherapy with ipilimumab (patient C2), combination therapy with ipilimumab and nivolumab (patient C3) or sequential pembrolizumab and ipilimumab (patient C1) (Figure S1D). Flow cytometry analysis confirmed the +CPI colitis-associated increase in relative CD3+ T cell frequency and absolute number (Figure 1H, S1E,F). T cell frequency quantified by flow cytometry and scRNA-seq were strongly correlated, serving as cross-validation of these experimental methods (Figure 1I). In addition to these changes in the T cell compartment, we also observed an increase in the frequency of myeloid cells in colitis patients compared to healthy control subjects (Figure 1E, G). These results demonstrate that +CPI colitis is associated with major changes in colonic immune cells, including cytotoxic and cycling T cells as well as myeloid-lineage cells.
Colitis-related changes in CD8 T cell cytotoxicity and proliferation programs
We additionally generated scRNA-seq libraries for CD3+ T cells from 22 subjects (Figure 1B), which provided transcriptomes for 67,926 cells and corresponding TCR sequences (Figure S2A–G). We analyzed major T cell lineages by flow cytometry and found that the frequency of CD8+ T cells (defined as CD4− owing to partial CD8 cleavage by tissue digestion enzymes) among total CD3+ cells was similar among the three patient groups; indicating that both CD4+ and CD8+ T cells were expanded in colitis patients (Figure S2H–J). Non-classical T cell lineages present in the colon, including γδ T cells and mucosal-associated invariant T (MAIT) cells, did not significantly differ among the three patient groups (Figure S2K, L).
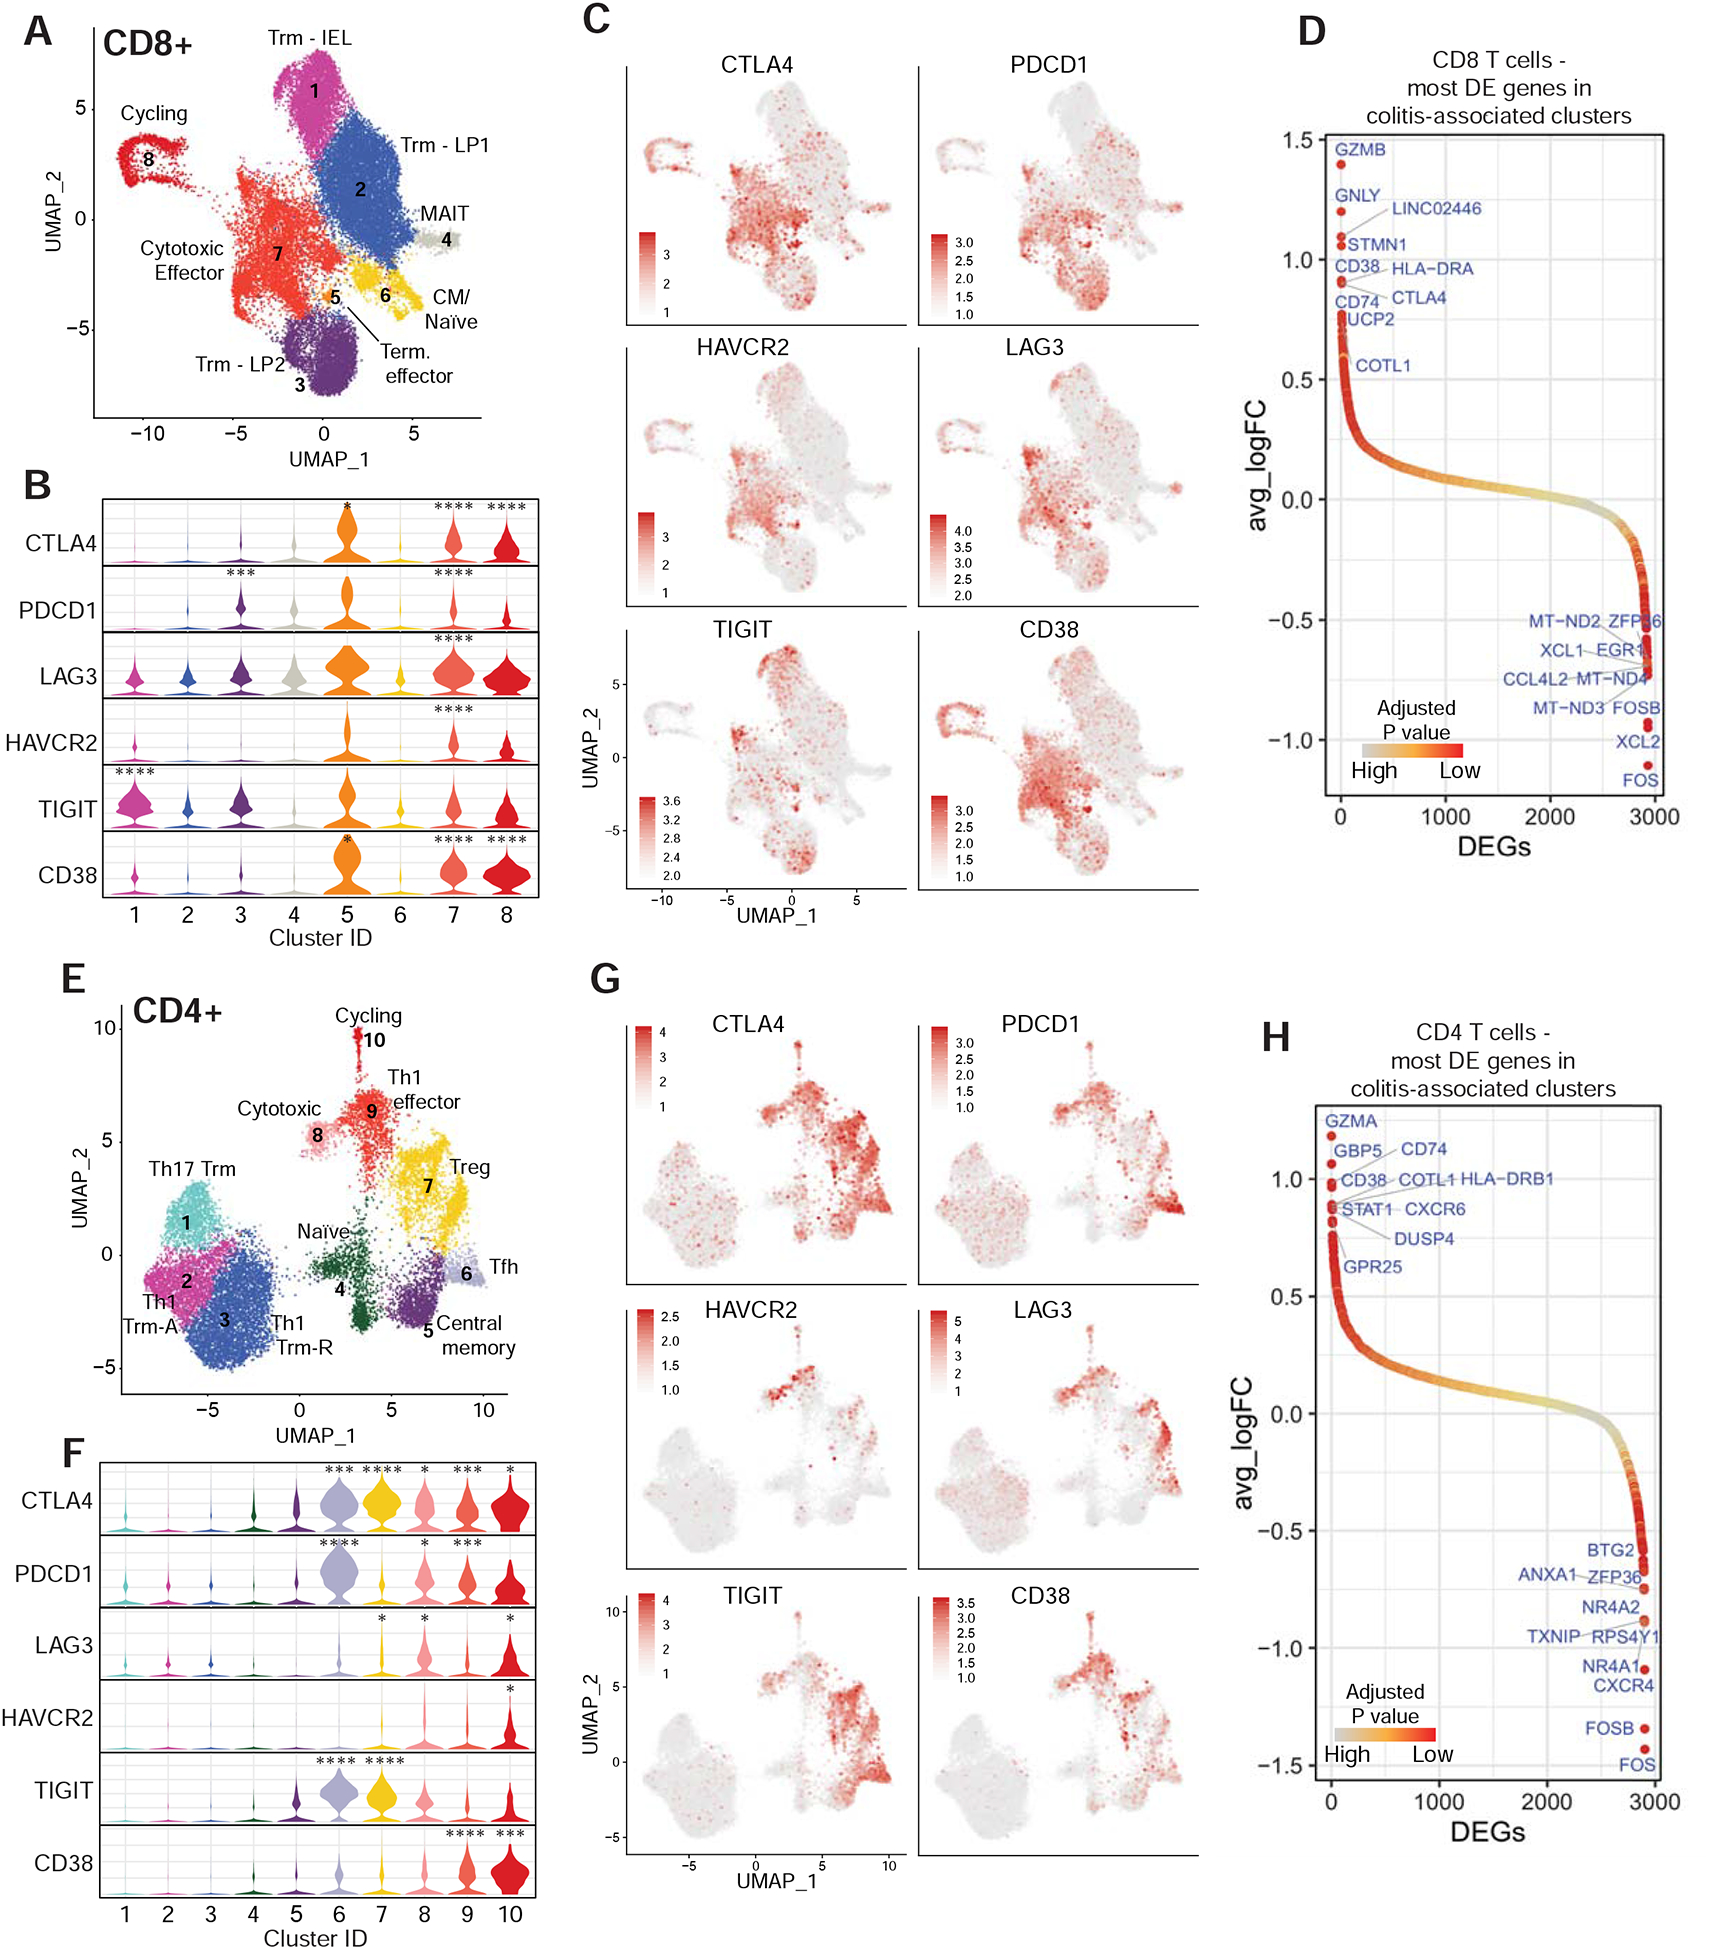
Sub-clustering of CD8 T cells revealed eight well-defined sub-populations that were annotated based on published signatures and cell markers (Figure 2A,B, S3A,B) (Martin et al., 2019; Smillie et al., 2019). The overall organization of the CD8+ T cell compartment showed striking differences between +CPI colitis patients and both control groups: clusters 7 (cytotoxic effectors) and 8 (cycling T cells, MKI67+) were nearly exclusive to +CPI colitis patients (Figure 2C–E). T cells from colitis patients were also enriched in two smaller clusters (cluster 6: central memory/naïve cells; cluster 5: terminal effector cells). In contrast, the fraction of T cells from clusters representing tissue-resident memory T cells (Trm) was reduced in +CPI colitis patients (Figure 2E) (Kumar et al., 2017). CD8+ T cells from both clusters 7 and 8 showed high expression of cytotoxicity genes including GZMB (Figure 2F) and characteristic IFNγ response genes (HLA-DRA and CD74) (Figure 2B, S3C,D).
Figure 2. Colitis-related changes in CD8 T cell cytotoxicity and proliferation programs.
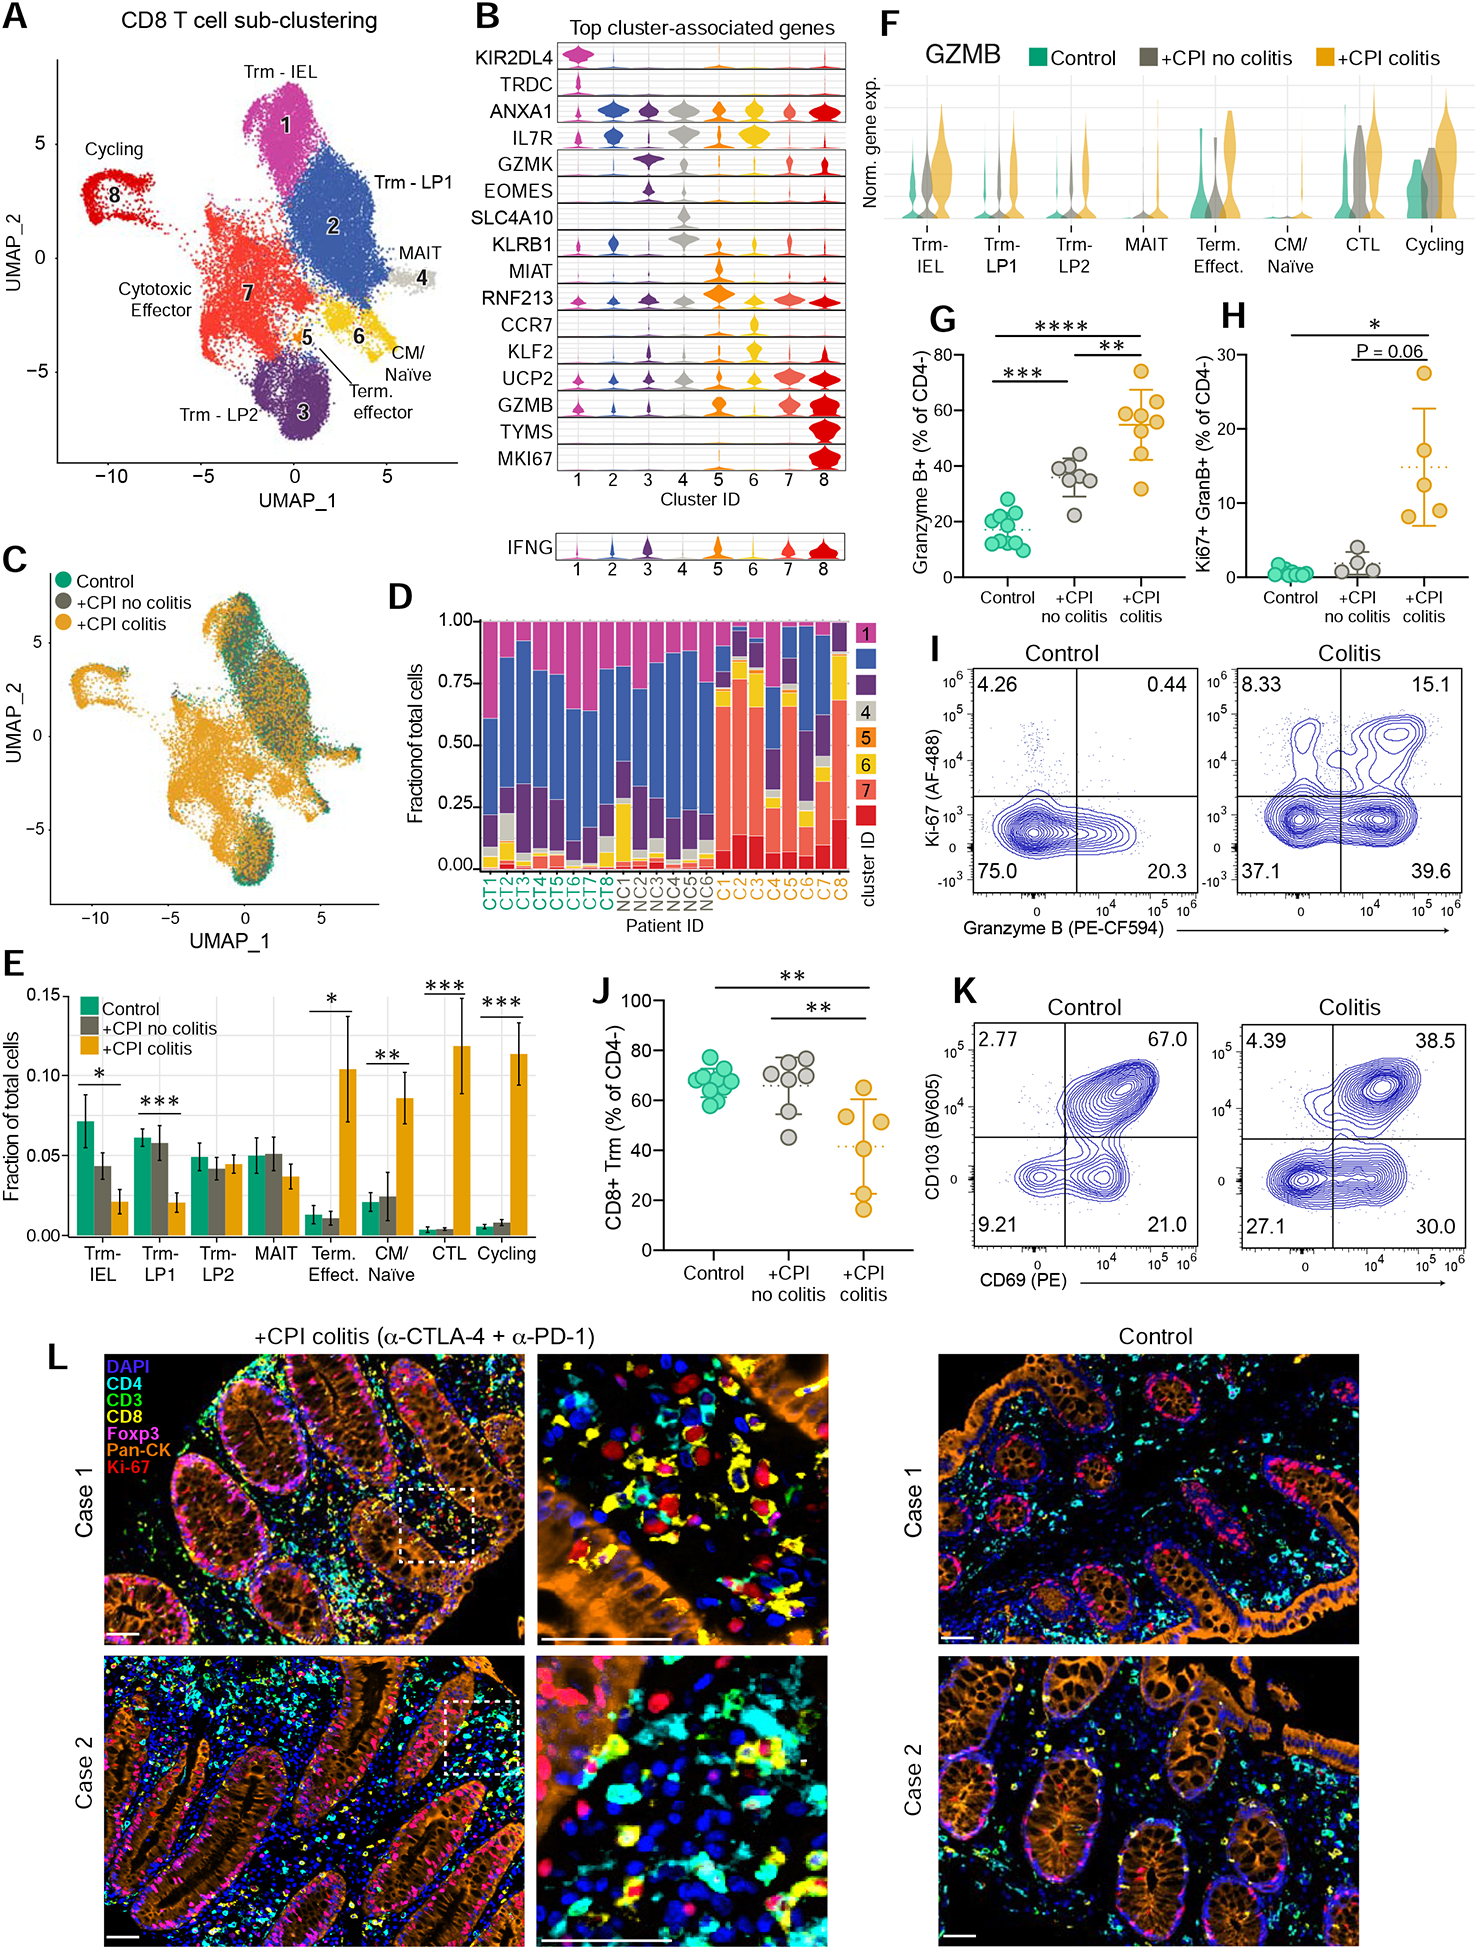
A) Sub-clustering of CD8 T cells selected from CD3+ dataset for all subjects (n = 6–8 patients per group) (see STAR Methods).
B) Violin plots displaying marker genes of CD8 T cell clusters. For each cluster, the gene with the highest-scoring cell-type specificity score (STAR Methods) and a highly expressed well-defined subset marker are shown. Bottom, IFNG expression shown across clusters. Y-axis represents the normalized gene expression value. See Table S6 for all marker genes.
C) Distribution of CD8 T cells across clusters among patient groups.
D) Distribution of CD8 T cells across the eight clusters for each patient.
E) Quantification of cell cluster frequency representation among patient groups. Average and SEM shown for each patient group. *p<0.05, **p<0.01, ***p<0.001, two-sided Wilcoxon test comparing control and +CPI colitis groups.
F) Expression of GZMB across clusters in the three patient groups.
G) Quantification of granzyme B+ CD8 T cells by flow cytometry (percentage of CD4− αβTCR+ non-MAIT (Vα7.2+ CD161+) cells, pre-gated on live CD45+ CD3+ cells) for all patients (n=7–10 subjects per group). **p<0 .01, ***p<0.001, ****p<0.0001, one-way ANOVA test.
H) Quantification of granzyme B+ Ki-67+ CD8 T cells by flow cytometry gated as in 2I. Ki-67 antibody staining was not performed for initial patients (n=4–10 subjects per group). *p<0.05, one-way Brown-Forsyth and Welch ANOVA test; error bars: SD.
I) Representative flow cytometry plots for G and H.
J-K) Quantification and representative flow plots of CD103+ CD69+ CD8 Trm cells gated as in 2K (n=6–10 subjects per group). **p<0.01, one-way ANOVA test; error bars: SD.
L) Multiplex immunofluorescence images of formalin-fixed paraffin embedded (FFPE) sections from +CPI colitis (treated with α-CTLA-4 and α-PD-1 mAbs) and control patients in a separate cohort (2 representative cases shown for each). Sections were stained with indicated antibodies and counterstained with DAPI. Dashed box represents 4x enlarged area shown in middle panel. White arrows point to cells positive for Ki-67 and CD8.
See also Figure S3.
We confirmed the increased frequency of cytotoxic effector CD8+ T cells in +CPI colitis patients by flow cytometry for the same patient cohort (Figure 2G–I). Importantly, a colitis patient who received ipilimumab monotherapy also had a large fraction of granzyme B+ positive CD8+ T cells (59.5%), suggesting that the increase in cytotoxic CD8+ T cells was not restricted to combination CPI (Figure S3E). The percentage of granzyme B+ CD8+ T cells was also increased in +CPI treated patients without colitis compared to healthy control subjects demonstrating that CPI itself caused elevation of the cytotoxicity program (Figure 2G). Mirroring the scRNA-seq data, cycling (Ki-67+) granzyme B+ CD8+ T cells were dramatically increased in +CPI colitis patients (Figure 2H–I), whereas Trm populations were reduced (Figure 2J, K).
To determine the localization of cycling cytotoxic T cells, we performed multi-color immunofluorescence analysis of tissue sections in +CPI colitis compared to healthy subjects. Large clusters of cycling (Ki-67+) CD8+ and CD4+ cells were predominantly localized in the lamina propria in +CPI colitis patients treated with CTLA-4 and PD-1 antibodies (Figure 2L); fewer CD8+ and CD4+ cells were observed in the lamina propria of healthy subjects. These data demonstrate striking colitis-associated changes in colonic CD8+ T cells, characterized by a shift from Trm to cytotoxic, cycling effector T cells.
Increase in CD4+ effector cells and Tregs in +CPI colitis
Sub-clustering of CD4+ T cells revealed ten populations that showed major differences between +CPI colitis and control cases; notably, clusters 9 and 10 were nearly exclusively comprised of cells from +CPI colitis patients (Figure 3A–D, S4A–B). Cells in cluster 9 were Th1 effector cells that highly expressed a number of IFNγ inducible genes, including GBP1/5, STAT1 and CD74 (Figure 3B, S4A–D). Cluster 10 was comprised of MKI67+ cycling conventional and regulatory T cells, which we corroborated at the protein level (Figures 3B,J,K, S4A). A population of cytotoxic CD4+ T cells (cluster 8) was identified based on expression of GZMA and GZMH. Though this cluster was not enriched in +CPI colitis cases, GZMA was a top differentially expressed genes in CD4+ T cells from colitis-associated clusters (9–10) compared to non-colitis clusters (1–8) (Figure S4C). Similar to CD8+ Trm T cell populations, Trm clusters 1 and 3 were reduced as a fraction of CD4+ T cells in colitis patients (Figure 3D).
Figure 3. Increase in CD4+ effector cells and Tregs in CPI-colitis.
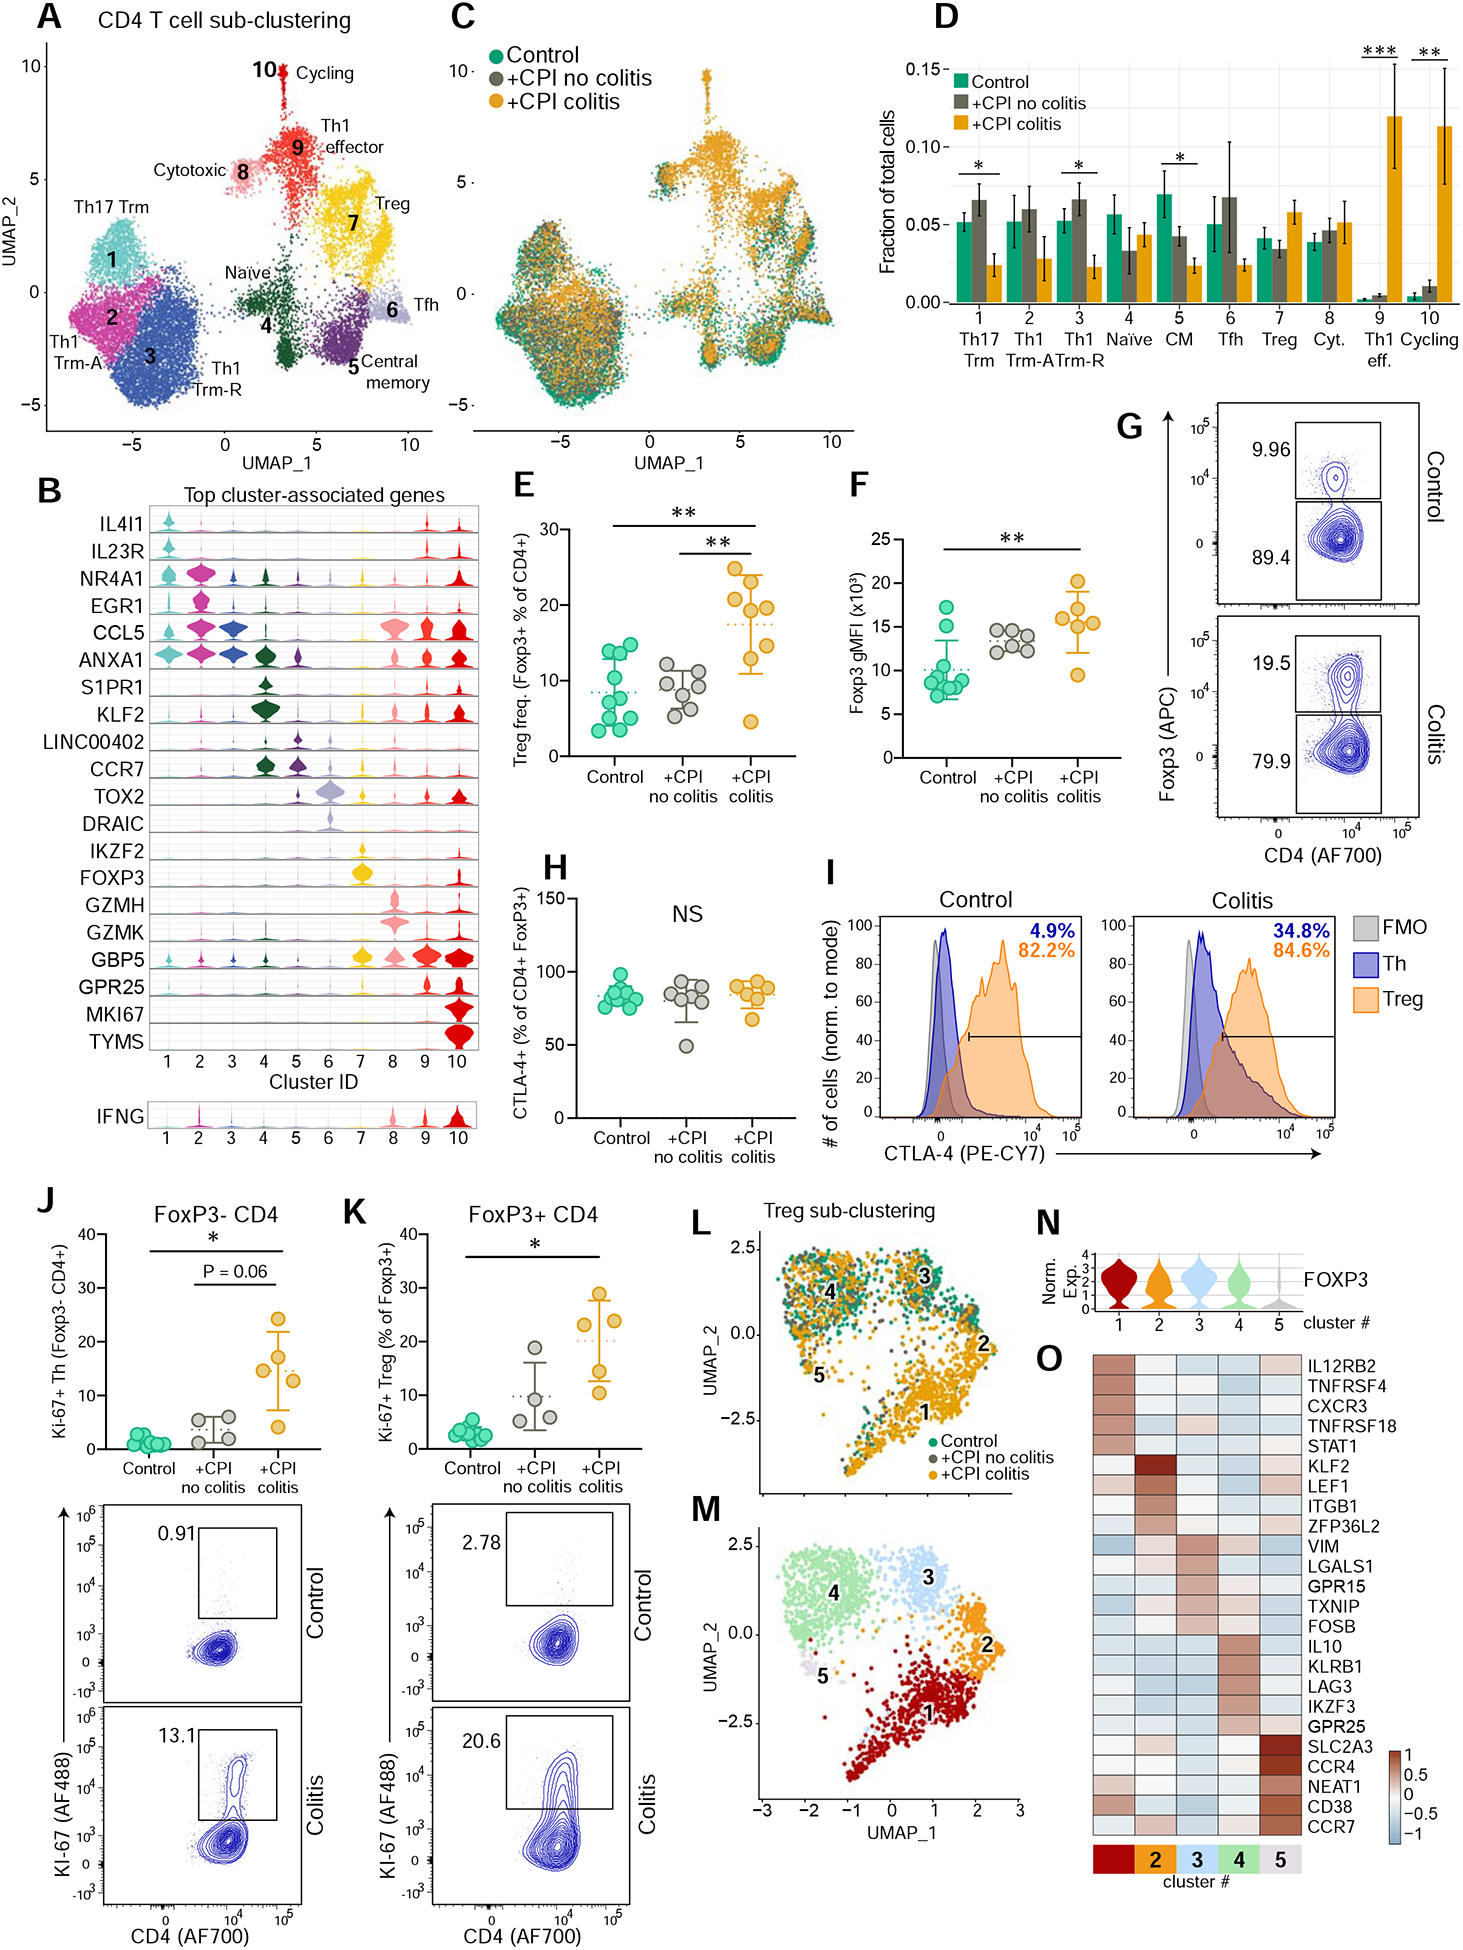
A) CD4 T cells were selected from CD3+ dataset for all subjects (n=6–8 patients per group) and sub-clustered.
B) Violin plots displaying marker genes for CD4 T cell clusters (see Figure 2B for details). See Table S6 for all marker genes.
C) Distribution of CD4 T cells across clusters among patient groups.
D) Quantification of cell cluster frequency representation among patient groups. Average and S.E.M. shown for each patient group. * p<0.05, **p<0.01, ***p<0.001, two-sided Wilcoxon test comparing control and +CPI colitis groups.
E) Quantification of Treg cells (% of FoxpP3+CD4+ cells, pre-gated on live CD45+ CD3+ γδTCR− cells) for all patients (n=7–10 subjects per group). **p<0.01, one-way ANOVA test.
F) Geometric mean fluorescence intensity (gMFI) of Foxp3 staining, gated on CD4+ Foxp3+ cells (n=6–10 subjects per group). **p<0.01, one-way ANOVA test.
G) Representative flow plots for E and F.
H) Quantification of CTLA-4 expression by Treg cells (% of FoxP3+ CD4+ T cells).
I) Representative plots for H, showing CTLA-4 levels of FoxP3+ Tregs and Foxp3− Th CD4+ cells, compared with FMO gating control (n=6–10 subjects per group). **p<0.01, one-way ANOVA test.
J,K) Quantification and representative flow cytometry plots of Ki-67+ Foxp3− CD4 T cells (J) and Foxp3+ CD4 T cells (K) (n=4–10 subjects per group). * p<0.05, one-way Brown-Forsyth and Welch ANOVA test.
L-M) Sub-clustering of Treg cells from cluster 7 from 3A. colored according to patient group (L) and sub-cluster annotation (M).
N) Normalized FOXP3 expression across Treg sub-clusters.
O) Heatmap showing differentially expressed genes across Treg sub-clusters. From the top 10 cluster-defining genes, five with high relevance to Treg function are shown. See Table S6 for all marker genes.
See also Figure S4.
CTLA-4 is highly expressed by FoxP3+ regulatory T cells (Tregs), and studies in mouse models have indicated that CTLA-4 antibody therapy can induce depletion of Tregs within tumors (Simpson et al., 2013). Depletion of CTLA-4+ Tregs has therefore been hypothesized to cause the high frequency of irAEs in ipilimumab-treated patients, although evidence in human cases does not support this model (Coutzac et al., 2017; Lord et al., 2010; Sharma et al., 2019). Flow cytometric analysis showed that the percentage of FoxP3+ cells within the total CD4+ T cell population was significantly elevated in +CPI colitis patients compared to both control groups, consistent with increased Treg proliferation (Figure 3E,K, S4F). FoxP3 protein levels were higher in Tregs from +CPI colitis patients compared to healthy control subjects (Figure 3F,G). High FoxP3 levels are characteristic of bona fide Tregs, while activated effector T cells transiently express FoxP3 at a lower level (Miyara et al., 2009; Wang et al., 2007). CTLA4 mRNA and CTLA-4 protein levels were also maintained in CD4+ T cells from +CPI colitis patients compared to both control groups (Figure 3H,I and S4A).
Further analysis of cluster 7 identified five sub-clusters; cells in four of these sub-clusters expressed high levels of FOXP3 as expected for Tregs (clusters 1–4) (Figure 3L–N, S4G). Treg cluster 1 cells expressed several genes characteristic of Th1 cells, such as IL12RB2 (IL-12 receptor), CXCR3 and STAT1, and this population was enriched in +CPI colitis patients (Figure 3O, S4H,I). In response to IFNγ, Treg cells upregulate Th1 programs, which enhance their regulatory function for suppression of IFNγ producing Th1 effector cells (Koch et al., 2009). The transcriptional program of Treg cluster 1 may therefore be related to IFNγ production by effector T cells. These data demonstrate that colitis induced by combination CPI or anti-CTLA-4 monotherapy is not caused by the depletion of CTLA-4+ Tregs (Figure 3E–I, S4E), and that the inflammatory environment alters the gene expression programs of Tregs.
Shared TCRs between colitis-associated and tissue-resident memory CD8 T cell clusters
We next aimed to investigate the origin of T cells in colitis-associated clusters, in particular with respect to a potential relationship to tissue-resident memory cells (Trms). This question is particularly relevant for irAEs affecting epithelial tissues (including skin, lung and gut) because these environmental interfaces are infiltrated by substantial populations of Trm (Masopust and Soerens, 2019; Szabo et al., 2019). T cells undergo clonal expansion following TCR activation, enabling use of TCR sequences (clonotypes) as molecular barcodes for mapping of differentiation trajectories. Most cells from the CD4 and CD8 datasets expressed an αβ TCR (average of 91.0% of CD8 and 98.9% of CD4 T cells), with the exception of CD8 cluster 1 (IEL), which contained a substantial population of γδ T cells (Figure S5A,F–H). The high fraction of expanded CD8 T cells permitted a robust comparison of TCR clonotype sharing between clusters (Figure S5B).
We investigated whether TCRs from clonally expanded CD8 T cells could be identified in multiple clusters. For each patient, we determined the number of expanded TCR clonotypes that were shared by two or more clusters, and then aggregated these data for each patient group to evaluate disease-associated TCR clonotype sharing (Figure 4A, S5C). In +CPI colitis patients, 94.2% of expanded TCRs in cluster 8 (cycling cells) were shared with cluster 7 (cytotoxic effector cells), revealing a dynamic connection between these two colitis-associated CD8+ T cell states. In colitis patients, a large percentage of clonally expanded TCRs from tissue-resident memory T cell clusters (#1–3) were shared with colitis-associated clusters 7 and 8 (56.62% of expanded TCRs from clusters 1–3 shared with clusters 7 and 8) (Figures 4A–C).
Figure 4. Tracking of clonal expansion across CD8 T cell clusters.
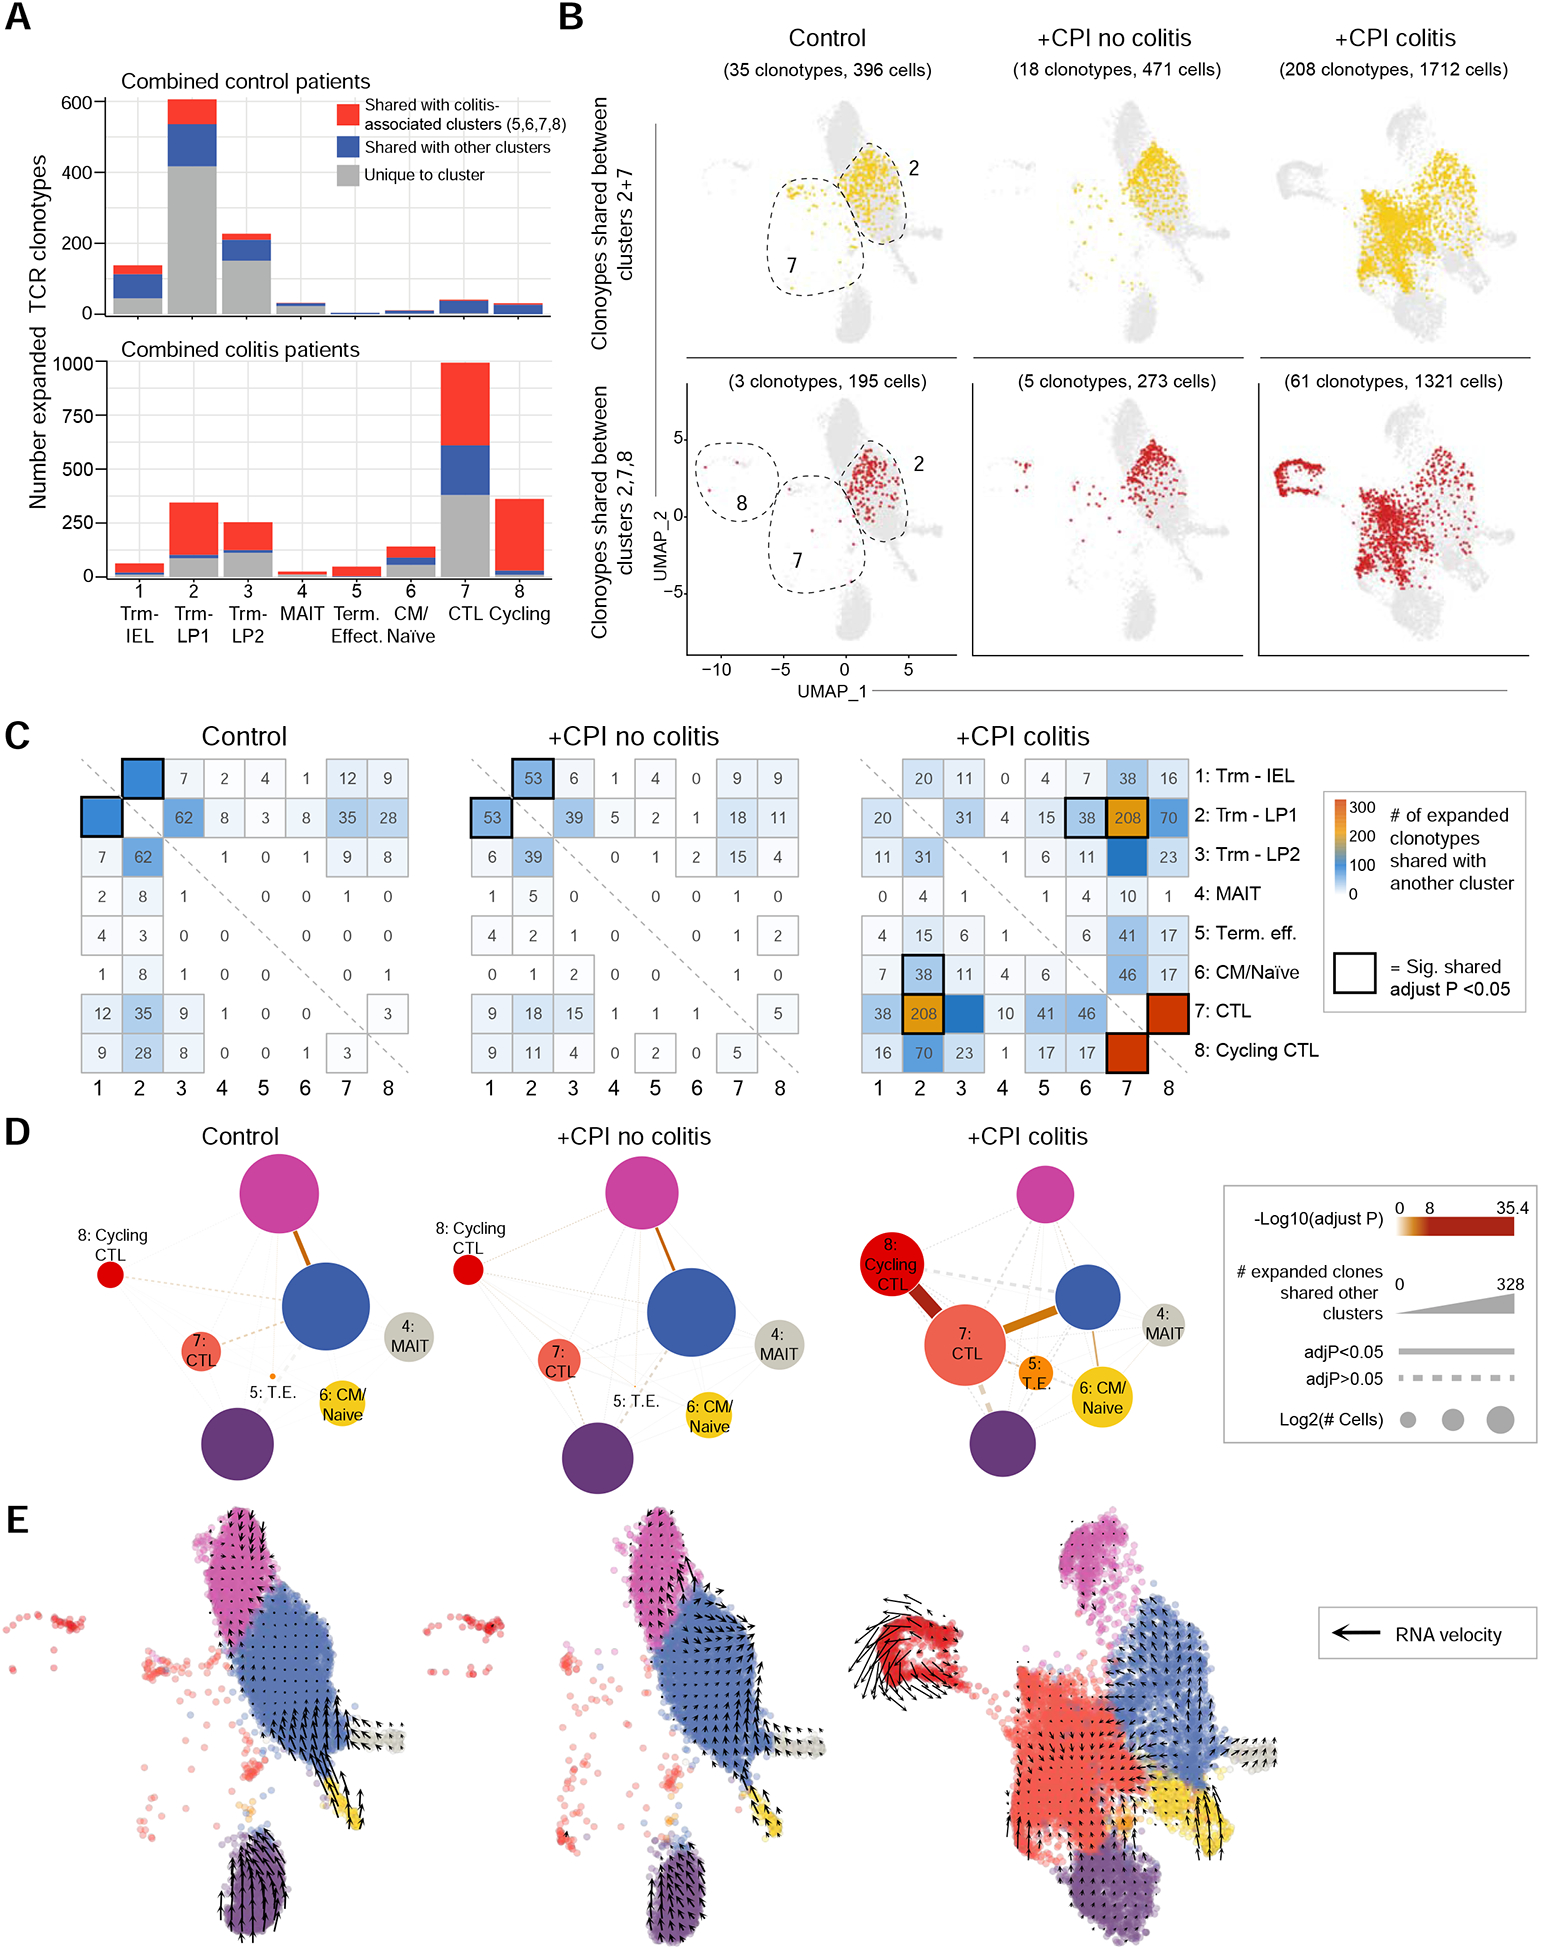
A) Sharing of expanded TCR clonotypes across clusters. For each patient and cluster, the number of expanded TCR clonotypes from the CD8+ dataset was calculated and summed up for the indicated patient groups. Expanded clonotypes shared with a colitis-associated cluster (5–8) are colored red, those shared with other clusters (1–4) are colored blue.
B) Visualization of TCR clonotypes identified in both Trm and colitis-associated clusters. Top panel shows CD8 T cells with expanded clonotypes present in both clusters 2 and 7; bottom panel shows CD8 T cells with expanded clonotypes present in clusters 2, 7 and 8. Some clonotypes are also shared with other clusters, but only sharing with the indicated clusters is visualized.
C) Sharing of expanded TCR clonotypes across all possible combinations of CD8 T cell clusters. Data were aggregated for each of the indicated patient groups. Numbers indicate the number of shared expanded TCR clonotypes for each cluster pair. Bold boxes indicate statistically significant sharing of expanded clonotypes between clusters (adjusted p<0.05, one-sided Fisher’s exact test followed with Benjamini-Hochberg correction).
D) Visualization of data from C as a network plot. Nodes represent cell clusters; size of nodes represents the log2 transformed cell numbers from each patient group. The width of connecting lines indicates the number of shared expanded clonotypes between two clusters, color gradient of lines reflects statistical significance of clonotype sharing.
E) RNA velocity analysis of gene expression in CD8+ dataset. Arrows denote velocity vectors illustrating potential differentiation paths.
See also Figure S5.
We also systematically examined sharing of expanded TCR clonotypes across all combinations of clusters (Figure 4C, D). Inter-cluster sharing of expanded TCRs was dramatically altered among patient cohorts. In control groups, expanded TCR clonotypes were primarily shared between Trm clusters 1 and 2. In contrast, +CPI colitis patient TCR clonotypes significantly overlapped between clusters 7 and 8 as well as 7 and 2. Single-cell transcriptome data were also used to infer dynamic changes between cell populations by computation of splicing-based RNA velocity (La Manno et al., 2018). This analysis revealed a potential differentiation trajectory from Trm to cytotoxic effector cells (Figure 4E). CD4 T cells exhibited less overall clonal expansion (Figure S5B–E), consistent with lower proliferation in response to common viral pathogens compared with CD8 T cells (Foulds et al., 2002). These data demonstrate a dynamic connection between colitis-associated CD8 T cell clusters and tissue-resident memory CD8 T cell clusters in +CPI colitis patients.
Gene expression programs of colitis-associated T cell populations
We next evaluated the expression of inhibitory receptors by colitis associated CD8+ and CD4+ T cell populations. CTLA4 gene expression was significantly upregulated in colitis-associated CD8+ and CD4+ T cell clusters (Figure 5A–C, E–G, S6D,E). At the protein level, an increased percentage of CD8+ T cells expressed granzyme B and CTLA-4 in +CPI colitis patients compared to control cases (Figure S6A–C). We also observed elevated expression of PDCD1 (encoding PD-1) in colitis-associated CD8+ and CD4+ clusters (Figure 5B–C, F–G). Antibodies specific for TIM-3 and LAG-3 are currently being evaluated as alternative cancer immunotherapies, and expression of the corresponding genes HAVCR2 and LAG3 was elevated in colitis-associated CD8+ T cells (cluster 7) and to a lesser extent in CD4+ T cells (cluster 10) (Huang et al., 2019; Solomon and Garrido-Laguna, 2018).
Figure 5. Analysis of T cell checkpoints and colitis-associated genes.
A) CD8+ T cell cluster representation from 2A as UMAP plot (repeated to aid in analysis of gene expression data).
B) Normalized expression of T cell checkpoint genes among CD8+ clusters shown as violin plots. Adj. P value *** = E-100–200, **** <E-200.
C) Expression of inhibitory receptors by CD8+ T cells.
D) Ranking of significantly differentially expressed genes in colitis-associated clusters (5–8) compared to other clusters (1– 4). Top 10 positive and negative differentially expressed genes are labelled. See Table S7 for all differentially expressed genes.
E-H) Same analyses as shown in A-D, but for the CD4+ dataset.
See also Figure S6.
To define common molecular pathways and potential targets for intervention, we evaluated the most differentially expressed genes in colitis-associated clusters. Cytotoxicity genes GZMB and GNLY (CD8+ T cells) and GZMA (CD4+ T cells) were the top differentially expressed genes in colitis-associated clusters (Figure 5D,H, S3C, S4C). A number of colitis-associated upregulated genes were characteristic of an IFNγ response, consistent with elevation of IFNG mRNA in colitis-associated CD8+ and CD4+ T cell clusters (Figure 2B, S3D, 3B, S4D). These include guanylate exchange factors (GBP5) as well as genes of the MHC class II antigen presentation pathway (HLA-DR, CD74), which is increased in T cells during activation and in response to IFNγ signaling. We analyzed Hallmark gene sets collected from the Molecular Signatures Database (Liberzon et al., 2015) and found that IFNγ response genes (and overlapping IFNα response genes) were highly enriched in colitis-associated CD4+ and CD8+ T cell clusters (Figure S6F). IFNγ can directly induce apoptosis in colonic epithelial cells, and enhance antigen presentation to T cells by MHC class I and class II pathways (Langer et al., 2019; Neurath, 2014).
Inflammatory gene expression signatures in myeloid cells
To identify colonic immune cell populations responding to T cell effector programs, we analyzed inflammatory gene expression signatures across all populations in the CD45+ dataset (Figure 1C). We found that IFNγ and TNFα induced signatures were significantly upregulated in myeloid cells (cluster 5) compared to all other immune cell populations (Figure 6A). The top differentially expressed genes in myeloid cells from +CPI colitis compared to control patients were IFNγ response genes including CXCL9 and CXCL10, which encode chemokines that recruit CXCR3+ effector T cells to sites of inflammation (Figure 6B). Pathway enrichment analysis also showed that gene sets associated with IFNγ response and TNFα signaling were upregulated by myeloid cells in +CPI colitis versus control patients (Figure 6C). Sub-clustering of myeloid cells revealed three macrophage/monocyte clusters (#1–3), one dendritic cell cluster (#4), and one cluster representing macrophages that may have phagocytosed T cells (#5, co-expression of macrophage and T cell genes, but low doublet score) (Figure 6D–H). Most macrophages in cluster 1 originated from +CPI colitis patients (Figure 6F) and exhibited elevated expression of IFNγ inducible genes, including CXCL9 and CXCL10 (Figure 6G,I). Macrophages in cluster 1 also had an elevated TNFα signaling gene expression signature (Figure 6I). These data demonstrated that IFNγ changes the gene expression program of myeloid cells and induces expression of chemokines that can recruit effector T cells to sites of inflammation.
Figure 6. Inflammatory gene expression signatures in myeloid cells.
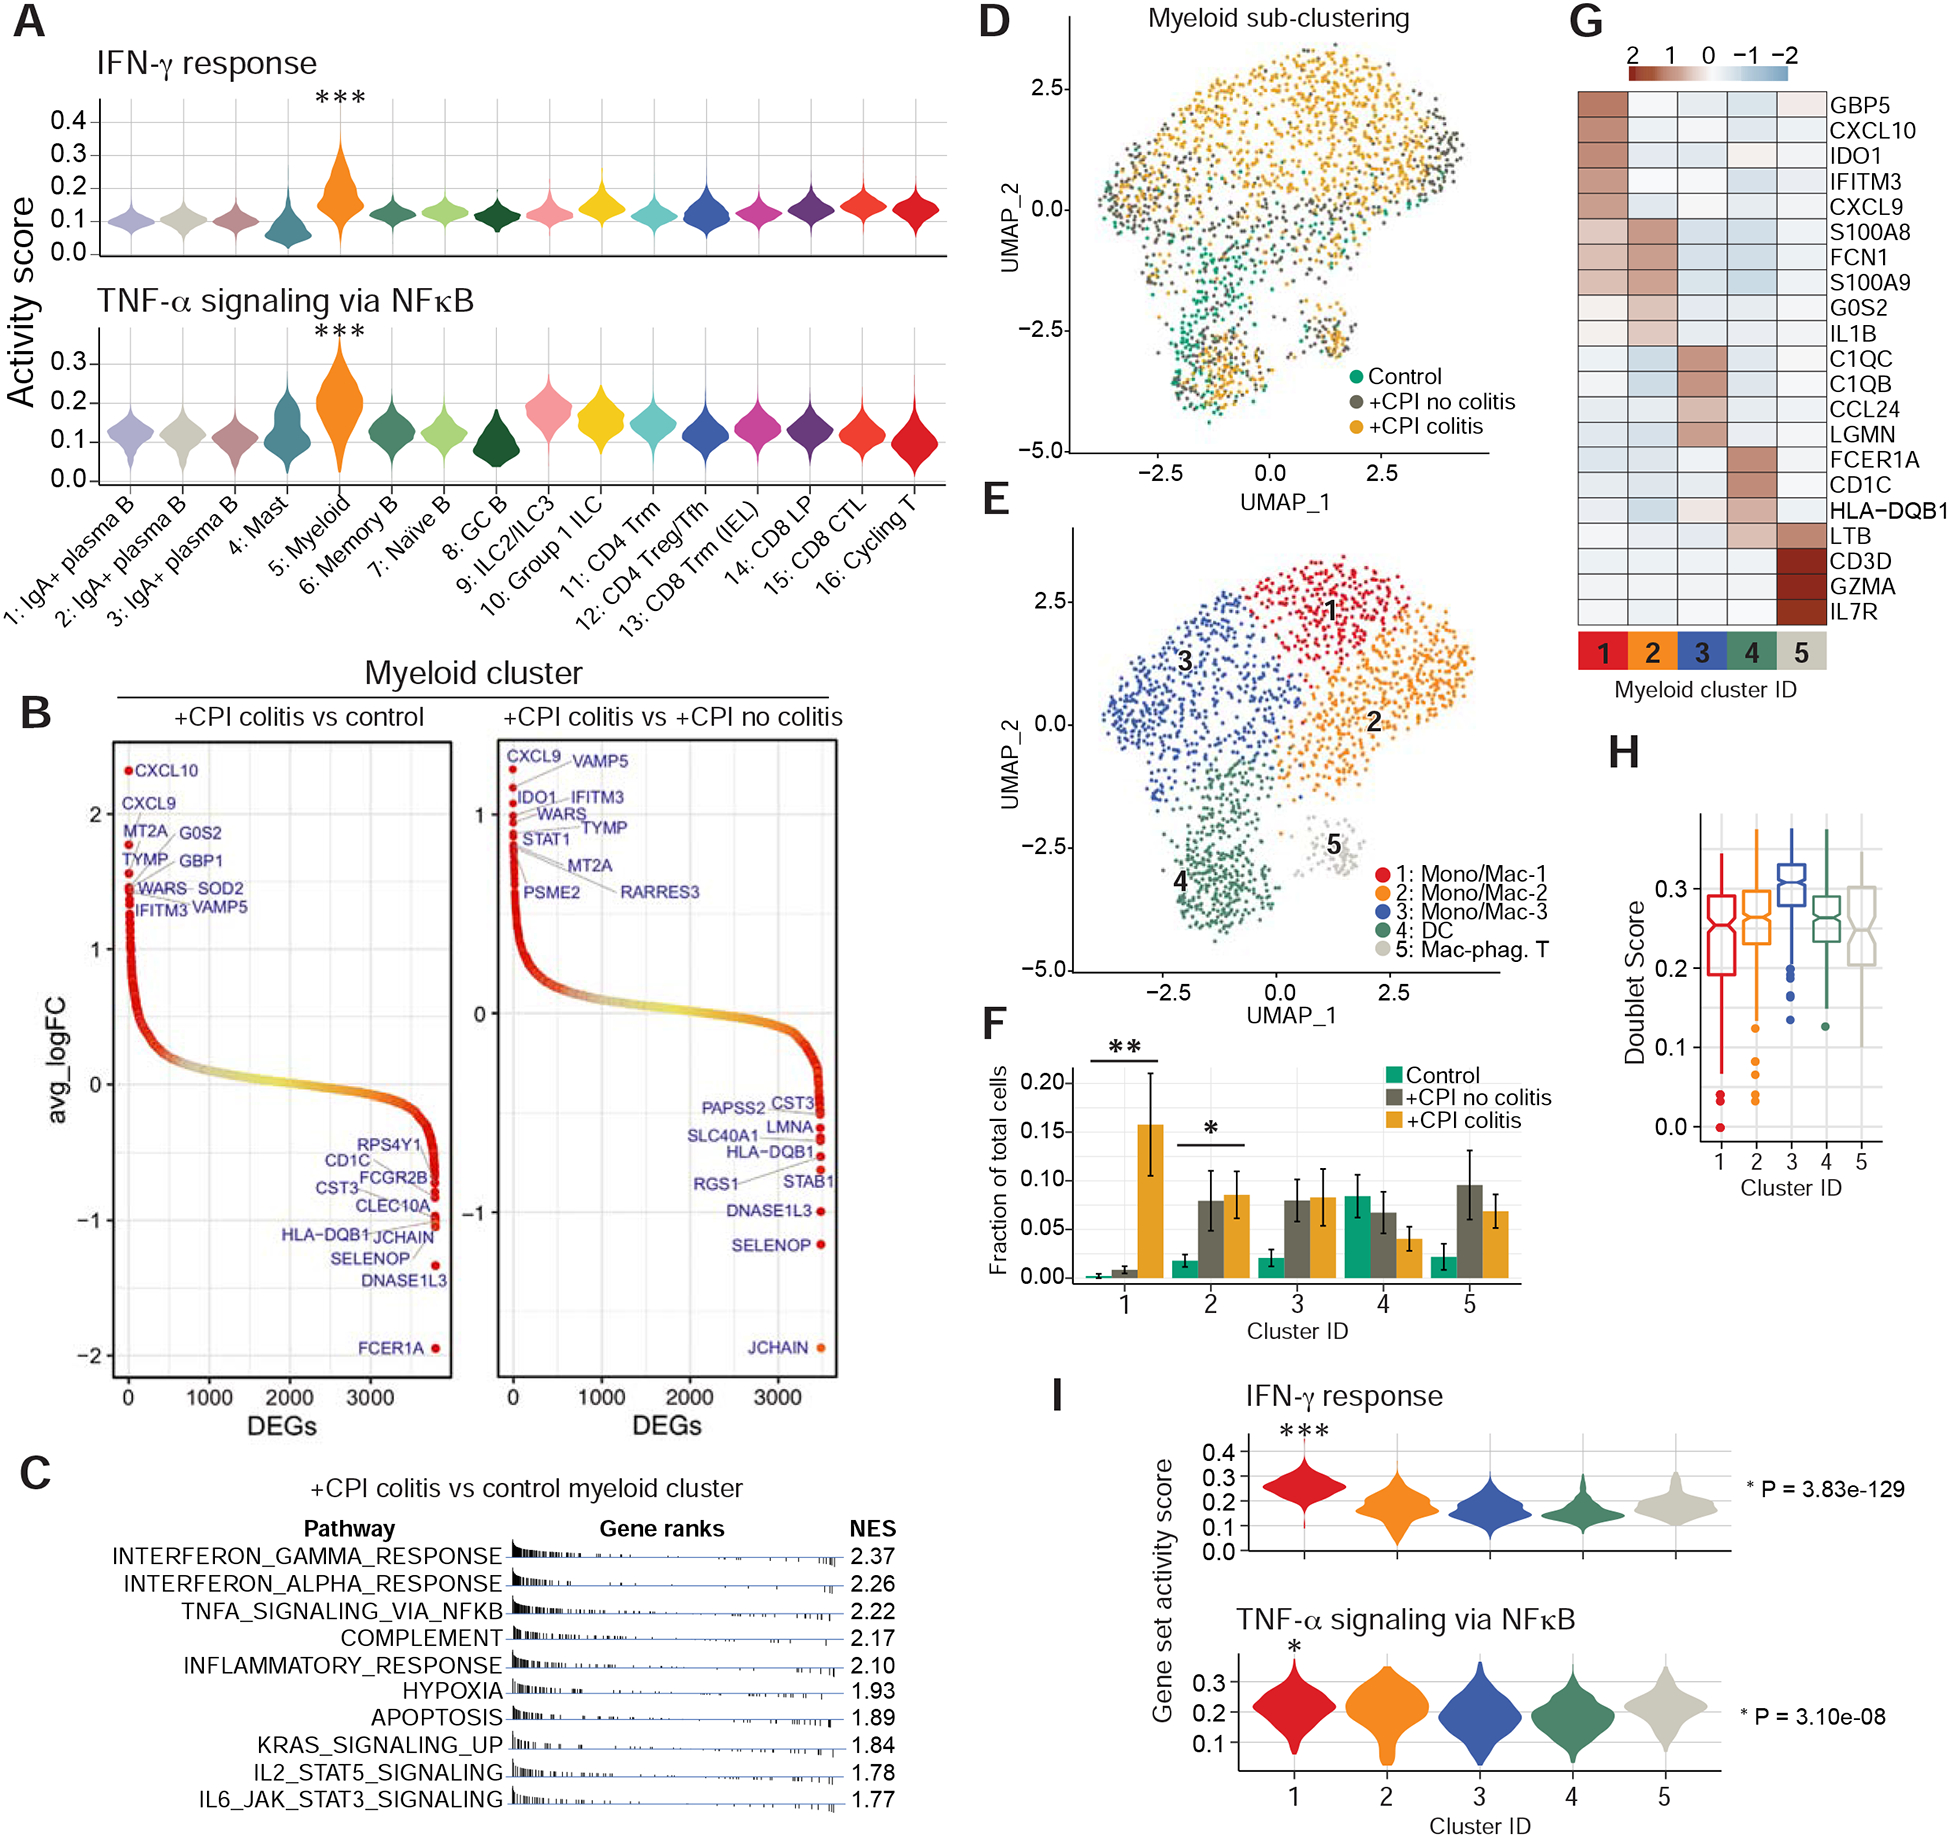
A) Hallmark gene set scores for ‘IFNγ response’ (top) and ‘TNFα signaling via NFkB’ (bottom) computed for all clusters in aggregated CD45+ dataset (all patients combined). *** =p E-100–200, two-sided Wilcoxon test.
B) Ranking of significantly differentially expressed genes among myeloid cells in the indicated comparisons of patient groups. Top 10 positively/negatively differentially expressed genes are labelled. See Table S7 for all differentially expressed genes.
C) Functional enrichment analysis of hallmark gene sets comparing myeloid cells from +CPI colitis to healthy control patients. NES= normalized enrichment score.
D-E) Sub-clustering of myeloid cells from cluster 5 (Figure 1C) colored according to patient group (D) and sub-cluster annotation (E).
F) Quantification of myeloid cell distribution frequency and representation among patient groups. Average and S.E.M. shown for each patient group. * p<0.05, *p<0.01, two-sided Wilcoxon test comparing control and +CPI colitis groups.
G) Heatmap showing differentially expressed genes across myeloid sub-clusters. Genes of interest from top 10 cluster-defining genes are shown. See Table S6 for all marker genes.
H) Cell doublet likelihood was calculated with DoubletFinder showing no significant differences among clusters.
I) Hallmark gene set activity scores computed for each myeloid sub-cluster (aggregated cells from all patients). * = E-05–50, *** = E-100–200, two-sided Wilcoxon test.
Potential therapeutic targets arising from T cell – myeloid cell connectivity
We considered two molecular mechanisms as opportunities for therapeutic intervention in +CPI colitis: recruitment of T cells and production of soluble inflammatory mediators. The chemokine receptor genes CXCR3 and CXCR6 were upregulated in T cells from +CPI colitis patients compared to control subjects (Figure 7A–D, S7A). CXCR6 was one of the top differentially expressed genes in colitis-associated CD4+ T cell populations (Figure 5H), and the ligand encoded by CXCL16 was expressed by both myeloid cells and mast cells. Interestingly, CXCR6 is overexpressed in a variety of human cancers (including prostate, breast, gastric, lung and ovarian cancer) and plays an important role in metastasis (Xiao et al., 2015). CXCR6 inhibition may therefore reduce cancer cell metastasis and also ameliorate inflammation in the colon, although the role of this chemokine receptor in tumor immunity remains to be further studied. Overexpression of the CXCR3 gene by T cells (Figure 7D) and CXCL9 and CXCL10 by myeloid cells (Figure 7C, 6B) in +CPI colitis patients suggests that such T cell – myeloid crosstalk is also important for T cell recruitment.
Figure 7. T cell – myeloid cell connectivity and therapeutic targets.
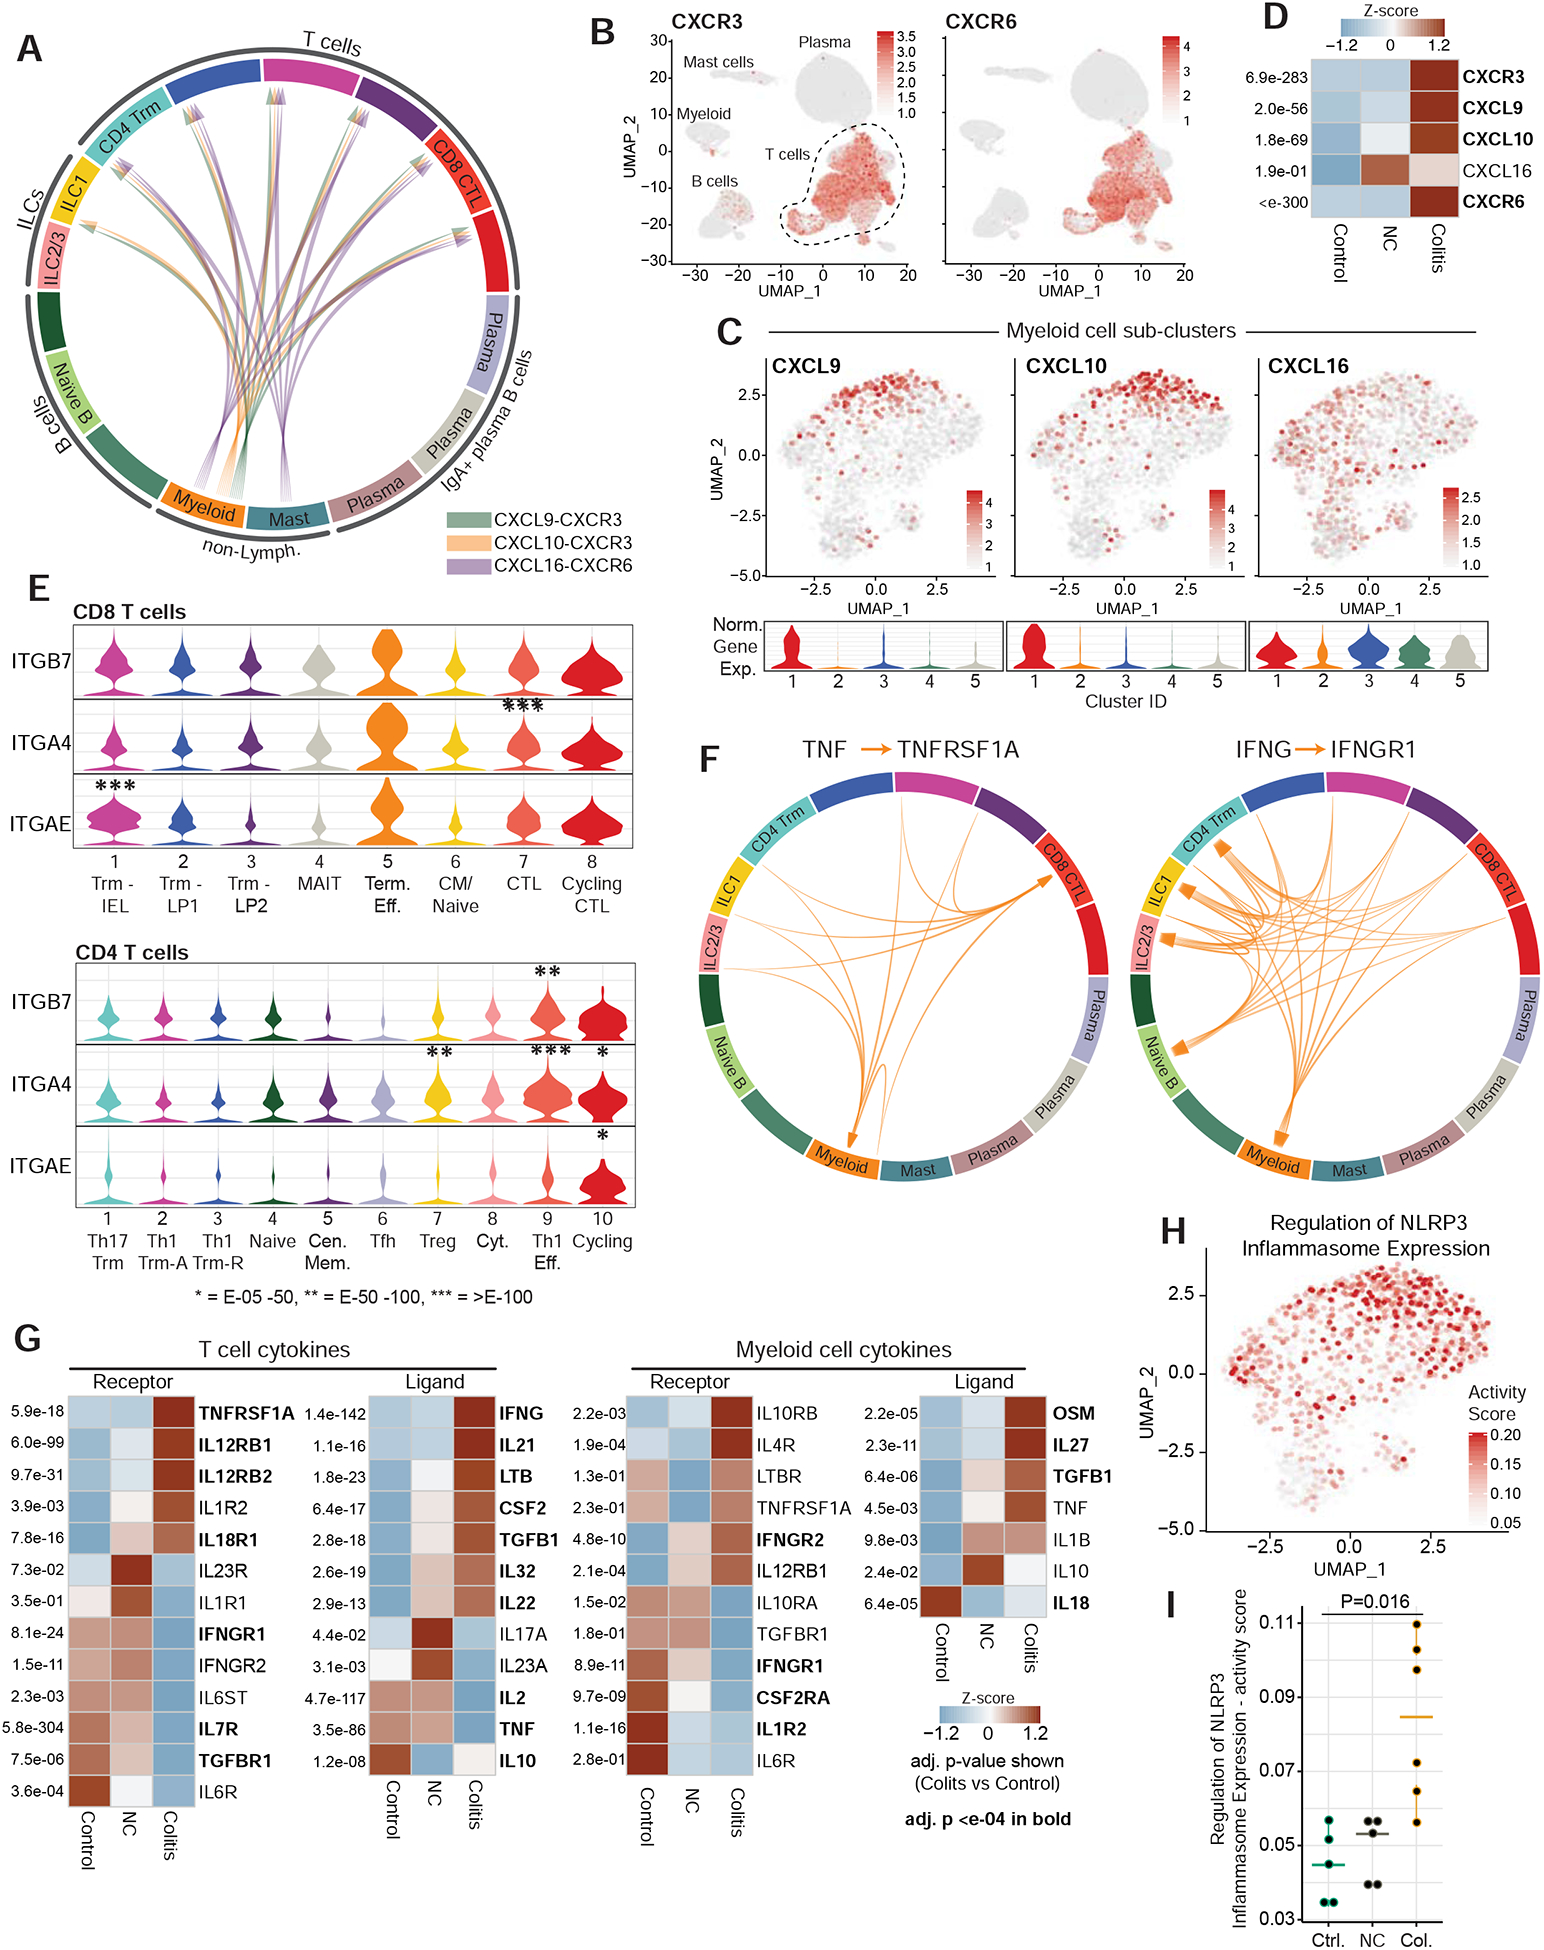
A) Analysis of chemokine receptor-ligand pairs across clusters from CD45+ dataset (aggregated dataset from all patients). All shown interactions were statistically significant based on permutation test, and arrows denote directionality from ligand to receptor (see STAR Methods).
B) Normalized gene expression for indicated chemokine receptors in CD45+ dataset.
C) Normalized expression of indicated chemokine genes in myeloid sub-cluster (feature plot and violin plot for each cluster)
D) Heatmap displaying z-score normalized averaged expression of indicated chemokine and chemokine receptor genes among total CD45+ cells, compared among patient groups. Adj. P values are shown.
E) Violin plots displaying normalized expression of integrin genes among CD8 (top) and CD4 (bottom) clusters. Adj. P value * = E-05–50, ** = E-50–100, *** = E-100+.
F) Analysis of cytokine receptor-ligand pairs across clusters from CD45+ dataset as in A.
G) Heatmap showing z-score normalized averaged expression of indicated cytokine and cytokine receptor genes compared among patient groups. Expression shown for either T cell clusters (11–16) or myeloid cluster (5) from CD45+ dataset, as indicated. Adj. P values are shown.
H-I) Single-cell gene-set activity score for the positive regulation of NLRP3 inflammasome expression shown for myeloid sub-cluster (combined cells from all patients, H) and quantified for patient groups with two-sided Wilcoxon test, I.
See also Figure S7.
The integrin β7 subunit (ITGB7 gene) pairs with the αE (ITGAE) or α4 (ITGA4) subunits to form the αEβ7 and α4β7 receptors. The αEβ7 integrin is a hallmark of tissue-resident memory T cells and enables adherence to E-cadherin-expressing epithelial cells (Cepek et al., 1994; Szabo et al., 2019). The ITGAE chain was highly expressed by CD8+ T cells in colitis-associated clusters (#7, 8 and 5) and Trm clusters (Figure 7E, S7B). ITGAE expression was lower in CD4+ T cell clusters, although a substantial fraction of cycling CD4+ cells (cluster 10) also expressed this gene. The α4β7 integrin enables recruitment of T cells from the blood into the gut, and the ITGA4 gene was elevated in CD4+ colitis-associated clusters (9 and 10) and Tregs (cluster 7), as well as a fraction of CD8+ cytotoxic effector cells (cluster 7) (Figure 7E, S7B). Preliminary clinical data indicate that vedolizumab, a α4β7 integrin-specific mAb, has efficacy in +CPI colitis patients who failed to respond to corticosteroids (Abu-Sbeih et al., 2018). A mAb specific for the β7 chain that inhibits the function of both αEβ7 and α4β7 integrins could also offer a therapeutic opportunity for +CPI colitis.
Finally, we investigated the expression of cytokines and their receptors in both T cell and myeloid cell populations. A number of cytokine – receptor pairs were upregulated in +CPI colitis patients (Figure 7F,G, S7C). Myeloid cells from +CPI colitis compared to healthy controls subjects overexpressed several cytokine genes related to intestinal homeostasis, including TNF, IL1B and OSM (Maloy and Powrie, 2011; West et al., 2017); some of these transcripts were also elevated in myeloid cells from +CPI no colitis patients compared to healthy control subjects. Preliminary clinical data indicate that TNFα blockade can be efficacious for the treatment of +CPI colitis resistant to corticosteroids (Badran et al., 2019), and an increased TNFα induced gene expression signature was observed in myeloid cells from +CPI colitis compared to control cases (Figure 6C). IL-1 release is induced by activation of the NLRP3 inflammasome, and we found that a signature representing the regulation of inflammasome expression was higher in myeloid cells from +CPI colitis compared to control subjects (Figure 7H–I, S7D,E). We also examined a signature comprised of genes encoding the NLRP3 inflammasome core pathway, which was expressed in all myeloid cells but elevated in clusters 1 and 2 (Figure S7F). Single-cell analysis of both IL1B and NLRP3 inflammasome core pathway genes showed highly significant co-expression (Figure S7G). In a recent clinical trial that evaluated the IL-1β blocking antibody canakinumab in patients with atherosclerosis, the incidence of newly diagnosed lung cancer and lung cancer mortality were significantly reduced in the canakinumab treatment arm compared to the placebo group (Ridker et al., 2017), and this mAb could also represent an opportunity for the treatment of +CPI colitis.
Discussion
This comprehensive single-cell analysis of +CPI colitis identified major changes in immune cell composition and effector programs underlying this common and severe irAE. TCRαβ receptor analysis demonstrated a connectivity between CD8 tissue-resident memory and the emergence of cytotoxic effector cells in +CPI colitis patients. Colitis may be a relatively common and early irAE because a large number of such tissue-resident CD8+ T cells are already present in the healthy colon. We therefore hypothesize that activation of tissue-resident CD8 T cells plays an important role in colitis, and that activation of such T cells induces subsequent recruitment of additional CD8 and CD4 T cell populations from the blood.
The pronounced activation and proliferation of cytotoxic effector CD8+ T cells in +CPI colitis may in part explain response to systemic corticosteroid therapy because corticosteroids induce apoptosis of activated T cells (Herold et al., 2006). Many other irAEs associated with CPIs also respond to corticosteroids, consistent with the hypothesis that highly activated T cells may also be present in other tissues affected by irAEs. The large fraction of cycling T cells in +CPI colitis may also explain the clinical observation that this irAE often occurs with rapid onset and escalates over a period of days rather than weeks as is typical of inflammatory bowel disease (IBD) (Dougan, 2017). In contrast, tumor-infiltrating T cells are far less proliferative following checkpoint blockade due to T cell exhaustion (McLane et al., 2019). This lower proliferative capacity may explain why anti-tumor effects of checkpoint blockade are not fully abrogated by systemic corticosteroid exposure. Nevertheless, some deleterious effects of prolonged high-dose corticosteroids on anti-tumor immunity are likely, underscoring the importance of identifying alternative therapeutic targets.
Recent single-cell analyses of intestinal Crohn’s disease and ulcerative colitis (UC) lesions provide an opportunity for comparison to +CPI colitis (Martin et al., 2019; Smillie et al., 2019). Proliferating T cells were increased in UC, Crohn’s and +CPI colitis compared with healthy colon tissue; however, their elevation was most pronounced in +CPI colitis. T cell cytokine profiles also showed substantial differences between these forms of colitis: UC was characterized by an increase in IL17+ CD8 T cells, whereas IL-17 expression was unchanged in +CPI colitis. In contrast, T cell IFNγ expression and IFNγ inducible genes were strongly increased in +CPI colitis compared to control cases. In both UC and Crohn’s disease, there was a shift from IgA+ to IgG+ plasma B cells that was not observed in +CPI colitis, which may relate to differences in underlying mechanisms and disease state. These data suggest that there are important differences in T cell functional states, T cell cytokine expression programs and B cell-mediated immunity between IBD and +CPI colitis.
Colitis-associated T cell populations expressed high levels of CXCR6 and CXCR3 chemokine receptor genes. CXCL16, which encodes the ligand for CXCR6, was expressed by colonic myeloid cells and mast cells, and its expression is known to be regulated by both IFNγ and TNFα. CXCR6 and CXCL16 represent potential targets for the treatment of colitis, in particular because this chemokine – receptor pair also contributes to tumor cell metastasis (Xiao et al., 2015). CXCL9 and CXCL10, the ligands for CXCR3, are both induced by IFNγ and the corresponding genes were overexpressed by myeloid cells in colitis versus control cases. However, both CXCL9 and CXCL10 have been shown to be important for recruiting effector T cells to tumors, and blockade of either chemokine or IFNγ would be expected to have negative consequences on anti-tumor immunity (Groom and Luster, 2011). In contrast, recruitment of lymphocytes into the gut is dependent on binding of the α4β7 integrin to MadCAM on the gut endothelium (Neurath, 2019). Inhibition of α4β7 integrin using the monoclonal antibody vedolizumab is effective for the treatment of IBD and appears to have efficacy in patients with +CPI colitis who failed to respond to corticosteroids (Abu-Sbeih et al., 2018). As expected, we observed expression of both genes (ITGA4 and ITGB7) encoding the α4β7 integrin receptor in T cells from multiple T cell clusters, including colitis-associated clusters. Retention of lymphocytes in the gut mucosa is dependent on αEβ7 integrin (Neurath, 2019), and we observed high level expression of the ITGAE gene in colitis-associated T cell clusters (in particular CD8+ T cells), suggesting that this integrin may be another potential therapeutic target. A monoclonal antibody targeting the β7 integrin chain shared by both α4β7 and αEβ7 receptors is under clinical development (e.g. NCT02394028, NCT02136069), and may be particularly effective for the treatment of +CPI colitis.
The findings described here may have broad relevance for understanding the cellular and molecular mechanisms of other irAEs triggered by checkpoint blockade, in particular those occurring in epithelia infiltrated even in the healthy state by substantial populations of lymphocytes. Histological analysis of two cases with severe colitis following treatment with anti-PD-1 monotherapy demonstrated infiltration of the mucosa by CD8+ T cells and T-bet+ CD4+ T cells, consistent with our findings for patients who received combination CPI (Yoshino et al., 2019). In addition, fatal myocarditis in two melanoma patients treated with combination CPI was associated with robust infiltration of the myocardium by CD3+ and CD8+ T cells as well as macrophages (Johnson et al., 2016). These data provide a rich source for the identification of therapeutic targets for +CPI colitis and other irAEs, as illustrated by the identified chemokines, cytokines and cell surface receptors.
STAR methods
RESOURCE AVAILABILITY
Lead contact
Further information and requests for resources and reagents should be directed to and will be fulfilled by the Lead Contact, K.W.W. (Kai_Wucherpfennig@dfci.harvard.edu).
Materials Availability
This study did not generate new unique reagents.
Data and Code Availability
The datasets generated during this study are available at the Gene Expression Omnibus (GEO) under accession number: GSE144469.
EXPERIMENTAL MODEL AND SUBJECT DETAILS
Patients and tissue samples
Biopsy samples were obtained from CPI-treated melanoma patients undergoing a diagnostic endoscopy procedure at Massachusetts General Hospital or Brigham and Women’s Hospital/Dana-Farber Cancer Institute. Prior to the procedure, patients provided informed consent for collection of additional research biopsies, in accordance with IRB-approved protocols (DF/HCC 15–302, 18–080, 11–181, and 18–498). Histological analysis of biopsies was performed following endoscopy, at which time patients were assigned to either +CPI colitis or +CPI no colitis patient groups. As an additional control group, healthy age-matched adults were consented prior to a regular screening colonoscopy procedure (DF/HCC 15–302 and 18–080). Subjects included both males and females spanning an age range of 21–78 years, and details on individual patients can be found in Table S1. In all cases, biopsies were obtained during endoscopy using a standard-of-care forceps, spanning the regions from the descending colon, sigmoidal colon, and rectum; for two patients, C2 and NC2, biopsies from the ascending colon were also collected. Typically, 2–6 biopsies from each region were separately allocated into DMEM media and transported on ice to the lab for immediate tissue dissociation. For some patients (n=4 control , n=1 +CPI no colitis), descending, sigmoid, and rectum biopsies were collected as a single pool rather than separately from each region.
METHOD DETAILS
Preparation of single cell suspensions
When biopsies were collected from multiple subregions, we combined main colon biopsies (descending colon for all patients except for C2 and NC2, from whom ascending biopsies were also combined) and sigmoid plus rectum biopsies to make two pools. Biopsies were transferred to 6 cm tissue culture dishes placed on ice and cut into <1 mm pieces with a razor blade while immersed in a small volume in DMEM (ThermoFisher Scientific # 11995073) to preserve tissue hydration. Tissue pieces were centrifuged (400 g for 5 min at 4°C for all centrifuge steps) and resuspended in 2 mL of collagenase-containing enzymatic digestion solution prepared according to manufacturer’s instructions (Miltenyi Human Tumor Dissociation Kit #30-095-929). Biopsies were incubated at 37°C for 25–30 min with mixing using a P1000 pipet tip (10-minute intervals) and intervening gentle vortexing (2–5-minute intervals). Digestion produced a nearly uniform single cell suspension which was passed through a 70 μm nylon mesh filter. Filtered cell suspensions were centrifuged and resuspended in 3 mL ACK red blood cell lysis buffer (Gibco #A1049201) for 1 minute at RT, then immediately diluted with 10 mL of PBS buffer containing 0.5% FBS (Life Technologies# 10437028) and 1 mM EDTA to halt osmotic stress. Cells were centrifuged and subsequently resuspended in Zombie NIR (Biolegend #423106) viability dye solution (1:500 in PBS), followed by 15 min incubation at RT in the dark. Cells were counted with a hemocytometer, generally yielding >100,000 live cells per individual biopsy. Following viability dye staining, cells were allocated for sorting/single-cell RNA-seq or spectral flow cytometry.
Sorting of CD3+ and CD45+ MNC for scRNA-seq
For patients with biopsies spanning multiple regions, descending colon and sigmoid-rectum cell suspensions were combined in equal numbers to provide an aggregate analysis of the lower colon. Cells stained with viability dye (0.4–0.6 × 10⁶) were resuspended in 100 μL of FACS wash buffer (FWB; PBS, 2%FBS, 1 mM EDTA) with the addition of the following antibodies: TruStain FcX (Biolegend 422302), CD3-PE/Dazzle (Biolegend 300450), CD45-Pacific Blue (Biolegend 304022), CD66b-PE/Cy7 (Biolegend 305116) and CD15-APC (Biolegend 301908). Cells were incubated on ice for 20 minutes, washed with 1 mL FWB, and then resuspended in 500 μL FWB for sorting on a FACS Aria II or III (BD Biosciences). For the majority of samples, 12–15 × 103 live CD45+CD66b− mononuclear cells (MNC) cells and CD3+ cells (pre-gated on live MNC) were separately sorted into T cell media (RMPI + 10% FBS) and immediately transferred to ice. CD66b+ granulocytes were excluded from the analysis because these cells interfere with scRNA-seq using the 10X Genomics protocol.
Cell preparation for 5’ barcoded scRNA-seq
Sorted cells were centrifuged and washed with PBS containing 0.05% RNase-free BSA (ThermoFisher Scientific #AM2616), leaving a final volume of <31 μL. CD3+ and CD45+ MNC cells were loaded into separate channels of a Single Cell Chip A, along with reverse transcriptase reagent mixture and 5’ gel beads according to manufacturer’s protocol (10X Genomics). Chips were loaded into the 10X Genomics Chromium Controller for single-cell partitioning. Emulsions were immediately recovered from the chip and incubated in a deep-well block Thermocycler (Bio-Rad Laboratories) for the reverse transcription reaction.
Library preparation for scRNA-seq
All steps from cDNA isolation to library preparation were completed as per manufacturer’s protocol. Isolated cDNA was amplified (14 cycles), after which cDNA was allocated for TCR enrichment/library preparation with the Chromium Single Cell V(D)J TCR kit, or for preparation of a gene expression library. cDNA and library quality was evaluated using the D5000 and D1000 high-sensitivity kits on a 2200 TapeStation system (Agilent).
We also prepared custom γδ TCR-enriched libraries. From amplified cDNA, we performed 2 rounds of PCR enrichment of γδ TCR genes used nested primers annealing to TRGC1/2 and TRDC (1 μM each in reaction). Forward primers were the same as used for αβ TCR enrichment as described in the manufacturer’s technical protocol: AATGATACGGCGACCACCGAGATCTACACTCTTTCCCTACACGACGCTC for the first-round PCR and AATGATACGGCGACCACCGAGATCT for the second-round PCR, both at 2 μM. PCR reaction conditions, purification steps, and library preparation were performed according to the manufacturer’s protocol for TCR V(D)J enrichment.
| TRGC1/2 | TRDC | |
|---|---|---|
| Outer primer (round 1) | TGGCACCGTTAACCAGCTAA | CGTGTTGAACTGAACATGTCAC |
| Inner primer (round 2) | GGTATGTTCCAGCCTTCTGG | GTTCCATTTTTCATGACAAAAACGG |
Sequencing of scRNA-seq libraries
CD3+ T cell gene expression libraries were sequenced on the Illumina HiSeq 4000 platform with 150 bp paired-end read configuration. CD45+ MNC libraries were sequenced either on the Illumina HiSeq 4000 platform with 150 bp paired-end read configuration or the HisSeq 2500 platform on rapid run mode. We obtained >30,000 reads per cell for all samples, which was particularly important with CD45+ libraries for sufficient sampling of non-immunoglobulin genes given the high plasma B cell count. TCR V(D)J libraries were sequenced on the Illumina MiSeq (V2 flowcell), HiSeq 2500, or HiSeq 4000 platform, all on 150 bp paired-end read configuration.
Antibody staining for spectral flow cytometry
Viability dye-stained cells (0.1–1 ×10⁶) from the combined descending and sigmoid-rectum colon cell suspensions were centrifuged and resuspended in 50–100 μL FWB to a density of 0.2–1×10⁷ cells/mL in V-bottom plates. The following antibodies for cell surface epitope staining were added, and cells were incubated for 30 min at 4° C in the dark.
| Reagent | Dilution | Supplier | Catalog Number |
|---|---|---|---|
| BV421 anti-γδ78TCR | 1:20 | Biolegend | 331218 |
| Pacific Blue anti-CD45 | 1:40 | Biolegend | 304022 |
| BV510 anti-CD14, CD15, CD64, CD163 (Dump mixture) | 1:80 each | Biolegend, BD | 301842, 323028, 563459, 333628 |
| BV570 anti-CD8α | 1:40 | Biolegend | 301038 |
| BV605 anti-CD103 | 1:40 | Biolegend | 350217 |
| BV785 anti-Vα7.2 TCR | 1:20 | Biolegend | 351722 |
| Alexa Fluor 532 anti-CD3 | 1:40 | eBioscience | 58-0038-42 |
| PE anti-CD69 | 1:40 | Biolegend | 310906 |
| PerCP-Cy5.5 anti-CD 161 | 1:20 | Biolegend | 339908 |
| Alexa Fluor 700 anti-CD4 | 1:20 | eBioscience | 56-0049-42 |
Following incubation, cells were washed twice with 150–200 μL FWB before proceeding to intracellular staining. Cells were then fixed and permeabilized with the FoxP3/transcription factor buffer staining set (eBioscience) for 20 min at RT. Cells were washed twice with 1x permeabilization buffer before proceeding to intracellular staining with the following antibodies diluted in 1X permeabilization buffer.
| Reagent | Dilution | Supplier | Catalog Number |
|---|---|---|---|
| Alexa Fluor 488 anti-Ki67 | 1:20 | Biolegend | 350507 |
| PE/CF594 anti-Granzyme B | 1:50 | BD | 562462 |
| PE/Cy-7 anti-CTLA-4 | 1:20 | Biolegend | 349914 |
| APC anti-FoxP3 | 1:20 | eBioscience | 17-4777-42 |
Cells were stained for 20 min at RT in the dark, and then washed twice with 1X permeabilization buffer. Stained cells were resuspended in 300 μL FWB and stored at 4°C protected from light until analysis within 48 hours.
Spectral flow cytometry analysis
Stained cells were passed through a 40 μm filter and analyzed with a Sony SP6800 Spectral Analyzer. Single-color controls for spectral unmixing, using the identical antibodies as for analysis, were acquired using OneComp eBeads (ThermoFisher 01-1111-41) and fixed when applicable to match experimental conditions. The single-color control for Zombie NIR viability dye was acquired with PBMCs. Data were analyzed using FlowJo (Tree Star) version 10.4. Gating was confirmed with fluorescence-minus-one (FMO) controls from patient biopsy cell suspensions for low-density antigens, or a mixture of activated PBMC and Caco-2 colon cells for highly expressed antigens given the limited number of cells available from biopsies.
For cases (six from each patient group) with separately collected biopsies from multiple regions, we stained and analyzed descending colon (in 2 cases also including ascending colon) and sigmoid plus rectum separately. There were no significant regional variations in T cell populations, thus for analysis we used an average of these regions for comparison to patients from whom regional biopsies had been combined during initial collection.
Flow analysis included 3 additional patients not included in the scRNA-seq analysis. These comprised one +CPI no colitis patient and two healthy control subjects. Analysis of samples was performed over a 14-month period, and changes were made to the antibody panel after the initial patients to enable validation of key findings from the scRNA-seq data analysis. For patients C1 and C2, anti-Ki-67 and anti-CD103 were not included in the panel. For patients C3, NC1, NC2, and NC3, anti-Ki67 was not included in the panel. For patients C1 and C2, FITC-conjugated anti-CTLA-4 was used, which could not be clearly resolved during analysis and was exchanged with Pe-Cy7-conjugated anti-CTLA-4. These variations are reflected in sample numbers for corresponding flow analyses shown in the figures. Mean fluorescence intensities for parameters were only compared among patients with identical antibody panels and instrument configurations.
Multiplex immunofluorescence of FFPE colon biopsies
Sections from formalin-fixed paraffin-embedded tissue were cut at a thickness of 4μm, deparaffinized in xylene and rehydrated through a graded alcohol series. Antigen retrieval using EDTA (Dako, S2367) was performed at 120° C for 20 minutes using a bench-top thermal processor (Electron Microscopy Services, 62706). Subsequent multiplex immunofluorescence staining was performed using a Leica BOND RX automated staining instrument (Leica Biosystems). Following protein block (ARD1001EA, Akoya Biosciences), primary antibodies (anti-CD3, Dako M7254; anti-CD4, Cell Marque EP204; anti-FOXP3, BioLegend 206D; anti-CD8, Dako M7103; anti-Ki67, ThermoFisher MA5–14520; Pan-cytokeratin, Dako M3515 and Cell Signaling CST4545) were each sequentially applied for 1 hour at room temperature, followed by a 10 minute incubation with a secondary antibody (ARH1001EA, Akoya Biosciences) and subsequent detection via tyramide-signal amplification and an Opal fluorophore for 10 minutes (CD3 Opal 540; CD4 Opal 520; FOXP3 Opal 570; CD8 Opal 650; Ki67 Opal 690 and Pan-cytokeratin Opal 620). After each round of detection, heat-induced epitope retrieval was performed on the autostainer using sodium citrate, pH 6 (Leica Biosystems, AR9961). After the final immunofluorescence staining round, DAPI (Akoya Biosciences, FP1490) was applied for 10 minutes. Coverslips were mounted using ProLong Gold Antifade (ThermoFisher Scientific, P36935). Whole slide overview images at 10x magnification were obtained using a Vectra 3.0 multispectral imaging system (Akoya Biosciences) and were used to select representative regions for multispectral imaging at 20x. Following generation of a spectral library using single color and unstained controls, multispectral unmixing was performed using the inForm software package (Akoya Biosciences, v2.4).
QUANTIFICATION AND STATISTICAL ANALYSIS
Flow cytometry data analysis
Statistical analyses of flow cytometry data were performed with Prism 8.4.1 (GraphPad). The number of n, which represents the number of individual patients analyzed, is shown in the figure legends with details in Table S5. The Bartlett’s test for equal variances was applied to the datasets to determine whether the standard deviations among comparison groups were significantly similar, informing which analyses were appropriate. The statistical method for each analysis is shown in the figure legends, and all analyses were corrected for multiple comparisons when appropriate. The mean and standard deviation is displayed in all plots * p<0.05, ** p<0.01, *** p<0.001, **** p<0.0001.
Pre-processing of single cell RNA-seq data
Raw single-cell RNA-seq data were processed using 10X Genomics Cell Ranger (v3.0.2), including demultiplexing the FASTQ reads, aligning them to the human reference genome (GRCh38, v3.0.0, from 10X Genomics), and counting the unique molecular identifier (UMI) (by using “cellranger count” function). All patient samples from each dataset were then aggregated by using the “cellranger aggr” function without depth normalization. As a result, a digital cell by gene expression matrix was generated, containing the number of UMIs for each gene detected in each cell. In addition, we carried out a number of steps to filter out poor quality data. First, we removed cells with high mitochondrial gene expression because damaged and dead cells often exhibit extensive mitochondrial contamination (Ilicic et al., 2016). Specifically, we fit the expression level of mitochondrial genes by using a median-centered median absolute deviation (MAD)-variance normal distribution, and then removed the cells with significantly higher expression levels than expected (determined by Benjamini-Hochberg corrected P < 0.01, for CD3+ dataset: 11.13%; for CD45+ dataset: 13.33%) (Pijuan-Sala et al., 2019). Second, we removed cells for which less than 200 genes were detected. Third, we identified and removed potential doublets by using DoubletFinder (v2.0.2), using 92.5th percentile of the doublet score as cutoff (McGinnis et al., 2019). In the end, we retained a total of 68,728 and 51,652 single cells for the CD3+ and CD45+ cell datasets, respectively.
Identification of cell clusters
The processed whole gene expression matrix with all selected cells was fed to Seurat (v3.1.0, R package) for downstream analyses (Stuart et al., 2019). Briefly, only genes expressed in more than 10 cells were kept, and the UMI count matrix was normalized by using ‘NormalizeData’ function, in which the number of UMI for each gene was divided by the total number of UMI in each cell and multiplied by a scale factor of 10,000, followed by adding a pseudocount 1 for each gene and natural-log transformation. Based on the normalized gene expression matrix, 2,000 highly variable genes were identified by using the ‘FindVariableFeatures’ function with the ‘vst’ method for both CD3+ and CD45+ datasets. In order to avoid the dominant effect of T cell receptor variable genes, as these genes usually show very high expression level in subpopulations of cells, in the determination of T cell clusters, TCR genes (TRAV, TRBV, TRDV and TRGV genes) were removed from the clustering analysis of the CD3+ dataset. In addition to the T cell receptor variable genes, the immunoglobulin variable (IG[X]V genes) genes were also removed from the highly variable genes in CD45+ dataset in clustering analysis. ‘ScaleData’ function was then used to scale and center the gene expression matrix after regressing out the heterogeneity associated with the mitochondrial contamination. To perform the clustering analysis, the first 20 principal components were selected for constructing the shared nearest neighbor (SNN) graph by using ‘FindNeighbors’ function, and then Louvain clustering algorithm was used to group the cells into different clusters (Blondel et al., 2008). For the CD3+ dataset, we removed four small clusters which did not express T cell marker genes (CD3D, CD3E and CD3G) and performed the clustering analysis again based on the remaining cells (67,926 cells).
Annotation of cell clusters and data visualization
We used two complementary approaches to annotate the identities of different cell clusters: (1) we checked whether the well-studied marker genes of different immune cell types were in the top rank of differential expressed genes of query cluster and then assigned the most likely identity for each cell cluster; (2) applied an unbiased cell type recognition method named SingleR (v0.99.10, R package) (Aran et al., 2019), which leverages reference transcriptomic datasets of known cell types for annotation (Martin et al., 2019; Smillie et al., 2019). We first applied SingleR to determine if the predicted annotations for a query cluster based on different reference datasets were consistent, and then assigned this cluster as the predicted cell type annotation; alternatively, we checked which genes were in the top rank of differentially expressed gene list of this cluster. The uniform manifold approximation and projection (UMAP) was applied to visualize the single cell transcriptional profile in 2D space based on the SNN graph described above (Becht et al., 2018; McInnes et al., 2018). Other bar plots, box plots, violin plots and heatmaps were generated by customized R code through ggplot2 (v3.2.1, R package) (Wickham, 2016).
To analyze CD3+ T cells in detail, we split the CD3+ T cell dataset into CD4+ and CD8+ T cell subsets according to the mutually exclusive expression of CD4 (CD4>1 and CD8A<1) and CD8A (CD4<1 and CD8A>1) genes (based on normalized expression), and then applied the pipelines as described above, with the modification that 1,500 highly variable genes were selected to identify, annotate and visualize the cell clusters. We also used the same steps to perform the sub-clustering analysis for the Treg cell cluster (from CD4+ subset) and myeloid cell cluster (from CD45+ cell dataset). In the CD8+ dataset, we observed slight patient-specific batch effects as evidenced by clusters containing cells from only a single patient or fraction of patients, likely caused by technical differences. To correct this, we regressed out the unwanted source of technical variation by implementing the ‘ScaleData’ function before cell clustering.
Identification of colitis-associated clusters
To make the number of cells from different patients in each cluster comparable in CD3+, CD45+ datasets and other subsets, we first normalized the number of cells for each patient to the median of patients’ total number of cells. Then the percentages of cells from different patients were calculated in each cluster and the two-sided Wilcoxon test was applied to obtain the P values between control and colitis groups. The clusters with P value < 0.05 were assigned as colitis-associated clusters.
Differential expression analysis
Differentially expressed genes in different clusters were identified by ‘FindAllMarkers’ function (use default parameters but set min.pct as 0.3) in Seurat. We also calculated a cell-type specificity score based on our previously described Jensen-Shannon Divergence algorithm for each identified differentially expressed gene and visualized the top ranked genes in CD4+ and CD8+ subsets (Suo et al., 2018). In order to identify colitis-related differentially expressed genes in CD4+ or CD8+ subsets, we combined colitis-associated clusters together and then compared with other clusters by using ‘FindMarkers’ function in Seurat with default parameters but set min.pct as 0.3 and logfc.threshold as 0. Within the myeloid cluster, we used the same approach but compared cells from the CPI colitis group with cells from control or +CPI no colitis groups to identify colitis-related genes.
Functional enrichment analysis
We used a fast per-ranked gene set enrichment analysis (GSEA) named fgsea (v1.11.1, R package) to perform functional enrichment analysis for colitis-related differentially expressed genes (Korotkevich et al., 2019). First we downloaded the hallmark gene sets from Molecular Signatures Database (MSigDB, http://software.broadinstitute.org/gsea/msigdb/index.jsp) (Liberzon et al., 2015), and then fed each differentially expressed gene list together with averaged log (fold-change) of each gene and the hallmark gene sets to the ‘fgsea’ function (minSize = 15, maxSize = 1000, nperm = 1000). Finally, only hallmark gene sets with adjusted P value <0.05 were selected as the functionally enriched biological states or processes.
RNA velocity analysis
RNA velocity is widely used to infer the directionality and future state of individual cells by distinguishing un-spliced and spliced mRNAs from single-cell RNA-seq data. To analyze the expression dynamics in CD8+ or CD4+ T cell subsets, we applied the velocyto (v0.17.17, python package) to estimate the RNA velocity of single cells by distinguishing spliced and un-spliced mRNAs (La Manno et al., 2018). We first generated the individual loom file based on the output file of Cell Ranger for each patient sample and then merged all loom files together. Then we fed the merged loom files and the UMAP coordinates of single cells generated by Seurat to velocyto and followed its analysis steps to finally project the RNA velocity vectors onto low-dimension embeddings.
T cell receptor data analysis
Raw T cell receptor (TCR) sequencing data were processed by using 10X Genomics Cell Ranger (v3.1.0). Briefly, FASTQ reads were aligned to human GRCh38 V(D)J reference genome (v3.1.0, from 10X Genomics) by using the “cellranger vdj” function, resulting in the assembly of V(D)J sequences and clonotypes (Yost et al., 2019). On average, 5,988 read pairs were detected per cell in each patient sample. 95.36% (and 98.61%, respectively) of CD3+ cells were associated with at least one productive TRA (TRB, respectively) rearrangement. The filtered contig annotations, which contained high-level annotations of each high-confident cellular contig, were further filtered by removing the records with ‘raw_consensus_id’ as ‘none’. Of all detected clonotypes, 81.22% contained one TRA and one TRB sequences, and 10.23% contained two TRA and one TRB sequences. Only 1.78% of clonotypes contained one TRA and two TRB sequences and only 1.47% of clonotypes had two TRA and two TRB sequences on average. In total, 91.23% of all CD3+ T cells could be assigned an αβ TCR sequence. Within the CD4+ and CD8+ datasets, TCR sequences could be detected in 98.88% and 91.04% of cells, respectively. The CD3+ and CD8+ datasets contain additional cells lacking αβ TCRs, such as CD4-CD8- and CD8+ γδ T cells, respectively, which account for the lower % of cells.
Raw γδ TCR sequencing data were processed using 10X Genomics Cell Ranger VDJ (v3.0.0) aligned to the GRCh38 V(D)J reference genome (v3.1.0, from 10X Genomics). Prevalence of TRDV gene usage was determined among bona fide γδ T cells containing both productive TRG and TRD rearrangements, as many αβ T cells also productively rearrange the TRG loci as previously reported and evident in our data (Sherwood et al., 2011).
Cluster relationships of clonally expanded T cells
On average, we could detect 1,967 unique αβ TCR clonotypes in each patient (ranging from 1,247 to 2,678 among all patient samples). For the total 43,262 unique clonotypes detected in all patient samples, clonotype size ranged from 1 to 446 cells and 12.29% of clonotypes were expanded. An expanded clonotype was defined as a clonotype that could be detected in at least two cells. In the CD4+ or CD8+ T cell subsets, we further separated TCR clonotypes into the three corresponding patient groups (+CPI colitis, +CPI no colitis, control). A shared clonotype was defined as a TCR that could be detected in at least one cell in two different clusters. In the CD4+ T cell subset, we identified 148, 93 and 62 shared clonotypes between any two clusters in control, +CPI no-colitis and +CPI colitis groups, respectively. In the CD8+ T cell subset, we identified 245, 148 and 867 shared clonotypes in control, +CPI no colitis and +CPI colitis groups, respectively. In order to statistically test the cluster relationships in terms of clonal expansion for all shared clonotypes, we counted the number of shared clonotypes among different clusters, and then applied the one-sided Fisher’s exact test (followed with Benjamini-Hochberg multiple test correction) on 2×2 cluster-by-cluster contingency tables to evaluate the significance of clone sharing between clusters. Finally, Cytoscape was used to visualize clonotype sharing between different clusters, with the nodes representing the clusters and the lines reflecting the number of shared clonotypes as well as the statistical significance of clonotype sharing between two clusters (Shannon et al., 2003).
Calculation of gene set activity score
In order to evaluate whether a hallmark gene set or another related gene set was enriched among the top ranking expressed genes in each cell, we calculated a gene set activity score for each gene set by applying an area under the curve method named AUCell (v1.7.2, R package) (Aibar et al., 2017). For query gene set, we built the area under the recovery (AUC) curve based on the ranking of the top 1,500 genes in each single cell; the x axis is the ranking of expressed genes from high to low based on their expression values, and the y axis is the number of genes recovered from the query gene set. The gene set activity score is measured as the proportion of expressed genes in the query gene set and their relative expression levels compared to the other genes in each cell. NLRP3 inflammasome related gene sets used in the analyses included “GO_POSITIVE_REGULATION_OF_NLRP3_INFLAMMASOME_COMPLEX_ASSEMBLY” (TLR6, GBP5, USP50, DHX33, TLR4, ATAT1, and CD36) from MSigDB GO gene sets (Liberzon et al., 2015) and a custom gene set “NLRP3 inflammasome core pathway” (IL1B, NLRP3, PYCARD, CASP1, GSDMD and IL18).
Evaluation of co-activation potentiality
Guilt-by-association analysis was applied to evaluate the co-activation probability of IL1B gene expression and NLRP3 inflammasome core pathway activity in singe cells (Walker et al., 1999). Specifically, for all myeloid cells from each patient group, the expression values of IL1B gene and activity scores of NLRP3 inflammasome core pathway were first z-score-normalized across all cells, respectively. Then a binary vector was constructed for each of the normalized vectors with the following strategy: the binary value was set to 1 if the corresponding z-scored value > 0, otherwise the binary value was 0. Finally, the P value for observing co-activation of IL1B gene expression and NLRP3 inflammasome core pathway activity were determined by one-sided Fisher’s exact test based on a 2 × 2 contingency table generated from the binary vectors.
Ligand-receptor expression and cell interactions
We examined the interaction of different cell types based on the expression level of ligand-receptor pairs in the CD45+ dataset. The specific ligand-receptor pairs were analyzed separately for chemokines (CCL17-CCR4, CCL22-CCR4, CCL3-CCR5, CCL4-CCR5, CCL5-CCR5, CCL20-CCR6, CCL19-CCR7, CCL21-CCR7, CXCL9-CXCR3, CXCL10-CXCR3, CXCL11-CXCR3, CXCL12-CXCR4, CXCL13-CXCR5, CXCL16-CXCR6, XCL1-XCR1, XCL2-XCR1) and cytokines (AREG-EGFR, CSF2-CSF2RA, IFNG-IFNGR1, IL10-IL10RA/B, IL12-IL12RA, IL12A-IL12RB1, IL15-IL15RA, IL17A-IL17RA, IL17F-IL17RA, IL18-IL18R, IL1B-IL1R1, IL2-IL2RA/B/G, IL21-IL21R, IL22-IL22RA1, IL23-IL23R, IL6-IL6R, IL7-IL7R, LTB-LTBR, TNF-TNFRSF1A, TGFB1-TGFBR1/2). To test whether the sender cell cluster is significantly communicated with the receiver cell cluster from the expression level of their ligand and receptor genes, we first averaged the normalized expression value of each ligand gene in cluster i as EL,i and receptor gene in cluster j as ER,j, and then inferred that cluster i could interact with cluster j if the EL,i >1 and ER,j >1. The circlize (v0.4.8, R package) was used to visualize the interaction of different clusters (Gu et al., 2014). As a more quantitative metric, we defined the ligand-receptor score as SL,R = EL,i * ER,j with EL,i >1 and ER,j >1 and applied a permutation test to evaluate whether the inferred cluster interaction was statistically significant (Martin et al., 2019). Briefly, we first shuffled the cluster identity of each cell randomly for 10,000 times with the size of each cluster consistent with the truth, and then calculated the ligand-receptor scores again based on permutated data. Finally, a permutation P value was evaluated as the number of times that Srandom > Strue divided by 10,000.
Supplementary Material
Figure S1. Overview of CD45+ immune cell populations in colitis and control patients, Related to Figure 1
A) Gating strategy used for flow-sorting of CD45+ mononuclear cells (MNC) and CD3+ T cells. CD3+ sort gate encompassed CD3-low cells that can represent recently activated T cells with downregulated TCR-CD3 complex. Granulocytes are present in colitis lesions but CD66b+ neutrophils were removed by FACS because their high RNase content interferes with the 10X Genomics scRNA-seq platform (Geukes Foppen et al., 2018; Martin et al., 2019; Smillie et al., 2019).
B) Quality metrics for CD45+ MNC dataset. Average of patients within each group with error bars (standard error of the mean).
C) Heatmap showing differentially expressed genes across clusters in the CD45+ scRNA-seq dataset (Figure 1C). The top 10 genes differentially expressed in each cluster determined by ranked averaged log (fold change) are shown. Few non-immunoglobulin variable genes were significant for plasma B cells.
D) CD45+ cells clustered and colored according to cell identify as in Figure 1C and split by patient group. Top, aggregated data from patients for each indicated group. Bottom, data from three +CPI colitis patients who received different CPI treatment regimens, including monotherapy with ipilimumab (ipi, patient C2).
E) Gating strategy used for flow cytometry analysis of CD3+ T cells in Figure 1H and as a starting gate for subsequent T cell analyses.
F) CD3+ T cell count per mg of biopsy tissue (n=7–9 subjects per group, see Table S5 for details on analyzed cases). Statistical analysis by Kruskal Wallis test corrected for multiple comparisons (* p<0.05). Accuracy of tissue weight measurements was likely affected by incomplete removal of collection media; complete removal of media and tissue dehydration could compromise scRNA-seq data quality.
Figure S2. Colitis-related T cell clusters in CD3+ scRNA-seq dataset, Related to Figure 2
A) Identification of major cell clusters of CD3+ T cells from colon biopsies, shown as UMAP of cells grouped by the Louvain clustering algorithm. CD45+ cells were analyzed from 16 subjects but CD3+ cells from 22 subjects because preliminary data analysis identified a major change in the T cell compartment in colitis compared to control cases.
B) Feature plots showing normalized expression of CD4 and CD8A.
C) Expression of most highly cluster-associated genes (2 per cluster), representing the highest-scoring differentially expressed genes calculated from cell-type specificity score (see STAR Methods). Y-axis represents the normalized gene expression value. See Table S6 for all marker genes.
D) Quantification of cell cluster frequency between patient groups. For each cluster, the average fraction of cells from each patient group is shown, after normalization for total input cell numbers per patient (see STAR Methods). Average and S.E.M. shown. Statistical analysis compares healthy control and CPI-colitis patients as a two-sided Wilcoxon test (* p<0.05, **p<0.01, ***p<0.001).
E) Distribution of CD3+ T cells across clusters in the three patient groups.
F) Cell cluster frequency shown as a fraction of total cells for each patient.
G) Representation of cells from individual patients within each cluster based on normalized cell numbers per patient (see STAR Methods), demonstrating that all clusters contained cells from multiple patients and thus were not related to patient-specific batch effects.
H) Effect of enzymatic digestion on CD8α surface expression as shown by flow cytometry analysis of PBMCs (sample unrelated to study). PBMCs were incubated with and without tissue digestion enzyme mixture as performed for dissociation of colon biopsies.
I–J) Gating strategy for enumeration of CD8+ αβ T cells, and statistical analysis for all patients shown by one-way ANOVA test.
K) Quantification of γδ T cell frequency (% of CD3+ cells pre-gated as in Figure S1E) by flow cytometry, including gating of representative sample. Statistical analysis for all patients (n=7–10 subjects per group, see Table S5 for details on analyzed cases) shown by Brown-Forsyth and Welch ANOVA test (* p<0.05).
L) Quantification of MAIT cell frequencies (% of γδTCR− CD4− cells pre-gated as in Figure S2I) by flow cytometry. Statistical analysis for all patients (n=7–10 subjects per group, see Table S5 for details on analyzed cases) shown by Brown-Forsyth and Welch ANOVA test (* p<0.05).
Figure S3. Characterization of colitis-associated changes in CD8 T cell populations, Related to Figure 2
A) Representation of cells from individual patients within each CD8 T cell cluster, based on normalized cell numbers per patient (see STAR Methods), demonstrating that all clusters contained cells from multiple patients and therefore were not related to patient-specific batch effects.
B) Heatmap showing differentially expressed genes across CD8 T cell sub-clusters. The top 10 cluster-associated genes are shown, determined and ranked by averaged log fold change compared to all other clusters.
C) Top differentially expressed genes for colitis-associated CD8 T cell clusters (5–8) compared to all other clusters (1–4). Normalized gene expression shown as a feature plots containing cells combined from all patients.
D) Normalized IFNG expression shown as feature plots for each patient cohort (combined cells from all patients within each group).
E) Analysis of T cell populations from a +CPI colitis patient who received α-CTLA-4 monotherapy (α-Ki-67 and α-CD103 antibodies were not included in this earlier version of the antibody panel).
Figure S4. Characterization of colitis-associated changes in CD4 T cell populations, Related to Figure 3
A) Heatmap showing differentially expressed genes across CD4 T cell sub-clusters. The top 10 cluster-associated genes are shown, determined and ranked by averaged log fold change.
B) Cell cluster frequency shown as a fraction of total cells for each patient.
C) Top differentially expressed genes in colitis-associated clusters (9–10) compared to all other clusters (1–8). Normalized gene expression shown as feature plots displaying cells combined from all patients.
D) Normalized IFNG expression shown as feature plots for each patient cohort (combined cells from all patients within each group).
E) Analysis of Tregs in +CPI colitis patient C2 who received α-CTLA-4 monotherapy. Quantification of FoxP3+ T cells (left) and Treg frequency (% CD4+ T cells) in patient C2 (red) compared to other +CPI colitis patients (right).
F) Quantification of Treg cell numbers per mg of biopsy tissue (n=7–9 subjects per group, see Table S5 for details on analyzed cases). Statistical analysis by Kruskal Wallis test corrected for multiple comparisons (**p<0.01). Accuracy of tissue weight measurements was likely affected by incomplete removal of collection media.
G) FOXP3 normalized gene expression shown for single cells in Treg sub-clusters from Figure 3L.
H) Quantification of Treg cell cluster frequency between patient groups. For each cluster, the average fraction of cells from each patient group is shown, after normalization for total input cell numbers per patient (see STAR Methods). Average and S.E.M. shown for the patient groups. Statistical analysis compares control and +CPI colitis patients as a two-sided Wilcoxon test (* p<0.05, **p<0.01, ***p<0.001).
I) Representation of Treg cells from individual patients within each Treg sub-cluster based on normalized cell numbers per patien (see STAR Methods), demonstrating that all clusters contained cells from multiple patients.
Figure S5. TCR clonality analysis for CD8 and CD4 T cells, Related to 4
A) Absolute numbers of TCRs detected among total CD8 and CD4 T cells grouped by cluster (refer to Figure 2A and Figure 3A). Cells with an associated αβ TCR detected are colored as indicated; CD8 cluster 1 (Trm IEL) contained γδ T cells and therefore had fewer T cells with αβ TCRs.
B) Overall clonality analysis for CD4 and CD8 T cell lineages in each patient group. Bars represent the average number of TCR clonotypes among patients for the indicated groups (error bars are S.E.M). Left, the average number of total TCR clonotypes detected in indicated groups. Middle, the average number of expanded TCR clonotypes (detected ≥2 times). Right, the % of expanded clonotypes of total clonotypes as calculated from the left and middle plots. Statistical analysis by two-sided Wilcoxon test.
C) Total number of expanded CD8 TCR clonotypes in each cluster is shown for each patient (mean shown as a line). The sum of expanded TCR clonotypes for each cluster represents the height of bars shown Figure 4A for control and colitis patients. Statistical analysis by two-way ANOVA test (** p<0.01, ****p<0.0001).
D) Sharing of expanded TCR clonotypes across CD4 T cell clusters. For each patient and cluster, the number of expanded TCR clonotypes from the CD4 T cell dataset was calculated and summed together for the indicated patient groups. Expanded clonotypes shared with a colitis-associated cluster (9–10) are colored red, those shared with other clusters (1–8) are colored blue.
E) Sharing of expanded TCR clonotypes across all possible combinations of CD4 T cell clusters. Data were aggregated for each of the indicated patient groups. Numbers indicate the number of shared expanded TCR clonotypes for each cluster pair. Bold boxes indicate statistically significant sharing of expanded clonotypes between clusters (adjusted p<0.05, one-sided Fisher’s exact test followed with Benjamini-Hochberg correction).
F) Method for sequencing of γδ TCR chains from 5’ scRNA-seq libraries. TRGC and TRDC primer binding sites of nested primers are shown.
G) Quantification of top γδ TCR clonotypes. For each patient, the percentage of cells expressing the top γδ TCR clonotype out of total γδTCR+ cells is shown.
H) Quantification of γδ TCR V gene (TRDV) usage. For each patient, the % of TCRs using each TRDV gene was calculated. Statistical analysis by two-way ANOVA test with Tukey’s multiple comparisons test.
Figure S6. Colitis-associated changes in T cell gene expression programs, Related to Figure 5.
A) Representative plots showing CTLA-4 protein expression on CD8 T cells by flow cytometry. Cells were pre-gated based on a CD4− αβTCR+ non-MAIT (Vα7.2+ CD161+) phenotype among live CD45+ CD3+ cells.
B) Quantification of CTLA-4+ CD8+ T cells (left) and CTLA-4+ granzyme B+ CD8+ T cells for the indicated patient groups (n=6–10 subjects per group, see Table S5 for details on analyzed cases). Statistical analysis by Kruskal-Wallis test (* p<0.05, **p<0.01).
C) Quantification of CTLA-4+ FoxP3− effector CD4+ T cells (n=6–10 subjects per group, see Table S5 for details on analyzed cases). Gating as in Figure 3I.
D) Normalized expression of CTLA4 and PDCD1 genes among CD8 T cells, split by patient cohorts (combined patients within each group).
E) Normalized expression of CTLA4 and PDCD1 genes among CD4 T cells, split by patient cohorts (combined patients within each group).
F) Analysis of Hallmark gene sets enriched in colitis-associated clusters, shown for both CD8 and CD4 datasets. For the CD8 analysis, clusters 5–8 were compared to clusters 1–4; for the CD4 analysis, clusters 9–10 were compared to clusters 1–8. NES= normalized enrichment score.
Figure S7. Expression of chemokine, cytokine and integrin genes in relationship to colitis, Related to Figure 7.
A) Averaged Log (fold change) of indicated chemokine receptor/ligands, compared between +CPI colitis and healthy control subjects from CD45+ dataset
B) Normalized gene expression for molecules involved in T cell migration and tissue residency, shown for CD4 and CD8 T cell datasets.
C) Averaged Log (fold change) for indicated cytokine receptor and ligand genes, compared between +CPI colitis and healthy control groups. Expression is shown for either T cell clusters (#11–16) or myeloid cluster (#5) from CD45+ dataset.
D) Normalized expression of indicated cytokines genes in myeloid cells (Figure 6D) split by patient cohorts (combined patients within each group).
E) Activity score for positive regulation of NLRP3 inflammasome expression shown for myeloid sub-clusters (Figure 6E). Two-sided Wilcoxon-test p-value for increased activity score expression in cluster 1 is shown.
F) Activity score for NLRP3 inflammasome core pathway shown for myeloid sub-clusters. Two-sided Wilcoxon-test p-value for increased activity score expression in clusters 1 and 2.
G) Left, blended feature plots of IL1B gene expression and NLRP3 inflammasome core pathway activity score shown for single cells displayed as a UMAP projection. Right, statistical significance for co-activation of IL1B and NLRP3 inflammasome core pathway activity score calculated using Guilt-By-Association, shown for all myeloid cells in the indicated patient groups.
Table S5. Summary of analyses performed for individual patients, Related to Figures 1–7. List includes scRNA-seq and flow cytometry analyses that were performed for each patient.
Table S6. Marker genes for cell subsets, Related to Figures 1,2,3,6 and S2. Differentially expressed genes in cell clusters from combined patients for the indicated datasets (CD45 clusters, CD3+ clusters, CD8+ clusters, CD4+ clusters and Treg clusters).
Table S7. Differentially expressed genes in colitis-associated clusters, Related to Figures 5 and 6. For analysis of CD8+ T cells, colitis-associated clusters 5–8 were compared to clusters 1–4. For analysis of CD4+ T cells, colitis-associated clusters 9–10 were compared to clusters 1–8. For analysis of myeloid cells, genes from cluster 5 (from CD45+ dataset) were compared between patient groups (+CPI colitis vs control, +CPI colitis vs +CPI no colitis). See STAR Methods for details.
Mechanisms of inflammatory adverse events induced by checkpoint blockade
Colitis-associated differentiation of cytotoxic effector from Trm T cells
Persistence and expansion of CTLA-4+ Treg cells
Inflammatory pathways provide opportunities for therapeutic intervention
Acknowledgements
This work was supported by a Team Award from the American Cancer Society MRAT-18-113-01 and the Melanoma Research Alliance 597698 (to K.W.W., S.K.D., M.D., G.-C.Y., R.J.S.), NIH grants R01 CA238039 (to K.W.W.) and T32CA207021 (to A.M.L. and K.W.W.), a National Institutes of Health Mentored Clinical Scientist Development Award 1K08DK114563–01 (M.D.) and the American Gastroenterological Association Research Scholars Award (M.D.).
We would like to thank all of the patients who participated in this study, and the nursing and surgical technicians from the MGH endoscopy unit who provided care for the patients and made safe biopsy collections feasible. We would further like to thank Md Aladdin Bhuiyan, Elisa Bello, Patrick Lenehan, and Max Heckler for providing specific technical assistance and Ruben Dries for helpful discussions. We thank Susannah Phillips, J. Harrison Carmichael, and Dennie Frederick for help with clinical sample collection. We thank the Center for Cancer Genome Discovery (DFCI) for sequencing of scRNA-seq libraries.
Footnotes
Publisher's Disclaimer: This is a PDF file of an unedited manuscript that has been accepted for publication. As a service to our customers we are providing this early version of the manuscript. The manuscript will undergo copyediting, typesetting, and review of the resulting proof before it is published in its final form. Please note that during the production process errors may be discovered which could affect the content, and all legal disclaimers that apply to the journal pertain.
Declaration of Interests: K.W.W. serves on the scientific advisory board of TCR2 Therapeutics, T-Scan Therapeutics and Nextechinvest and receives sponsored research funding from and Novartis. He is a scientific co-founder of Immunitas Therapeutics. M.D. receives research funding from Novartis, and is on the Scientific Advisory Board for Neoleukin Therapeutics. S.K.D. receives research funding from Novartis, Bristol-Myers Squibb, and Eli Lilly. F.S.H. receives research funding from Bristol-Myers Squibb and Novartis; he also consults for Merck, EMD Serono, Novartis, Takeda, Genentech/Roche, Compass Therapeutics, Apricity, Aduro, Sanofi, Pionyr, 7 Hills Pharma, Verastem, Torque, Rheos Kairos, Psioxus Therapeutics, Amgen and Pieris Pharmaceutical. O.R. receives research support from Merck and is a speaker for activities supported by educational grants from BMS and Merck. He is a consultant for Merck, Celgene, Five Prime, GSK, GFK, Bayer, Roche/Genentech, Puretech, Imvax, and Sobi. In addition, he has patent “Methods of using pembrolizumab and trebananib” pending. J.A.N. has a provisional patent application for spatial quantification of immune cell infiltration in the tumor microenvironment. R.J.S. has received research funding from Merck and Amgen.
References
- Abu-Sbeih H, Ali FS, Alsaadi D, Jennings J, Luo W, Gong Z, Richards DM, Charabaty A, and Wang Y (2018). Outcomes of vedolizumab therapy in patients with immune checkpoint inhibitor-induced colitis: a multi-center study. J Immunother Cancer 6, 142. [DOI] [PMC free article] [PubMed] [Google Scholar]
- Aibar S, Gonzalez-Blas CB, Moerman T, Huynh-Thu VA, Imrichova H, Hulselmans G, Rambow F, Marine JC, Geurts P, Aerts J, et al. (2017). SCENIC: single-cell regulatory network inference and clustering. Nat Methods 14, 1083–1086. [DOI] [PMC free article] [PubMed] [Google Scholar]
- Aran D, Looney AP, Liu L, Wu E, Fong V, Hsu A, Chak S, Naikawadi RP, Wolters PJ, Abate AR, et al. (2019). Reference-based analysis of lung single-cell sequencing reveals a transitional profibrotic macrophage. Nat Immunol 20, 163–172. [DOI] [PMC free article] [PubMed] [Google Scholar]
- Arbour KC, Mezquita L, Long N, Rizvi H, Auclin E, Ni A, Martinez-Bernal G, Ferrara R, Lai WV, Hendriks LEL, et al. (2018). Impact of Baseline Steroids on Efficacy of Programmed Cell Death-1 and Programmed Death-Ligand 1 Blockade in Patients With Non-Small-Cell Lung Cancer. J Clin Oncol 36, 2872–2878. [DOI] [PubMed] [Google Scholar]
- Badran YR, Cohen JV, Brastianos PK, Parikh AR, Hong TS, and Dougan M (2019). Concurrent therapy with immune checkpoint inhibitors and TNFalpha blockade in patients with gastrointestinal immune-related adverse events. J Immunother Cancer 7, 226. [DOI] [PMC free article] [PubMed] [Google Scholar]
- Becht E, McInnes L, Healy J, Dutertre CA, Kwok IWH, Ng LG, Ginhoux F, and Newell EW (2018). Dimensionality reduction for visualizing single-cell data using UMAP. Nature biotechnology. [DOI] [PubMed] [Google Scholar]
- Blondel VD, Guillaume J-L, L. R, and Lefebvre E (2008). Fast unfolding of communities in large networks. J Stat Mech, P10008. [Google Scholar]
- Cepek KL, Shaw SK, Parker CM, Russell GJ, Morrow JS, Rimm DL, and Brenner MB (1994). Adhesion between epithelial cells and T lymphocytes mediated by E-cadherin and the alpha E beta 7 integrin. Nature 372, 190–193. [DOI] [PubMed] [Google Scholar]
- Coutzac C, Adam J, Soularue E, Collins M, Racine A, Mussini C, Boselli L, Kamsukom N, Mateus C, Charrier M, et al. (2017). Colon Immune-Related Adverse Events: Anti-CTLA-4 and Anti-PD-1 Blockade Induce Distinct Immunopathological Entities. J Crohns Colitis 11, 1238–1246. [DOI] [PubMed] [Google Scholar]
- Curran MA, Montalvo W, Yagita H, and Allison JP (2010). PD-1 and CTLA-4 combination blockade expands infiltrating T cells and reduces regulatory T and myeloid cells within B16 melanoma tumors. Proc Natl Acad Sci U S A 107, 4275–4280. [DOI] [PMC free article] [PubMed] [Google Scholar]
- Dougan M (2017). Checkpoint Blockade Toxicity and Immune Homeostasis in the Gastrointestinal Tract. Front Immunol 8, 1547. [DOI] [PMC free article] [PubMed] [Google Scholar]
- Dougan M, and Pietropaolo M (2020). Time to dissect the autoimmune etiology of cancer antibody immunotherapy. J Clin Invest 130, 51–61. [DOI] [PMC free article] [PubMed] [Google Scholar]
- Downey SG, Klapper JA, Smith FO, Yang JC, Sherry RM, Royal RE, Kammula US, Hughes MS, Allen TE, Levy CL, et al. (2007). Prognostic factors related to clinical response in patients with metastatic melanoma treated by CTL-associated antigen-4 blockade. Clin Cancer Res 13, 6681–6688. [DOI] [PMC free article] [PubMed] [Google Scholar]
- Faje AT, Lawrence D, Flaherty K, Freedman C, Fadden R, Rubin K, Cohen J, and Sullivan RJ (2018). High-dose glucocorticoids for the treatment of ipilimumab-induced hypophysitis is associated with reduced survival in patients with melanoma. Cancer 124, 3706–3714. [DOI] [PubMed] [Google Scholar]
- Foulds KE, Zenewicz LA, Shedlock DJ, Jiang J, Troy AE, and Shen H (2002). Cutting edge: CD4 and CD8 T cells are intrinsically different in their proliferative responses. J Immunol 168, 1528–1532. [DOI] [PubMed] [Google Scholar]
- Geukes Foppen MH, Rozeman EA, van Wilpe S, Postma C, Snaebjornsson P, van Thienen JV, van Leerdam ME, van den Heuvel M, Blank CU, van Dieren J, et al. (2018). Immune checkpoint inhibition-related colitis: symptoms, endoscopic features, histology and response to management. ESMO Open 3, e000278. [DOI] [PMC free article] [PubMed] [Google Scholar]
- Groom JR, and Luster AD (2011). CXCR3 ligands: redundant, collaborative and antagonistic functions. Immunol Cell Biol 89, 207–215. [DOI] [PMC free article] [PubMed] [Google Scholar]
- Grover S, and Srivastava A (2019). Lymphocytic colitis-like pattern of mucosal injury and the challenges in diagnosing cancer immunotherapy-related toxicity. Cancer 125, 1768–1770. [DOI] [PubMed] [Google Scholar]
- Gu Z, Gu L, Eils R, Schlesner M, and Brors B (2014). circlize Implements and enhances circular visualization in R. Bioinformatics 30, 2811–2812. [DOI] [PubMed] [Google Scholar]
- Herold MJ, McPherson KG, and Reichardt HM (2006). Glucocorticoids in T cell apoptosis and function. Cell Mol Life Sci 63, 60–72. [DOI] [PMC free article] [PubMed] [Google Scholar]
- Hodi FS, O’Day SJ, McDermott DF, Weber RW, Sosman JA, Haanen JB, Gonzalez R, Robert C, Schadendorf D, Hassel JC, et al. (2010). Improved survival with ipilimumab in patients with metastatic melanoma. N Engl J Med 363, 711–723. [DOI] [PMC free article] [PubMed] [Google Scholar]
- Huang B, Chen Z, Geng L, Wang J, Liang H, Cao Y, Chen H, Huang W, Su M, Wang H, et al. (2019). Mucosal Profiling of Pediatric-Onset Colitis and IBD Reveals Common Pathogenics and Therapeutic Pathways. Cell 179, 1160–1176 e1124. [DOI] [PubMed] [Google Scholar]
- Hughes MS, Molina GE, Chen ST, Zheng H, Deshpande V, Fadden R, Sullivan RJ, and Dougan M (2019). Budesonide treatment for microscopic colitis from immune checkpoint inhibitors. J Immunother Cancer 7, 292. [DOI] [PMC free article] [PubMed] [Google Scholar]
- Ilicic T, Kim JK, Kolodziejczyk AA, Bagger FO, McCarthy DJ, Marioni JC, and Teichmann SA (2016). Classification of low quality cells from single-cell RNA-seq data. Genome Biol 17, 29. [DOI] [PMC free article] [PubMed] [Google Scholar]
- Johnson DB, Balko JM, Compton ML, Chalkias S, Gorham J, Xu Y, Hicks M, Puzanov I, Alexander MR, Bloomer TL, et al. (2016). Fulminant Myocarditis with Combination Immune Checkpoint Blockade. N Engl J Med 375, 1749–1755. [DOI] [PMC free article] [PubMed] [Google Scholar]
- Joosse ME, Nederlof I, Walker LSK, and Samsom JN (2019). Tipping the balance: inhibitory checkpoints in intestinal homeostasis. Mucosal Immunol 12, 21–35. [DOI] [PubMed] [Google Scholar]
- Koch MA, Tucker-Heard G, Perdue NR, Killebrew JR, Urdahl KB, and Campbell DJ (2009). The transcription factor T-bet controls regulatory T cell homeostasis and function during type 1 inflammation. Nat Immunol 10, 595–602. [DOI] [PMC free article] [PubMed] [Google Scholar]
- Korotkevich G, Sukhov V, and Sergushichev A (2019). Fast gene set enrichment analysis. bioRxiv, 10.1101/060012. [DOI] [Google Scholar]
- Kuehn HS, Ouyang W, Lo B, Deenick EK, Niemela JE, Avery DT, Schickel JN, Tran DQ, Stoddard J, Zhang Y, et al. (2014). Immune dysregulation in human subjects with heterozygous germline mutations in CTLA4. Science 345, 1623–1627. [DOI] [PMC free article] [PubMed] [Google Scholar]
- Kumar BV, Ma W, Miron M, Granot T, Guyer RS, Carpenter DJ, Senda T, Sun X, Ho SH, Lerner H, et al. (2017). Human Tissue-Resident Memory T Cells Are Defined by Core Transcriptional and Functional Signatures in Lymphoid and Mucosal Sites. Cell Rep 20, 2921–2934. [DOI] [PMC free article] [PubMed] [Google Scholar]
- La Manno G, Soldatov R, Zeisel A, Braun E, Hochgerner H, Petukhov V, Lidschreiber K, Kastriti ME, Lonnerberg P, Furlan A, et al. (2018). RNA velocity of single cells. Nature 560, 494–498. [DOI] [PMC free article] [PubMed] [Google Scholar]
- Langer V, Vivi E, Regensburger D, Winkler TH, Waldner MJ, Rath T, Schmid B, Skottke L, Lee S, Jeon NL, et al. (2019). IFN-gamma drives inflammatory bowel disease pathogenesis through VE-cadherin-directed vascular barrier disruption. J Clin Invest 129, 4691–4707. [DOI] [PMC free article] [PubMed] [Google Scholar]
- Larkin J, Chiarion-Sileni V, Gonzalez R, Grob JJ, Cowey CL, Lao CD, Schadendorf D, Dummer R, Smylie M, Rutkowski P, et al. (2015). Combined Nivolumab and Ipilimumab or Monotherapy in Untreated Melanoma. N Engl J Med 373, 23–34. [DOI] [PMC free article] [PubMed] [Google Scholar]
- Liberzon A, Birger C, Thorvaldsdottir H, Ghandi M, Mesirov JP, and Tamayo P (2015). The Molecular Signatures Database (MSigDB) hallmark gene set collection. Cell Syst 1, 417–425. [DOI] [PMC free article] [PubMed] [Google Scholar]
- Lord JD, Hackman RC, Moklebust A, Thompson JA, Higano CS, Chielens D, Steinbach G, and McDonald GB (2010). Refractory colitis following anti-CTLA4 antibody therapy: analysis of mucosal FOXP3+ T cells. Dig Dis Sci 55, 1396–1405. [DOI] [PMC free article] [PubMed] [Google Scholar]
- Maloy KJ, and Powrie F (2011). Intestinal homeostasis and its breakdown in inflammatory bowel disease. Nature 474, 298–306. [DOI] [PubMed] [Google Scholar]
- Martin JC, Chang C, Boschetti G, Ungaro R, Giri M, Grout JA, Gettler K, Chuang LS, Nayar S, Greenstein AJ, et al. (2019). Single-Cell Analysis of Crohn’s Disease Lesions Identifies a Pathogenic Cellular Module Associated with Resistance to Anti-TNF Therapy. Cell 178, 1493–1508 e1420. [DOI] [PMC free article] [PubMed] [Google Scholar]
- Masopust D, and Soerens AG (2019). Tissue-Resident T Cells and Other Resident Leukocytes. Annu Rev Immunol 37, 521–546. [DOI] [PMC free article] [PubMed] [Google Scholar]
- McGinnis CS, Murrow LM, and Gartner ZJ (2019). DoubletFinder: Doublet Detection in Single-Cell RNA Sequencing Data Using Artificial Nearest Neighbors. Cell Syst 8, 329–337 e324. [DOI] [PMC free article] [PubMed] [Google Scholar]
- McInnes L, Healy J, and Melville J (2018). UMAP: Uniform Manifold Approximation and Projection for Dimension Reduction. In arXiv e-prints, pp. arXiv:1802.03426. [Google Scholar]
- McLane LM, Abdel-Hakeem MS, and Wherry EJ (2019). CD8 T Cell Exhaustion During Chronic Viral Infection and Cancer. Annu Rev Immunol 37, 457–495. [DOI] [PubMed] [Google Scholar]
- Miyara M, Yoshioka Y, Kitoh A, Shima T, Wing K, Niwa A, Parizot C, Taflin C, Heike T, Valeyre D, et al. (2009). Functional delineation and differentiation dynamics of human CD4+ T cells expressing the FoxP3 transcription factor. Immunity 30, 899–911. [DOI] [PubMed] [Google Scholar]
- Neurath MF (2014). Cytokines in inflammatory bowel disease. Nat Rev Immunol 14, 329–342. [DOI] [PubMed] [Google Scholar]
- Neurath MF (2019). Targeting immune cell circuits and trafficking in inflammatory bowel disease. Nat Immunol 20, 970–979. [DOI] [PubMed] [Google Scholar]
- Pijuan-Sala B, Griffiths JA, Guibentif C, Hiscock TW, Jawaid W, Calero-Nieto FJ, Mulas C, Ibarra-Soria X, Tyser RCV, Ho DLL, et al. (2019). A single-cell molecular map of mouse gastrulation and early organogenesis. Nature 566, 490–495. [DOI] [PMC free article] [PubMed] [Google Scholar]
- Postow MA, Chesney J, Pavlick AC, Robert C, Grossmann K, McDermott D, Linette GP, Meyer N, Giguere JK, Agarwala SS, et al. (2015). Nivolumab and ipilimumab versus ipilimumab in untreated melanoma. N Engl J Med 372, 2006–2017. [DOI] [PMC free article] [PubMed] [Google Scholar]
- Postow MA, Sidlow R, and Hellmann MD (2018). Immune-Related Adverse Events Associated with Immune Checkpoint Blockade. N Engl J Med 378, 158–168. [DOI] [PubMed] [Google Scholar]
- Ridker PM, MacFadyen JG, Thuren T, Everett BM, Libby P, Glynn RJ, and Group CT (2017). Effect of interleukin-1beta inhibition with canakinumab on incident lung cancer in patients with atherosclerosis: exploratory results from a randomised, double-blind, placebo-controlled trial. Lancet 390, 1833–1842. [DOI] [PubMed] [Google Scholar]
- Shannon P, Markiel A, Ozier O, Baliga NS, Wang JT, Ramage D, Amin N, Schwikowski B, and Ideker T (2003). Cytoscape: a software environment for integrated models of biomolecular interaction networks. Genome Res 13, 2498–2504. [DOI] [PMC free article] [PubMed] [Google Scholar]
- Sharma A, Subudhi SK, Blando J, Scutti J, Vence L, Wargo J, Allison JP, Ribas A, and Sharma P (2019). Anti-CTLA-4 Immunotherapy Does Not Deplete FOXP3(+) Regulatory T Cells (Tregs) in Human Cancers. Clin Cancer Res 25, 1233–1238. [DOI] [PMC free article] [PubMed] [Google Scholar]
- Sherwood AM, Desmarais C, Livingston RJ, Andriesen J, Haussler M, Carlson CS, and Robins H (2011). Deep sequencing of the human TCRgamma and TCRbeta repertoires suggests that TCRbeta rearranges after alphabeta and gammadelta T cell commitment. Sci Transl Med 3, 90ra61. [DOI] [PMC free article] [PubMed] [Google Scholar]
- Simpson TR, Li F, Montalvo-Ortiz W, Sepulveda MA, Bergerhoff K, Arce F, Roddie C, Henry JY, Yagita H, Wolchok JD, et al. (2013). Fc-dependent depletion of tumor-infiltrating regulatory T cells co-defines the efficacy of anti-CTLA-4 therapy against melanoma. J Exp Med 210, 1695–1710. [DOI] [PMC free article] [PubMed] [Google Scholar]
- Smillie CS, Biton M, Ordovas-Montanes J, Sullivan KM, Burgin G, Graham DB, Herbst RH, Rogel N, Slyper M, Waldman J, et al. (2019). Intra- and Inter-cellular Rewiring of the Human Colon during Ulcerative Colitis. Cell 178, 714–730 e722. [DOI] [PMC free article] [PubMed] [Google Scholar]
- Solomon BL, and Garrido-Laguna I (2018). TIGIT: a novel immunotherapy target moving from bench to bedside. Cancer Immunol Immunother 67, 1659–1667. [DOI] [PMC free article] [PubMed] [Google Scholar]
- Stuart T, Butler A, Hoffman P, Hafemeister C, Papalexi E, Mauck WM 3rd, Hao Y, Stoeckius M, Smibert P, and Satija R (2019). Comprehensive Integration of Single-Cell Data. Cell 177, 1888–1902 e1821. [DOI] [PMC free article] [PubMed] [Google Scholar]
- Suo S, Zhu Q, Saadatpour A, Fei L, Guo G, and Yuan GC (2018). Revealing the Critical Regulators of Cell Identity in the Mouse Cell Atlas. Cell Rep 25, 1436–1445 e1433. [DOI] [PMC free article] [PubMed] [Google Scholar]
- Szabo PA, Miron M, and Farber DL (2019). Location, location, location: Tissue resident memory T cells in mice and humans. Sci Immunol 4. [DOI] [PMC free article] [PubMed] [Google Scholar]
- Walker MG, Volkmuth W, Sprinzak E, Hodgson D, and Klingler T (1999). Prediction of gene function by genome-scale expression analysis: prostate cancer-associated genes. Genome Res 9, 1198–1203. [DOI] [PMC free article] [PubMed] [Google Scholar]
- Wang J, Ioan-Facsinay A, van der Voort EI, Huizinga TW, and Toes RE (2007). Transient expression of FOXP3 in human activated nonregulatory CD4+ T cells. Eur J Immunol 37, 129–138. [DOI] [PubMed] [Google Scholar]
- West NR, Hegazy AN, Owens BMJ, Bullers SJ, Linggi B, Buonocore S, Coccia M, Gortz D, This S, Stockenhuber K, et al. (2017). Oncostatin M drives intestinal inflammation and predicts response to tumor necrosis factor-neutralizing therapy in patients with inflammatory bowel disease. Nat Med 23, 579–589. [DOI] [PMC free article] [PubMed] [Google Scholar]
- Wickham H (2016). ggplot2 : elegant graphics for data analysis (Springer-Verlag; New York: ). [Google Scholar]
- Xiao G, Wang X, Wang J, Zu L, Cheng G, Hao M, Sun X, Xue Y, Lu J, and Wang J (2015). CXCL16/CXCR6 chemokine signaling mediates breast cancer progression by pERK1/2-dependent mechanisms. Oncotarget 6, 14165–14178. [DOI] [PMC free article] [PubMed] [Google Scholar]
- Yoshino K, Nakayama T, Ito A, Sato E, and Kitano S (2019). Severe colitis after PD-1 blockade with nivolumab in advanced melanoma patients: potential role of Th1-dominant immune response in immune-related adverse events: two case reports. BMC Cancer 19, 1019. [DOI] [PMC free article] [PubMed] [Google Scholar]
- Yost KE, Satpathy AT, Wells DK, Qi Y, Wang C, Kageyama R, McNamara KL, Granja JM, Sarin KY, Brown RA, et al. (2019). Clonal replacement of tumor-specific T cells following PD-1 blockade. Nat Med 25, 1251–1259. [DOI] [PMC free article] [PubMed] [Google Scholar]
- Zeissig S, Petersen BS, Tomczak M, Melum E, Huc-Claustre E, Dougan SK, Laerdahl JK, Stade B, Forster M, Schreiber S, et al. (2015). Early-onset Crohn’s disease and autoimmunity associated with a variant in CTLA-4. Gut 64, 1889–1897. [DOI] [PMC free article] [PubMed] [Google Scholar]
- Zhang ML, Neyaz A, Patil D, Chen J, Dougan M, and Deshpande V (2020). Immune-related adverse events in the gastrointestinal tract: diagnostic utility of upper gastrointestinal biopsies. Histopathology 76, 233–243. [DOI] [PMC free article] [PubMed] [Google Scholar]
Associated Data
This section collects any data citations, data availability statements, or supplementary materials included in this article.
Supplementary Materials
Figure S1. Overview of CD45+ immune cell populations in colitis and control patients, Related to Figure 1
A) Gating strategy used for flow-sorting of CD45+ mononuclear cells (MNC) and CD3+ T cells. CD3+ sort gate encompassed CD3-low cells that can represent recently activated T cells with downregulated TCR-CD3 complex. Granulocytes are present in colitis lesions but CD66b+ neutrophils were removed by FACS because their high RNase content interferes with the 10X Genomics scRNA-seq platform (Geukes Foppen et al., 2018; Martin et al., 2019; Smillie et al., 2019).
B) Quality metrics for CD45+ MNC dataset. Average of patients within each group with error bars (standard error of the mean).
C) Heatmap showing differentially expressed genes across clusters in the CD45+ scRNA-seq dataset (Figure 1C). The top 10 genes differentially expressed in each cluster determined by ranked averaged log (fold change) are shown. Few non-immunoglobulin variable genes were significant for plasma B cells.
D) CD45+ cells clustered and colored according to cell identify as in Figure 1C and split by patient group. Top, aggregated data from patients for each indicated group. Bottom, data from three +CPI colitis patients who received different CPI treatment regimens, including monotherapy with ipilimumab (ipi, patient C2).
E) Gating strategy used for flow cytometry analysis of CD3+ T cells in Figure 1H and as a starting gate for subsequent T cell analyses.
F) CD3+ T cell count per mg of biopsy tissue (n=7–9 subjects per group, see Table S5 for details on analyzed cases). Statistical analysis by Kruskal Wallis test corrected for multiple comparisons (* p<0.05). Accuracy of tissue weight measurements was likely affected by incomplete removal of collection media; complete removal of media and tissue dehydration could compromise scRNA-seq data quality.
Figure S2. Colitis-related T cell clusters in CD3+ scRNA-seq dataset, Related to Figure 2
A) Identification of major cell clusters of CD3+ T cells from colon biopsies, shown as UMAP of cells grouped by the Louvain clustering algorithm. CD45+ cells were analyzed from 16 subjects but CD3+ cells from 22 subjects because preliminary data analysis identified a major change in the T cell compartment in colitis compared to control cases.
B) Feature plots showing normalized expression of CD4 and CD8A.
C) Expression of most highly cluster-associated genes (2 per cluster), representing the highest-scoring differentially expressed genes calculated from cell-type specificity score (see STAR Methods). Y-axis represents the normalized gene expression value. See Table S6 for all marker genes.
D) Quantification of cell cluster frequency between patient groups. For each cluster, the average fraction of cells from each patient group is shown, after normalization for total input cell numbers per patient (see STAR Methods). Average and S.E.M. shown. Statistical analysis compares healthy control and CPI-colitis patients as a two-sided Wilcoxon test (* p<0.05, **p<0.01, ***p<0.001).
E) Distribution of CD3+ T cells across clusters in the three patient groups.
F) Cell cluster frequency shown as a fraction of total cells for each patient.
G) Representation of cells from individual patients within each cluster based on normalized cell numbers per patient (see STAR Methods), demonstrating that all clusters contained cells from multiple patients and thus were not related to patient-specific batch effects.
H) Effect of enzymatic digestion on CD8α surface expression as shown by flow cytometry analysis of PBMCs (sample unrelated to study). PBMCs were incubated with and without tissue digestion enzyme mixture as performed for dissociation of colon biopsies.
I–J) Gating strategy for enumeration of CD8+ αβ T cells, and statistical analysis for all patients shown by one-way ANOVA test.
K) Quantification of γδ T cell frequency (% of CD3+ cells pre-gated as in Figure S1E) by flow cytometry, including gating of representative sample. Statistical analysis for all patients (n=7–10 subjects per group, see Table S5 for details on analyzed cases) shown by Brown-Forsyth and Welch ANOVA test (* p<0.05).
L) Quantification of MAIT cell frequencies (% of γδTCR− CD4− cells pre-gated as in Figure S2I) by flow cytometry. Statistical analysis for all patients (n=7–10 subjects per group, see Table S5 for details on analyzed cases) shown by Brown-Forsyth and Welch ANOVA test (* p<0.05).
Figure S3. Characterization of colitis-associated changes in CD8 T cell populations, Related to Figure 2
A) Representation of cells from individual patients within each CD8 T cell cluster, based on normalized cell numbers per patient (see STAR Methods), demonstrating that all clusters contained cells from multiple patients and therefore were not related to patient-specific batch effects.
B) Heatmap showing differentially expressed genes across CD8 T cell sub-clusters. The top 10 cluster-associated genes are shown, determined and ranked by averaged log fold change compared to all other clusters.
C) Top differentially expressed genes for colitis-associated CD8 T cell clusters (5–8) compared to all other clusters (1–4). Normalized gene expression shown as a feature plots containing cells combined from all patients.
D) Normalized IFNG expression shown as feature plots for each patient cohort (combined cells from all patients within each group).
E) Analysis of T cell populations from a +CPI colitis patient who received α-CTLA-4 monotherapy (α-Ki-67 and α-CD103 antibodies were not included in this earlier version of the antibody panel).
Figure S4. Characterization of colitis-associated changes in CD4 T cell populations, Related to Figure 3
A) Heatmap showing differentially expressed genes across CD4 T cell sub-clusters. The top 10 cluster-associated genes are shown, determined and ranked by averaged log fold change.
B) Cell cluster frequency shown as a fraction of total cells for each patient.
C) Top differentially expressed genes in colitis-associated clusters (9–10) compared to all other clusters (1–8). Normalized gene expression shown as feature plots displaying cells combined from all patients.
D) Normalized IFNG expression shown as feature plots for each patient cohort (combined cells from all patients within each group).
E) Analysis of Tregs in +CPI colitis patient C2 who received α-CTLA-4 monotherapy. Quantification of FoxP3+ T cells (left) and Treg frequency (% CD4+ T cells) in patient C2 (red) compared to other +CPI colitis patients (right).
F) Quantification of Treg cell numbers per mg of biopsy tissue (n=7–9 subjects per group, see Table S5 for details on analyzed cases). Statistical analysis by Kruskal Wallis test corrected for multiple comparisons (**p<0.01). Accuracy of tissue weight measurements was likely affected by incomplete removal of collection media.
G) FOXP3 normalized gene expression shown for single cells in Treg sub-clusters from Figure 3L.
H) Quantification of Treg cell cluster frequency between patient groups. For each cluster, the average fraction of cells from each patient group is shown, after normalization for total input cell numbers per patient (see STAR Methods). Average and S.E.M. shown for the patient groups. Statistical analysis compares control and +CPI colitis patients as a two-sided Wilcoxon test (* p<0.05, **p<0.01, ***p<0.001).
I) Representation of Treg cells from individual patients within each Treg sub-cluster based on normalized cell numbers per patien (see STAR Methods), demonstrating that all clusters contained cells from multiple patients.
Figure S5. TCR clonality analysis for CD8 and CD4 T cells, Related to 4
A) Absolute numbers of TCRs detected among total CD8 and CD4 T cells grouped by cluster (refer to Figure 2A and Figure 3A). Cells with an associated αβ TCR detected are colored as indicated; CD8 cluster 1 (Trm IEL) contained γδ T cells and therefore had fewer T cells with αβ TCRs.
B) Overall clonality analysis for CD4 and CD8 T cell lineages in each patient group. Bars represent the average number of TCR clonotypes among patients for the indicated groups (error bars are S.E.M). Left, the average number of total TCR clonotypes detected in indicated groups. Middle, the average number of expanded TCR clonotypes (detected ≥2 times). Right, the % of expanded clonotypes of total clonotypes as calculated from the left and middle plots. Statistical analysis by two-sided Wilcoxon test.
C) Total number of expanded CD8 TCR clonotypes in each cluster is shown for each patient (mean shown as a line). The sum of expanded TCR clonotypes for each cluster represents the height of bars shown Figure 4A for control and colitis patients. Statistical analysis by two-way ANOVA test (** p<0.01, ****p<0.0001).
D) Sharing of expanded TCR clonotypes across CD4 T cell clusters. For each patient and cluster, the number of expanded TCR clonotypes from the CD4 T cell dataset was calculated and summed together for the indicated patient groups. Expanded clonotypes shared with a colitis-associated cluster (9–10) are colored red, those shared with other clusters (1–8) are colored blue.
E) Sharing of expanded TCR clonotypes across all possible combinations of CD4 T cell clusters. Data were aggregated for each of the indicated patient groups. Numbers indicate the number of shared expanded TCR clonotypes for each cluster pair. Bold boxes indicate statistically significant sharing of expanded clonotypes between clusters (adjusted p<0.05, one-sided Fisher’s exact test followed with Benjamini-Hochberg correction).
F) Method for sequencing of γδ TCR chains from 5’ scRNA-seq libraries. TRGC and TRDC primer binding sites of nested primers are shown.
G) Quantification of top γδ TCR clonotypes. For each patient, the percentage of cells expressing the top γδ TCR clonotype out of total γδTCR+ cells is shown.
H) Quantification of γδ TCR V gene (TRDV) usage. For each patient, the % of TCRs using each TRDV gene was calculated. Statistical analysis by two-way ANOVA test with Tukey’s multiple comparisons test.
Figure S6. Colitis-associated changes in T cell gene expression programs, Related to Figure 5.
A) Representative plots showing CTLA-4 protein expression on CD8 T cells by flow cytometry. Cells were pre-gated based on a CD4− αβTCR+ non-MAIT (Vα7.2+ CD161+) phenotype among live CD45+ CD3+ cells.
B) Quantification of CTLA-4+ CD8+ T cells (left) and CTLA-4+ granzyme B+ CD8+ T cells for the indicated patient groups (n=6–10 subjects per group, see Table S5 for details on analyzed cases). Statistical analysis by Kruskal-Wallis test (* p<0.05, **p<0.01).
C) Quantification of CTLA-4+ FoxP3− effector CD4+ T cells (n=6–10 subjects per group, see Table S5 for details on analyzed cases). Gating as in Figure 3I.
D) Normalized expression of CTLA4 and PDCD1 genes among CD8 T cells, split by patient cohorts (combined patients within each group).
E) Normalized expression of CTLA4 and PDCD1 genes among CD4 T cells, split by patient cohorts (combined patients within each group).
F) Analysis of Hallmark gene sets enriched in colitis-associated clusters, shown for both CD8 and CD4 datasets. For the CD8 analysis, clusters 5–8 were compared to clusters 1–4; for the CD4 analysis, clusters 9–10 were compared to clusters 1–8. NES= normalized enrichment score.
Figure S7. Expression of chemokine, cytokine and integrin genes in relationship to colitis, Related to Figure 7.
A) Averaged Log (fold change) of indicated chemokine receptor/ligands, compared between +CPI colitis and healthy control subjects from CD45+ dataset
B) Normalized gene expression for molecules involved in T cell migration and tissue residency, shown for CD4 and CD8 T cell datasets.
C) Averaged Log (fold change) for indicated cytokine receptor and ligand genes, compared between +CPI colitis and healthy control groups. Expression is shown for either T cell clusters (#11–16) or myeloid cluster (#5) from CD45+ dataset.
D) Normalized expression of indicated cytokines genes in myeloid cells (Figure 6D) split by patient cohorts (combined patients within each group).
E) Activity score for positive regulation of NLRP3 inflammasome expression shown for myeloid sub-clusters (Figure 6E). Two-sided Wilcoxon-test p-value for increased activity score expression in cluster 1 is shown.
F) Activity score for NLRP3 inflammasome core pathway shown for myeloid sub-clusters. Two-sided Wilcoxon-test p-value for increased activity score expression in clusters 1 and 2.
G) Left, blended feature plots of IL1B gene expression and NLRP3 inflammasome core pathway activity score shown for single cells displayed as a UMAP projection. Right, statistical significance for co-activation of IL1B and NLRP3 inflammasome core pathway activity score calculated using Guilt-By-Association, shown for all myeloid cells in the indicated patient groups.
Table S5. Summary of analyses performed for individual patients, Related to Figures 1–7. List includes scRNA-seq and flow cytometry analyses that were performed for each patient.
Table S6. Marker genes for cell subsets, Related to Figures 1,2,3,6 and S2. Differentially expressed genes in cell clusters from combined patients for the indicated datasets (CD45 clusters, CD3+ clusters, CD8+ clusters, CD4+ clusters and Treg clusters).
Table S7. Differentially expressed genes in colitis-associated clusters, Related to Figures 5 and 6. For analysis of CD8+ T cells, colitis-associated clusters 5–8 were compared to clusters 1–4. For analysis of CD4+ T cells, colitis-associated clusters 9–10 were compared to clusters 1–8. For analysis of myeloid cells, genes from cluster 5 (from CD45+ dataset) were compared between patient groups (+CPI colitis vs control, +CPI colitis vs +CPI no colitis). See STAR Methods for details.
Data Availability Statement
The datasets generated during this study are available at the Gene Expression Omnibus (GEO) under accession number: GSE144469.