Abstract
Non-line-of-sight (NLOS) imaging is a light-starving application that suffers from highly noisy measurement data. In order to recover the hidden scene with good contrast, it is crucial for the reconstruction algorithm to be robust against noises and artifacts. We propose here two weighting factors for the filtered backprojection (FBP) reconstruction algorithm in NLOS imaging. The apodization factor modifies the aperture (wall) function to reduce streaking artifacts, and the coherence factor evaluates the spatial coherence of measured signals for noise suppression. Both factors are simple to evaluate, and their synergistic effects lead to state-of-the-art reconstruction quality for FBP with noisy data. We demonstrate the effectiveness of the proposed weighting factors on publicly accessible experimental datasets.
Non-line-of-sight (NLOS) imaging retrieves the scene hidden from direct view by analyzing multiply scattered photons mediated by a diffusing wall [1–9]. Although a plethora of NLOS imaging methods has been proposed in the past decade, such as the periscope camera [4] and correlation photography [10,11], NLOS imaging based on transient measurements employing pulsed picosecond lasers [1,2,5,12,13] or modulated illumination [14] offers the unique advantage of robust 3D image retrieval with a superior spatial resolution. Still, NLOS imaging is well known to be light-starved: the drastic r4 decaying of photons poses a fundamental limit on the achievable signal level within a reasonable exposure time. As a result, the measurement data in NLOS is highly noisy for diffusive targets. Although significant efforts have been devoted to developing detectors with single photon sensitivity [15], obtaining a sufficient signal-to-noise ratio (SNR) for NLOS reconstruction inevitably involves long exposure time, which hinders real-time image acquisition.
For practical NLOS imaging, therefore, it is critical that the reconstruction algorithm can retrieve the hidden scene with decent contrast from highly noisy measurement data. Currently, the state-of-the art image reconstruction is obtained by frequency-domain algorithms, including the light cone transform (LCT) [1] and f -k migration [16], which offer superior robustness against noises and a much faster reconstruction speed. However, these frequency-domain methods are all restricted to the confocal data acquisition strategy and flat wall geometry. Even though f -k migration was extended to handle slightly curved wall and non-confocal measurements, it remains challenging to adapt it to arbitrary NLOS imaging geometry. Recently, a novel frequency-domain method based on fast Rayleigh–Sommerfeld diffraction [17] was proposed, and it works well for non-confocal NLOS imaging. Nonetheless, it is still limited to a planar wall geometry, and the reconstructed image quality is slightly inferior to that of Laplacian-of-Gaussian filtered backprojection (LoG-FBP), which, on the contrary, can handle arbitrary imaging strategy [6]. Yet, FBP is known to suffer from inferior robustness against noises and streaking artifacts.
To address the limitations of FBP, various algorithmic improvements have been proposed in the literature. The error BP [18] casts the reconstruction as a linear inverse problem with an appropriate light transport model and then applies an iterative solver such as gradient descent for image recovery. However, the iterative process slows down the reconstruction by several folds compared to the plain FBP, and it is prone to errors in the light transport model. Another work in Ref. [16] modeled the measurement noises in NLOS imaging with Bayesian statistics and was able to improve the image quality with a small computational overhead. Unfortunately, it does not take into account streaking artifacts, and its effectiveness degrades quickly at high noise levels.
The phasor field [2] method is a new approach that preprocesses the temporal signals to generate virtual complex signals similar to those in coherent diffraction imaging modalities and then apply BP to retrieve the hidden scene. Owing to the bandpass filtering in preprocessing, it demonstrated improved robustness against noises with a doubled computational cost. Nevertheless, streaking artifacts persist in this method, and it does not cope that well with highly noisy measurement data. The analysis-by-synthesis approach in Ref. [19] and the Fermat flow method [20] are also more robust against noises than FBP. However, the former is more time consuming, while the latter recovers only the shape, not the reflectance, of the hidden scene.
Here, we propose two simple yet highly effective weighting factors that can substantially improve the image reconstruction quality with noisy measurement data in both confocal and non-confocal settings. The first is the apodization factor, which attenuates the signals from the detection points stretching to the hidden voxel at large angles from the wall’s normal. It is equivalent to the aperture apodization [21] method commonly employed in ultrasound or radar imaging to suppress the streaking artifact, which is one of the dominant “noise” sources that degrade contrast in the reconstructed images. The second is the coherence factor that computes the normalized correlation between the backprojected signals for each hidden voxel. This is motivated by the fact that shot noises of photon-counting in different detection points are spatially independent of each other, whereas the backscattered signals originated from the same voxel in the hidden scene are highly correlated among the detection points. As a result, the coherence factor remains close to one for signals but fluctuates around zero for noises. Weighing the backprojected signals with the coherence factor consequently suppresses noises.
We first list the notations in Table 1. Formally, the apodization factor modifies the classic BP [5] by assigning different weights a p,v to the backprojected signals. In the discrete domain, we have
| (1) |
where the summation is done over all the N detection points on the wall, and is the travel time from the illumination point to voxel and back to the detection point . The impact of the apodization factor on image reconstruction can be predicted by Fourier analysis for planar wall geometry: the point spread function (PSF) after BP is proportional to the intensity of the Fourier transform of the aperture function on the wall. Such a Fourier relationship between the aperture and PSF is established in ultrasound or radar imaging and can be rigorously proved under the phasor field framework [2,22] for NLOS imaging.
Table 1.
Notations
| Detection point on the wall | Reconstruction voxel | ||
| Laser illumination point on the wall | Temporal signal at | ||
| ap,v | Apodization factor for point to voxel | Backprojected signal at |
Here, we devise the apodization factor that is readily calculated in BP: ap,v = cos2 θp,v, where θp,v is the angle between the wall’s normal and the light path from detection point towards the voxel . Other apodization schemes such as Blackman or Hann window functions can also be used. The suppression of streaking artifacts by apodization is illustrated in Fig. 1(a), where BP from a detection point creates a spherical wavefront in the imaging volume. Without apodization, the spherical wavefronts remain stable over a large area and induce streaking artifacts around the reconstruction voxel. However, by assigning smaller weights a p,v to signals propagating to the voxel at large angles, the spherical wavefront far away from the voxel is attenuated, which leads to reduced streaking artifacts. This behavior is quantitatively elaborated in Fig. 1(b) with Fourier analysis.
Fig. 1.
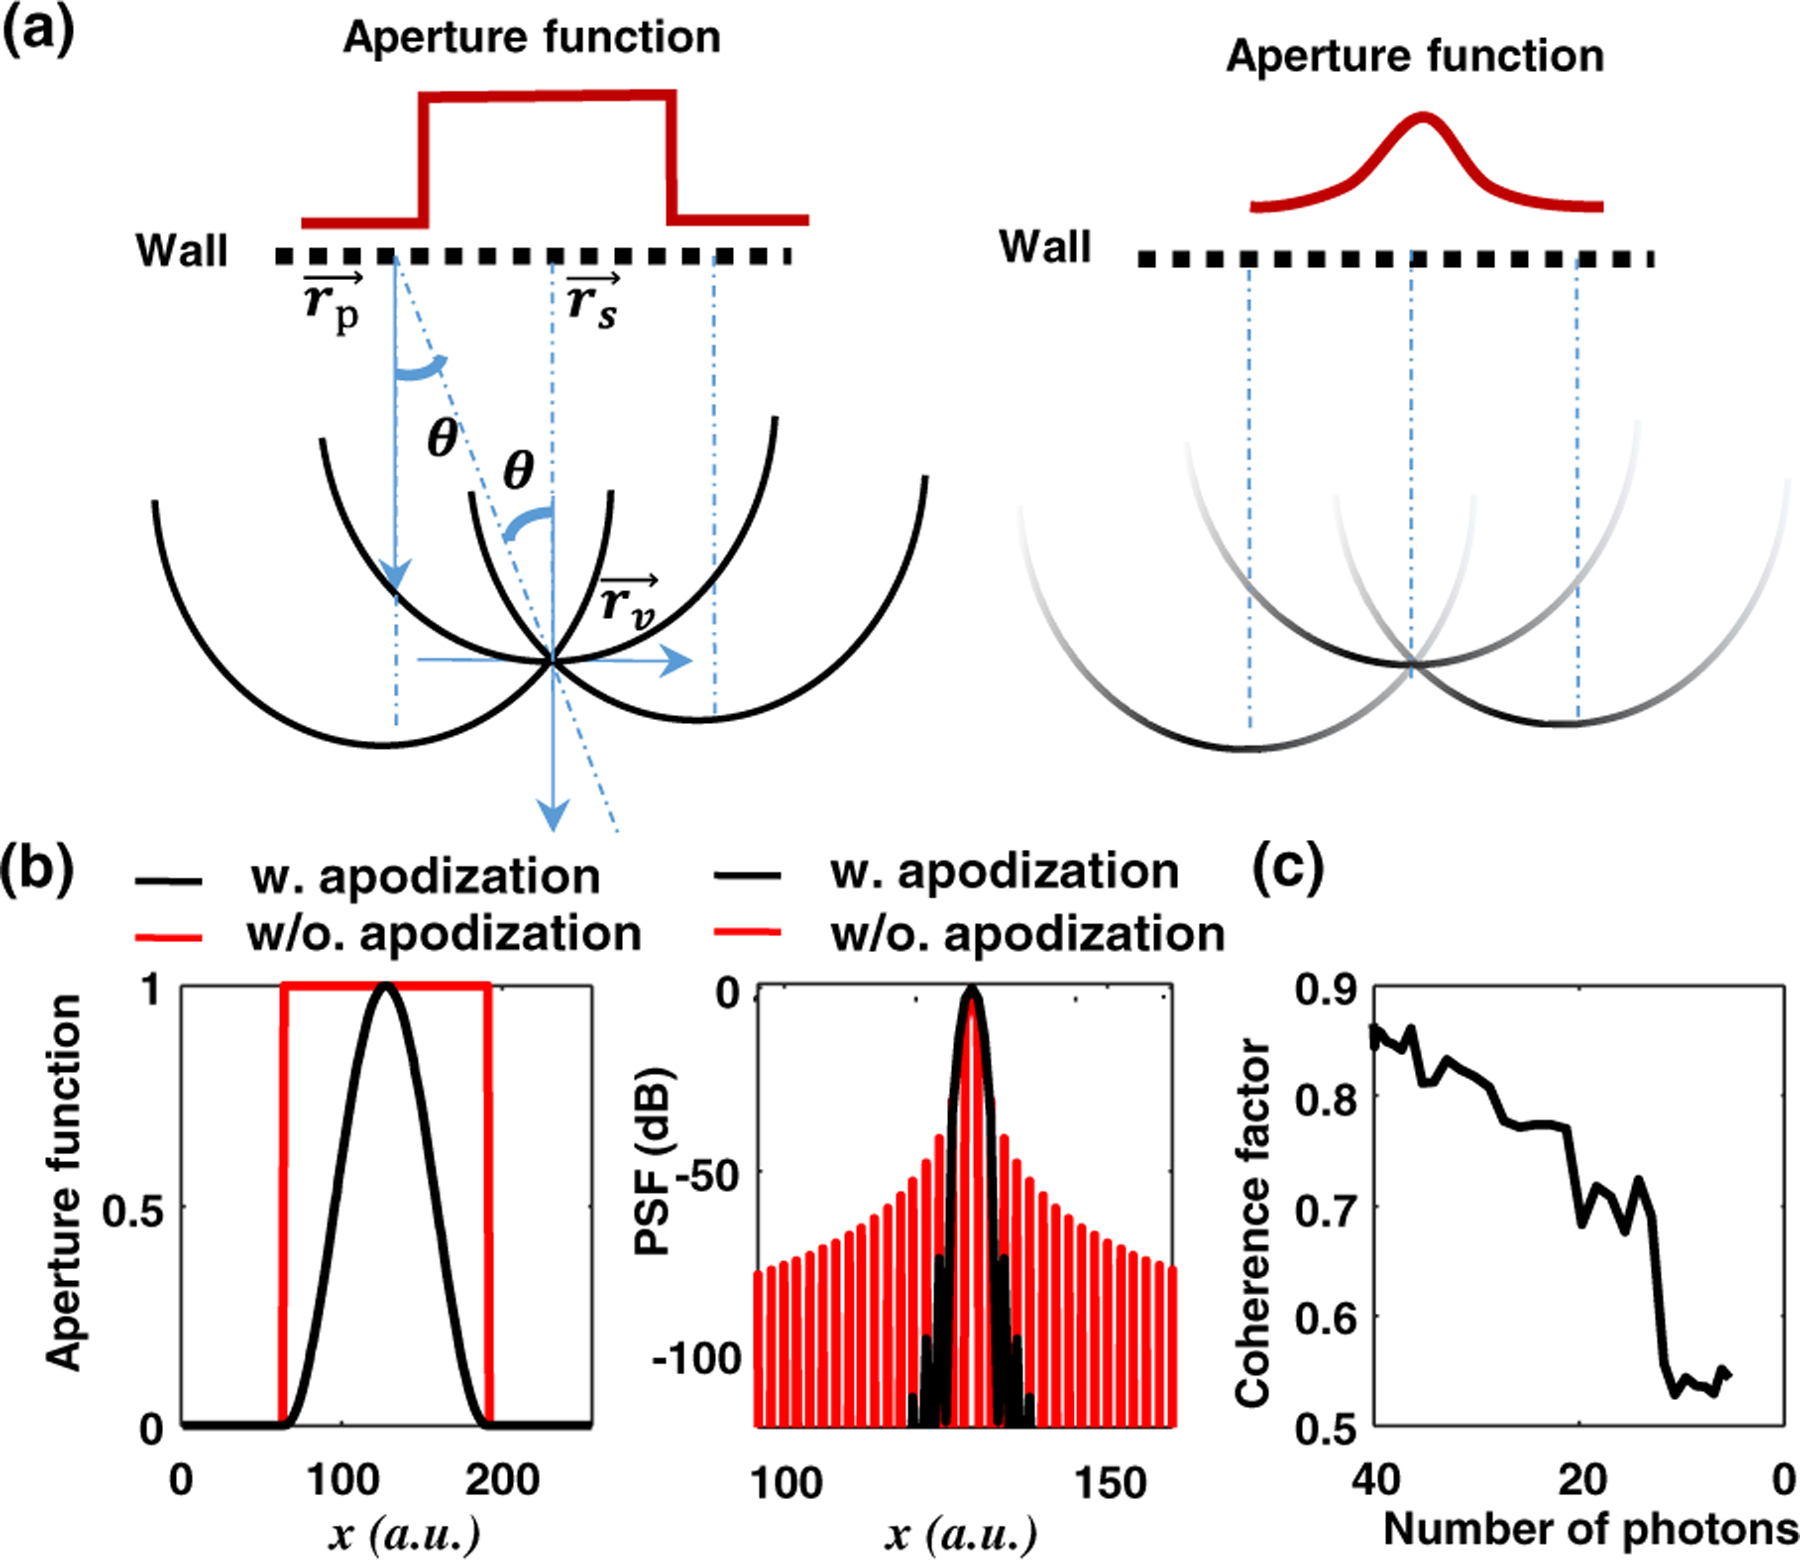
Weighting factors for FBP reconstruction. (a) Apodization effect on streaking artifacts. (b) Fourier analysis of apodization on streaking artifacts and lateral resolution. (c) Coherence factor as a function of photon count for noisy measurements. w. and w/o., with and without.
The PSF with apodization factors shows markedly weaker side lobes at the cost of degraded lateral resolution, a tradeoff of any apodization schemes. As streaking-artifact-induced “noise” is a major contributor to degraded image quality, the benefit of the apodization factor outweighs the slight reduction in lateral resolution (~1.4 times).
The apodization factor does not have any effects on the noises in measurement data. To abate noises, therefore, we calculate a coherence factor:
| (2) |
| (3) |
where Δt is the sampling period of the temporal signal. It is noted that to avoid extra computational complexity, the coherence factor does not measure directly the correlation between signals from different detection points. Instead, it is calculated between the backprojected signal and a generated signal in Eq. (3) and then is averaged over a temporal kernel of length K. Empirically, a kernel size of one is efficient for noise suppression, and a larger K was found to be beneficial in reducing strong streaking artifacts at the expense of increased computing time. We calculate in Fig. 1(c) the coherence factor as a function of the expected photon count because NLOS imaging is mostly shot-noise limited. The coherence factor decreases steadily with fewer photons (i.e., noisier data), and though not shown here, a similar trend was observed for other noise sources such as white noises.
The final FBP reconstruction with the proposed weighting factors is obtained by convolving the weighted BP results with a LoG filter h(x, y, z):
| (4) |
To demonstrate the effectiveness of the proposed weighting factors for improving the reconstruction quality of FBP, we used both the confocal NLOS data set [1,16,23] and the non-confocal dataset [17], and compared the reconstruction quality produced by the following algorithms: LoG-FBP, LoG-FBP with apodization (FBP-A), LoG-FBP with both weighting factors (FBP-AC), and the state-of-art f -k migration or phasor field method. The kernel size of the LoG filter was 7 × 7 × 7, and the FBP reconstruction resolution was fixed at the native resolution of all the datasets. All reconstructed volumetric images were normalized to the range of [0,1] and then thresholded for improved 3D rendering.
We first reconstructed the “resolution” scene using the confocal dataset acquired with exposure times of 10 and 60 min to illustrate the noise robustness and spatial resolution of all considered algorithms. The kernel size K was set to eight here for FBP-AC. Figures 2(a) and 2(b) show respectively the front and top views of the resolution scene obtained with 10 min exposure time and a rendering threshold of 0.02. From FBP to FBP-AC, there is a clear trend of reduction in background noises. The streaking artifact is salient in the top view for the vanilla FBP but is substantially reduced by the apodization factor in FBP-A and FBP-AC. With a longer exposure time of 60 min, the reconstructed images show converged quality for all the algorithms in Fig. 2(c) owing to an improved SNR in measurement data. Nevertheless, the vanilla FBP still shows more streaking artifacts when the results are not thresholded. The f -k migration yields the state-of-art results for noisy measurement (10 min exposure) but contains more noises surrounding the objects in Fig. 2(b). This is probably induced by the resampling operation in the Fourier domain that interpolates FFT data onto a rectilinear coordinate from a spherical one, which is known to cause artifacts in computed tomography. Changing the rendering threshold to 0.15 for reconstructed images with 60 min exposure removed those artifacts in Fig. 2(c). It is noted that the proposed FBP-AC obtained image quality (noise robustness and spatial resolution) similar to f -k migration in this case.
Fig. 2.
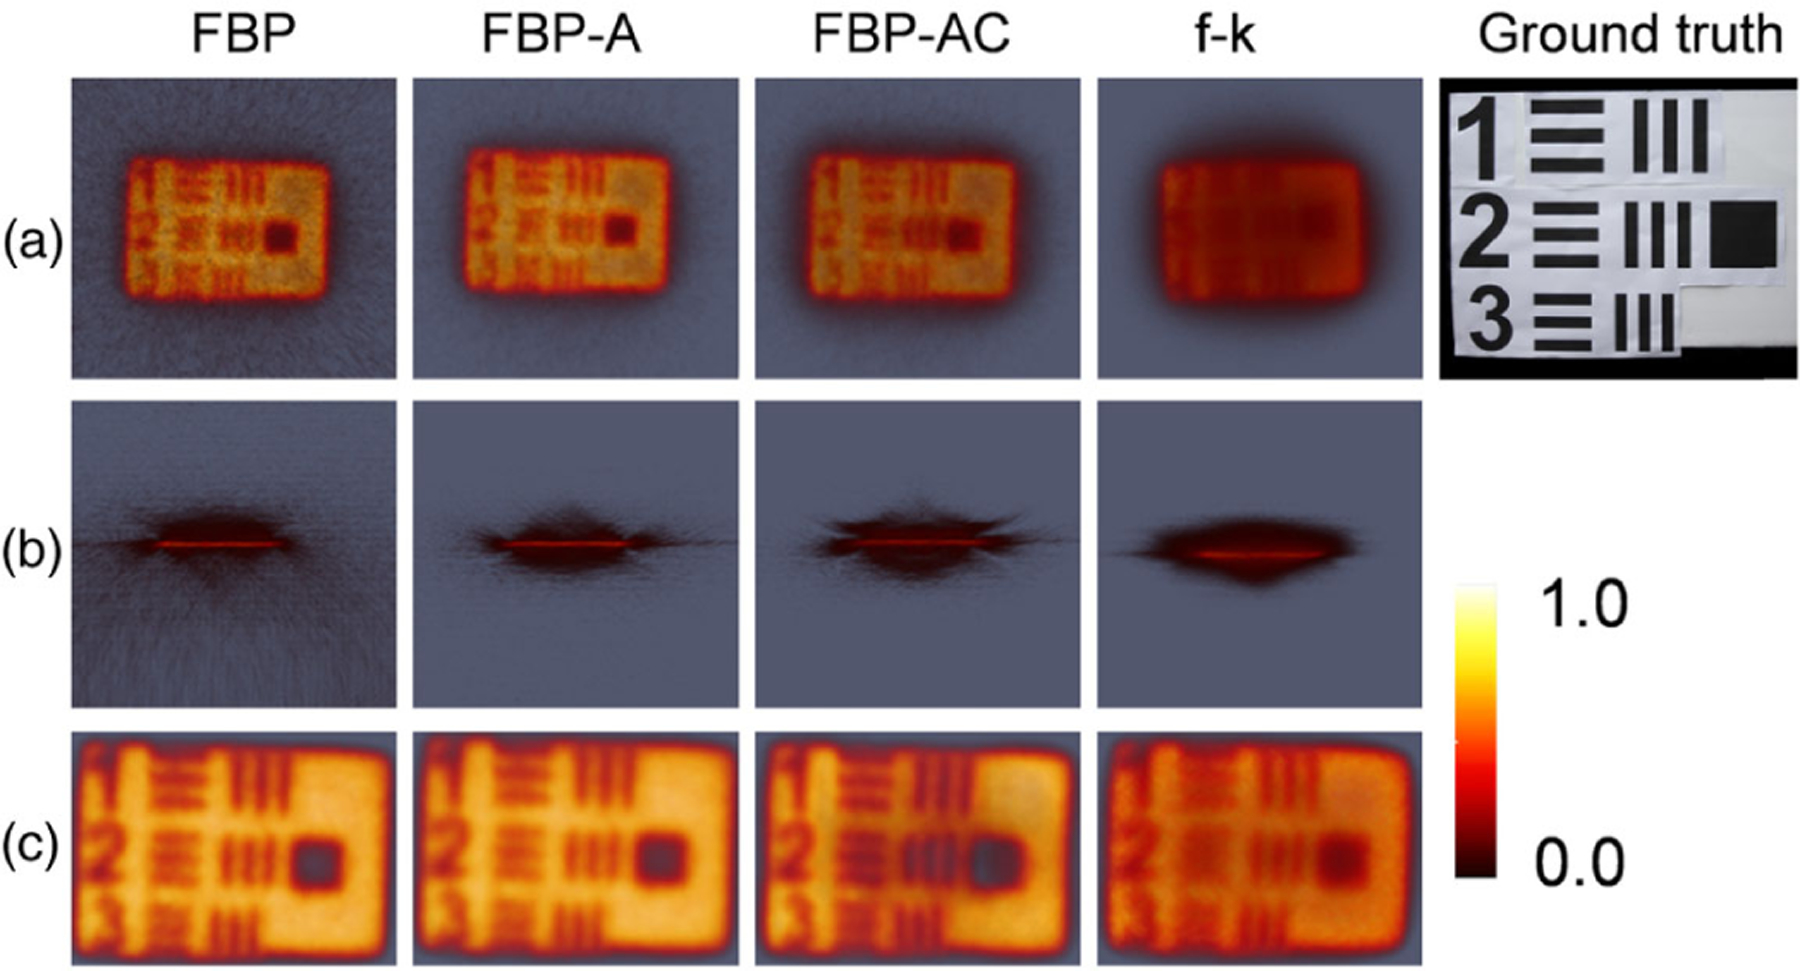
NLOS reconstruction with different algorithms for the “resolution” scene. Left to right: FBP, FBP with apodization, FBP with both weighting factors, f -k migration, and ground truth. (a), (b) Front and top view results with 10 min exposure. (c) Front view results with 60 min exposure.
Next, we demonstrate that the proposed weighting factors can outperform f -k migration in retrieving the hidden scene with highly noisy measurement data. We used the “dragon” scene in the confocal dataset, which contains measurement data with an exposure time as short as 15 s. The reconstructed results for all the algorithms are compared in Fig. 3 with a threshold of 0.15.
Fig. 3.
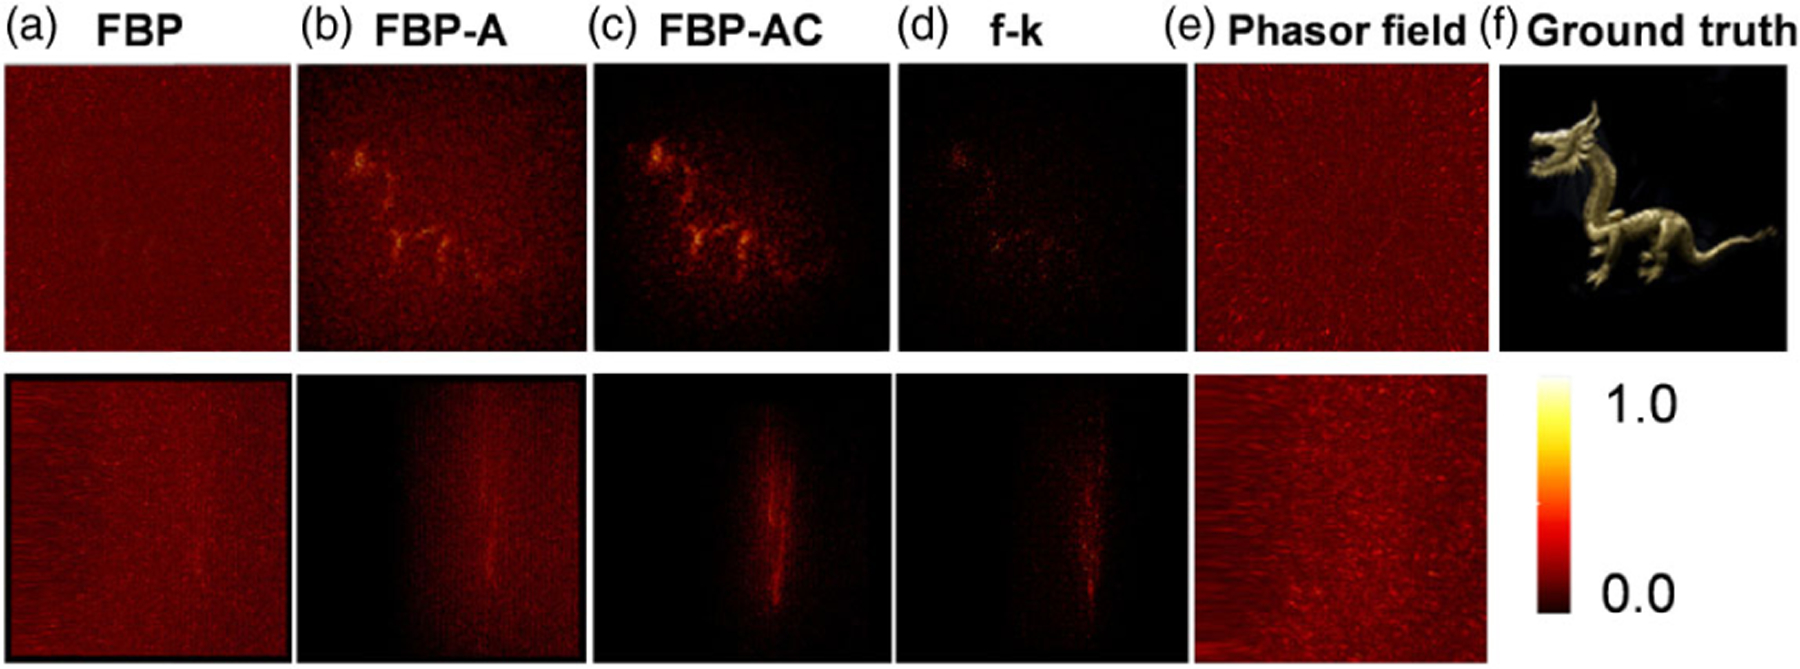
Reconstruction with noisy data. Top row: front view; second row: side view. From left to right: FBP, FBP with apodization, FBP with both weighting factors, f -k migration, phasor field, and ground truth.
For the FBP and phasor field method, the reconstructed volume is highly noisy. FBP-A and f -k migration yield a noisy image of the hidden dragon, but the contrast is low. In contrast, FBP-AC with a kernel size of K = 1 shows markedly less noise and enables decent visualization of the hidden dragon. While previous work [17] needs to trade reconstruction resolution for noise robustness in order to visualize the hidden dragon well, the proposed method achieves the goal at the native resolution (512 × 512 × 512) of the dataset.
We then reconstruct a complex scene from the “teaser” dataset that contains highly reflective objects, which is problematic for FBP and the phasor field method due to their strong streaking artifacts. We used the minimal exposure time of 10 min to test the robustness against noises of all the considered algorithms in Figs. 4(a)–4(e), which were rendered with a threshold of 0.1. Notably, the proposed FBP-A and FBP-AC algorithms suppress substantially the streaking artifacts from the reflective disk ball that afflicts the FBP and phasor field method, as indicated by the arrows. F -k migration shows state-of-the-art robustness against noises and is immune to streaking artifacts from the reflective object. Still, it is afflicted by resampling-induced artifacts around the resolution target area. Compared with FBP-A, the coherence factor in FBP-AC with a kernel size of K = 8 abates the streaking artifacts even further, as contrasted in the insets. Overall, FBP-AC handles reflective objects equally well as f -k migration and is more robust against noises, visualizing the hidden scene [ground truth in (f)] decently.
Fig. 4.
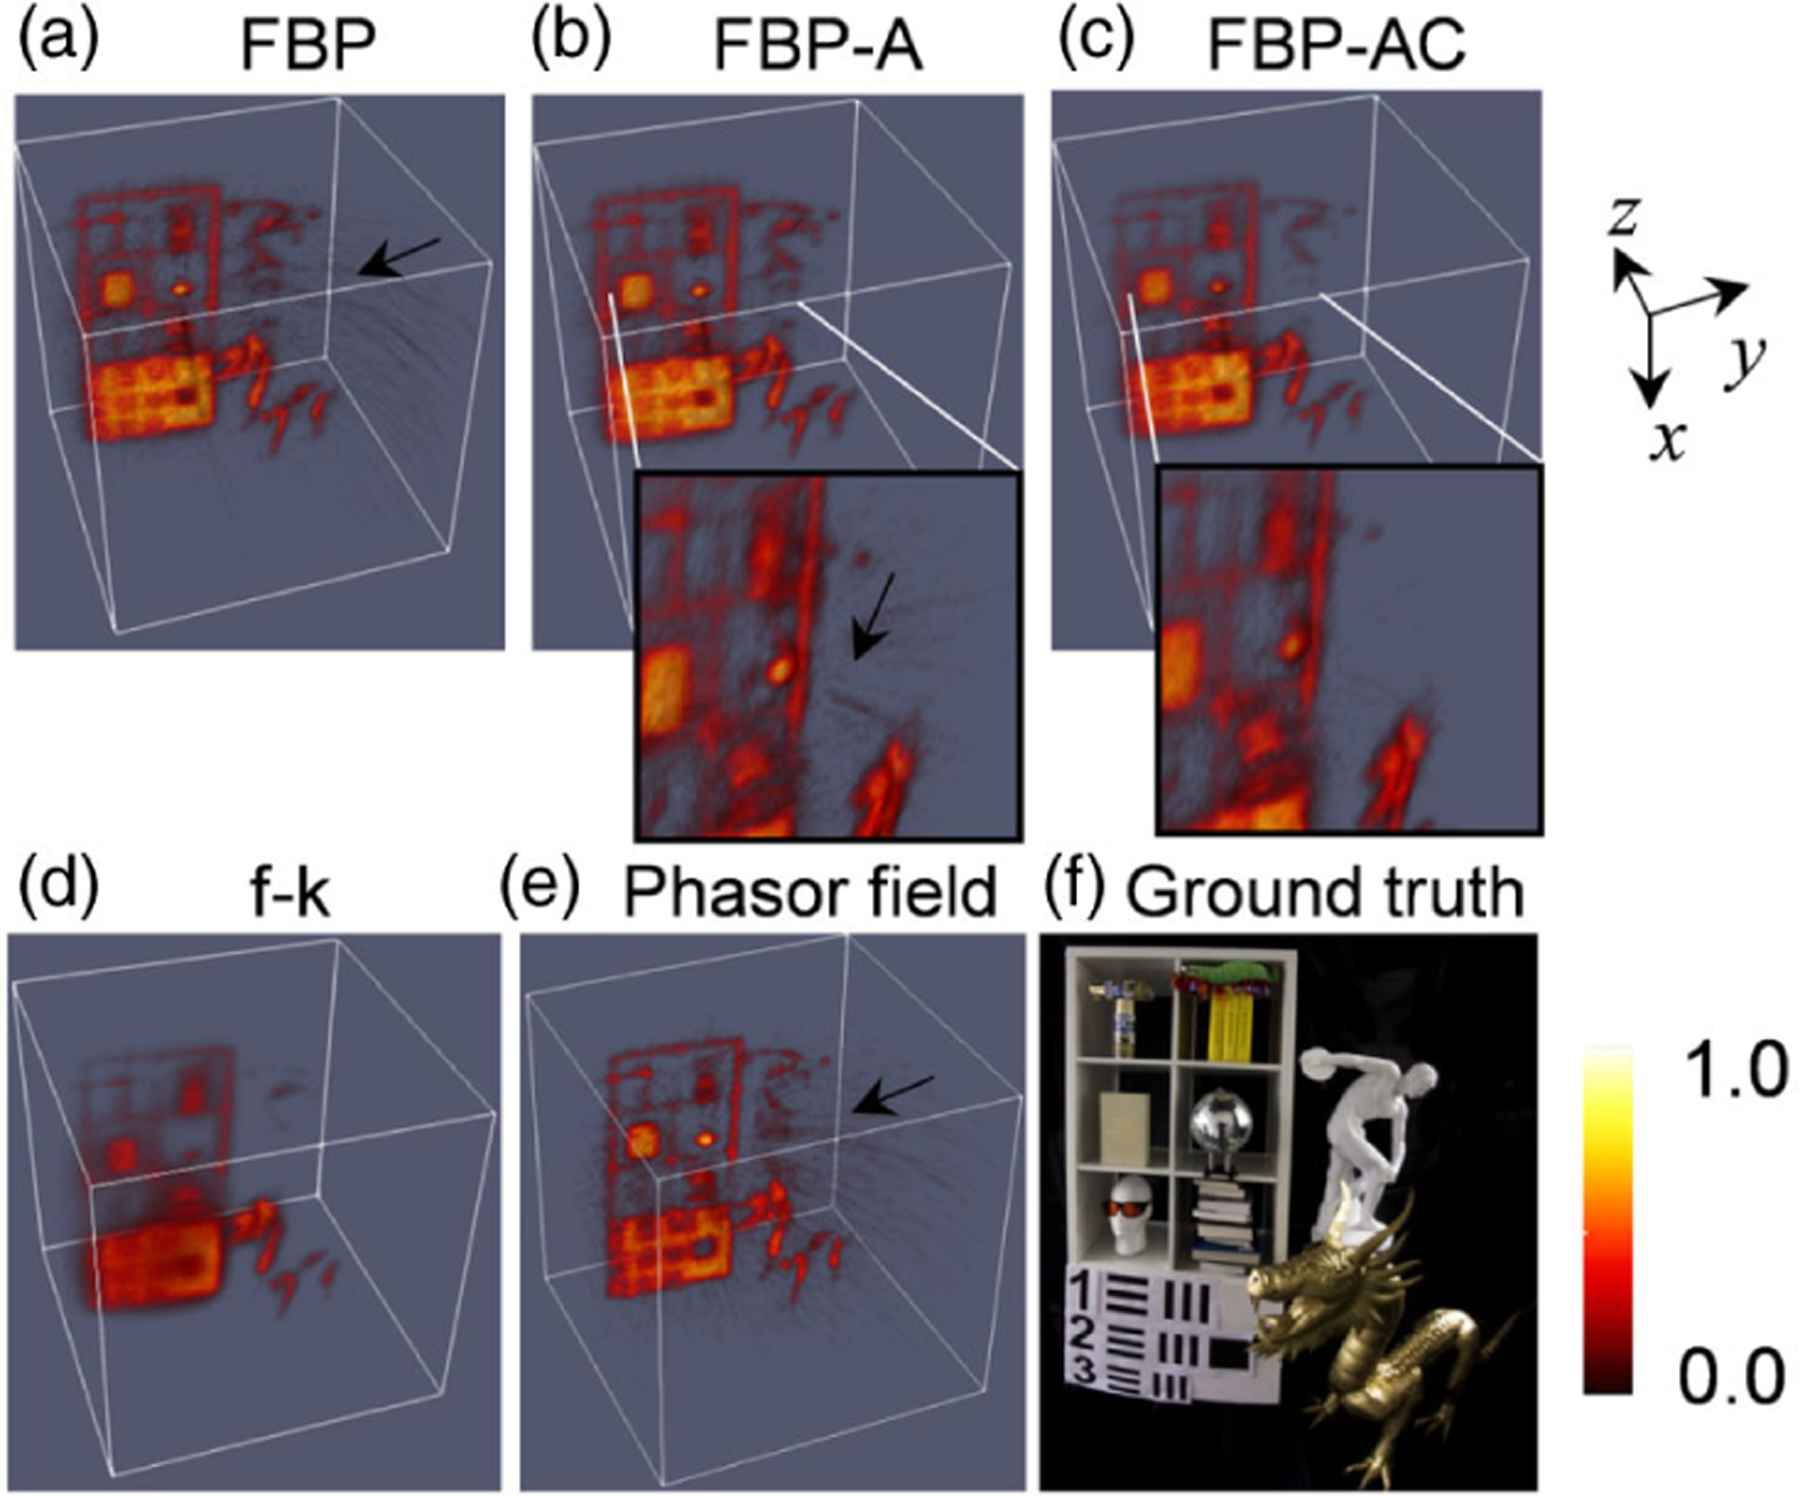
Reconstruction of the “teaser” scene using different methods. (a)–(e): FBP, FBP-A, FBP-AC, f -k, and phasor field. (f) Ground truth image.
Last, we applied the proposed method on the office scene dataset from Ref. [17] in a non-confocal setting and compared it with the phasor field method, using the same parameters as in Ref. [17]. The results are shown in Fig. 5, where the corresponding maximum intensity projection images are given in the last row. A similar observation can be made here: the two weighting factors substantially abate the noises in the reconstruction volume and outperform the phasor field in suppressing noises. However, there are more aura parts in FBP and the proposed method, such as those indicated by the arrows, which may be attributed to multiple-scattered or ambient light. The phasor field method, owing to its bandpass filtering step, shows better performance in alleviating these artifacts, allowing more details to be rendered that are otherwise overshadowed by the aura parts. Although we implemented the weighting factors in FBP, the fact that they are evaluated during the BP step indicates that they can be easily extended to the phasor field framework with a few additional steps. This is left to future work.
Fig. 5.
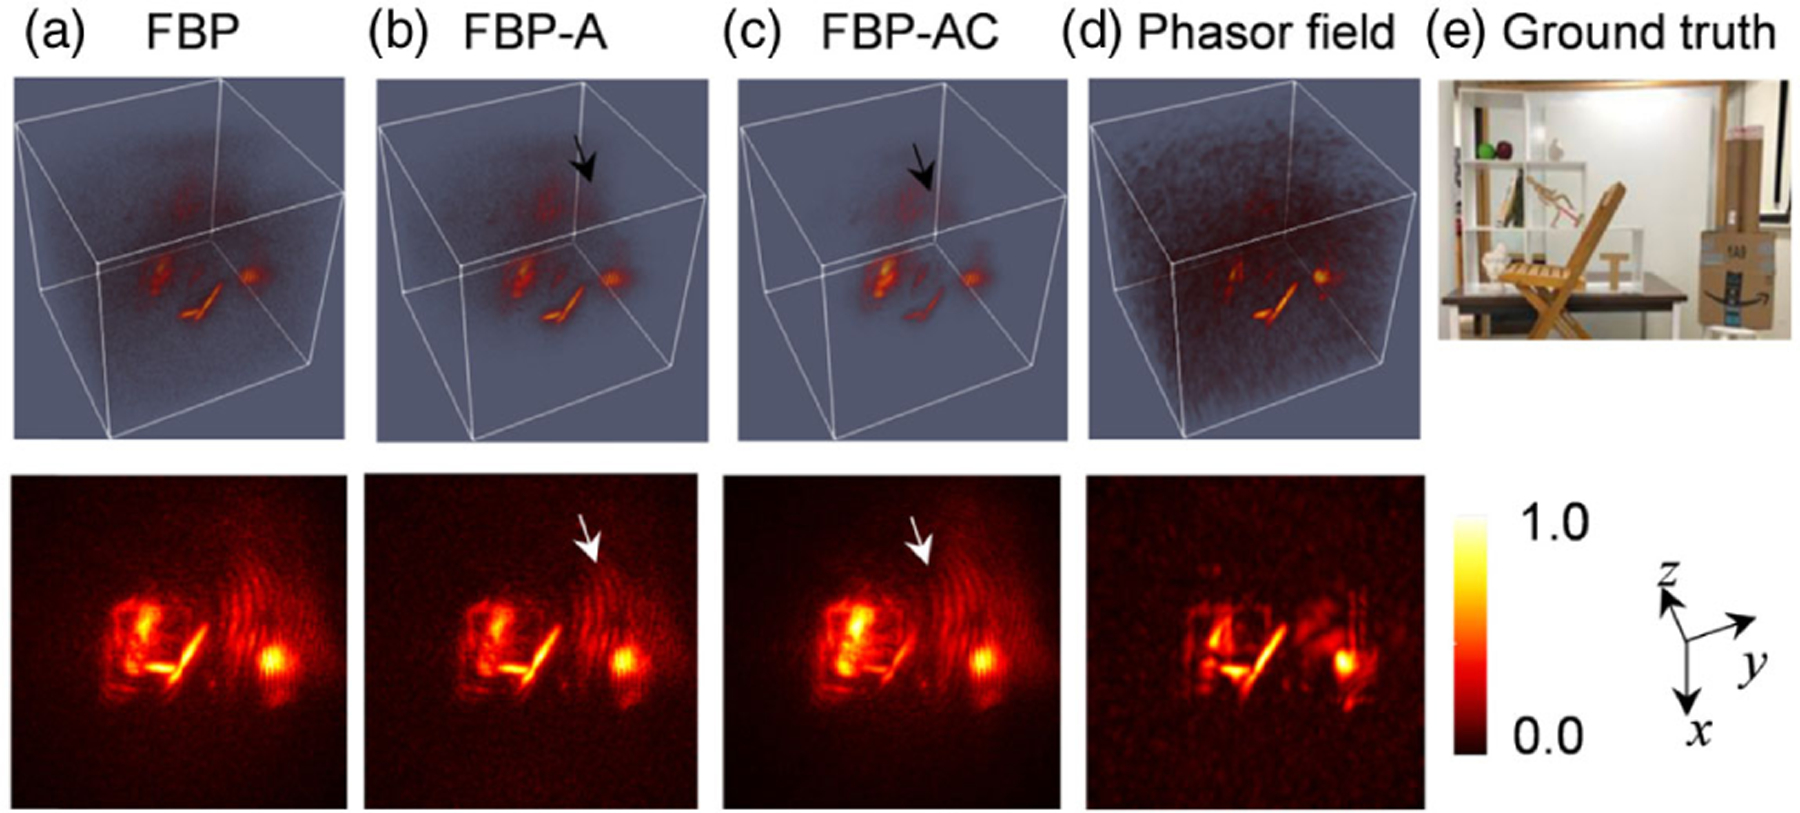
Reconstruction of the office scene using all the considered algorithms with the shortest 1 ms exposure. (a)–(e): FBP, FBP-A, FBP-AC, phasor field, and ground truth. The bottom row shows the maximum intensity projection images. The 3D images are thresholded by 0.02.
The computation overhead for the weighting factors is small. For each reconstruction voxel, the apodization factor involves only one extra division and multiplication. The coherence factor needs K extra multiplication and division and K −1 summation operation. The dominant computation in FBP-AC is still the BP operation. Implemented on a Nvidia GTX2080TI graphical processing unit, the reconstruction times for FBP, FBP-A, and FBP-AC on a 512 × 512 × 512 volumetric grid are 160, 250, and 270 (K = 1) s, respectively. The time increased to 480 s when using a larger kernel K = 8 to suppress strong streaking artifacts, indicating that the bottleneck was now evaluating the coherence factor. Such an increase in reconstruction time is acceptable, considering the benefits of markedly improved noise robustness. Though f -k migration currently takes about 80 s and LCT can run in real time, fast BP algorithms have also been achieved [17,24].
In conclusion, we proposed two simple and highly effective weighting factors—apodization and coherence factors—to improve the reconstruction of FBP for NLOS imaging in arbitrary geometry, which is a light-starved application that yields highly noisy data. Compared with the state-of-the-art f -k migration or phasor field method, the proposed weighting factors enabled LoG-FBP to retrieve the hidden scene with an improved contrast using a very low photon count. They will be conducive to real-time NLOS imaging by reducing data acquisition time.
Acknowledgment.
We thank the Stanford Computational Imaging Group and the Computational Optics Group at University of Wisconsin—Madison for making their image datasets available for this research study.
Funding. National Science Foundation (CAREER 1652150); National Institutes of Health (R01EY029397, R35GM128761).
Footnotes
Disclosures. The authors declare no conflicts of interest.
REFERENCES
- 1.O’Toole M, Lindell DB, and Wetzstein G, Nature 555, 338 (2018). [DOI] [PubMed] [Google Scholar]
- 2.Liu X, Guillén I, Manna ML, Nam JH, Reza SA, Le TH, Jarabo A, Gutierrez D, and Velten A, Nature 572, 620 (2019). [DOI] [PubMed] [Google Scholar]
- 3.Lin D, Hashemi C, and Leger JR, J. Opt. Soc. Am. A 37, 540 (2020). [DOI] [PubMed] [Google Scholar]
- 4.Saunders C, Murray-Bruce J, and Goyal VK, Nature 565, 472 (2019). [DOI] [PubMed] [Google Scholar]
- 5.Velten A, Nat. Commun 3, 745 (2012). [DOI] [PubMed] [Google Scholar]
- 6.Manna ML, Nam J-H, Reza SA, Velten A, and Velten A, Opt. Express 28, 5331 (2020). [DOI] [PubMed] [Google Scholar]
- 7.Gariepy G, Tonolini F, Henderson R, Leach J, and Faccio D, Nat. Photonics 10, 23 (2016). [Google Scholar]
- 8.Jarabo A, Masia B, Marco J, and Gutierrez D, Visual Inform 1, 65 (2017). [Google Scholar]
- 9.Maeda T, Satat G, Swedish T, Sinha L, and Raskar R, “Recent advances in imaging around corners,” arXiv:1910.05613 (2019). [Google Scholar]
- 10.Metzler CA, Heide F, Rangarajan P, Balaji MM, Viswanath A, Veeraraghavan A, and Baraniuk RG, Optica 7, 63 (2020). [Google Scholar]
- 11.Katz O, Heidmann P, Fink M, and Gigan S, Nat. Photonics 8, 784 (2014). [Google Scholar]
- 12.Buttafava M, Zeman J, Tosi A, Eliceiri K, and Velten A, Opt. Express 23, 20997 (2015). [DOI] [PubMed] [Google Scholar]
- 13.Chan S, Warburton RE, Gariepy G, Leach J, and Faccio D, Opt. Express 25, 10109 (2017). [DOI] [PubMed] [Google Scholar]
- 14.Kadambi A, Zhao H, Shi B, and Raskar R, ACM Trans. Graph 35, 1 (2016). [Google Scholar]
- 15.Bruschini C, Homulle H, Antolovic IM, Burri S, and Charbon E, Light: Sci. Appl 8, 1 (2019). [DOI] [PMC free article] [PubMed] [Google Scholar]
- 16.Lindell DB, Wetzstein G, and O’Toole M, ACM Trans. Graph 38, 1 (2019). [Google Scholar]
- 17.Liu X, Bauer S, and Velten A, Nat. Commun 11, 1 (2020). [DOI] [PMC free article] [PubMed] [Google Scholar]
- 18.La Manna M, Kine F, Breitbach E, Jackson J, Sultan T, and Velten A, IEEE Trans. Pattern Anal. Mach. Intell 41, 1615 (2019). [DOI] [PubMed] [Google Scholar]
- 19.Iseringhausen J and Hullin MB, ACM Trans. Graph 39, 8 (2020). [Google Scholar]
- 20.Xin S, Nousias S, Kutulakos KN, Sankaranarayanan AC, Narasimhan SG, and Gkioulekas I, in IEEE/CVF Conference on Computer Vision and Pattern Recognition (CVPR) (2019), p. 6793. [Google Scholar]
- 21.Guenther DA and Walker WF, IEEE Trans. Ultrason., Ferroelectr., Freq. Control 54, 343 (2007). [DOI] [PubMed] [Google Scholar]
- 22.Teichman JA, Opt. Express 27, 27500 (2019). [DOI] [PubMed] [Google Scholar]
- 23.O’Toole M, Heide F, Lindell DB, Zang K, Diamond S, and Wetzstein G, in IEEE Conference on Computer Vision and Pattern Recognition (CVPR) (2017), p. 2289. [Google Scholar]
- 24.Arellano V, Gutierrez D, and Jarabo A, Opt. Express 25, 11574 (2017). [DOI] [PubMed] [Google Scholar]


