Abstract
Clear cell renal cell carcinoma (ccRCC) is the most common and highly malignant pathological type of kidney cancer. We sought to establish a metabolic signature to improve post‐operative risk stratification and identify novel targets in the prediction models for ccRCC patients. A total of 58 metabolic differential expressed genes (MDEGs) were identified with significant prognostic value. LASSO regression analysis constructed 20‐mRNA signatures models, metabolic prediction models (MPMs), in ccRCC patients from two cohorts. Risk score of MPMs significantly predicts prognosis for ccRCC patients in TCGA (P < 0.001, HR = 3.131, AUC = 0.768) and CPTAC cohorts (P = 0.046, HR = 2.893, AUC = 0.777). In addition, G6PC, a hub gene in PPI network of MPMs, shows significantly prognostic value in 718 ccRCC patients from multiply cohorts. Next, G6Pase was detected high expressed in normal kidney tissues than ccRCC tissues. It suggested that low G6Pase expression significantly correlated with poor prognosis (P < 0.0001, HR = 0.316) and aggressive progression (P < 0.0001, HR = 0.414) in 322 ccRCC patients from FUSCC cohort. Meanwhile, promoter methylation level of G6PC was significantly higher in ccRCC samples with aggressive progression status. G6PC significantly participates in abnormal immune infiltration of ccRCC microenvironment, showing significantly negative association with check‐point immune signatures, dendritic cells, Th1 cells, etc. In conclusion, this study first provided the opportunity to comprehensively elucidate the prognostic MDEGs landscape, established novel prognostic model MPMs using large‐scale ccRCC transcriptome data and identified G6PC as potential prognostic target in 1,040 ccRCC patients from multiply cohorts. These finding could assist in managing risk assessment and shed valuable insights into treatment strategies of ccRCC.
Keywords: clear cell renal cell carcinoma, G6PC, immune infiltration, metabolic prediction models, prognosis, tumour microenvironment
1. INTRODUCTION
Renal cell carcinoma is one of the most common malignant tumours of the urogenital system, accounting for about 5% of all new cases of adult males and 3% of new cases of females. 1 According to statistics in the United States, there are about 73 820 new cases of kidney cancer and 14 770 deaths in 2019. 2 Clear cell renal cell carcinoma (ccRCC) is the most common and highly malignant pathological type of kidney cancer (accounting for 70%‐85%). About 25%‐30% of ccRCC patients have metastases at first diagnosis, and the 5‐year survival rate of metastatic ccRCC is only 32%. In addition, even ccRCC patients who are initially effective in treatment will have disease progression after a period of time, at which time most patients will lack subsequent effective treatment.
In recent years, new immunotherapy represented by PD‐1/PD‐L1, CTLA4 inhibitors has rapidly emerged in the field of ccRCC treatment and has shown encouraging results for patients with advanced refractory disease. 3 In 2020, ASCO GU published the 5‐year follow‐up results of the CheckMate 025 study, showing the 5‐year survival rate of monoclonal antibody second‐line treatment is as high as 26%, which demonstrates the advantages of immunotherapy's survival benefits and new chapter of treatment strategies for high‐risk ccRCC patients. 4 , 5 , 6 Immune check‐point inhibitors combined with TKI play a variety of roles from the perspective of inducing anti‐tumour immune normalization, inhibiting the development of advanced ccRCC and regulating tumour microenvironment (TME). Its success largely depends on deep understanding of tumour cells and TME interaction. 7 , 8 With the deepening of research, more evidence shows that not only the efficacy of immunotherapy depends on the activation of the tumour immune microenvironment, but also the efficacy of traditional treatments such as targeted therapy also depends on the strength of individual anti‐tumour immune response. 9 , 10 , 11 Thus, it is of great significance exploring the underlying mechanism of TME‐driven tumorigenesis and development, improving the efficiency of various existing treatments and discovering novel precise targets for ccRCC therapies.
In TME, tumour cells and immune cells reprogram their metabolic patterns to adapt to the microenvironment of hypoxia, acidity and low nutrition. 12 For example, tumour cells show enhanced aerobic glycolysis (Warburg effect) but reduce oxidative phosphorylation, which has a great effect on T cell‐mediated anti‐tumour immune response and tumour‐infiltrating myeloid cell activity; macrophages tend to be M2‐type polarization, showing up‐regulated fatty acid synthesis and β‐oxidation. 13 The activation of tumour cell pro‐cancer signals not only affects its own malignant biological behaviour, but also promotes the development of tumours. 14 It can also deflect the functional phenotype of tumour‐infiltrating immune cells by changing the metabolic secretion profile and TME of tumour cells and induce the formation of tumour immune escape. 14 , 15 Therefore, the metabolic reprogramming of tumour cells and immune cells is crucial for understanding the game process of tumour cells' evil behaviour, tumour immune response and tumour immune escape and provides new directions for regulating tumour immunity.
The methods of constructing clinical prediction models based on retrospective data help researches realize the prediction of clinical outcomes with several prognostic factors, which is more likely to change our clinical practice and has strong clinical guidance value. 16 In 2018, RCClnc4 has been demonstrated to have precise prognostic significance in early ccRCC. This study aimed to first establish and validate an effective prognostic metabolic prediction models enrolled large‐scale transcriptome metabolic genes for ccRCC patients. We suggested that the metabolic prediction models (MPMs) classifier could facilitate risk management and treatment strategies for ccRCC patients and identify novel targets in the MPMs co‐network.
2. MATERIALS AND METHODS
2.1. Raw data collection and processing
Publicly available mRNA expression and clinical data from ccRCC cohorts were used in this study. Consents and ethical approval of enrolled patients are available in the related original articles where the data sets were published. A total of 718 ccRCC patients from online data sets, including 534 ccRCC and 72 normal samples obtained from The Cancer Genome Atlas (TCGA) database (https://portal.gdc.cancer.gov/), 93 ccRCC and 20 normal samples obtained from Clinical Proteomic Tumor Analysis Consortium (CPTAC) and 91 ccRCC samples obtained from RECA‐EU (available in International Cancer Genome Consortium, ICGC), were included in this study.
2.2. Identification of metabolic differentially expressed genes
Forty‐one metabolic pathways were selected according to KEGG pathways atlas. The 911 metabolic genes were utilized for identification of significant metabolic differentially expressed genes (MDEGs) using Limma R package (Version 3.6.3) with FDR < 0.05 and |logFC|>0.5. The intersective metabolic genes between TCGA and CPTAC cohorts were selected for further analyses.
2.3. Development of metabolic prediction models (MPMs) and survival analysis
Univariate Cox regression analysis was used to identify prognostic implications of significant MDEGs and presented in forest plot using the survival R package. Then, LASSO regression analysis was performed to construct the 20‐mRNA signatures model, metabolic prediction models (MPMs), in ccRCC patients from TCGA and CPTAC cohorts with the glmnet and survival R package. A risk score of each ccRCC patient was calculated on the basis of MPMs, and ccRCC patients were thus divided into low‐ and high‐risk groups.
For survival analyses, we selected TCGA and CPTAC cohorts with relevant long‐term survival data from patients at the time of surgical resection and pathologically diagnosed as ccRCC. Survival data were of two types: overall survival and progression‐free survival. Log‐rank test in separate curves and Kaplan‐Meier method with 95% confidence intervals (95%CI) were utilized to performing the follow‐up duration analysis. Meanwhile, survival risk assessment of MPMs and hierarchical clustering was shown in patients from TCGA or CPTAC cohort.
2.4. Cox regression analysis and receiver operating characteristic curve construction
All ccRCC patients from TCGA and CPTAC cohorts with complete transcriptome information and relevant clinical pathologic parameters were included for subsequent analysis. Univariate and multivariable Cox regression analyses were used to evaluate the independent prognostic value of the metabolic clusters using forest plot with the survival R package. The receiver operating characteristic curve (ROC) was constructed for traditional clinical pathologic parameter and the risk score of MPMs in both TCGA and CPTAC cohorts using survival ROC R package. The area under the curve (AUC) was utilized to assess the predictive value of these prognostic signatures. In addition, Nomogram was developed on the basis of all the independent prognostic factors in TCGA cohort.
2.5. Gene set enrichment analyses
Gene set enrichment analyses (GSEA) were performed with a permutation test with 1000 times to find the top enriched signal pathways and significantly involved metabolic pathways the Molecular Signatures Database v4.0 (MSigDB) with Adj. P < 0.01 and FDR < 0.25.
2.6. Tumour microenvironment purity assessment
ESTIMATE algorithm was utilized to evaluate total and immune scores using estimate package (http://r‐forge.rproject.org; repos = rforge, dependencies = TRUE) in patients from TCGA cohort. Associated between tumour microenvironment (TME) purity and risk score of MPMs or G6PC expression was assessed using Pearson's r test.
2.7. Differential G6PC mRNA expression and survival analysis
Protein‐protein interaction network of 20 signatures in MPMs was constructed using Search Tool for the Retrieval of Interacting Genes (STRING; http://string‐db.org, version 10.0) online database. Differential expressed G6PC level was evaluated between ccRCC and normal samples from TCGA, CPTAC and RECA‐EU cohort using Student's t test. Survival analysis of G6PC predicting prognosis ability was performed with GEPIA (http://gepia.cancer‐pku.cn/detail.php###) in patients from TCGA cohort with cut‐off value set as median. Kaplan‐Meier method with 95% confidence intervals (95% CI) and log‐rank test were used in survival analysis in CPTAC, RECA‐EU and FUSCC. Best cut‐off values were set using X‐tile software. All patients at risk or patients numbers in different risk groups were shown in all survival plots.
2.8. Glucose‐6‐phosphatase (G6Pase) expression in ccRCC and normal samples
G6Pase protein expression, coded by G6PC gene, was detected in ccRCC and normal samples from the human protein atlas (https://www.proteinatlas.org/) and immunohistochemistry (IHC) data, including staining quantity, intensity, location and patients’ data, were available online. Formalin‐fixed, paraffin‐embedded ccRCC tissues and human renal tissues were stained for anti‐G6Pase using ab243319 (Abcam, USA) at 1/3000 dilution in FUSCC cohort and then independently evaluated by two experienced pathologists. The overall IHC score ranging from 0 to 12 was measured based on the multiply of the staining intensity and extent score, as previously described. 17 Low G6Pase expression group scores from 0 to 2, and high G6Pase group scores from 3 to 12.
2.9. Immune cell infiltrations of G6PC in ccRCC
TIMER (Tumor IMmune Estimation Resource, https://cistrome.shinyapps.io/timer/) is a web server for evaluating systematic various immune cells infiltration and clinical implications. In this study, correlation between infiltration of immune cells and G6PC copy number variation and expression levels were performed.
2.10. Statistical analysis
All analyses were performed in the R (Version 3.6.0) and RStudio (Version 1.2.1335) and GraphPad Prism 7. Unless otherwise stated, results were considered statistically significant when P‐value < 0.05. Two‐sided and p‐values less than 0.05 were taken as significant in all tests.
3. RESULTS
3.1. Identification of metabolic differential expressed genes (MDEGs) in both TCGA and CPTAC cohorts
The expression of 911 metabolic genes was collected from 534 ccRCC and 72 normal samples in TCGA cohort. At the same time, 905 of 911 metabolic genes were also found from 56 ccRCC patients and 47 normal people in CPTAC cohort. Then, these 905 metabolic genes were utilized for further analysis. 133 significant MDEGs were identified in 905 metabolic genes and visualized in volcano plot (Figure 1A). Hierarchical partitioning of significant MDEGs was acquired from DNA microarrays based on TCGA cohort (Figure 1B). The mRNA expression of these genes was performed across 534 ccRCC patients and 72 normal people with high in red and low in green. Meanwhile, univariate Cox regression analysis of 58 significant MDEGs (P < 0.05) in TCGA cohort was performed in a forest plot (Figure 1C). Markedly, LASSO regression analysis constructed 20‐mRNA signatures model, metabolic prediction models (MPMs), in ccRCC patients of TCGA or CPTAC cohort. Kaplan‐Meier survival analysis showed significant predictive value of the risk score depending on MPMs in TCGA (Figure 1D) or CPTAC cohort (Figure 1E). High‐risk group was marked in red, and low‐risk group was marked in blue.
FIGURE 1.
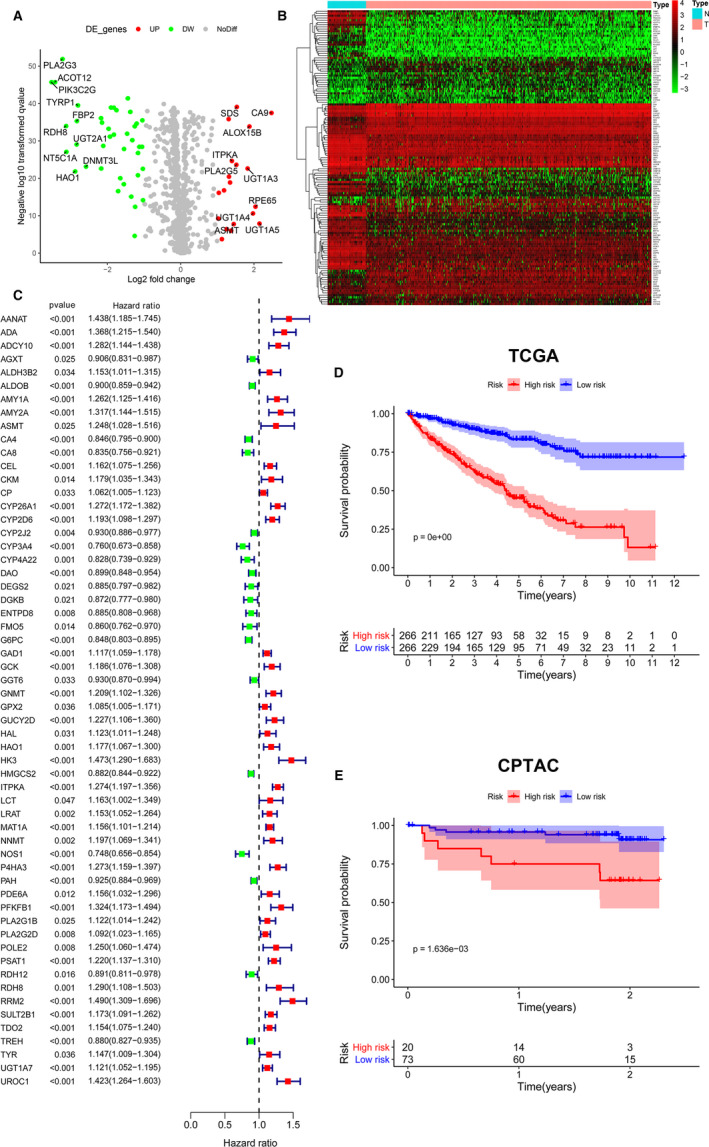
Identification of MDEGs in both TCGA and CPTAC cohorts. A, Identification of significant MDEGs using Limma package in 905 metabolic genes. B, Hierarchical partitioning of significant MDEGs was acquired from DNA microarrays based on TCGA cohort. The mRNA expression of these genes was performed across 534 ccRCC patients and 72 normal people with high in red and low in green. C, Univariate Cox regression analysis of 58 significant MDEGs (P < 0.05) in TCGA cohort was performed in a forest plot. D, The 20‐mRNA signatures model (MPMs) in ccRCC patient was calculated using LASSO regression analysis. Kaplan‐Meier survival analysis showed significant predictive value of the risk score depending on MPMs in TCGA cohort. E, Kaplan‐Meier survival analysis showed significant predictive value of the risk score depending on MPMs in CPTAC cohort. High‐risk group was marked in red, and low‐risk group was marked in blue. MDEGs, metabolic differential expressed genes; MPMs, metabolic prediction models; ccRCC, clear cell renal cell carcinoma; TCGA, the cancer genome atlas; CPTAC, Clinical Proteomic Tumor Analysis Consortium
3.2. Survival risk assessment of MPMs in TCGA or CPTAC cohort
Survival risk assessment of MPMs consisting of metabolic 20‐mRNA signatures was performed in TCGA or CPTAC cohort. The distribution of survival time, status (Figure 2A), risk score (Figure 2B) and hierarchical partitioning (Figure 2C) of MPMs in tumour and normal samples was shown in TCGA cohort. Meanwhile, the distribution of survival time, status (Figure 2D), risk score (Figure 2E) and hierarchical partitioning (Figure 2F) of MPMs in tumour and normal samples was shown in CPTAC cohort.
FIGURE 2.
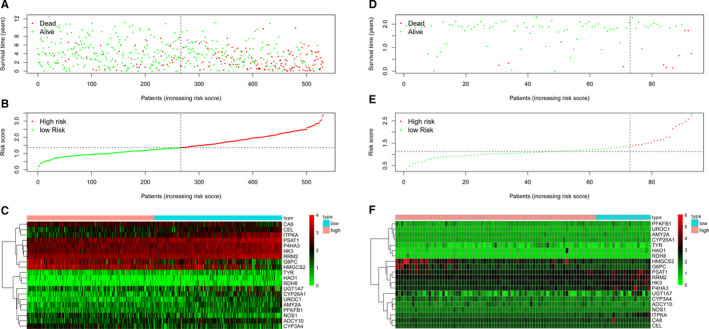
Survival risk assessment of MPMs consists of metabolic 20‐mRNA signatures in TCGA and CPTAC cohorts. A‐C, The distribution of survival time, status, risk score and hierarchical partitioning of 20 signatures in tumour and normal samples was shown in TCGA cohort. D‐F, The distribution of survival time, status, risk score and hierarchical partitioning of 20 signatures in tumour and normal samples was shown in CPTAC cohort. MPMs, metabolic prediction models; TCGA, the cancer genome atlas; CPTAC, Clinical Proteomic Tumor Analysis Consortium
3.3. Cox regression analysis, ROC analysis and Nomogram of independent prognostic factors and MPMs in ccRCC patients
Univariate and multivariate Cox regression analysis enrolling clinical pathologic parameters and MPMs were illustrated in TCGA and CPTAC cohorts using forest plots (Figure 3A‐D). Risk score of MPMs significantly predicts prognosis for ccRCC patients in TCGA (P < 0.001, HR = 3.131) and CPTAC cohorts (P = 0.046, HR = 2.893). In addition, ROC analysis showed robust predictive value of MPMs in TCGA (AUC = 0.768) and CPTAC (AUC = 0.777) cohorts (Figure 3E‐F). A Nomogram was constructed based on 5 independent prognostic factors, including ISUP grade, pathologic M stage, pathologic T stage, AJCC stage and risk score of MPMs, in ccRCC patients (Figure 3G).
FIGURE 3.
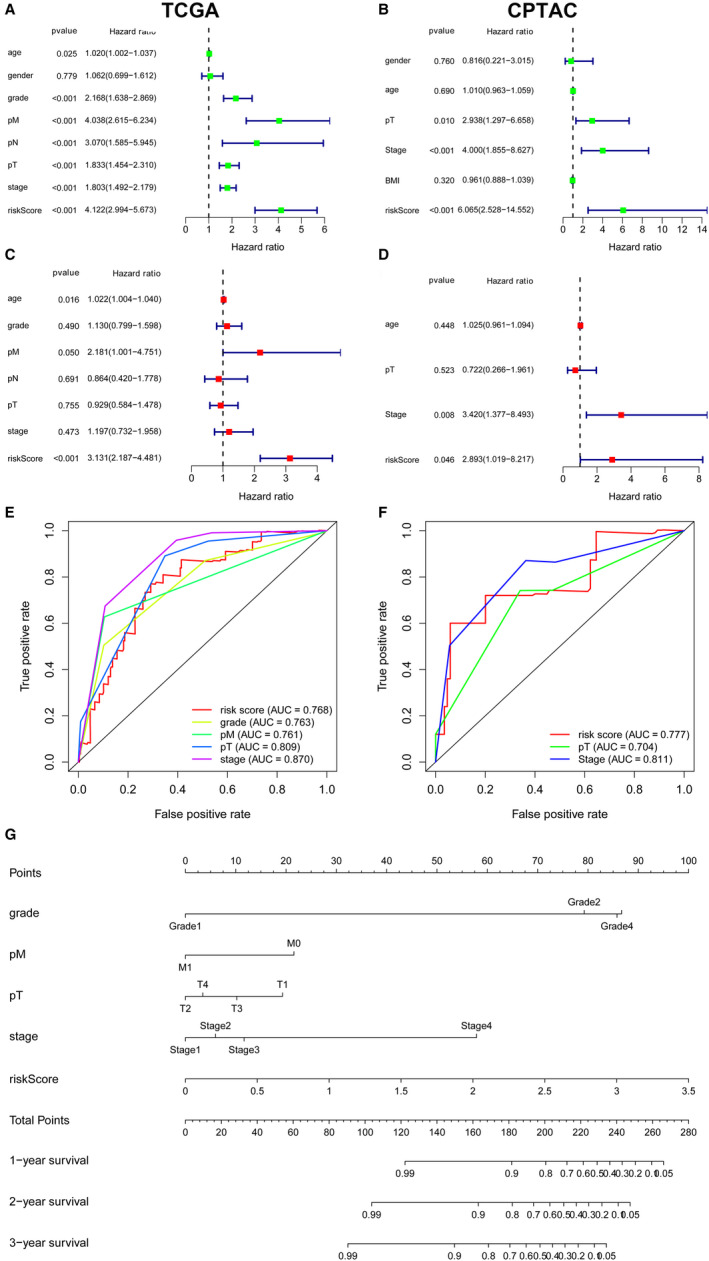
Cox regression analysis, ROC analysis and Nomogram of independent prognostic factors and MPMs in ccRCC patients. A‐D, Univariate and multivariate Cox regression analysis enrolling clinical pathologic parameters and MPMs were illustrated in TCGA and CPTAC cohorts using forest plots. Risk score of MPMs significantly predicts prognosis for ccRCC patients in TCGA (P < 0.001, HR = 3.131) and CPTAC cohorts (P = 0.046, HR = 2.893). E‐F, ROC analysis showed robust predictive value of MPMs in TCGA (AUC = 0.768) and CPTAC (AUC = 0.777) cohorts. G, A Nomogram was constructed based on 5 independent prognostic factors, including ISUP grade, pathologic M stage, pathologic T stage, AJCC stage and risk score of MPMs, in ccRCC patients. MPMs, metabolic prediction models; ccRCC, clear cell renal cell carcinoma; TCGA, the cancer genome atlas; CPTAC, Clinical Proteomic Tumor Analysis Consortium
3.4. KEGG pathways analysis using GSEA
GSEA indicated significantly altered KEGG pathways based on differential risk score of MPMs in ccRCC patients with available transcriptomics data from TCGA and CPTAC cohorts. Top 5 significantly altered KEGG pathways in high‐ or low‐risk ccRCC patients were performed in TCGA (Figure 4A) or CPTAC (Figure 4B) cohort. Metabolic significant KEGG pathways in high‐ or low‐risk ccRCC patients were performed in TCGA (Figure S1A) or CPTAC (Figure S1B) cohort. Tumour environment purity was measured using ESTIMATE algorithm, which showed a significant relationship with risk score of MPMs in ccRCC patients from TCGA cohort (r 2 = 0.2373, P < 0.0001) (Figure 4C). Meanwhile, immune purity in ccRCC environment significantly correlated with risk score of MPMs (r 2 = 0.3007, P < 0.0001) (Figure 4D).
FIGURE 4.
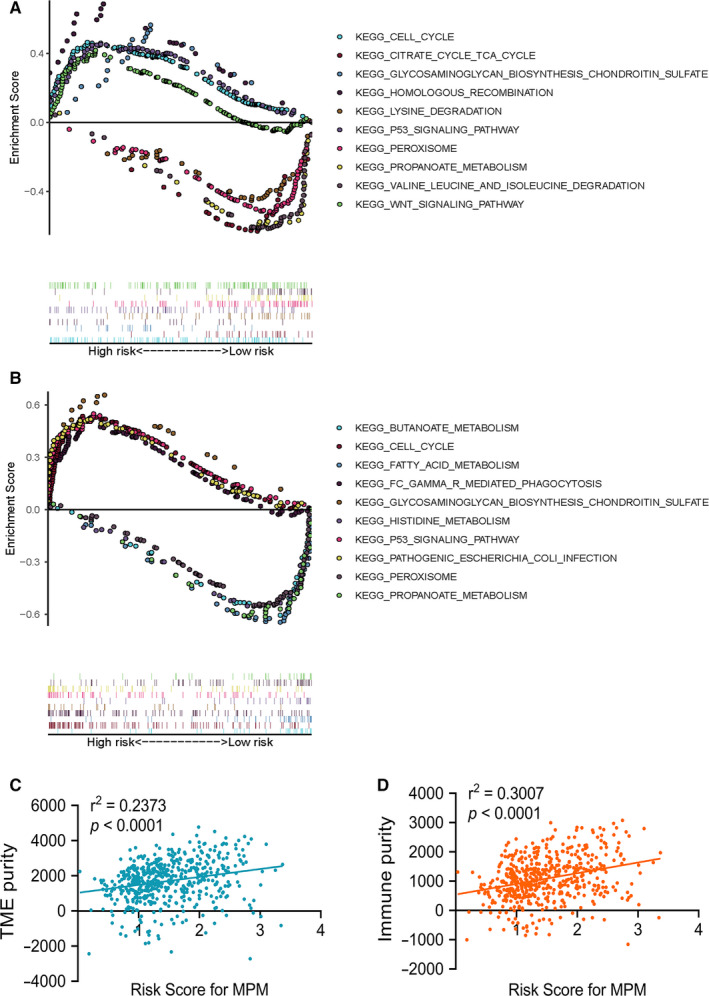
GSEA indicated significantly altered KEGG pathways based on differential risk score of MPMs in ccRCC patients with available transcriptomics data from TCGA and CPTAC cohorts. A, Top 5 significantly altered KEGG pathways in high‐ or low‐risk ccRCC patients in TCGA cohort. B, Top 5 significantly altered significant KEGG pathways in high‐ or low‐risk ccRCC patients of CPTAC cohort. C, Tumour environment purity was measured using ESTIMATE algorithm and showed a significant relationship with risk score of MPMs in ccRCC patients from TCGA cohort (r 2 = 0.2373, P < 0.0001). D, Immune purity in ccRCC environment significantly correlated with risk score of MPMs (r 2 = 0.3007, P < 0.0001). GSEA, gene set enrichment analysis; KEGG, Kyoto Encyclopedia of Genes and Genomes; MPMs, metabolic prediction models; ccRCC, clear cell renal cell carcinoma; TCGA, the cancer genome atlas; CPTAC, Clinical Proteomic Tumor Analysis Consortium
3.5. The hub gene in PPI network of MPMs
G6PC, a hub gene in PPI network of MPMs, shows significant prognostic value in 699 ccRCC patients from TCGA, CPTAC and ICGC cohorts. PPI network was constructed in 20 metabolic mRNA signatures in MPMs (Figure 5A). Interestingly, because of relatively low protein expression in tumour samples, the mRNA and proteome expression levels are in significant linear relationship (Figure S2A, P < 0.001, r = 0.371). In transcriptional levels, transcription factor regulation, related LncRNA, targeted miRNA, activation and inhibition of G6PC networks were constructed in Figure S2B G6PC mRNA expression showed a negatively relationship with tumour environment purity (r 2 = −0.1012, P < 0.0001) and immune purity (r 2 = −0.1205, P < 0.0001) in ccRCC (Figure 5B and C). Differential mRNA expression of G6PC in ccRCC and adjacent normal tissues was displayed based on TCGA, CPTAC and RECA‐EU cohorts (Figure 5D‐F). In addition, Kaplan‐Meier survival analysis indicated that low G6PC mRNA expression level significantly correlated with poor OS (P < 0.0001, HR = 0.35) and PFS (P < 0.0001, HR = 0.35) in TCGA cohort (Figure 5G and H). Low G6PC mRNA expression level was significantly associated with poor prognosis in CPTAC (P = 0.0035, HR = 0.218) and RECA‐EU (P = 0.0443, HR = 0.446) cohorts (Figure 5I and J).
FIGURE 5.
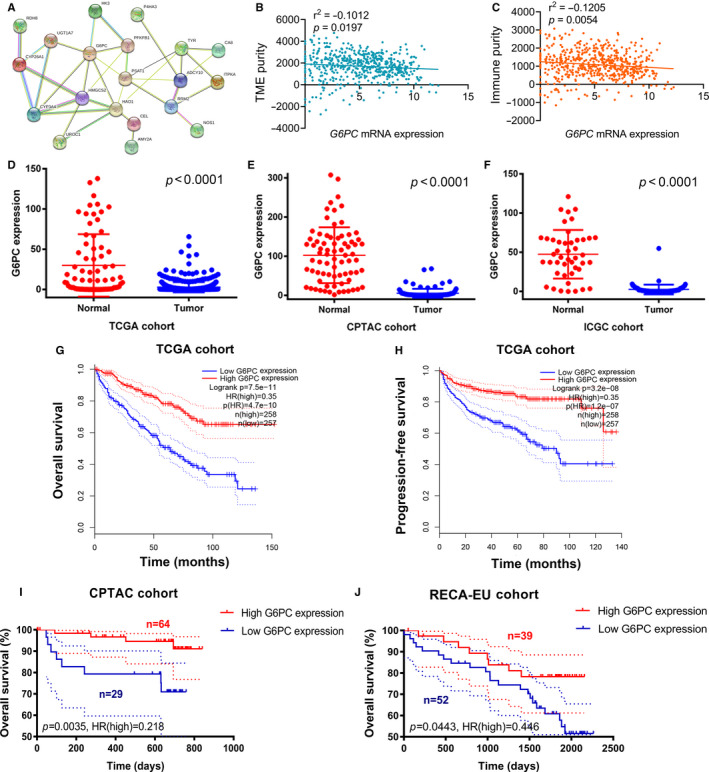
G6PC, a hub gene in PPI network of MPMs, shows significant prognostic value in 699 ccRCC patients from TCGA, CPTAC and RECA‐EU cohorts. A, PPI network was constructed in 20 metabolic mRNA signatures in MPMs. B and C, G6PC mRNA expression showed a negatively relationship with tumour environment purity (r 2 = −0.1012, P < 0.0001) and immune purity (r 2 = −0.1205, P < 0.0001) in ccRCC. D‐F, Differential mRNA expression of G6PC in ccRCC and adjacent normal tissues was displayed based on TCGA, CPTAC and RECA‐EU (public data at ICGC) cohorts. G‐H, Kaplan‐Meier survival analysis indicated that low G6PC mRNA expression level significantly correlated with poor OS (P < 0.0001, HR = 0.35) and PFS (P < 0.0001, HR = 0.35). I, Low G6PC mRNA expression level was significantly associated with poor prognosis in CPTAC (P = 0.0035, HR = 0.218) and ICGA (P = 0.0443, HR = 0.446) cohorts. PPI, protein‐protein interaction; MPMs, metabolic prediction models; ccRCC, clear cell renal cell carcinoma; TCGA, the cancer genome atlas; CPTAC, Clinical Proteomic Tumor Analysis Consortium; ICGC, International Cancer Genome Consortium
3.6. Differential G6Pase expression predicts outcomes in FUSCC cohort
A total of 322 ccRCC patients from FUSCC cohort were enrolled. G6Pase was detected high expressed in normal kidney tissues (specifically in tubules cells rather than glomeruli cells), while not detected in ccRCC tissues from the Human Protein atlas (Figure 6A). Meanwhile, significantly elevated G6Pase expression was found in normal tissues compared with ccRCC tissues from FUSCC cohort (Figure 6B). Clinicopathological characteristics in relation to G6Pase expression status were shown in 322 ccRCC patients from FUSCC cohort (Table S1). Traditionally clinicopathological factors, such as TNM stage or ISUP grade, were significantly correlated with G6Pase expression level in tumour samples (P < 0.05). In addition, low G6Pase expression was significantly correlated with poor prognosis (P < 0.0001, HR = 0.316) and aggressive progression (P < 0.0001, HR = 0.414) in 322 ccRCC patients from FUSCC cohort (Figure 6C and D).
FIGURE 6.
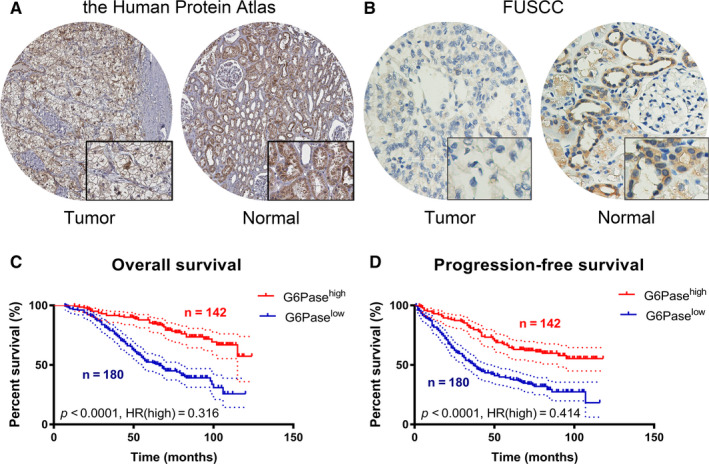
Differential G6Pase expression predicts outcomes in 322 ccRCC patients from FUSCC cohorts. A, G6Pase was detected high expressed in normal kidney tissues (specifically in tubules cells rather than glomeruli cells), while not detected in ccRCC tissues from the Human Protein atlas. B, Significantly elevated G6Pase expression was found in normal tissues compared with ccRCC tissues from FUSCC cohort. C‐D, Low G6Pase expression was significantly correlated with poor prognosis (P < 0.0001, HR = 0.316) and aggressive progression (P < 0.0001, HR = 0.414) in 322 ccRCC patients from FUSCC cohort. ccRCC, clear cell renal cell carcinoma; FUSCC, Fudan University Shanghai Cancer Center
3.7. Most co‐expressed genes and promoter methylation levels of G6PC in ccRCC
Top 50 co‐expression genes with G6PC were extracted and shown in heat map in ccRCC (Figure 7A and B). Promoter methylation levels of G6PC were significantly lower in primary ccRCC samples than normal samples (Figure 7C, P < 0.0001). Promoter methylation levels of G6PC significantly climbed with elevated individual cancer stage and were the highest in samples with stage 4 (Figure 7D). Promoter methylation levels of G6PC significantly climbed with elevated individual tumour grade and were the highest in samples with grade 4 (Figure 7E). Promoter methylation levels of G6PC were significantly higher in ccRCC samples with nodal metastasis compared with pN0 patients (Figure 7F, P < 0.05).
FIGURE 7.
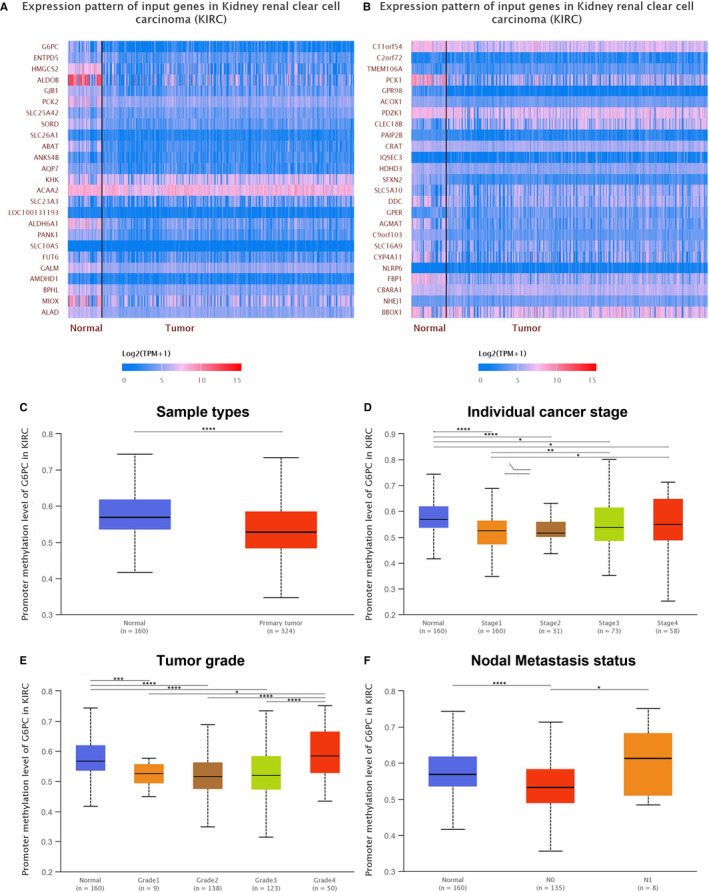
Most co‐expressed genes and promoter methylation levels of G6PC in ccRCC. A and B, Top 50 co‐expression genes with G6PC were extracted and shown in heat map in ccRCC. C, Promoter methylation levels of G6PC were significantly lower in primary ccRCC samples than normal samples (P < 0.0001). D, Promoter methylation levels of G6PC significantly climbed with elevated individual cancer stage and were the highest in samples with stage 4. E, Promoter methylation levels of G6PC significantly climbed with elevated individual tumour grade and were the highest in samples with grade 4. F, Promoter methylation levels of G6PC were significantly higher in ccRCC samples with nodal metastasis compared with pN0 patients (P < 0.05). ccRCC, clear cell renal cell carcinoma; pN0, pathological negative nodal metastasis status
3.8. Potential role of G6PC in ccRCC immune microenvironment
As the main regulator of glucose production, G6PC is highly expressed in liver and kidney tissues. G6PC expression is significantly higher in normal tissue compared with renal cell carcinomas, while significantly lower in normal samples compared with hepatocellular carcinoma and cholangiocarcinoma (Figure 8A). At the same time, copy number alteration of G6PC significantly correlated with environmental immune cells infiltration level (Figure 8B). Elevated arm‐level deletion of G6PC leads to inferior B cell, CD8+ cells, CD4+ cells, macrophage, neutrophil, dendritic cells infiltration compared with normal samples (P < 0.05). In addition, G6PC significantly participates in abnormal immune infiltration of ccRCC cells and microenvironment, showing significantly negative association with check‐point immune signatures, dendritic cells, Th1 cells, MHC class I, cytolytic activity, inflammation promotion, HLA, APC co‐inhibition and co‐stimulation activities (cor.< −0.7, Figure 8C). Moreover, GSEA indicated that G6PC significantly involved in several signal pathways, including bile acid metabolism, fatty acid metabolism, epithelial mesenchymal transition and E2F targets in ccRCC (Figure 8D‐G). A total of 100 up‐ and down‐regulated genes associated with differential G6PC expression were then visualized in ccRCC (Figure S3). Spearman's correlation and estimated statistical significance between G6PC expression and related genes and markers of immune cells were displayed in ccRCC patients using TIMER (Table 1 ).
FIGURE 8.
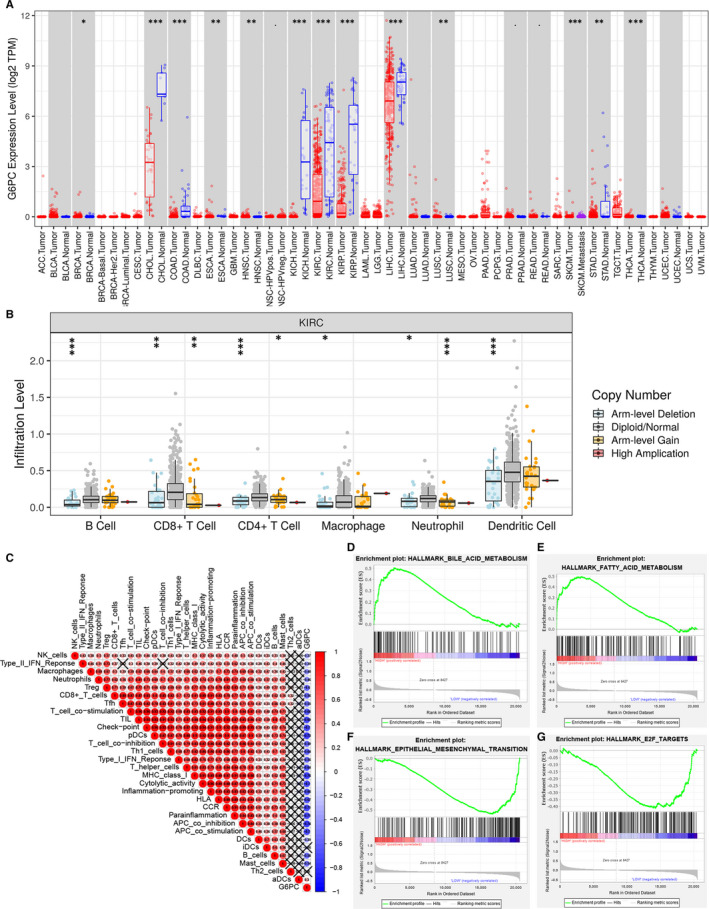
Potential role of G6PC in pan‐cancers and ccRCC microenvironment. A, As the main regulator of glucose production in the liver, high G6PC active expression is found in liver and kidney tissues. G6PC expression is significantly higher in normal tissue compared with renal cell carcinoma (KIRC, KIRP, KICH), while significantly lower in normal samples compared with hepatocellular carcinoma and cholangiocarcinoma. B, Copy number alteration of G6PC significantly correlated with environmental immune cells infiltration level. Elevated arm‐level deletion of G6PC leads to inferior B cell, CD8+ cells, CD4+ cells, macrophage, neutrophil, dendritic cells infiltration compared with normal samples (P < 0.05). C, G6PC significantly participates in abnormal immune infiltration of ccRCC cells and microenvironment, showing significantly negative association with check‐point immune signatures, dendritic cells, Th1 cells, MHC class I, cytolytic activity, inflammation promotion, HLA, APC co‐inhibition and co‐stimulation activities (cor.<−0.7). D‐G, GSEA indicated that G6PC significantly involved in several signal pathways, including bile acid metabolism, fatty acid metabolism, epithelial mesenchymal transition and E2F targets in ccRCC. ccRCC, clear cell renal cell carcinoma; KIRC, kidney renal clear cell carcinoma; KIRP, kidney renal papillary cell carcinoma; KICH, kidney Chromophobe; GSEA, gene set enrichment analysis
TABLE 1.
Immune cells infiltrations in relationship to G6PC expression
| Description | Gene markers | G6PC | |||
|---|---|---|---|---|---|
| None | Purity | ||||
| Cor | P | Cor | P | ||
| CD8 + T cell | CD8A | −0.032 | .468 | −0.004 | .94 |
| CD8B | −0.008 | .862 | 0.022 | .637 | |
| T cell (general) | CD3D | −0.081 | .061 | −0.052 | .204 |
| CD3E | −0.067 | .124 | −0.037 | .427 | |
| CD2 | −0.071 | .104 | −0.042 | .369 | |
| B cell | CD19 | −0.18 | **** | −0.151 | ** |
| CD79A | −0.222 | **** | −0.209 | **** | |
| Monocyte | CD86 | −0.157 | *** | −0.142 | ** |
| CD115 (CSF1R) | −0.146 | *** | −0.132 | ** | |
| TAM | CCL2 | 0.083 | .054 | 0.108 | * |
| CD68 | −0.084 | .054 | −0.126 | ** | |
| IL10 | −0.109 | * | −0.087 | .062 | |
| M1 Macrophage | INOS (NOS2) | 0.194 | **** | 0.216 | **** |
| IRF5 | −0.089 | * | −0.112 | * | |
| COX2 (PTGS2) | −0.252 | **** | −0.212 | **** | |
| M2 Macrophage | CD163 | −0.092 | * | −0.095 | * |
| VSIG4 | −0.232 | **** | −0.234 | **** | |
| MS4A4A | −0.136 | ** | −0.12 | ** | |
| Neutrophils | CD66b (CEACAM8) | 0.064 | .138 | 0.047 | .311 |
| CD11b (ITGAM) | −0.093 | * | −0.085 | .069 | |
| CCR7 | −0.085 | * | −0.08 | .087 | |
| Natural killer cell | KIR2DL1 | 0.108 | * | 0.089 | .055 |
| KIR2DL3 | 0.087 | * | 0.065 | .163 | |
| KIR2DL4 | −0.057 | .192 | −0.053 | .252 | |
| KIR3DL1 | 0.163 | *** | 0.137 | ** | |
| KIR3DL2 | 0.094 | * | 0.077 | .101 | |
| KIR3DL3 | −0.052 | .232 | −0.051 | .276 | |
| KIR2DS4 | 0.025 | .567 | 0.02 | .67 | |
| Dendritic cell | HLA‐DPB1 | 0.025 | .572 | 0.038 | .411 |
| HLA‐DQB1 | 0.073 | .091 | 0.081 | .082 | |
| HLA‐DRA | 0.022 | .615 | 0.028 | .553 | |
| HLA‐DPA1 | 0.04 | .355 | 0.062 | .186 | |
| BDCA‐1 (CD1C) | 0.148 | *** | 0.185 | **** | |
| BDCA‐4 (NRP1) | 0.128 | ** | 0.136 | ** | |
| CD11c (ITGAX) | −0.125 | ** | −0.123 | ** | |
| Th1 | T‐bet (TBX21) | 0.076 | .079 | 0.089 | .057 |
| STAT4 | −0.108 | * | −0.108 | * | |
| STAT1 | −0.061 | .163 | −0.048 | .304 | |
| IFN‐γ (IFNG) | −0.089 | * | −0.078 | .095 | |
| TNF‐α (TNF) | 0.008 | .861 | 0.023 | .623 | |
| Th2 | GATA3 | −0.173 | **** | −0.083 | .073 |
| STAT6 | 0.08 | .066 | 0.056 | .227 | |
| STAT5A | −0.167 | *** | −0.151 | ** | |
| IL13 | −0.009 | .844 | −0.027 | .565 | |
| Tfh | BCL6 | −0.198 | **** | −0.238 | **** |
| IL21 | −0.137 | ** | −0.13 | ** | |
| Th17 | STAT3 | −0.091 | * | −0.081 | .081 |
| IL17A | −0.044 | .31 | −0.022 | .636 | |
| Treg | FOXP3 | −0.217 | **** | −0.212 | **** |
| CCR8 | −0.111 | * | −0.106 | * | |
| STAT5B | 0.343 | **** | 0.325 | **** | |
| TGFβ (TGFB1) | −0.325 | **** | −0.315 | **** | |
| T cell exhaustion | PD‐1 (PDCD1) | −0.068 | .116 | −0.051 | .273 |
| CTLA4 | −0.115 | ** | −0.102 | * | |
| LAG3 | −0.115 | ** | −0.095 | * | |
| TIM‐3 (HAVCR2) | 0.173 | **** | 0.157 | *** | |
| GZMB | −0.043 | .319 | −0.034 | .46 | |
* P< 0.05; ** P< 0.01; *** P< 0.001; **** P< 0.0001.
4. DISCUSSION
The control of energy metabolism in human is a complex and cautious process, and metabolic disorders may lead to the occurrence and development of a variety of diseases. 18 For instance, abnormal lipid metabolism may reduce growth and impair fertility, while disorders in glucose metabolism can lead to diabetes and hypertension. 19 , 20 Importantly, the relationship between metabolic reprogramming and tumorigenesis has been paid more and more attention in recent years. Steven L. Gonias et al claimed that activation of lipid metabolism promotes tumour cell survival and tumour progression in pancreatic cancer. 21 Some studies found that abnormal glucose metabolism plays an key role in tumorigenesis. 22 , 23 Metabolic changes promote the proliferation of tumours microenvironment and also help us better understand the alterations of characteristics phenotypes and immune microenvironment of cancers. 24 For example, the activation of PI3K/AKT/mTOR and other carcinogenic pathways is related to the changes of bioenergy pathways such as glycolysis, fatty acid and glutamine metabolism, which provides a new target for tumour therapy. 25 , 26 , 27
ccRCC is one of the most common types of renal cell carcinoma in the world, and it is associated with poor prognosis because of its high metastasis and recurrence rate. 1 , 28 Metabolic reprogramming in ccRCC is most often associated with mutations in VHL, which occur in about 90% of cases. 29 In VHL mutant diseases, activation of metabolic pathways mediated by HIF leads to the activation of pathways contrary to the effects of hypoxia in normoxic environments. 30 Previous studies found that ccRCC produces energy mainly through the accumulation of lactic acid, 31 , 32 which is also called Warburg effect or aerobic glycolysis. HIF‐1α, as the obvious driving force behind the Warburg effect in ccRCC, increases the expression of GLUT‐1, thus promoting intracellular glucose uptake. 33 , 34 Interestingly, complex components in tumour microenvironment could exhibit metabolic stress on immune cells infiltrations, which can lead to immunosuppressive and tumour immune evasion. 24 The increased expression of GLUT‐1 in ccRCC is associated with a decrease in the number of infiltrated CD8+T cells, suggesting that glucose metabolism may suppress the immune system through another mechanism in renal cell carcinoma. 35 Normally, elevated glycolysis increases tumours immunity, immune check‐point factors (PD‐L1) expression levels on tumour cells, and thus imposed a favourable immunotherapy response in cancers. 36 Thus, the relationship between metabolic reprogramming and ccRCC microenvironment was worthy of further exploration.
G6PC (Glucose‐6‐Phosphatase Catalytic Subunit) is a protein coding gene, and it is closely associated with glycogen storage disease 37 and hypoglycaemia. 38 Gross, D. N et al claimed that G6PC was related to FoxO1 signalling pathway 39 and G6PC plays a key role in Hexose transport. 40 This study found that expression of G6PC in ccRCC is much lower than that of normal tissues in multiple cohorts including TCGA, CPTAC, ICGC and FUSCC cohorts. And survival analyses indicated that expression level of G6PC was positively correlated with patients’ outcome, suggesting that G6PC may have tumour suppressive properties in ccRCC. Studies have focused on exploring the biological significance of G6PC. Ting Guo et al 41 found that G6PC plays a dual role in both glucose metabolism and cell cycle regulation in ovarian cancer, which makes it a promising therapeutic target. Glycogen storage disease type I (GSDI) is a rare hereditary pathology characterized by glucose‐6‐phosphatase (G6Pase) deficiency. Monika Gjorgjieva et al found occurrence of ccRCC in mouse model with a kidney‐specific G6Pase deficiency (K. G6pc‐/‐ mice). 42 It is not a unique instance, but has its counterpart. Cho Jun‐Ho et al 43 also claimed that G6PC could inhibit the occurrence of hepatic carcinoma, which is compatible with our hypothesis. In view of the possible inhibitory effect on tumour cells of G6PC, it may shed light on the management of ccRCC.
Thus, our research has some limitations. The main thing is the retrospective design of this study. Multicenter prospective studies are needed to verify the conclusions. Also, we did not validate prognostic specificity and sensitivity of MPMs in ccRCC patients from a real‐world cohort; thus, we presented prognostic value of MPMs in CRTAC and validate role of G6PC in > 1000 ccRCC patients from TCGA, CPTAC, RECA‐EU, HPA and FUSCC (validation cohort in China) cohorts. In addition, there is an urgent need for in vitro and in vivo experiments to explore potential effective functions of G6PC and reveal the underlying mechanisms.
5. CONCLUSION
In conclusion, this study first provided the opportunity to comprehensively elucidate the prognostic MDEGs landscape, established novel prognostic model MPMs using large‐scale ccRCC transcriptome data and identified G6PC as potential prognostic targets in 1040 ccRCC patients from multiply cohorts. These finding could assist in managing risk assessment and shed valuable insights into treatment strategies of ccRCC.
CONFLICT OF INTERESTS
The authors declare no competing interests.
AUTHORS’ CONTRIBUTIONS
The work was performed in co‐operation with all authors. YDW, ZHL and QYY defined research topics, discussed analysis, supervise studies, provided funding and revised manuscript. XWH, XY and TX drafted the manuscript, analysed data, interpreted and validated the results. AA, LWR and CDL assisted in performing data collection, statistical analysis and reference collection. WHK and SGH helped in IHC analysis and patients information collection from FUSCC. All authors read and approved the final manuscript. Wen‐Hao Xu: Data curation (equal); Formal analysis (equal); Investigation (equal); Methodology (equal); Resources (equal); Software (equal); Visualization (equal); Writing‐original draft (lead). Yue Xu: Data curation (equal); Formal analysis (equal); Investigation (equal); Methodology (equal); Resources (equal); Software (equal); Validation (equal); Visualization (equal). Xi Tian: Data curation (equal); Formal analysis (equal); Methodology (equal); Resources (equal); Software (equal); Validation (equal); Visualization (equal). Aihetaimujiang Anwaier: Data curation (supporting); Formal analysis (supporting); Investigation (equal); Methodology (supporting); Software (supporting); Writing‐original draft (supporting). Wangrui Liu: Data curation (supporting); Formal analysis (supporting); Methodology (supporting); Software (equal); Visualization (supporting). Jun Wang: Conceptualization (supporting); Investigation (supporting); Methodology (equal); Software (supporting); Visualization (supporting). Wen‐Kai Zhu: Conceptualization (supporting); Data curation (supporting); Investigation (supporting); Methodology (supporting); Project administration (supporting). Da‐Long Cao: Conceptualization (supporting); Investigation (supporting); Methodology (supporting); Resources (equal); Validation (supporting). Hong‐Kai Wang: Data curation (supporting); Investigation (supporting); Methodology (supporting); Resources (supporting); Supervision (supporting). Guo‐Hai Shi: Conceptualization (supporting); Methodology (supporting); Project administration (supporting); Resources (supporting); Supervision (supporting). Yuan‐Yuan Qu: Conceptualization (equal); Funding acquisition (equal); Project administration (equal); Resources (equal); Supervision (equal); Writing‐review & editing (equal). Hai‐Liang Zhang: Conceptualization (equal); Funding acquisition (equal); Project administration (equal); Resources (equal); Supervision (equal); Writing‐review & editing (equal). Ding‐Wei Ye: Conceptualization (equal); Project administration (equal); Resources (equal); Supervision (equal); Writing‐review & editing (equal).
DECLARATIONS
Ethics approval and consent to participate: Study Ethics procedures were approved by Fudan University Shanghai Cancer Center (FUSCC, Shanghai, China). Written informed consents were acquired from online open‐access TCGA, CPTAC and RECA‐EU (available in ICGC database) included in this study.
PATIENT CONSENT FOR PUBLICATION
Not applicable.
Supporting information
Fig S1
Fig S2
Fig S3
Table S1
ACKNOWLEDGEMENTS
We thank the TCGA, CPTAC and ICGC database for survival data and gene expression profiles of ccRCC.
Xu W‐H, Xu Y, Tian X, et al. Large‐scale transcriptome profiles reveal robust 20‐signatures metabolic prediction models and novel role of G6PC in clear cell renal cell carcinoma. J Cell Mol Med. 2020;24:9012–9027. 10.1111/jcmm.15536
Wen‐Hao Xu, Yue Xu, Xi Tian these authors contribute equally.
Funding information
This work is supported by Grants from the National Key Research and Development Project (No.2019YFC1316000) and National Natural Science Foundation of China (No.81802525).
DATA AVAILABILITY STATEMENT
The data sets analysed in this study were obtained from online open‐access databases or corresponding authors upon reasonable request.
REFERENCES
- 1. Siegel RL, Miller KD, Jemal A. Cancer statistics, 2020. CA Cancer J Clin. 2020;70(1):7‐30. [DOI] [PubMed] [Google Scholar]
- 2. Miller KD, Nogueira L, Mariotto AB, et al. Cancer treatment and survivorship statistics, 2019. CA Cancer J Clin. 2019;69(5):363‐385. [DOI] [PubMed] [Google Scholar]
- 3. Motzer RJ, Rini BI, McDermott DF, et al. Nivolumab plus ipilimumab versus sunitinib in first‐line treatment for advanced renal cell carcinoma: extended follow‐up of efficacy and safety results from a randomised, controlled, phase 3 trial. Lancet Oncol. 2019;20(10):1370‐1385. [DOI] [PMC free article] [PubMed] [Google Scholar]
- 4. Escudier B, Sharma P, McDermott DF, et al. CheckMate 025 randomized Phase 3 study: Outcomes by key baseline factors and prior therapy for nivolumab versus everolimus in advanced renal cell carcinoma. Eur Urol. 2017;72(6):962‐971. [DOI] [PubMed] [Google Scholar]
- 5. Motzer RJ, Tykodi SS, Escudier B, et al. Final analysis of the CheckMate 025 trial comparing nivolumab (NIVO) versus everolimus (EVE) with> 5 years of follow‐up in patients with advanced renal cell carcinoma (aRCC). J Clin Onncol. Abstract 617. 2020. [Google Scholar]
- 6. Escudier B, Motzer RJ, Sharma P, et al. Treatment beyond progression in patients with advanced renal cell carcinoma treated with Nivolumab in CheckMate 025. Eur Urol. 2017;72(3):368‐376. [DOI] [PubMed] [Google Scholar]
- 7. Chen DS, Mellman I. Elements of cancer immunity and the cancer‐immune set point. Nature. 2017;541(7637):321‐330. [DOI] [PubMed] [Google Scholar]
- 8. Brück O, Blom S, Dufva O, et al. Immune cell contexture in the bone marrow tumor microenvironment impacts therapy response in CML. Leukemia. 2018;32(7):1643‐1656. [DOI] [PubMed] [Google Scholar]
- 9. Kawakami F, Sircar K, Rodriguez‐Canales J, et al. Programmed cell death ligand 1 and tumor‐infiltrating lymphocyte status in patients with renal cell carcinoma and sarcomatoid dedifferentiation. Cancer. 2017;123(24):4823‐4831. [DOI] [PMC free article] [PubMed] [Google Scholar]
- 10. Fridman WH, Zitvogel L, Sautès–Fridman C, et al. The immune contexture in cancer prognosis and treatment. Nat Rev Clin Oncol. 2017;14(12):717‐734. [DOI] [PubMed] [Google Scholar]
- 11. Xu W‐H, Shi S‐N, Xu Y, et al. Prognostic implications of Aquaporin 9 expression in clear cell renal cell carcinoma. J Transl Med. 2019;17(1):363. [DOI] [PMC free article] [PubMed] [Google Scholar]
- 12. Wettersten HI, Hakimi AA, Morin D, et al. Grade‐dependent metabolic reprogramming in kidney cancer revealed by combined proteomics and metabolomics analysis. Cancer Res. 2015;75(12):2541‐2552. [DOI] [PMC free article] [PubMed] [Google Scholar]
- 13. Chang C‐H, Qiu J, O’Sullivan D, et al. Metabolic competition in the tumor microenvironment is a driver of cancer progression. Cell. 2015;162(6):1229‐1241. [DOI] [PMC free article] [PubMed] [Google Scholar]
- 14. Sun H, et al. FAM111B, a direct target of p53, promotes the malignant process of lung adenocarcinoma. Onco Targets Ther. 2019;12:2829‐2842. [DOI] [PMC free article] [PubMed] [Google Scholar]
- 15. Xu W‐H, Xu Y, Wang J, et al. Prognostic value and immune infiltration of novel signatures in clear cell renal cell carcinoma microenvironment. Aging (Albany NY). 2019;11(17):6999‐7020. [DOI] [PMC free article] [PubMed] [Google Scholar]
- 16. Wu J, et al. An integrated score and nomogram combining clinical and immunohistochemistry factors to predict high ISUP grade clear cell renal cell carcinoma. Front Oncol. 2018;8:634. [DOI] [PMC free article] [PubMed] [Google Scholar]
- 17. Wang J, Xu W‐H, Wei YU, et al. Elevated MRE11 expression associated with progression and poor outcome in prostate cancer. J Cancer. 2019;10(18):4333‐4340. [DOI] [PMC free article] [PubMed] [Google Scholar]
- 18. Malloy PJ, Feldman BJ. Cell‐autonomous regulation of brown fat identity gene UCP1 by unliganded vitamin. D receptor. 2013;27(10):1632‐1642. [DOI] [PMC free article] [PubMed] [Google Scholar]
- 19. Mbata O, El‐Magd NFA, El‐Remessy AB. Obesity, metabolic syndrome and diabetic retinopathy: Beyond hyperglycemia. World Journal of Diabetes. 2017;8(7):317‐329. [DOI] [PMC free article] [PubMed] [Google Scholar]
- 20. Egan BM, Hennes MMI, Stepniakowski KT, et al. Obesity hypertension is related more to insulin’s fatty acid than glucose action. Hypertension. 1996;27(3):723‐728. [DOI] [PubMed] [Google Scholar]
- 21. Gonias SL, Karimi‐Mostowfi N, Murray SS, et al. Expression of LDL receptor‐related proteins (LRPs) in common solid malignancies correlates with patient survival. PLoS One. 2017;12(10):e0186649. [DOI] [PMC free article] [PubMed] [Google Scholar]
- 22. Hanahan D, Weinberg R. Hallmarks of cancer: The next generation. Cell. 2011;144(5):646‐674 [DOI] [PubMed] [Google Scholar]
- 23. Robey RB, Hay N. Is Akt the “Warburg kinase”?—Akt‐energy metabolism interactions and oncogenesis. Semin Cancer Biol. 2009;19(1):25‐31. [DOI] [PMC free article] [PubMed] [Google Scholar]
- 24. Li X, Wenes M, Romero P, et al. Navigating metabolic pathways to enhance antitumour immunity and immunotherapy. Nat Rev Clin Oncol. 2019;16(7):425‐441. [DOI] [PubMed] [Google Scholar]
- 25. Hsu PP, Sabatini DM. Cancer cell metabolism: Warburg and beyond. Cell. 2008;134(5):703‐707. [DOI] [PubMed] [Google Scholar]
- 26. Romanska HM, Tiziani S, Howe RC, et al. Nuclear Magnetic Resonance detects phosphoinositide 3‐kinase/Akt‐independent traits common to pluripotent murine embryonic stem cells and Their malignant counterparts. Neoplasia. 2009;11(12):1301‐1308. [DOI] [PMC free article] [PubMed] [Google Scholar]
- 27. Vander Heiden MG, Locasale JW, Swanson KD, et al. Evidence for an alternative glycolytic pathway in rapidly proliferating cells. Science. 2010;329(5998):1492‐1499. [DOI] [PMC free article] [PubMed] [Google Scholar]
- 28. Myszczyszyn A, Czarnecka AM, Matak D, et al. The role of hypoxia and cancer stem cells in renal cell carcinoma. Pathogenesis. 2015;11(6):919‐943. [DOI] [PMC free article] [PubMed] [Google Scholar]
- 29. Nickerson ML, Jaeger E, Shi Y, et al. Improved identification of von hippel‐lindau gene alterations in clear cell renal tumors. Clin Cancer Res. 2008;14(15):4726‐4734. [DOI] [PMC free article] [PubMed] [Google Scholar]
- 30. Kaelin WG. The von hippel‐lindau tumor suppressor gene and kidney cancer. Clin Cancer Res. 6290S;10(18):6290S‐6295S. [DOI] [PubMed] [Google Scholar]
- 31. Perroud B, Ishimaru T, Borowsky AD, et al. Grade‐dependent proteomics characterization of kidney cancer. 2009;8(5):971‐985. [DOI] [PMC free article] [PubMed] [Google Scholar]
- 32. Perroud B, Lee J, Valkova N, et al. Pathway analysis of kidney cancer using proteomics and metabolic profiling. Mol. Cancer 2006;5:64. [DOI] [PMC free article] [PubMed] [Google Scholar]
- 33. Mandriota SJ, Turner KJ, Davies DR, et al. HIF activation identifies early lesions in VHL kidneys. Cancer Cell. 2002;1(5):459‐468. [DOI] [PubMed] [Google Scholar]
- 34. Wang J, Xu W, Wang B, et al. GLUT1 is an AR target contributing to tumor growth and glycolysis in castration‐resistant and enzalutamide‐resistant prostate cancers. Cancer Lett. 2020. [DOI] [PubMed] [Google Scholar]
- 35. Fischer K, Hoffmann P, Voelkl S, et al. Inhibitory effect of tumor cell–derived lactic acid on human T cells. Blood. 2007;109(9):3812‐3819. [DOI] [PubMed] [Google Scholar]
- 36. Jiang Z, Liu Z, Li M, et al. Increased glycolysis correlates with elevated immune activity in tumor immune microenvironment. EBioMedicine. 2019;42:431‐442. [DOI] [PMC free article] [PubMed] [Google Scholar]
- 37. Hemrika W, Renirie R, Dekker HL, et al. From phosphatases to vanadium peroxidases: A similar architecture of the active site. Proc Natl Acad Sci. 1997;94(6):2145‐2149. [DOI] [PMC free article] [PubMed] [Google Scholar]
- 38. Allister EM, Robson‐Doucette CA, Prentice KJ, et al. UCP2 Regulates the glucagon response to fasting and starvation. Diabetes. 2013;62(5):1623‐1633. [DOI] [PMC free article] [PubMed] [Google Scholar]
- 39. Gross DN, Wan M, Birnbaum MJ. The role of FOXO in the regulation of metabolism. Curr. Diab Rep. 2009;9(3):208‐214. [DOI] [PubMed] [Google Scholar]
- 40. Li Y, Ruperao P, Batley J, et al. Investigating drought tolerance in chickpea using genome‐wide association mapping and genomic selection based on whole‐genome resequencing. Data. 2018;9:190. [DOI] [PMC free article] [PubMed] [Google Scholar]
- 41. Guo T, Chen T, Gu C, et al. Genetic and molecular analyses reveal G6PC as a key element connecting glucose metabolism and cell cycle control in ovarian cancer. Tumor Biology. 2015;36(10):7649‐7658. [DOI] [PubMed] [Google Scholar]
- 42. Gjorgjieva M, Monteillet L, Calderaro J, et al. Polycystic kidney features of the renal pathology in glycogen storage disease type I: possible evolution to renal neoplasia. J Inher Met Dis. 2018;41(6):955‐963. [DOI] [PubMed] [Google Scholar]
- 43. Cho J‐H, Lee YM, Starost MF, et al. Gene therapy prevents hepatic tumor initiation in murine glycogen storage disease type Ia at the tumor‐developing stage. J Inher Met Dis. 2019;42(3):459‐469. [DOI] [PMC free article] [PubMed] [Google Scholar]
Associated Data
This section collects any data citations, data availability statements, or supplementary materials included in this article.
Supplementary Materials
Fig S1
Fig S2
Fig S3
Table S1
Data Availability Statement
The data sets analysed in this study were obtained from online open‐access databases or corresponding authors upon reasonable request.


