Abstract
Clear cell carcinoma of the ovary is thought to arise from endometriosis. In addition, retrograde menstruation of shed endometrium is considered the origin of endometriosis. However, little evidence supports cellular continuity from uterine endometrium to clear cell carcinoma through endometriosis at the genomic level. Here, we performed multiregional whole‐exome sequencing to clarify clonal relationships among uterine endometrium, ovarian endometriosis and ovarian clear cell carcinoma in a 56‐year‐old patient. Many somatic mutations including cancer‐associated gene mutations in ARID1A, ATM, CDH4, NRAS and PIK3CA were shared among epithelium samples from uterine endometrium, endometriotic lesions distant from and adjacent to the carcinoma, and the carcinoma. The mutant allele frequencies of shared mutations increased from uterine endometrium to distant endometriosis, adjacent endometriosis, and carcinoma. Although a splice site mutation of ARID1A was shared among the four epithelium samples, a frameshift insertion in ARID1A was shared by adjacent endometriosis and carcinoma samples, suggesting that the biallelic mutations triggered malignant transformation. Somatic copy number alterations, including loss of heterozygosity events at PIK3CA and ATM, were identified only in adjacent endometriosis and carcinoma, suggesting that mutant allele‐specific imbalance is another key factor driving malignant transformation. By reconstructing a clonal evolution tree based on the somatic mutations, we showed that the epithelium samples were derived from a single ancestral clone. Although the study was limited to a single patient, the results from this illustrative case could suggest the possibility that epithelial cells of ovarian endometriosis and clear cell carcinoma were descendants of uterine endometrial epithelium.
Keywords: clonal evolution, endometriosis, endometrium, genome, ovarian neoplasms
Suda et al performed whole‐exome sequencing for normal endometrial endometrium, two ovarian endometriotic epitheliums that were distant from or contiguous to the carcinoma, and carcinoma. A substantial number of somatic mutations were shared among four epithelium samples, and the mutant allele frequencies of shared mutations increased sequentially from uterine endometrium to carcinoma. Clonal evolution analysis revealed that epithelial cells of ovarian endometriosis and clear cell carcinoma were descendants of uterine endometrial epithelium.

1. INTRODUCTION
Several lines of evidence suggest that clear cell and endometrioid carcinomas of the ovary are primarily considered to arise from the precursor lesion, endometriosis. Epidemiological studies have shown that a personal history of endometriosis increases the risk of clear cell and endometrioid carcinoma. 1 Genomic studies have demonstrated that similar genes, such as ARID1A, PIK3CA and KRAS, are frequently mutated in both ovarian clear cell carcinoma 2 , 3 and benign endometriosis. 4 , 5 Additional direct evidence for the transformation of endometriosis into clear cell carcinoma has been provided by the finding of shared somatic mutations between a primary cancer site and multifocal endometriotic lesions in the same ovarian clear cell carcinoma patient. 6 In addition, we and others have reported that normal endometrium harbors somatic mutations in genes that are frequently mutated in endometriosis‐related ovarian cancers. 5 , 7 Furthermore, we have demonstrated that epithelial cells with cancer‐associated mutations, such as oncogenic PIK3CA and KRAS mutations, are clonally expanded in endometriosis. 5 However, mutations in cancer‐associated genes were prevalent but remained in subclonal and mosaic‐like states in normal endometrium, in which single endometrial glands harbored distinct mutation profiles. 5 These findings may support the theory that endometriosis derives from menstrual dissemination of endometrial tissue into the peritoneal cavity (retrograde menstruation theory). 8 The previous findings suggest the hypothesis that clonal relationships from normal endometrium to ovarian clear cell carcinoma through endometriosis can be traced by shared somatic mutations. To prove this hypothesis, clonal relationships among a series of tissues from the same patient with endometriosis‐related ovarian cancer must be investigated.
In this study, we performed whole‐exome sequencing to clarify the genomic lineage from normal endometrium to cancer in a patient with ovarian clear cell carcinoma. Histologically normal endometrial tissue, two ovarian endometriosis tissues that were distant from or contiguous to the carcinoma, and carcinoma tissue were subjected to continuous multisampling using laser microdissection (LMD). Somatic mutations were shared among these tissues, allowing us to understand the genomic evolution in a stepwise manner according to each pathological phenotype. The results of this study demonstrated that the ancestor cells common to both ovarian endometriosis and ovarian clear cell carcinoma were derived from normal endometrium.
2. MATERIALS AND METHODS
2.1. Patient and materials
We obtained ethics committee approval for this study and written informed consent from one ovarian cancer patient. The patient was a 56‐year‐old woman who underwent bilateral salpingo‐oophorectomy, hysterectomy and pelvic/paraaortic lymphadenectomy for suspected stage I ovarian cancer. She was pathologically diagnosed with stage IA ovarian clear cell carcinoma accompanied by endometriosis. The cancer site was localized in the right ovarian endometriotic cyst. No invasive lesion was present in the bicornuate uterus, and the endometrium was histologically normal. In this study, we aimed to analyze the clonal relationships among normal endometrium, ovarian endometriosis and ovarian clear cell carcinoma. The ovarian endometriosis lesion, which was located in the same ovarian cyst as the clear cell carcinoma, was dichotomized into a section distant from the cancer site (distant endometriosis) and a section adjacent to the cancer site (adjacent endometriosis). To cover all of these tissues, multisampling of the surgical specimen was performed in the right ovarian cyst and the right side of the bicornuate uterus (Figure 1). These samples were embedded in Tissue‐Tek OCT Compound (Sakura Finetek) in a Tissue‐Tek Cryomold (Sakura Finetek) and quickly frozen in liquid nitrogen as described in our previous study. 5
FIGURE 1.
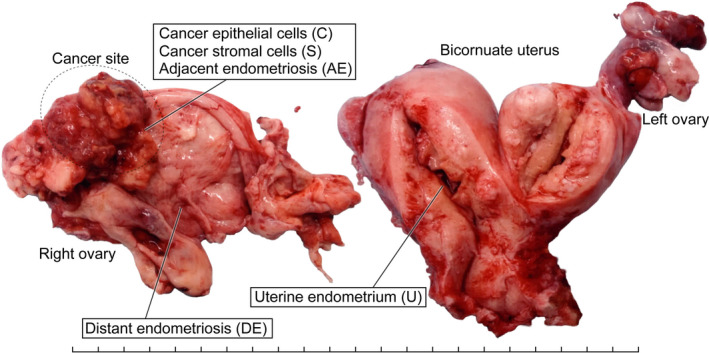
A macroscopic picture of a surgical specimen with sampling sites. A, An image of a surgical specimen from a 56‐year‐old woman with ovarian clear cell carcinoma, representing multiregional sampling sites of the following tissue components: cancer epithelial cells (C), cancer stromal cells (S), epithelial cells of adjacent endometriosis (AE) and distant endometriosis (DE), and epithelial cells of uterine endometrium (U). Each tick mark represents 1 cm
2.2. Laser microdissection and DNA extraction
To perform tissue‐specific analyses, we used LMD (MMI CellCut, Molecular Machines & Industries) on serial 8‐µm‐thick frozen sections from each sample as previously described. Briefly, prior to LMD, frozen sections, which were mounted on MMI Membrane Slides (Molecular Machines & Industries), were fixed with 100% methanol and stained with Toluidine blue. Tissues isolated by LMD were collected on MMI Isolation Caps (Molecular Machines & Industries). We isolated the following components: cancer epithelial cells (C), cancer stromal cells (S), epithelial cells of adjacent endometriosis (AE) and distant endometriosis (DE), and epithelial cells of uterine endometrium (U) (Figure 2, Figures S1 and S2). H&E‐stained sections of these tissues were histologically reviewed by an experienced gynecologic pathologist (TM). DNA was extracted from the isolated samples using a QIAamp DNA Micro Kit (QIAGEN, Hilden, Germany) according to the manufacturer’s protocol.
FIGURE 2.
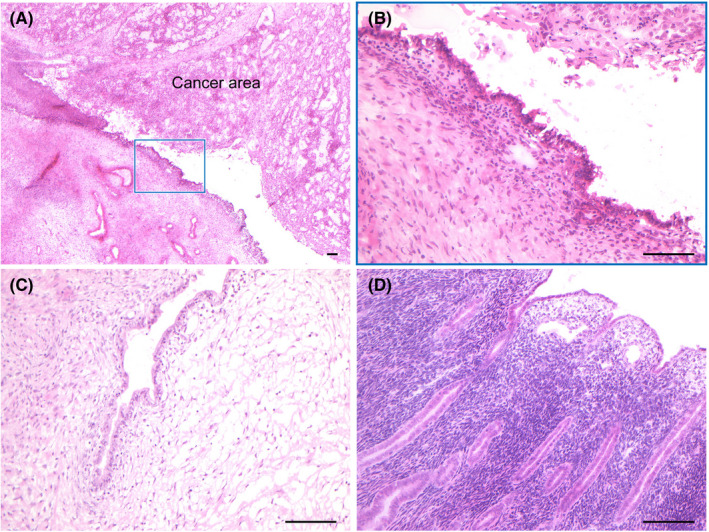
Histological images of multiregional samples. Frozen sections of 8‐µm thickness from each sample were stained with H&E to histologically confirm (A) the cancer site accompanied by adjacent endometriosis (boxed lesion), (B) adjacent endometriosis, (C) distant endometriosis and (D) uterine endometrium. The scale bars represent 100 µm
2.3. Whole‐exome sequencing
Whole‐exome sequencing was performed as described in our previous study. 5 Briefly, 200 ng of DNA was sheared into fragments using an S2 sonicator (Covaris). Sequencing libraries were constructed with a SureSelect XT Reagent Kit (Agilent Technologies). Target gene enrichment was conducted with a SureSelect Human All Exon V5 + lncRNA Kit (Agilent Technologies). The libraries were sequenced via an Illumina HiSeq 2500 platform in rapid run mode with a 2 × 150‐bp paired‐end module (Illumina).
2.4. Data preprocessing
As a quality control step, the Illumina adapter and low‐quality sequences were trimmed by using Trim Galore (https://www.bioinformatics.babraham.ac.uk/projects/trim_galore/) and Trimmomatic, respectively. 9 When the DNA inserts were shorter than the read length, the nonadapter portions of the forward and reverse sequences became reverse complements; that is, the reverse read contained the same sequence information as the forward read. In such cases, the forward read was retained to avoid double‐counting the bases from overlapping alignments of paired‐end reads. The paired‐end and single‐end read datasets were separately aligned to a human reference genome (GRCh38) containing sequence decoys and virus sequences that were generated by the Genomic Data Commons (GDC) of the National Cancer Institute (NCI) using BWA‐MEM 10 and were then converted into BAM file format with SAMtools. 11 The BAM files were merged and processed using Picard tools (https://broadinstitute.github.io/picard/) to remove PCR duplicates. Base quality recalibration was conducted using GATK. 12 , 13 The average depths and the coverages of the target regions were calculated with SAMtools.
2.5. Variant detection and mutation annotation
Somatic single nucleotide variants (SNV) and short insertions and deletions (indels), for each of the epithelium or stroma samples with matched normal blood samples, were called by using a somatic analysis pipeline of Strelka2. 14 The variants whose empirical variant scores provided by Strelka2 were greater than 10 were used for subsequent analyses. In addition, we excluded variants whose frequencies were greater than or equal to 0.001 in any of the general populations from the 1000 Genomes Project, 15 the National Heart, Lung, and Blood Institute (NHLBI) GO Exome Sequencing Project, 16 and the Genome Aggregation Database 17 to avoid false‐positive variant calls. 18 Functional annotations for protein‐coding and transcription‐related effects of the identified variants were implemented by Ensembl VEP. 19 Curated information about cancer‐associated genes and their functional roles in cancer development was retrieved from the COSMIC database. 20
2.6. Haplotype phasing of two ARID1A mutations
To investigate the haplotype of two ARID1A mutations (c.4993 + 2T>C and p.E1683fs) identified in AE and C, we sequenced PCR products encompassing these two mutations. DNA samples from cancer epithelium and matched blood samples were amplified by PCR using the following oligonucleotide primers: forward, 5’‐GGGATATCACCTTCCCACCT‐3′ and reverse, 5’‐ACAGCATCATGACCTTCAACC‐3′. The PCR products were subjected to deep sequencing via the Illumina MiSeq v3 platform with 350‐bp and 250‐bp paired‐end modules. We assessed whether these two mutations resided on the same haplotype or were biallelic compound heterozygous mutations. Alignment of sequence reads was visualized by IGV tools. 21
2.7. Detection of somatic copy number alterations
Somatic copy number alterations (SCNA) were explored by using FACETS based on the information from the total sequence read count and allelic imbalance in the tumor/normal pairs. 22
2.8. Identification of putative clonal populations
Clonal populations present in the epithelium samples were detected by clustering somatic mutations (SNV and indels) with PyClone. 23 The SNV and indels fulfilling the following criteria were used: (a) the depth was greater than or equal to 20 in all four epithelium samples; (b) the mutant allele frequency (MAF) was ≥0.15 in any of the four epithelium samples; and (c) the mutations did not overlap with the SCNA detected by FACETS. Then, the information about the clusters into which the somatic mutations were grouped and the MAF were used as the input to ClonEvol 24 to infer the clone ordering and to reconstruct clonal evolution trees. The polyclonal seeding model was applied. The number of bootstrap samples was set to 10 000.
3. RESULTS
3.1. Whole‐exome sequencing
The average depth was 97.0 (range: 91.1‐106.1). The mean proportion of the exome covered by at least 20 reads was 85.3% (range: 84.1%‐89.0%), supporting confident variant detection (Figure S3). A total of 2621 SNV and 73 indels were detected (Figure S4 and Table S1).
We found that a substantial portion of the mutations was shared among the four epithelium samples (U, DE, AE and C), demonstrating clonal relationships between spatially separated tissues (Figure 3A). The number of mutations shared with U decreased from E to AE to C. No mutations were shared by the stromal component of the carcinoma (S) and epithelial components (C), consistent with previous studies showing different mutation profiles between the epithelium and stroma in endometriosis and uterine endometrium. 18 , 25 The MAF of the shared mutations significantly increased from U to DE to AE to C (Figure 3B). The MAF of these mutations in AE and C were remarkably high (median and interquartile range [IQR]: 0.429 [0.389‐0.457] and 0.462 [0.437‐0.500], respectively), indicating that almost all epithelial cells in the two lesions originated from the same clone. In contrast, epithelial cells originating from the same clone were predominant but still remained in a subclonal state in U and E according to the MAF (median and IQR: 0.259 [0.230‐0.284] and 0.291 [0.250‐0.333], respectively).
FIGURE 3.
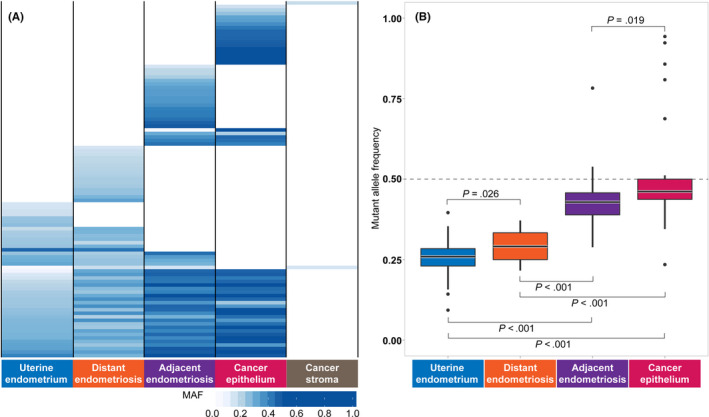
Sharing of somatic mutation profiles defined by multiregional sequencing. A, Sharing pattern of somatic single nucleotide variants (SNV) among five tissues. Somatic SNV fulfilling the following criteria were used: (a) SNV whose mutant allele frequency (MAF) were greater than or equal to 0.15 in at least one epithelium or stromal sample; (b) SNV located on coding exons; and (c) SNV whose MAF in blood did not exceed 0.15. B, Distribution of MAF of the SNV shared by epithelium samples. The statistical significance of the differences was assessed using the Wilcoxon‐Mann‐Whitney test
3.2. Cancer‐associated mutations
We searched for mutations in cancer‐associated genes based on the COSMIC Cancer Gene Census. 26 We identified nine nonsilent SNV and indels that were shared among at least two tissues (Figure 4). Six mutations were shared among the four epithelium samples (ARID1A: c.4993 + 2T>C, ATM: p.K116fs, ATM: p.K116N, CHD4: p.R1105Q: NRAS: p.Q61H and PIK3CA: p.E542K). The MAF of these mutations tended to increase sequentially from U to DE, AE and C.
FIGURE 4.
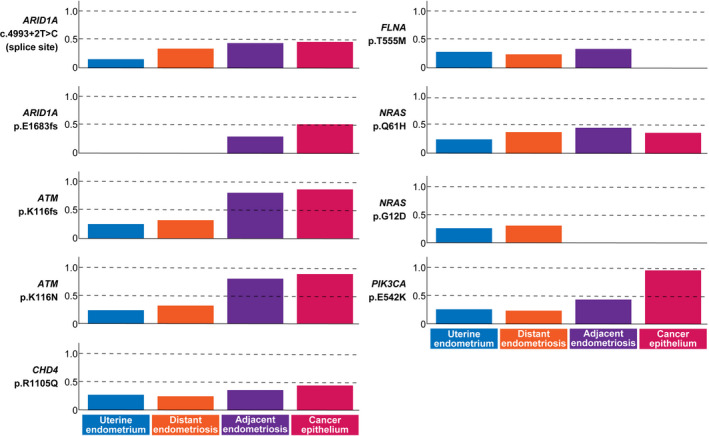
Profiles of mutant allele frequency (MAF) for cancer‐associated gene mutations in the four epithelium samples. Cancer‐associated genes were selected according to the COSMIC Cancer Gene Census. Nonsilent mutations shared among at least two epithelium samples are shown
We identified two mutations in ARID1A that were shared among multiple epithelium samples (Figure 4). While a mutation at the splice donor site of ARID1A (c.4993 + 2T>C) was common among the four tissues, a frameshift insertion (p.E1683fs) was shared only by AE and C. Moreover, these two mutations on ARID1A occurred on different alleles (Figure S5). Immunohistochemistry showed loss of BAF250a in C but not in U (Figure S6).
Two mutations in ATM resided on the same haplotype, which created a premature stop codon (Figure S7). Notably, the MAF of these two ATM mutations in AE and C were 0.800 and 0.882, respectively, significantly greater than 0.5 (binomial test: P < .01), suggesting the cooccurrence of a loss of heterozygosity (LOH) event at 11q22.3. The MAF of the PIK3CA mutation in U, DE, AE and C were 0.264, 0.240, 0.438 and 0.958, respectively, indicating that the clone with the PIK3CA mutation remained in a subclonal state in U and DE but attained a clonal state in AE and C.
3.3. Somatic copy number alterations
Somatic copy number alterations were identified in AE and C but not in U, DE and S. A total of nine chromosomes were affected by SCNA (chromosomes 3, 5, 8, 9, 10, 11, 17, 22 and X; Figure 5A and Table S2).
FIGURE 5.
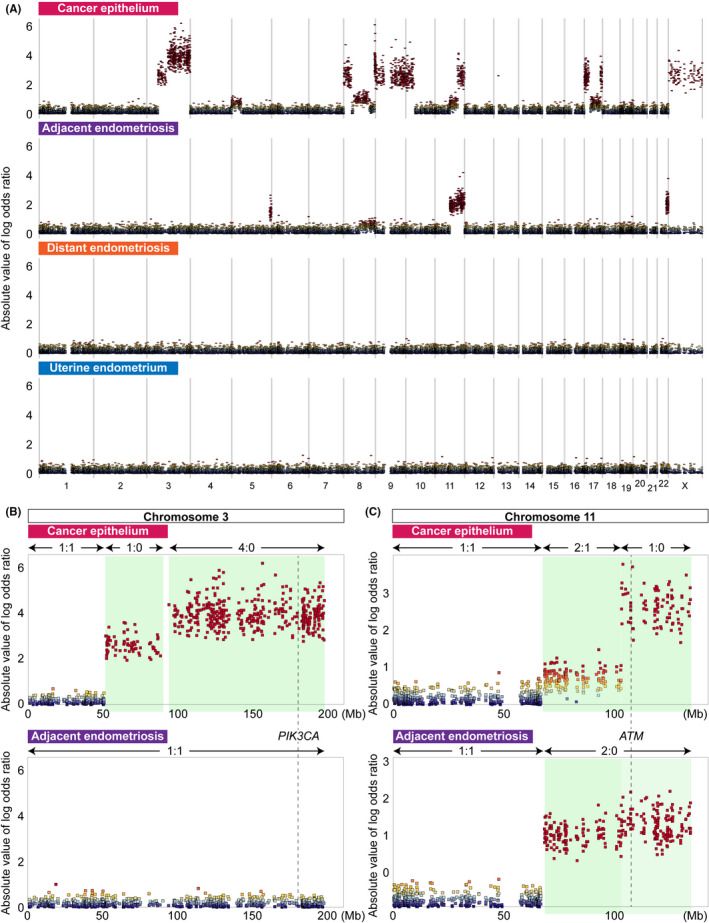
Landscape of somatic copy number alterations (SCNA) in the four epithelium samples. A, Genome‐wide profiles of SCNA for four epithelium samples. The absolute values of the log odds ratios for the variant allele read counts at heterozygous single nucleotide variant (SNV) sites in each pair of epithelium and blood samples are plotted according to chromosome coordinates. The log odds ratios were estimated by FACETS. B, SCNA on chromosome 3 leading to the loss of heterozygosity (LOH) status of PIK3CA detected only in cancer epithelium. Regions with copy number alterations are highlighted in light green. The numbers separated by a colon are the major and minor copy numbers for the regions indicated by the arrows. C, SCNA on chromosome 11 leading to the LOH status of ATM detected both in cancer epithelium and adjacent endometriosis. Regions with copy number alterations are highlighted in light green. The numbers separated by a colon are the major and minor copy numbers for the regions indicated by the arrows
Most SCNA were lesion‐specific events. The SCNA on chromosomes 3, 9, 10, 17 and X were specifically detected in C and overlapped with many cancer‐associated genes, such as PIK3CA, SMARCA2, CDKN2A/2B, HNF1B, ERBB2, STAT3 and TP53. These SCNA accounted for a distinct pattern of MAF for cancer‐associated gene mutations in C. A region of approximately 150 Mb on chromosome 3 contained two consecutive segments, both of which had an LOH status, albeit with differing total copy numbers (Figure 5B). The total copy numbers for the centromeric (chr3: 51403500‐90242000) and telomeric (chr3: 93874275‐197960500) segments were estimated to be one and four, respectively. In addition, the MAF for an oncogenic mutation of PIK3CA (p.E542K) in C was remarkably high (0.958). Subsequent amplification of the telomeric segment of the LOH region produced four copies of the oncogenic (mutant) PIK3CA alleles, which resulted in a remarkable increase in the MAF (0.958) in PIK3CA (p.E542K).
The loss of one of the two X chromosomes in C eliminated an FLNA mutation that was shared among all epithelium samples except for C (Figure 4). A deletion‐induced LOH event on a telomeric segment of the long arm of chromosome 22 was detected in AE. On chromosomes 5 and 8, distinct SCNA were identified in AE and C. While AE harbored a deletion‐induced LOH event at the end of the long arm of chromosome 5, C acquired an amplification of the short arm. AE had an amplification of the short arm of chromosome 8, whereas multiple complex SCNA disrupted nearly the entire region in C. Although both AE and C acquired copy number gain at the region containing MYC, C represented a further increase of copy number of MYC.
A similar region of the long arm of chromosome 11 was rearranged in both AE and C (Figure 5C). A copy neutral LOH event occurred in the long arm in AE (chr11: 68347900‐134716165). In contrast, C contained two consecutive segments, in which the centromeric part was a duplication of one copy (chr11: 67522513‐102955600) and the telomeric part was a deletion‐induced LOH (chr11: 103062300‐134716165). In addition, the MAF of the ATM mutations in AE and C were 0.800 and 0.882, respectively, indicating that loss of the wild‐type allele led to predominance of the mutant allele.
3.4. Detection of clonal populations and reconstruction of clonal evolution trees
The somatic mutations were clustered based on their MAF with PyClone. 23 A total of six clusters were identified (Figure 6A). Cluster 1 contained the mutations shared among all four epithelium samples. This cluster seemed to be the founding clone. The mutations grouped into clusters 2 and 4 were shared between U and DE and between AE and C, respectively. Clusters 3, 5 and 6 comprised the mutations specific to E, AE and C, respectively. The fish plots illustrated the clonal evolution within each single sample (Figure 6A).
FIGURE 6.
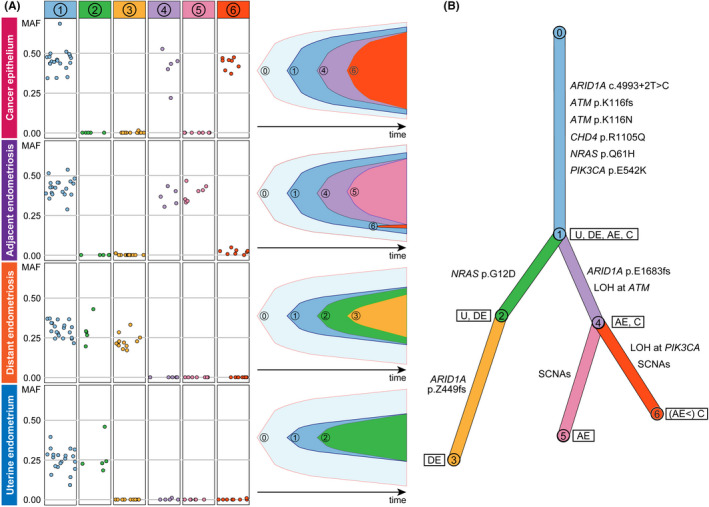
Clonal relationships among the four epithelium samples. A, Somatic single nucleotide variants (SNV) and indels were classified into six clusters based on their mutant allele frequency (MAF) profiles with PyClone. The prevalence of the six clones in each of the epithelium samples was evaluated, and clonal ordering was then implemented with ClonEvol to create fish plots showing clonal evolutions within the samples. B, A branch‐based clonal evolution tree was generated with ClonEvol. Mutations in cancer‐associated genes except for PIK3CA and ATM were assigned to branches based on the result of mutation clustering by PyClone. Mutations in PIK3CA and ATM were excluded from the analysis of mutation clustering because they were located in SCNA. The PIK3CA and ATM mutations were manually assigned to the initial branch because they were shared at a clonal state among all epithelium samples. The lengths of the branches are associated with the number of somatic mutations
Based on the mutation clusters predicted by PyClone, clone ordering was conducted with ClonEvol to reconstruct a clonal evolution tree 24 (Figure 6B). The epithelium samples had a single ancestral clone characterized by the mutations grouped into cluster 1, although the clone was still in a subclonal state in U and DE at the time of sample collection. The cells within clone 1 diversified by acquiring additional mutations. Notably, clone 2 emerged from clone 1 in U and DE but was not present in AE and C. Instead, clone 4 evolved to AE and C from clone 1. Clusters 2 and 4 were represented by NRAS p.G12D and ARID1A p.E1683fs, respectively. DE was a descendant of a subclone with the cluster 2 mutations, including NRAS p.G12D, and acquired the diversifying mutations in cluster 3 represented by ARID1A p.Z449fs. By acquiring mutations grouped into clusters 5 and 6, as well as SCNA, clone 4 evolved into AE and C, respectively.
4. DISCUSSION
Previous studies reported that ARID1A was frequently mutated (40%‐78%) in ovarian clear cell carcinoma, 2 , 3 , 27 , 28 , 29 , 30 , 31 and this event was presumed to be a driver event for its carcinogenesis. In this study, we detected both common and tissue‐specific mutations in ARID1A. The mutation at the splice site (c.4993 + 2T>C) was common among the epithelial samples, whereas the frameshift insertion (p.E1683fs) was specific to AE and C. Interestingly, the truncating mutation occurred in alleles different from those with splice site mutations. These results suggest that the splice site mutation was a “first hit” and attained a clonal state in AE and C; the subsequent frameshift insertion then produced a “second hit” toward ARID1A inactivation‐triggered malignant transformation, which was initiated in AE (MAF: 0.302) and completed in C (MAF: 0.521).
PIK3CA was also found to be frequently mutated in ovarian clear cell carcinoma (40%‐67%) in previous studies. 3 , 27 , 28 , 29 , 30 , 31 Prior to most of these studies, cooccurring loss of ARID1A and PIK3CA mutation was considered a very early event during the development of ovarian clear cell carcinoma. 32 Furthermore, coexistent mutations in ARID1A and PIK3CA were reported to be required for ovarian clear cell carcinoma tumorigenesis in a mouse model. 33 In this study, another putative key factor for malignant transformation was the steeply increasing MAF (0.958) of oncogenic PIK3CA (p.E542K), which was shared among the epithelial samples. The SCNA analysis based on whole‐exome sequencing data for C showed that LOH occurred on the long arm of chromosome 3, in which PIK3CA is located; moreover, the estimated copy numbers of the mutant and wild‐type alleles of PIK3CA were four and zero, respectively, indicating subsequent amplification of the mutant PIK3CA allele. Similarly, LOH occurred on the long arm of chromosome 11 in AE and C, which was reflected in the MAF of ATM mutations. These results suggest that mutant allele‐specific imbalance is a key driving factor for malignant transformation. 34
Although a limited number of studies have been conducted, evidence of SCNA in endometriosis has been controversial. Previous studies have reported that SCNA are virtually absent or very rare in cases of benign endometriosis, 4 , 35 although we showed that 2 of 13 cases analyzed by whole‐exome sequencing harbored LOH on chromosome 12p, which increased the MAF of oncogenic KRAS mutations. 5 In this study, SCNA occurred specific in AE and C, unlike SNV or Indels. The result that C acquired SCNA in such genes as PIK3CA, MYC, CDKN2A/B, HNF1B, ERBB2 and STAT3 was consistent with the result of the previous genome‐wide study of ovarian clear cell carcinoma 27 (Table S2). Interestingly, AE also acquired copy number gain at MYC, suggesting this SCNA could be an early event for malignant transformation in the case.
Clonal evolution trees are useful for interpreting clonal architecture among multiple lesions (eg, primary and metastatic tumors in the same patient), 24 and we applied ClonEvol to reconstruct and visualize clonal evolutions among U, DE, AE and C. Based on the reconstructed clonal evolution tree, we formulated a plausible hypothesis about the development of disease lesions in this patient. Clone 1 emerged in uterine endometrium by acquiring mutations in cancer‐associated genes (ARID1A, ATM, CDH4, NRAS and PIK3CA). Then, clone 2 evolved from clone 1 in uterine endometrium. When endometrial cells implanted on the ovarian surface, probably due to retrograde menstruation, the primary ovarian endometriosis exhibited substantial heterogeneity, and clone 2 was in a subclonal state. During subsequent growth to form the ovarian endometrioma, the heterogeneity in endometriotic cells was preserved. DE was a descendant of a subclone with the cluster 2 mutations, including NRAS (p.G12D), and acquired the diversifying mutations in cluster 3. Within a subclone characterized by the absence of the cluster 2 mutations, the subclone with the cluster 4 mutations, including ARID1A p.E1683fs, evolved at the lesion of adjacent endometriosis. The genomic events including the cluster 6 mutations and various SCNA led to malignant transformation from AE to C. The cluster 6 mutations were present in AE with low MAF, suggesting that C originated from a part of AE and underwent clonal expansion to become malignant. However, we could not deny the contamination of C during LMD sampling, because C and AE were contiguous lesions.
Considering the genomic heterogeneity among endometrial glands, more efficient sampling of the endometrium is needed in further explorations of shared somatic events between normal endometrium and extrauterine lesions, because despite spatial multisampling from specimens, mutations shared between normal endometrium and ovarian endometriosis in the same patient were virtually absent in our previous study. 5 Here, the patient had a bicornuate uterus, and we sampled uterine endometrium and the other tissues from the right side of the uterus and the right ovary, respectively. Assuming retrograde menstruation through the right fallopian tube, this uterine deformity might have been favorable for this study. If it were not for the method of globally observing mutation profiles in normal endometrium, the sampling location in future parallel studies would be dependent only on coincidence. From this perspective, the results of this study might have been providential.
Similarly, the intratumor heterogeneity 36 could have affected the result of our evolutionary analysis. For more precise evaluation of the somatic lineage from ancestor cells to subclonal populations in the carcinoma, multisampling in the cancer site would be preferable because the cancer samples in the other sites might have evolved differently by acquiring distinct mutations and SCNA.
Finally, even though this study is based on a single case, our result could be direct evidence supporting the retrograde menstruation theory, which was proposed approximately one century ago. 8 Assuming that cancer‐associated mutations in normal endometrium contribute to the pathogenesis of ovarian endometriosis and endometriosis‐related ovarian cancer, elucidating the mechanism and controlling the accumulation of mutations in normal endometrium could be a novel strategy to substantially reduce the number of patients with gynecological diseases.
DISCLOSURE
The authors declare that they have no conflicts of interest.
Supporting information
Fig S1
Fig S2
Fig S3
Fig S4
Fig S5
Fig S6
Fig S7
Table S1
Table S2
ACKNOWLEDGMENTS
This work was supported in part by JSPS KAKENHI Grant Numbers JP19K18633 (Grant‐in‐Aid for Young Scientists for KS), JP16H06267 (Grant‐in‐Aid for Young Scientists A for KY) and JP19K09822 (Grant‐in‐Aid for Scientific Research C for KY), and the Research Organization of Information and Systems (ROIS) (Challenging Exploratory Research Projects for the Future grant from for H. N.). We are grateful to Junko Kajiwara, Junko Kitayama and Yumiko Sato for their technical assistance.
Suda K, Cruz Diaz LA, Yoshihara K, et al. Clonal lineage from normal endometrium to ovarian clear cell carcinoma through ovarian endometriosis. Cancer Sci. 2020;111:3000–3009. 10.1111/cas.14507
Kazuaki Suda and Luis Antonio Cruz Diaz contributed equally to this study.
REFERENCES
- 1. Pearce CL, Templeman C, Rossing MA, et al. Association between endometriosis and risk of histological subtypes of ovarian cancer: a pooled analysis of case–control studies. Lancet Oncol. 2012;13:385‐394. [DOI] [PMC free article] [PubMed] [Google Scholar]
- 2. Wiegand KC, Shah SP, Al‐Agha OM, et al. ARID1A mutations in endometriosis‐associated ovarian carcinomas. N Engl J Med. 2010;363:1532‐1543. [DOI] [PMC free article] [PubMed] [Google Scholar]
- 3. Jones S, Wang TL, Shih Ie M, et al. Frequent mutations of chromatin remodeling gene ARID1A in ovarian clear cell carcinoma. Science. 2010;330:228‐231. [DOI] [PMC free article] [PubMed] [Google Scholar]
- 4. Anglesio MS, Papadopoulos N, Ayhan A, et al. Cancer‐associated mutations in endometriosis without cancer. N Engl J Med. 2017;376:1835‐1848. [DOI] [PMC free article] [PubMed] [Google Scholar]
- 5. Suda K, Nakaoka H, Yoshihara K, et al. Clonal expansion and diversification of cancer‐associated mutations in endometriosis and normal endometrium. Cell Rep. 2018;24:1777‐1789. [DOI] [PubMed] [Google Scholar]
- 6. Anglesio MS, Bashashati A, Wang YK, et al. Multifocal endometriotic lesions associated with cancer are clonal and carry a high mutation burden. J Pathol. 2015;236:201‐209. [DOI] [PMC free article] [PubMed] [Google Scholar]
- 7. Lac V, Nazeran TM, Tessier‐Cloutier B, et al. Oncogenic mutations in histologically normal endometrium: the new normal? J Pathol. 2019;249(2):173‐181. [DOI] [PubMed] [Google Scholar]
- 8. Sampson JA. Peritoneal endometriosis due to the menstrual dissemination of endometrial tissue into the peritoneal cavity. Am J Obstet Gynecol. 1927;14:422‐469. [Google Scholar]
- 9. Bolger AM, Lohse M, Usadel B. Trimmomatic: a flexible trimmer for Illumina sequence data. Bioinformatics. 2014;30:2114‐2120. [DOI] [PMC free article] [PubMed] [Google Scholar]
- 10. Li H. Aligning sequence reads, clone sequences and assembly contigs with BWA‐MEM. arXiv. 2013. 1303.3997 [q‐bio.GN]. [Google Scholar]
- 11. Li H, Handsaker B, Wysoker A, et al. The sequence alignment/map format and SAMtools. Bioinformatics. 2009;25:2078‐2079. [DOI] [PMC free article] [PubMed] [Google Scholar]
- 12. DePristo MA, Banks E, Poplin R, et al. A framework for variation discovery and genotyping using next‐generation DNA sequencing data. Nat Genet. 2011;43:491‐498. [DOI] [PMC free article] [PubMed] [Google Scholar]
- 13. McKenna A, Hanna M, Banks E, et al. The genome analysis toolkit: a MapReduce framework for analyzing next‐generation DNA sequencing data. Genome Res. 2010;20:1297‐1303. [DOI] [PMC free article] [PubMed] [Google Scholar]
- 14. Kim S, Scheffler K, Halpern AL, et al. Strelka2: fast and accurate calling of germline and somatic variants. Nat Methods. 2018;15:591‐594. [DOI] [PubMed] [Google Scholar]
- 15. Auton A, Brooks LD, Durbin RM, et al. A global reference for human genetic variation. Nature. 2015;526:68‐74. [DOI] [PMC free article] [PubMed] [Google Scholar]
- 16. Tennessen JA, Bigham AW, O’Connor TD, et al. Evolution and functional impact of rare coding variation from deep sequencing of human exomes. Science. 2012;337:64‐69. [DOI] [PMC free article] [PubMed] [Google Scholar]
- 17. Karczewski KJ, Francioli LC, Tiao G, et al. Variation across 141,456 human exomes and genomes reveals the spectrum of loss‐of‐function intolerance across human protein‐coding genes. bioRxiv. 2019: 531210. [Google Scholar]
- 18. Suda K, Nakaoka H, Yoshihara K, et al. Different mutation profiles between epithelium and stroma in endometriosis and normal endometrium. Hum Reprod. 2019;34:1899‐1905. [DOI] [PubMed] [Google Scholar]
- 19. McLaren W, Gil L, Hunt SE, et al. The ensembl variant effect predictor. Genome Biol. 2016;17:122. [DOI] [PMC free article] [PubMed] [Google Scholar]
- 20. Tate JG, Bamford S, Jubb HC, et al. COSMIC: the catalogue of somatic mutations in cancer. Nucleic Acids Res. 2019;47:D941‐D947. [DOI] [PMC free article] [PubMed] [Google Scholar]
- 21. Robinson JT, Thorvaldsdottir H, Wenger AM, Zehir A, Mesirov JP. Variant review with the integrative genomics viewer. Cancer Res. 2017;77:e31‐e34. [DOI] [PMC free article] [PubMed] [Google Scholar]
- 22. Shen R, Seshan VE. FACETS: allele‐specific copy number and clonal heterogeneity analysis tool for high‐throughput DNA sequencing. Nucleic Acids Res. 2016;44:e131. [DOI] [PMC free article] [PubMed] [Google Scholar]
- 23. Roth A, Khattra J, Yap D, et al. PyClone: statistical inference of clonal population structure in cancer. Nat Methods. 2014;11:396‐398. [DOI] [PMC free article] [PubMed] [Google Scholar]
- 24. Dang HX, White BS, Foltz SM, et al. ClonEvol: clonal ordering and visualization in cancer sequencing. Ann Oncol. 2017;28:3076‐3082. [DOI] [PMC free article] [PubMed] [Google Scholar]
- 25. Noe M, Ayhan A, Wang TL, Shih IM. Independent development of endometrial epithelium and stroma within the same endometriosis. J Pathol. 2018;245:265‐269. [DOI] [PubMed] [Google Scholar]
- 26. Sondka Z, Bamford S, Cole CG, Ward SA, Dunham I, Forbes SA. The COSMIC Cancer Gene Census: describing genetic dysfunction across all human cancers. Nat Rev Cancer. 2018;18:696‐705. [DOI] [PMC free article] [PubMed] [Google Scholar]
- 27. Murakami R, Matsumura N, Brown JB, et al. Exome sequencing landscape analysis in ovarian clear cell carcinoma shed light on key chromosomal regions and mutation gene networks. Am J Pathol. 2017;187:2246‐2258. [DOI] [PubMed] [Google Scholar]
- 28. Shibuya Y, Tokunaga H, Saito S, et al. Identification of somatic genetic alterations in ovarian clear cell carcinoma with next generation sequencing. Genes Chromosom Cancer. 2018;57:51‐60. [DOI] [PubMed] [Google Scholar]
- 29. Su YF, Tsai EM, Chen CC, Wu CC, Er TK. Targeted sequencing of a specific gene panel detects a high frequency of ARID1A and PIK3CA mutations in ovarian clear cell carcinoma. Clin Chim Acta. 2019;494:1‐7. [DOI] [PubMed] [Google Scholar]
- 30. Sugino K, Tamura R, Nakaoka H, et al. Germline and somatic mutations of homologous recombination‐associated genes in Japanese ovarian cancer patients. Sci Rep. 2019;9:17808. [DOI] [PMC free article] [PubMed] [Google Scholar]
- 31. Kim SI, Lee JW, Lee M, et al. Genomic landscape of ovarian clear cell carcinoma via whole exome sequencing. Gynecol Oncol. 2018;148:375‐382. [DOI] [PubMed] [Google Scholar]
- 32. Yamamoto S, Tsuda H, Takano M, Tamai S, Matsubara O. Loss of ARID1A protein expression occurs as an early event in ovarian clear‐cell carcinoma development and frequently coexists with PIK3CA mutations. Mod Pathol. 2012;25:615‐624. [DOI] [PubMed] [Google Scholar]
- 33. Chandler RL, Damrauer JS, Raab JR, et al. Coexistent ARID1A‐PIK3CA mutations promote ovarian clear‐cell tumorigenesis through pro‐tumorigenic inflammatory cytokine signalling. Nat Commun. 2015;6:6118. [DOI] [PMC free article] [PubMed] [Google Scholar]
- 34. Bielski CM, Donoghue MTA, Gadiya M, et al. Widespread Selection for Oncogenic Mutant Allele Imbalance in Cancer. Cancer Cell. 2018;34:852‐862. [DOI] [PMC free article] [PubMed] [Google Scholar]
- 35. Saare M, Soritsa D, Vaidla K, et al. No evidence of somatic DNA copy number alterations in eutopic and ectopic endometrial tissue in endometriosis. Hum Reprod. 2012;27:1857‐1864. [DOI] [PubMed] [Google Scholar]
- 36. Gerlinger M, Rowan AJ, Horswell S, et al. Intratumor heterogeneity and branched evolution revealed by multiregion sequencing. N Engl J Med. 2012;366:883‐892. [DOI] [PMC free article] [PubMed] [Google Scholar]
Associated Data
This section collects any data citations, data availability statements, or supplementary materials included in this article.
Supplementary Materials
Fig S1
Fig S2
Fig S3
Fig S4
Fig S5
Fig S6
Fig S7
Table S1
Table S2


