Abstract
Here, we report the fabrication of TiO2/Fe2O3 core/shell heterojunction nanorod arrays by a pulsed laser deposition (PLD) process and their further use as photoelectrodes toward high-performance visible light photoelectrochemical (PEC) water splitting. The morphology, phase, and carrier conduction mechanism of plain TiO2 and TiO2/Fe2O3 core/shell nanostructure were systematically investigated. PEC measurements show that the TiO2/Fe2O3 core/shell nanostructure enhances photocurrent density by nearly 2 times than the plain ones, increases visible light absorption from 400 to 550 nm, raises the on/off separation rate, and delivers high stability with only a 3% decrease of current density for tests of even more than 14 days. This work provides a method to design an efficient nanostructure by combination of a facile hydrothermal process and high-quality PLD process to fabricate a clean surface and excellent crystallinity for charge separation, transfer, and collection toward enhanced PEC properties.
1. Introduction
Photoelectrochemical (PEC) water splitting is one of the promising methods to directly convert solar energy to chemical energy by using semiconductor electrodes.1−4 Since the discovery of Fujishima and Honda in 1972, various photomaterials have been fabricated for PEC water splitting systems toward high stability and efficiency.5 Compared with other well-known wide gap metal oxides like ZnO, SnO2, and SrTiO3, TiO2 exhibits several prominent properties such as chemical stability, high charge mobility, and low cost.6−9 Li et al. reported a new TiO2 structure with a nanofiber template to have a quite high current density.10 Liu et al. made a black TiO2 with the use of Ar and Ar/H2 gas to achieve more light absorbance for a higher hydrogen production rate.11 Wu et al. demonstrated a Bi-TiO2 nanostructure to deliver high performance.12 Obviously, it is still very challenging to accomplish an excellent efficiency by TiO2 alone as its light absorption ability is limited by the wide band gap only for UV light, which is a small part of the full spectrum. In consideration of expanding light absorption ability, hematite (α-Fe2O3) is one of the most promising candidate materials due to its narrow band gap (∼2.0 eV), good response to visible light, environmental friendliness, earth abundance, and the conduction band edge position for possible water splitting at a low voltage.13−16 Yu et al. prepared a quite high-performance hematite photoanode by the pulsed laser deposition (PLD) approach and further used more FeOOH loading on the hematite layer to have nearly 0.8 mA cm–2 at 1.23 V versus reversible hydrogen electrode (RHE).17 Wang et al. demonstrated a Sn-doped hematite nanoflake to increase the photocurrent.18 Han et al. reported a Sb-doped SnO2 (ATO) with Fe2O3 nanorods for water splitting, and the efficiency of the best sample has increased 139% higher than that of the pure hematite nanorods at 1.23 VRHE.19 However, it is noticed that their devices demand complicated experiment processes and additional added materials, which would restrict inevitably the practical applications in the future.
Even up to now, it is still difficult to succeed a high-performance electrode by only one material due to the great restriction of the individual’s own flaws. Photogenerated charges require efficient separation followed by fast transportation to inject into the respective reduction and oxidation reactions, but the charges are very tough to be generated and separated in one material alone. We argue that we could expect to build a core/shell nanostructure, in which a high charge mobility material as a core improves the transmission efficiency of photoinduced charges and a wide light spectrum absorption material as a shell enhances the visible light response and charges separation.20−22 Yang et al. prepared a TiO2/BaTiO3 core/shell nanostructure, which produced a high photocurrent, but both materials could absorb only UV light.23 Wang et al. devised Fe2O3/TiO2 core/shell photoelectrodes to improve separate efficiency of photoinduced charge carriers and absorb visible light.24 Smith et al. reported TiO2/WO3 and WO3/TiO2 core/shell nanorod arrays to combine optical utilization and water splitting efficiency together.25 Though these works used various types of materials, they chose the same facile way to prepare the nanostructure by using arrays as a core and high-quality materials as a shell. PLD is a powerful tool for depositing thin films with great precision in thickness and quality at a controllable laser intensity and frequency.26−29 The high-quality target and feathering deposition process of PLD endorse the perfect ability to produce conformal ultrahigh-quality films under a low temperature.
Here, we employ a PLD technique to deposit Fe2O3 films with different thicknesses on TiO2 nanorod arrays at a temperature of 500 °C, which is much lower than the traditional crystallization temperature (700 °C). After an annealing process, the as-prepared high-quality TiO2/Fe2O3 core/shell nanostructures are firmly attached on the F-doped tin oxide (FTO) substrate and are further used for the photoanode in the water splitting system. The thickness of the Fe2O3 film can be tuned precisely for effective light utilization and photogenerated charge transport by controlling the deposition times. The TiO2/Fe2O3 core/shell photoanode shows a high current density of 0.91 mA cm–2 at 1.23 VRHE, which is 165% higher than that of the plain TiO2 nanorod array photoanode (0.55 mA cm–2). It is worthy to note that the spectral absorption is extended to nearly 600 nm while the photocurrent still remains more than 97% after about 14 days of continuous testing. The mechanism for the photoelectric properties increasing is studied by investigating the parameters, including the morphological changes, the thickness of the PLD Fe2O3 layer, transmittance rate, crystal structure, and electrochemical impedance spectroscopy (EIS). The TiO2/Fe2O3 core/shell photoanode is further studied from the band gap view toward increasing the photogenerated conduction band to reveal the fundamental insights behind.
2. Results and Discussion
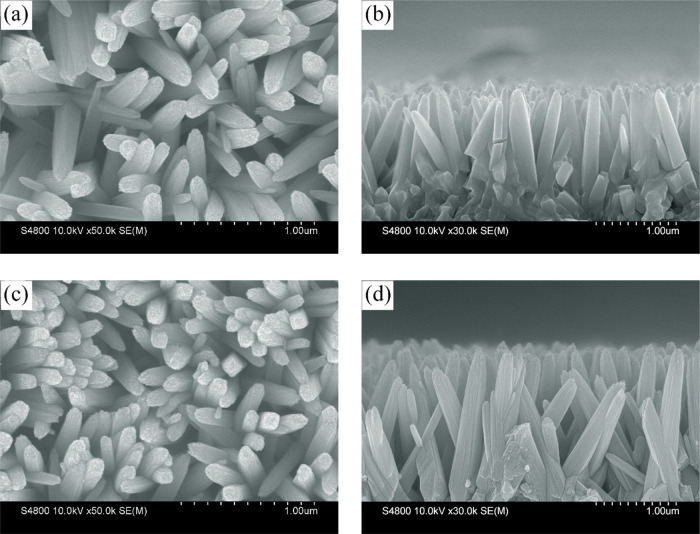
Figure 1 shows the SEM image of the morphology of TiO2 nanorod arrays and the sample after Fe2O3 loading. Figure 1a shows uniform and typical TiO2 nanorod arrays with about 150 nm diameter and a smooth top-side. From Figure 1b, we can see that the length of TiO2 nanorods is about 1.8 μm, which has been viewed as the suitable thickness for charge transport.24,30 Also, different lengths of TiO2 have been prepared, which could be found in Figure S1, and the 1.8 μm sample shows the best performance. Figure 1c,d gives the representative top-view and cross-sectional SEM images of TiO2/7 min Fe2O3 core/shell nanostructures, which were measured as the best samples in the following discussion. During the PLD process, high energy laser pulses bombard the surface of the Fe2O3 target and deposit it onto TiO2. From the top-view SEM image of Figure 1c, there is only little roughness change on the surface and all nanorods have similar morphologies. From the cross-sectional image of Figure 1d, we can identify that the top-side and down-side have nearly the same surface. We also prepared a 30 min long deposited time sample from which we can see that the morphology has been totally changed with a large amount of Fe2O3 (Figure S2). Through the comparison before and after the deposition of Fe2O3, we can see that a uniform film is well prepared by using PLD technology.
Figure 1.
SEM images of the (a) top view and (b) cross section of TiO2. (c) Top view and (d) cross section of the TiO2/7 min Fe2O3 core/shell nanostructure.
To discuss the crystallization state and the uniformity of the nanostructure after PLD Fe2O3 deposition, the XRD pattern (Figure 2a) was used here.
Figure 2.
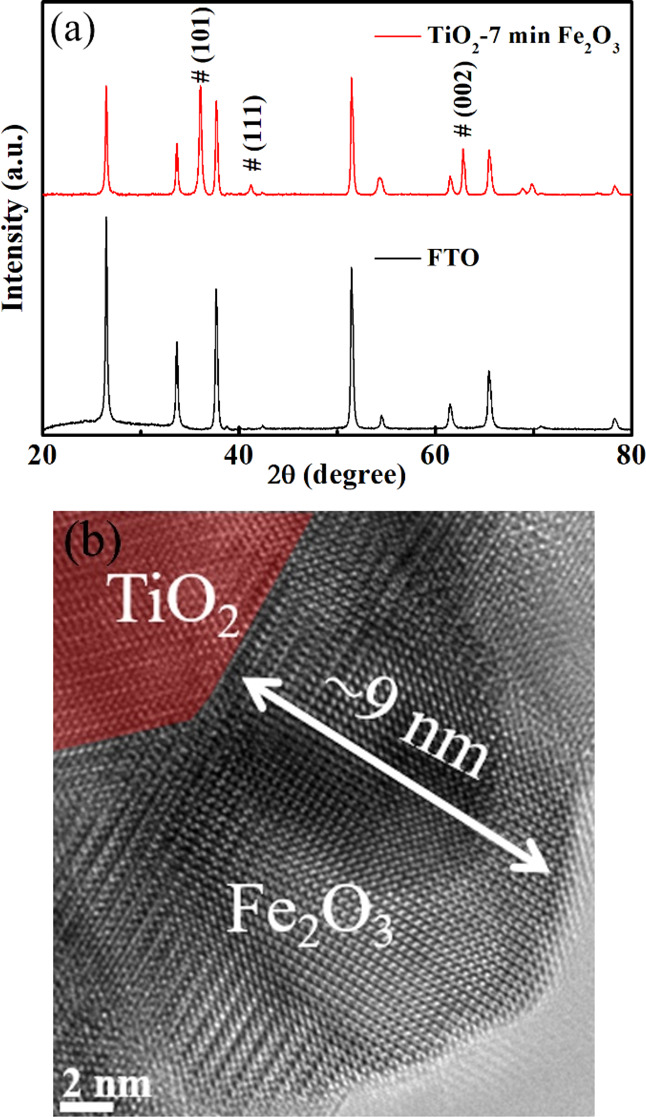
(a) XRD patterns of FTO glass and TiO2/7 min Fe2O3 core/shell nanostructure. (b) HRTEM of the TiO2/7 min Fe2O3 core/shell nanostructure.
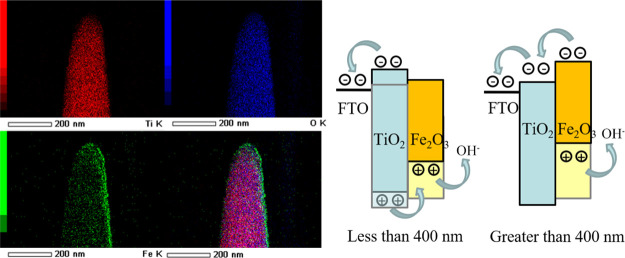
However, the characteristic peaks of Fe2O3 are hard to detect owing to the short depositing time, but the peaks of TiO2 can be detected easily due to its excellent crystallinity, which can be indexed to the rutile type (JCPDS no. 88-1175).31 To further identify Fe2O3, we deposited Fe2O3 on Si under the same experimental condition, and the XRD pattern could be found in Figure S3 from which we can see the peak of Fe2O3. From the HRTEM image (Figure 2b), we can see more details about the sample of the TiO2/7 min Fe2O3 nanostructure. The image shows that the Fe2O3 thin film has a high-quality crystalline structure with a clean external surface and ∼9 nm thickness, which is good for charge transport. The selected area electron diffraction (SAED) pattern (Figure S4) of TiO2/7 min Fe2O3 shows that it has very high crystallinity. A larger scale of Fe2O3 could be found in Figure S5 from which the surface of Fe2O3 is still clear. The TEM and SAED images of the TiO2 sample in Figure S6 show that the TiO2 nanorod has the (110) plane. In addition, it would be pertinent to mention that the surface (110) of the rutile has been shown to be highly active for photocatalytic water splitting as well as for applications in the areas of catalysis and photochemistry.32,33 The surface of TiO2 is like most hydrothermal crystals but not as clean as Fe2O3, which has a sharp surface. It is easy to identify the different elements from the EDAX mapping (Figure 3) of a single nanorod in which the green color shows that Fe of the Fe2O3 layer is continuously deposited on the surface of TiO2 not just on the top.
Figure 3.
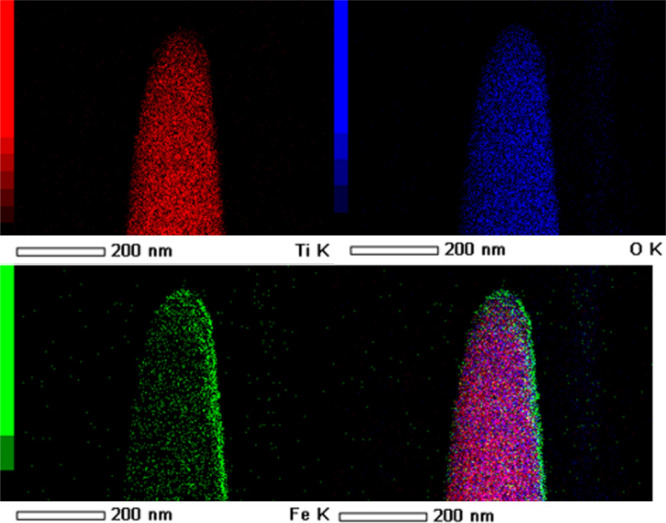
EDAX mapping of the TiO2/7 min Fe2O3 core/shell nanostructure by TEM.
Due to this, TEM only has one detector from one side to collect signals; the right side is brighter than the left side. The EDAX mapping from SEM (Figure S7) used here to identify large-sized nanorod arrays also showed the Fe being uniformly deposited from the top to the down-side of TiO2 nanorod arrays in which the red color shows Fe and the blue color shows Ti. Also, from the EDAX mapping of SEM, the atomic amount of Fe is only 3.9% (Table S1). Both morphology and elemental analysis show that an excellent Fe2O3 layer with a clean surface and high-quality crystalline structure can be obtained by this PLD process, which is good for the building of the TiO2/Fe2O3 core/shell nanostructure.
The electrochemical and optical performances for the varieties of TiO2/Fe2O3 photoanodes with changing deposition times and TiO2 photoanode are shown in Figure 5. Absorbance curves of different Fe2O3 deposited time samples in Figure 4a indicate that increasing the deposition time can increase the absorption edge to absorb more visible light. The thickness of the Fe2O3 layer is the most important part in this nanostructure in which the thicker Fe2O3 layer can absorb more light, but the thinner Fe2O3 layer has better electrotransport performance.
Figure 5.
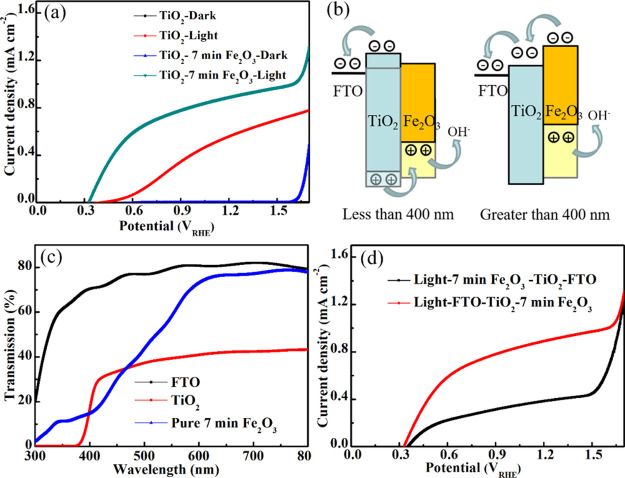
(a) J–V curves of TiO2 and the TiO2/7 min Fe2O3 core/shell nanostructure. (b) Band gap matching of the TiO2/7 min Fe2O3 core/shell nanostructure with different light wavelengths. (c) Transmission spectra of different substrates. (d) J–V curves of the TiO2/7 min Fe2O3 core/shell nanostructure with different illumination sides.
Figure 4.
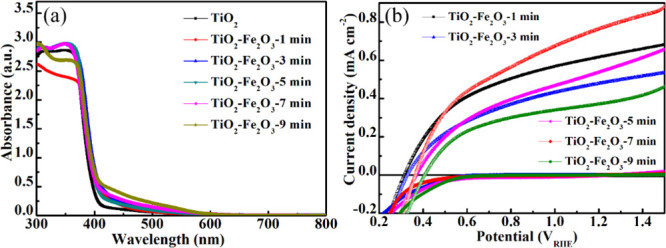
(a) Absorbance spectra of TiO2 and different deposited time TiO2/Fe2O3 core/shell nanostructures. (b) J–V curves of different Fe2O3 deposited core/shell nanostructures.
Figure 4b shows the J–V curves of different Fe2O3 deposited times under AM 1.5G irradiation (100 mW cm–2). The current density increased with increasing deposition time from 1 to 7 min and then decreased at 9 min in which the very thick Fe2O3 layer can destroy the charge transport ability of the core/shell nanostructure due to the poor charge transport of Fe2O3. According to the Nernst equation
where ERHE is the converted potential versus RHE and EoAg/AgCl = 0.1976 V at 25 °C; the potential that is tested by the Ag/AgCl and 1 M KOH (pH ∼13.6) system can be converted to the RHE system. The current density of the TiO2/7 min Fe2O3 device is 0.91 mA cm–2, and the TiO2 device is nearly 0.55 mA cm–2 in Figure 5a at 1.23 V versus RHE. Also, Figure 5a displays a reduced onset potential, which indicates the enhanced PEC water oxidation kinetics. The M-S measurement used here and shown in Figure S8, which displays a reduced onset potential of the TiO2/Fe2O3 sample, indicates the enhanced PEC water oxidation kinetics. Generally, the conduction band (CB) of TiO2 is (−4.1 eV) higher than that of Fe2O3 (−4.7 eV) and the valence band (VB) of TiO2 is (−7.2 eV) lower than that of Fe2O3 (−7.0 eV) in the vacuum system.34,35 Considering the band gap of these two materials, this core/shell nanostructure may not be suitable for carrier separation and transport to react with hydroxyl. In consideration, we propose a new carrier transport theory combined with photopotential with different light wavelengths; the translucent one represents the original band gap position, and the darker one represents the band gap after photogeneration (Figure 5b).
We prepared this water splitting system with the order of light source/FTO/TiO2/Fe2O3 (Figure S9) and divided the light wavelength into two parts; one is lower than 400 nm, which matches the TiO2 band gap absorption, and one is higher for Fe2O3. If the light whose wavelength is lower than 400 nm came from the FTO side to TiO2 nanorod arrays, both TiO2 and Fe2O3 have photogenerated potential, and almost all light can be absorbed by the TiO2 nanorod, which can be seen from the transmission spectrum (Figure 5c). Fe2O3 can still absorb a small amount of transmitted light to generate photogenerated carriers, but the small amount of photogenerated carriers in this part is difficult to transmit to the external circuit through energy band transition of TiO2. Therefore, we think that Fe2O3 only reflects the conductivity of semiconductor materials in this wavelength’s water splitting process and holes can transport to Fe2O3 to react with hydroxyl to generate O2. This process needs a very high quality of Fe2O3 films, which could transport most parts of carriers without recombination, and the thickness is also limited by the average diffusion length. If the light whose wavelength is higher than 400 nm came from FTO to the TiO2/Fe2O3 core/shell structure, TiO2 cannot absorb this part of the light, and Fe2O3 can absorb it. Photogenerated voltage will increase the energy band of Fe2O3 that is high enough to transport the photocarrier in the water splitting process, and the holes in Fe2O3 itself also can react with hydroxyl to get O2. According to this inference, the thicker Fe2O3 layer needs a higher photogenerated voltage to transport the carrier, which is the same as the results of Figure 4b; the thicker Fe2O3 sample has a higher onset potential. From the curves of the transmission pattern (Figure 5c), we prepared the sample with FTO glass, a TiO2 film, and 7 min of Fe2O3 directly deposited on FTO glass to check the light absorption capacity of the material itself. We can see that the cross point of two curves is 398 nm, which after that point, light can pass through the TiO2 to Fe2O3. When using light/FTO/TiO2/Fe2O3, almost all light whose wavelength is lower than 400 nm can be absorbed by TiO2, only the 2 nm part could not be absorbed, and the other part of the light can be absorbed by Fe2O3 to get high power conversion efficiency (PCE). However, when we use the light/Fe2O3/TiO2/FTO model, only the 2 nm part of the light can easily pass Fe2O3 to be absorbed by TiO2 and the other matched TiO2 band gap light may need to be absorbed by Fe2O3. Photogenerated carriers need to cross a high energy barrier to transport, which will get a lower PCE. To confirm this conclusion, we prepared the flipped system with the samples tested under the light source/Fe2O3/TiO2/FTO order and the transmittance was measured. As seen in Figure 5d, the value of the light/Fe2O3/TiO2/FTO sample at 1.23 V on the black curve is about 0.45 mA cm–2 lower than that of the light/FTO/TiO2/Fe2O3 sample and the value of the light/Fe2O3/TiO2/FTO sample is even lower than that of the TiO2 one. To further confirm this, a filter was used here to remove the wavelength that was higher than 400 nm and was put between the light source and TiO2/7 min Fe2O3 sample; the J–V curves are shown in Figure S10. When we measured like the order in Figure S8, the current density of the filter-used sample is similar to that of the TiO2 sample. However, when we illuminated from the back side with the light/Fe2O3/TiO2/FTO order, the current density has a significant reduction.
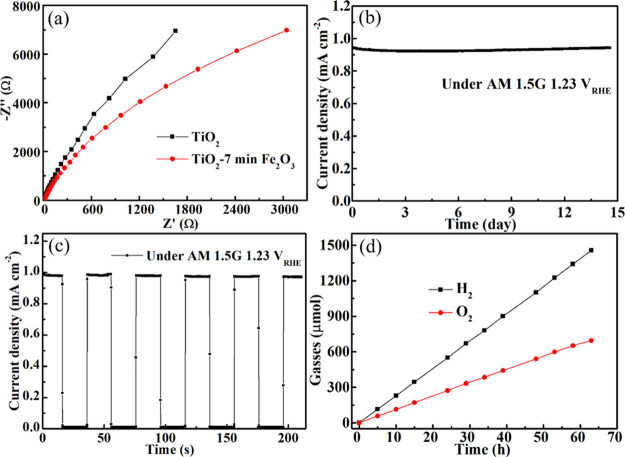
To gain deeper insight into the charge transfer and recombination processes before and after Fe2O3 treatment, the EIS measurement was used here. During this measurement, both TiO2 and TiO2/7 min Fe2O3 core/shell samples were tested under AM 1.5G (Figure 6a). When samples were measured under the light model, the smaller radius of Nyquist plots meant a less recombination rate. We can see that the radius of the TiO2/7 min Fe2O3 curve is smaller than that of the TiO2 one, meaning that TiO2/7 min Fe2O3 has a less recombination rate than TiO2. We attribute this result to the clean surface and high-quality crystalline structure of a PLD-prepared Fe2O3 thin film, which directly contacts with the electrolyte. The Nyquist plots of Fe2O3 with different deposited times were measured and are shown in Figure S11 in which the 7 min sample also shows the best performance.
Figure 6.
(a) Nyquist plots of TiO2 and the TiO2/7 min Fe2O3 core/shell nanostructure. (b) Long-time measurement, (c) on/off measurement, and (d) gasses measurement of the TiO2/7 min Fe2O3 core/shell nanostructure under AM 1.5G 1.23 VRHE.
The stability measurement was executed over the TiO2/7 min Fe2O3 core/shell sample for more than 1 week. From Figure 6b, we can see that the current density still remains high after 14 days of measurement and exhibits only a 3% decrease. The performance of devices even has increased after 84 h, which can be considered as temperature increased by continuous exposure. The pristine TiO2 prepared water splitting cells were also tested for 30,000 s and are shown in Figure S12, which has obviously decreased with long-time measurement. We consider that this low decay can be attributed to a high quality of a PLD-prepared Fe2O3 film and effective charge transport in this core/shell nanostructure. From the on/off light measurement also prepared in Figure 6c, we can see that there are nearly no peaks at the light on and light off point. This measurement also shows that the sample has good charge separation capability. The gas evolution measurement was also used here to check the products, and all electrodes are sealed in a container and connected to the gas detection device (Figure S13) and tested under AM 1.5G with 1.23 VRHE. From Figure 6d, the rate for O2 evolution is about 10.7 μmol h–1 cm–2 and there is no obvious decay after 70 h of testing. O2 evolution is nearly the same with half the amount of holes passing through the outer circuit, which means that almost all the holes were used for water oxidation. From these analyses, the TiO2/Fe2O3 core/shell nanostructure provides several advantages of effective light absorption, photogenerated carrier separation, and low recombination rate, thus resulting in improved PEC performance.
3. Conclusions
In summary, we designed and investigated TiO2/Fe2O3 core/shell nanostructures as photoanodes for PEC water splitting. Due to the high-quality PLD-prepared Fe2O3 shell, the photocurrent density is enhanced to 0.91 mA cm–2 under AM 1.5G, which is nearly twice as high as that of plain TiO2. The effective visible light absorption, excellent carrier transport and separation, and low recombination rate synergistically contribute to the enhanced PEC water splitting performance. We hope that our findings open a promising route to design complex nanostructures by using unconventional technologies and can be universally applied in other solar energy fields.
4. Experimental Section
4.1. Preparation of Photoanodes
These photoanodes were fabricated on FTO substrates, which were washed for 30 min each with acetone, ethyl alcohol, and deionized water in an ultrasonic bath. First, the TiO2 nanorod arrays were prepared by a chemical hydrothermal method. Precursor solution consisted of 0.269 g of citric acid (anhydrous; Sigma-Aldrich), 1 mL of titanium(IV) butoxide (97%; Sigma-Aldrich), 30 mL of hydrochloric acid (36.5–38%; Sigma-Aldrich), and 30 mL of deionized water. A cleaned FTO substrate was immersed in the precursor of a 100 mL Teflon-lined stainless steel autoclave with the conductive side facing downward. The autoclave was put into the oven before opening the heating procedure. The autoclave was heated to 155 °C for 6 h and naturally cooled to room temperature. After the reaction process, the samples were rinsed with deionized water to remove the foreign matters deposited on the surface of the sample. Second, TiO2/Fe2O3 photoanodes were prepared by the PLD (STPLD; Pascal Co. Ltd., Japan) method using Fe2O3 pellets (Hefei Kejing Co. Ltd., China) as targets and the prepared TiO2 nanostructure as a substrate. The temperature for deposition was 550 °C. The chamber of the PLD machine was first evacuated lower than 10–4 Pa. For the preparation of Fe2O3, pure O2 was introduced into the chamber until the pressure became 3–4 Pa. The laser was used to irradiate for different amounts of time, and we took a sample every 2 min, namely, 1, 3, 5, 7, and 9 min. After the laser irradiation, the film was kept at 550 °C for 30 min as a post-heat treatment.
4.2. Characterization
The morphology of the samples was characterized using field-emission scanning electron microscopy (FE-SEM; Hitachi, S4800) and high-resolution transmission electron microscopy (HRTEM; Jeol, JEM2100F). The phase of products was checked by X-ray diffraction (XRD, RIGAKU Rint-2000 X-ray diffractometer, Cu Kα radiation, λ = 0.15418 nm). The current density versus potential and incident photon-to-current conversion efficiency (IPCE) were measured using a WXS-80C-3 solar simulator under AM 1.5G (100 mW cm–2). The absorbance and transmission spectra were detected using a UV–vis spectrophotometer (Shimadzu UV-2500). Electrochemical impedance spectroscopy (EIS) and Mott–Schottky (M-S) were measured with an electrochemical workstation (ALS/CH model 650A) under light with an alternative signal amplitude of 5 mV and a frequency range of 1.0 × 10⁵ to 4.0 × 10⁵ Hz.
4.3. Photoelectrochemical Measurements
Photoelectrochemical measurements were carried out in the electrolyte containing 1 M KOH (pH ∼13.6) under a three-electrode system. The work electrodes were the as-prepared FTO/TiO2 or FTO/TiO2/Fe2O3 samples, the counter electrode was a Pt sheet, and the reference electrode was a saturated Ag/AgCl electrode. Before the measurement, the inert gas Ar was used to remove the dissolved oxygen in the electrolyte for about 30 min and it was kept under the process of testing. The long-time stability and time curves with light on/off cycle measurements were performed in a closed system under simulated AM 1.5G solar illumination. The curves were recorded by scanning the potential from the negative to the positive direction with a scan rate of 0.01 V s–1. M-S plots were obtained by the same workstation at an AC frequency of 103 Hz with an amplitude of 5 mV under light.
Acknowledgments
We thank Prof. Jinhua Ye as most parts of this work were finished by her group in NIMS. We acknowledge the support from the National Natural Science Foundation of China (51802210 and 11504254), the Natural Science Foundation of the Jiangsu Higher Education Institutions of China (18KJB430023), and the Natural Science Foundation of Jiangsu Province (BK20180970 and BK20190938), a project funded by China Postdoctoral Science Foundation (2019M651935) and Jiangsu Laboratory of Biological and Chemical Sensing and Biochip.
Supporting Information Available
The Supporting Information is available free of charge at https://pubs.acs.org/doi/10.1021/acsomega.0c02838.
Morphology characterization: SEM and TEM images; elemental analysis: SAED, EDAX, and XRD pattern; electrochemical testing: J–V measurement, J–t measurement, and Nyquist measurement; and schematic and photo of devices (PDF)
The authors declare no competing financial interest.
Supplementary Material
References
- Walter M. G.; Warren E. L.; McKone J. R.; Boettcher S. W.; Mi Q.; Santori E. A.; Lewis N. S. Solar Water Splitting Cells. Chem. Rev. 2010, 110, 6446–6473. 10.1021/cr1002326. [DOI] [PubMed] [Google Scholar]
- Liao A.; Chen R.; Fan F.; Xiao L.; He H.; Zhang C.; Asiri A. M.; Zhou Y.; Li C.; Zou Z. Integration of FexS Electrocatalysts and Simultaneously Generated Interfacial Oxygen Vacancies to Synergistically Boost Photoelectrochemical Water Splitting of Fe2O3 Photoanodes. Chem. Commun. 2018, 54, 13817–13820. 10.1039/C8CC08350A. [DOI] [PubMed] [Google Scholar]
- Luo H.; Zeng Z.; Zeng G.; Zhang C.; Xiao R.; Huang D.; Lai C.; Cheng M.; Wang W.; Xiong W.; Yang Y.; Qin L.; Zhou C.; Wang H.; Zhou Y.; Tian S. Recent Progress on Metal-organic Frameworks Based- and Derived-Photocatalysts for Water Splitting. Chem. Eng. J. 2020, 383, 123196. 10.1016/j.cej.2019.123196. [DOI] [Google Scholar]
- Niu F.; Wang D.; Li F.; Liu Y.; Shen S.; Meyer T. J. Hybrid Photoelectrochemical Water Splitting Systems: From Interface Design to System Assembly. Adv. Energy Mater. 2019, 10, 1900399. 10.1002/aenm.201900399. [DOI] [Google Scholar]
- Fujishima A.; Honda K. Electrochemical Photolysis of Water at a Semiconductor Electrode. Nature 1972, 238, 37. 10.1038/238037a0. [DOI] [PubMed] [Google Scholar]
- Miyoshi A.; Nishioka S.; Maeda K. Water Splitting on Rutile TiO2-Based Photocatalysts. Chem. – Eur. J. 2018, 24, 18204–18219. 10.1002/chem.201800799. [DOI] [PubMed] [Google Scholar]
- Matsubara K.; Inoue M.; Hagiwara H.; Abe T. Photocatalytic Water Splitting over Pt-loaded TiO2(Pt/TiO2) Catalysts Prepared by the Polygonal Barrel-Sputtering Method. Appl. Catal., B 2019, 254, 7–14. 10.1016/j.apcatb.2019.04.075. [DOI] [Google Scholar]
- Cheng X.; Zhang Y.; Hu H.; Shang M.; Bi Y. High-efficiency SrTiO3/TiO2 Hetero-photoanode for Visible-light Water Splitting by Charge Transport Design and Optical Absorption Management. Nanoscale 2018, 10, 3644–3649. 10.1039/C7NR09023D. [DOI] [PubMed] [Google Scholar]
- Chandrasekaran S.; Kim E. J.; Chung J. S.; Yoo I.-K.; Senthilkumar V.; Kim Y. S.; Bowen C. R.; Adamaki V.; Hur S. H. Structurally Tuned Lead Magnesium Titanate Perovskite as a Photoelectrode Material for Enhanced Photoelectrochemical Water Splitting. Chem. Eng. J. 2017, 309, 682–690. 10.1016/j.cej.2016.10.087. [DOI] [Google Scholar]
- Li Z.; Yao C.; Yu Y.; Cai Z.; Wang X. Highly Efficient Capillary Photoelectrochemical Water Splitting Using Cellulose Nanofiber-Templated TiO2 Photoanodes. Adv. Mater. 2014, 26, 2262–2267. 10.1002/adma.201303369. [DOI] [PubMed] [Google Scholar]
- Liu N.; Schneider C.; Freitag D.; Hartmann M.; Venkatesan U.; Müller J.; Spiecker E.; Schmuki P. Nano Lett. 2014, 14, 3309–3313. 10.1021/nl500710j. [DOI] [PubMed] [Google Scholar]
- Pang Y.; Zang W.; Kou Z.; Zhang L.; Xu G.; Lv J.; Gao X.; Pan Z.; Wang J.; Wu Y. Assembling of Bi Atoms on TiO2 Nanorods boosts Photoelectrochemical Water Splitting of Semiconductors. Nanoscale 2020, 12, 4302–4308. 10.1039/D0NR00004C. [DOI] [PubMed] [Google Scholar]
- Fu Y.; Dong C.-L.; Zhou W.; Lu Y.-R.; Huang Y.-C.; Liu Y.; Guo P.; Zhao L.; Chou W.-C.; Shen S. A Ternary Nanostructured α-Fe2O3/Au/TiO2 Photoanode with Reconstructed Interfaces for Efficient Photoelectrocatalytic Water Splitting. Appl. Catal., B 2020, 260, 118206. 10.1016/j.apcatb.2019.118206. [DOI] [Google Scholar]
- Sharma P.; Jang J.-W.; Lee J. S. Key Strategies to Advance the Photoelectrochemical Water Splitting Performance of α-Fe2O3 Photoanode. ChemCatChem 2018, 11, 157–179. 10.1002/cctc.201801187. [DOI] [Google Scholar]
- Chong R.; Du Y.; Chang Z.; Jia Y.; Qiao Y.; Liu S.; Liu Y.; Zhou Y.; Li D. 2D Co-incorporated Hydroxyapatite Nanoarchitecture as a Potential Efficient Oxygen Evolution Cocatalyst for boosting Photoelectrochemical Water Splitting on Fe2O3 Photoanode. Appl. Catal., B 2019, 250, 224–233. 10.1016/j.apcatb.2019.03.038. [DOI] [Google Scholar]
- Sivula K.; Le Formal F.; Grätzel M. Solar Water Splitting: Progress Using Hematite (α-Fe2O3) Photoelectrodes. ChemSusChem 2011, 4, 432–449. 10.1002/cssc.201000416. [DOI] [PubMed] [Google Scholar]
- Yu Q.; Meng X.; Wang T.; Li P.; Ye J. Hematite Films Decorated with Nanostructured Ferric Oxyhydroxide as Photoanodes for Efficient and Stable Photoelectrochemical Water Splitting. Adv. Funct. Mater. 2015, 25, 2686–2692. 10.1002/adfm.201500383. [DOI] [Google Scholar]
- Wang L.; Lee C.-Y.; Mazare A.; Lee K.; Müller J.; Spiecker E.; Schmuki P. Enhancing the Water Splitting Efficiency of Sn-Doped Hematite Nanoflakes by Flame Annealing. Chem. – Eur. J. 2014, 20, 77–82. 10.1002/chem.201303427. [DOI] [PubMed] [Google Scholar]
- Han H.; Kment S.; Karlicky F.; Wang L.; Naldoni A.; Schmuki P.; Zboril R. Sb-Doped SnO2 Nanorods Underlayer Effect to the α-Fe2O3 Nanorods Sheathed with TiO2 for Enhanced Photoelectrochemical Water Splitting. Small 2018, 14, 1703860. 10.1002/smll.201703860. [DOI] [PubMed] [Google Scholar]
- Xu D.; Xia T.; Xu H.; Fan W.; Shi W. Synthesis of Ternary Spinel MCo2O4 (M = Mn, Zn)/BiVO4 Photoelectrodes for Photolectrochemical Water Splitting. Chem. Eng. J. 2020, 392, 124838. 10.1016/j.cej.2020.124838. [DOI] [Google Scholar]
- Zhao R.; Zhong J.; Ji C.; Zhao J.; Lu H. Three-dimensional ZnO/ZnxCd1-xS/CdS Nanostructures Modified by Microwave Hydrothermal Reaction-deposited CdSe Quantum dots for Chemical Solar Cells. Sol. Energy 2019, 191, 78–83. 10.1016/j.solener.2019.08.066. [DOI] [Google Scholar]
- Li C.; Chen Z.; Yuan W.; Xu Q.-H.; Li C. M. In situ Growth of α-Fe2O3@Co3O4 Core-shell Wormlike Nanoarrays for a Highly Efficient Photoelectrochemical Water Oxidation Reaction. Nanoscale 2019, 11, 1111–1122. 10.1039/C8NR07041E. [DOI] [PubMed] [Google Scholar]
- Yang W.; Yu Y.; Starr M. B.; Yin X.; Li Z.; Kvit A.; Wang S.; Zhao P.; Wang X. Ferroelectric Polarization-Enhanced Photoelectrochemical Water Splitting in TiO2-BaTiO3 Core-Shell Nanowire Photoanodes. Nano Lett. 2015, 15, 7574–7580. 10.1021/acs.nanolett.5b03988. [DOI] [PubMed] [Google Scholar]
- Wang X.; Li Z.; Xu W.; Kulkarni S. A.; Batabyal S. K.; Zhang S.; Cao A.; Wong L. H. TiO2 Nanotube Arrays Based Flexible Perovskite Solar Cells with Transparent Carbon Nanotube Electrode. Nano Energy 2015, 11, 728–735. 10.1016/j.nanoen.2014.11.042. [DOI] [Google Scholar]
- Smith W.; Wolcott A.; Fitzmorris R. C.; Zhang J. Z.; Zhao Y. Quasi-core-shell TiO2/WO3 and WO3/TiO2 Nanorod Arrays Fabricated by Glancing Angle Deposition for Solar Water Splitting. J. Mater. Chem. 2011, 21, 10792–10800. 10.1039/c1jm11629k. [DOI] [Google Scholar]
- Zhao R.; Chen Y.; Ji Y.; Li W.; Chen L.; He A.; Lu H.; Zhao M.; Yao J.; Jiang Y.; Liu G.; Gao J.; Wang H.; Yang H. Controllable Conduction and Hidden Phase Transitions Revealed via Vertical Strain. Appl. Phys. Lett. 2019, 114, 252901. 10.1063/1.5096833. [DOI] [Google Scholar]
- Milenov T.; Dikovska A.; Avdeev G.; Avramova I.; Kirilov K.; Karashanova D.; Terziyska P.; Georgieva B.; Arnaudov B.; Kolev S.; Valcheva E. Pulsed Laser Deposition of Thin Carbon Films on SiO2/Si Substrates. Appl. Surf. Sci. 2019, 480, 323–329. 10.1016/j.apsusc.2019.02.220. [DOI] [Google Scholar]
- Wang H.; Wu Y.; Ma M.; Dong S.; Li Q.; Du J.; Zhang H.; Xu Q. Pulsed Laser Deposition of CsPbBr3 Films for Application in Perovskite Solar Cells. ACS Appl. Energy Mater. 2019, 2, 2305. 10.1021/acsaem.9b00130. [DOI] [Google Scholar]
- Ojeda-G-P A.; Döbeli M.; Lippert T. Influence of Plume Properties on Thin Film Composition in Pulsed Laser Deposition. Adv. Mater. Interfaces 2018, 5, 1701062. 10.1002/admi.201701062. [DOI] [Google Scholar]
- Lu H.; Zhong J.; Ji C.; Zhao J.; Li D.; Zhao R.; Jiang Y.; Fang S.; Liang T.; Li H.; Li C. M. Fabricating an Optimal Rutile TiO2 Electron Transport Layer by Delicately Tuning TiCl4 Precursor Solution for High Performance Perovskite Solar Cells. Nano Energy 2020, 68, 104336. 10.1016/j.nanoen.2019.104336. [DOI] [Google Scholar]
- Liu Q.; Lu H.; Shi Z.; Wu F.; Guo J.; Deng K.; Li L. 2D ZnIn2S4 Nanosheet/lD TiO2 Nanorod Heterostructure Arrays for Improved Photoelectrochemical Water Splitting. ACS Appl. Mater. Interfaces 2014, 6, 17200–17207. 10.1021/am505015j. [DOI] [PubMed] [Google Scholar]
- Prathan A.; Sanglao J.; Wang T.; Bhoomanee C.; Ruankham P.; Gardchareon A.; Wongratanaphisan D. Controlled Structure and Growth Mechanism behind Hydrothermal Growth of TiO2 Nanorods. Sci. Rep. 2020, 10, 8065. 10.1038/s41598-020-64510-6. [DOI] [PMC free article] [PubMed] [Google Scholar]
- Soundarrajan P.; Sankarasubramanian K.; Sethuraman K.; Ramamurthi K. Controlled (110) and (101) crystallographic plane growth of single crystalline rutile TiO2 nanorods by facile low cost chemical methods. CrystEngComm 2014, 16, 8756. 10.1039/C4CE00820K. [DOI] [Google Scholar]
- Kalathil S.; Khan M. M.; Ansari S. A.; Lee J.; Cho M. H. Band Gap Narrowing of Titanium Dioxide (TiO2) Nanocrystals by Electrochemically Active Biofilms and Their Visible Light Activity. Nanoscale 2013, 5, 6323–6326. 10.1039/c3nr01280h. [DOI] [PubMed] [Google Scholar]
- Kumar P.; Rawat N.; Hang D.-R.; Lee H.-N.; Kumar R. Controlling Band Gap and Refractive Index in Dopant-Free α-Fe2O3 Films. Mater. Lett. 2015, 11, 13–23. 10.1007/s13391-014-4002-0. [DOI] [Google Scholar]
Associated Data
This section collects any data citations, data availability statements, or supplementary materials included in this article.


