Abstract
δ-tocotrienol (DT3), a member of vitamin E family, has been shown to have potent radio-protective effect. However, its application as a radioprotectant has limited, at least in part, by its short plasma elimination half-life and low bioavailability. In an effort to increase the metabolic stability of DT3, a deuterium substituted DT3 derivative, d6-DT3, was designed and synthesized. d6-DT3 showed improved in vitro and in vivo metabolic stability compared to DT3. The unexpected lower potency of d6-DT3 in inducing granulocyte-colony stimulating factor (G-CSF) production in mouse revealed that the metabolite(s) of DT3 might play a major role in inducing G-CSF induction.
Keywords: Tocotrienol, Deuteration, Metabolic stability, Radio-protector, Pharmacokinetics
Graphical Abstract

1. Introduction
Vitamin E, known for its anti-oxidant activity,1–5 is a generic term used to describe two classes of compounds, tocopherols and tocotrienols, both having α-, β-, γ-, and δ-homologs. Tocopherols and tocotrienols share the same chroman ‘head’, but are distinguished by different hydrocarbon ‘tails’, with tocotrienols having an unsaturated farnesyl tail and tocopherols bearing a saturated phytyl tail.6 Although early studies are mostly focused on α-tocopherol as it is the most abundant constituent in the vitamin E family,7 more recent studies have found that tocotrienols are superior to α-tocopherol in terms of potential uses against chronic diseases.8 γ-Tocotrienol (GT3) and δ-tocotrienol (DT3) (Fig. 1) are two of the tocotrienol homologs that have been studied the most for their promising radio-protective effects. Both GT3 and DT3 can increase the survival rate of radiated mice by protecting them against radiation-induced hematopoietic and gastrointestinal injury.9 Mechanisms proposed for their protecting effects include stimulating cytokine production, up-regulating anti-apoptotic genes, and inhibiting pro-inflammatory factors.10–23
Fig. 1.
Structures of DT3, GT3, δ-tocoflexol, and DT3-F2.
Encouraging radio-protective effects of GT3 has also been observed in non-human primate (NHP) models.20,24 In a phase 2 clinical trial, Tocovid SupraBio™, a specially formulated supplement containing GT3 and DT3, was used in combination with pentoxifylline, an anti-inflammatory drug, for radiation-induced fibrosis.25
Despite the promising radio-protective effects of DT3 and GT3, they both have short plasma elimination half-lives and low bioavailability,26,27 which limit their exposure in systemic circulation and require that they be administered in large doses.11 The short half-lives and low bioavailability of DT3 and GT3 are at least in part attributed to their fast liver metabolism. So far, most research efforts to improve the bioavailability of DT3 and GT3 have been focused on using pharmaceutical formulation methods including development of a self-emulsifying dosage form28 and incorporating them into γ-cyclodextrin.29 Our lab has been applying medicinal chemistry strategies to improve the pharmacokinetic (PK) profiles of DT3 and GT3. Previously, we have prepared tocodienol6 and difluoro-DT330 (Fig. 1) in attempts to improve bioavailability by increasing binding affinity to α-tocopherol transfer protein and by increasing metabolic stability of DT3, respectively. However, these efforts met with little success.
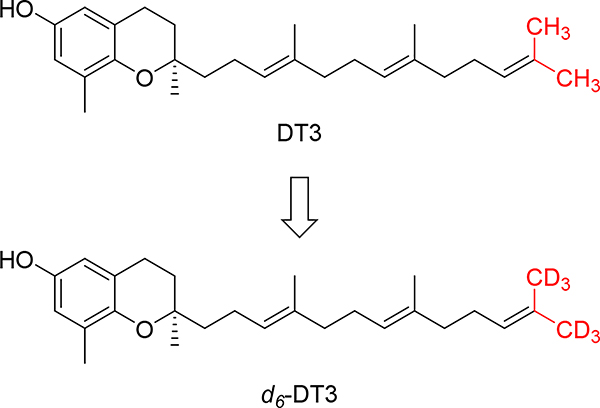
Deuteration is a useful and increasingly popular medicinal chemistry strategy to alter the pharmacokinetic properties of drug molecules.34 A handful of deuterium-containing compounds are now in clinical studies for various indications. 31,32Importantly, the FDA approval of deutetrabenazine established a roadmap for the development and marketing of deuterated drugs.33 Deuterated compounds in which the hydrogen atoms at positions that are known to be metabolically labile are substituted by deuterium atoms will potentially have improved metabolic stability, which could translate into increased systemic drug exposure and decreased formation of toxic or reactive metabolites. According to published data, the metabolism of tocotrienols follows ω-hydroxylase metabolic pathway where CYP4F2-mediated a ω-oxidation is the rate-limiting step,30,34,35 indicating that the terminal C-H bonds are the metabolically labile sites. As such, we designed d6-DT3, in which both terminal methyl groups of DT3 are fully deuterated (Fig. 2). Herein, we present the synthesis and evaluation of in vitro metabolic stability and in vivo G-CSF (granulocyte-colony stimulating factor) stimulating effects of d6-DT3.
Fig. 2.
Structures of δ-tocotrienol (DT3) and the deuterated DT3, d6-DT3
2. Results and discussion
2.1. Chemistry
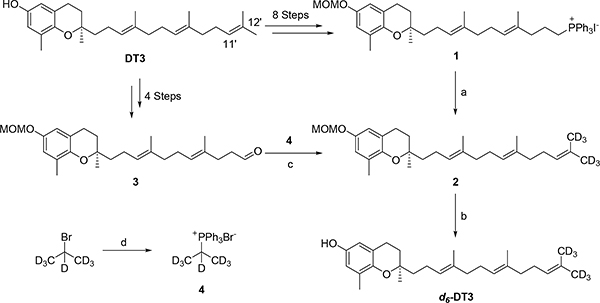
DT3 was initially converted to Wittig salt 1 in eight steps according to the method we have recently reported.30 Wittig olefination reaction between 1 and d6-propanone led to compound 2, which was de-protected to afford d6-DT3 (Scheme 1). However, the synthesis is lengthy and the overall yield was < 10%. Alternatively, DT3 was converted to aldehyde 3 in four steps via a selective cleavage of the C11′-C12′ double bond of DT3.30,36 Compound 3 was then coupled with Wittig salt 4, prepared from d7-2-bromopropane, to yield 2. Removal of the MOM protection group of 2 afforded the final product d6-DT3 (Scheme 1). With ~20% overall yield, this 6-step method was thus chosen for the scale-up synthesis from which ~1 g of d6-DT3 was obtained. The NMR spectra of DT3 and d6-DT3 can be found in the supporting information.
Scheme 1.
Synthesis of d6-DT3. Reagents and conditions: (a) n-BuLi, d6-propanone, THF, −78 °C, 39%; (b) 0.5 N HCl in 1,4-dioxane and THF, 95%; (c) KHMDS, THF, −78 °C, 76%; (d) Triphenylphosphine, 150 °C, sealed tube, 61%.
2.2. In-vitro metabolic stability
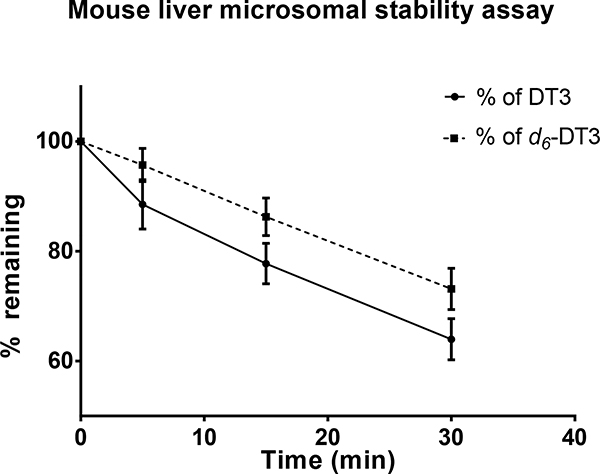
In vitro metabolic stability assay using liver microsomes is a common assay for early estimation and prediction of in vivo metabolism of compounds.37 We used mouse liver microsomes to evaluate the metabolic stability of d6-DT3 in comparison to DT3. The time courses of DT3 and d6-DT3 degradation in mouse liver microsomes are depicted in Fig. 3, and the in vitro half-lives and intrinsic clearances of these compounds are summarized in Table 1. We found that both DT3 and d6-DT3 degradation in mouse liver microsomes were both NADPH-dependent since no degradation was observed in the absence of NADPH (data not shown) in either case, indicating the involvement of CYP450 in their metabolism. Side by side comparison between d6-DT3 and DT3 revealed that d6-DT3 was degraded at a slower rate than that for DT3 and with a longer in vitro half-live and lower intrinsic clearance (Fig. 3, Table 1).
Fig. 3.
Metabolism of DT3 and d6-DT3 in mouse liver microsomes. DT3 and d6-DT3 (1 μM) were incubated individually with mouse liver microsomes (5 mg protein/mL), and their percentages of remaining drug were determined at the indicated time points. Error bars represent means ± SD, n = 3.
Table 1.
In vitro half-life and Clin,u of DT3 and d6-DT3 in mouse liver microsomes
| Compound | in vitro half-life* (min) | in vitro Clin,u (μL·min−1·mg protein−1)* |
|---|---|---|
| DT3 | 106.7 ± 14.8 | 5260.0 ± 657.7 |
| d6-DT3 | 158.5 ± 28.0 | 3580.0 ± 627.8 |
In vitro half-life and Clin,u calculation followed literature procedure38; Data are expressed as mean ± SD; P < 0.05 for both the in vitro half-life data and in vitro Clin,u data (P values result from unpaired t test).
2.3. In-vivo PK study
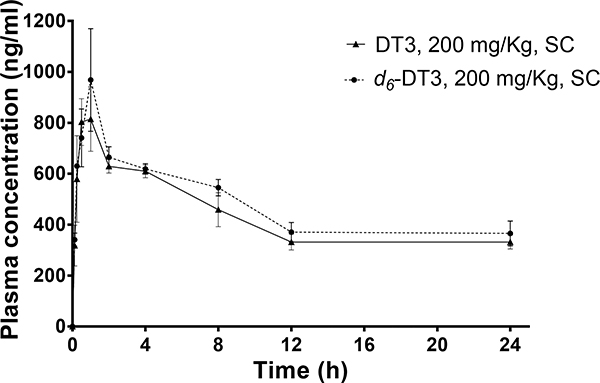
The in vitro metabolic stability data prompted us to carry out in vivo metabolic stability comparison between d6-DT3 and DT3. Following subcutaneous administration, plasma drug concentrations of DT3 or d6-DT3 were determined at various time points up to 24 h. As shown in Fig. 4, a rapid plasma drug concentration increase was observed with peak plasma drug concentrations (800 ng/mL to 1000 ng/mL) occurring at about 1 h post-injection (Fig. 4). After 1 h, plasma drug concentrations decreased rapidly at first and then reached a plateau. The plateaued plasma drug concentration is likely due to the depot effect of subcutaneous tissue for the highly lipophilic DT3 and d6-DT3 molecules. In addition, the extensive distribution of DT3 and d6-DT3 into adipose tissue with redistribution back to plasma might also help maintain the relatively stable plasma levels after 12 h. In this respect, in a GT3 tissue distribution study by Deng et al, the authors observed a long-lasting adipose tissue distribution of GT3.39 Calculation of PK parameters of CD2F1 mice administered with DT3 or d6-DT3 revealed that d6-DT3 displayed slightly superior PK properties than DT3 with an elevated Cmax (970 ng/mL vs 810 ng/mL) and higher exposure (AUC0-last, 11357 h·ng·mL−1 vs 10314 h·ng·mL−1) (Table 2).
Fig. 4.
Plasma DT3/d6-DT3 concentration-time profiles after a single subcutaneous (SC) dose (200 mg/Kg) in mice. Error bars represent means ± SD, n = 3–4.
Table 2.
PK parameters of subcutaneously administered DT3 or d6-DT3 (200 mg/Kg) in mice
| PK parameters | DT3 | d6-DT3 |
|---|---|---|
| AUC0-last (h·ng·mL−1) | 10314 | 11357 |
| Cmax (ng·mL−1) | 810 | 970 |
| Tmax (h) | 1 | 1 |
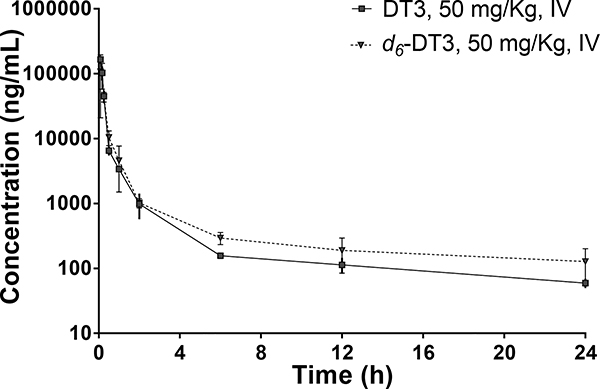
To further profile the PK properties of d6-DT3 and compare them with those of DT3, CD2F1 mice were intravenously dosed with 50 mg/kg of DT3 or d6-DT3, and the plasma drug concentrations were determined at various time points up to 24 h (Fig. 5). Plotting plasma drug concentrations against time revealed a biphasic decline after dosing, with an initial rapid decline followed by a more gradual decline. The initial rapid decline in plasma concentration could be due to rapid distribution of DT3 and d6-DT3 to peripheral tissues such as adipose, liver, and heart39.
Fig. 5.
Plasma DT3/d6-DT3 concentration-time profiles after a single intravenous (IV) dose in mice. Error bars represent means ± SD, n = 3–4.
While the second phase of gradual decline in plasma concentration could be due to the metabolism. The overlapped distribution phase of DT3 and d6-DT3 could be explained by their identical physical chemical properties. However, comparing with DT3, d6-DT3 gave slightly higher plasma concentrations and relatively slower degradation on the second phase, which were translated into more favorable PK properties of d6-DT3 including increased exposure and lower clearance (Table 3).
Table 3.
PK parameters of intravenously administered DT3 or d6-DT3 (50 mg/Kg) in mice
| Parameters | DT3 | d6-DT3 |
|---|---|---|
| AUC0-last (h·ng·mL−1) | 32804 | 34213 |
| AUC0-∞ (h·ng·mL−1) | 33456 | 35707 |
| Ke (h−1) | 0.0721 | 0.0656 |
| Cl (L·Kg−1·h−1) | 1.495 | 1.400 |
| Vd (L·Kg−1) | 20.7 | 21.3 |
2.4. In-vivo G-CSF stimulation study
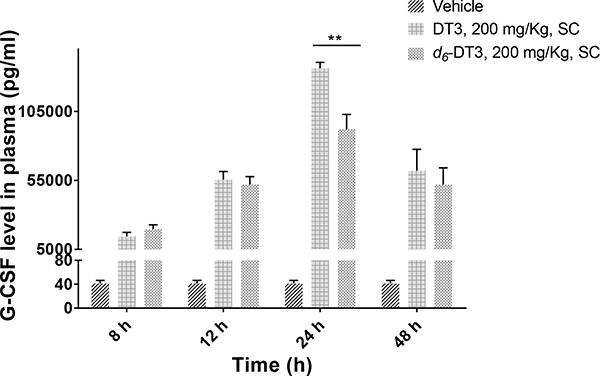
In view of the improved PK properties of d6-DT3, an in vivo G-CSF stimulation assay was carried out. G-CSF is a cytokine that is capable of stimulating bone marrow hematopoiesis to produce granulocytes, which are important for innate immunity against infection. By virtue of its ability to stimulate the growth of neutrophil colonies, recombinant human G-CSF (neupogen®), together with pegylated G-CSF (Neulasta®), have been approved by the FDA to treat neutropenia caused by chemotherapy or radiotherapy. G-CSF was also approved by the FDA for the indication of acute radiation syndrome (ARS), and it is stockpiled in the Strategic National Stockpile (SNS) under the Pandemic and ALL-HAZARDS Preparedness Reauthorization Act (PAHPRA) of 2013.40,41 Several promising radiation countermeasures, including 5-androstenediol, CBLB502, DT3, and GT3, have been reported to induce high levels of G-CSF,40 indicating significant role for G-CSF in the radio-protective effects of these radiation countermeasures. It has been reported that the radio-protective effect of DT3 can be abrogated by anti-G-CSF antibody, suggesting that the radio-protective effect of DT3 is mediated through G-CSF.18 With only subtle structural modification based on DT3, we assumed that d6-DT3 might also exert its radio-protective effect through induction of G-CSF. As we expected, significant G-CSF production in mice was observed after DT3/d6-DT3 treatment (Fig. 6). Following a lag time of about 6 h, plasma G-CSF concentrations were observed to increase in a time-dependent manner starting at 8 h, and peaked at 24 h. After 24 h, the G-CSF level began to decline due to the clearance of both DT3/d6-DT3 and G-CSF. The G-CSF production peaks at 24 h, which may explain why giving DT3 24 h prior to radiation exposure exerts the best radio-protective effect in mice survival studies.9,16 It is noteworthy that the 24-hour G-CSF level induced by DT3 is significant (P < 0.05) higher than that induced by d6-DT3. This observation led us to speculate that the metabolite(s) of DT3 might be responsible for G-CSF induction.
Fig. 6.
DT3 and d6-DT3 stimulated G-CSF production in a time dependent manner. Plasma G-CSF concentrations were determined at the indicated time after DT3/d6-DT3 administration (200 mg/Kg, subcutaneously); error bars represent means ± SD, n = 3–4, **P < 0.005 indicates significant difference.
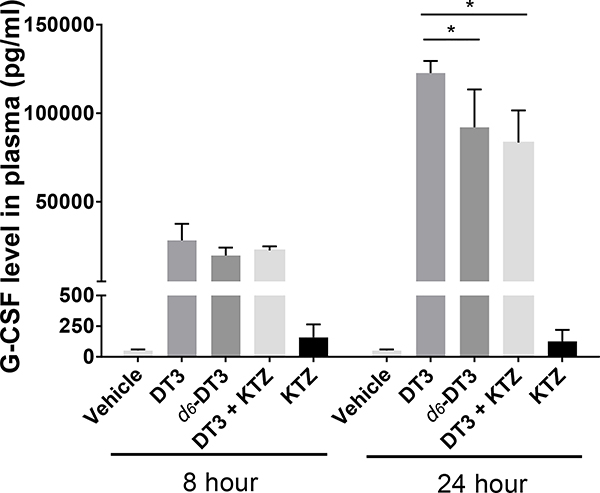
To test our hypothesis, ketoconazole, which inhibits both CYP3A and CYP4F,42 was administered to mice prior to DT3 administration to inhibit the side chain metabolism of DT3. Similar to d6-DT3, DT3 and ketoconazole combination induced lower G-CSF levle than DT3 alone at 24 h (Fig. 7), indicating that the metabolites of DT3, rather than DT3 itself might play the major role in inducing G-CSF production. The metabolites of DT3 comprise of many carboxylic acids with various chain lengths, which resemble fatty acids in structure. Fatty acids are able to regulate immune cell function,43–46 but whether DT3 metabolites exhibit the same functions as fatty acids is not clear. Due to the complexity of the side chain catabolism, identification of the specific metabolite(s) responsible for the observed G-CSF induction was not determined in the current study.
Fig. 7.
G-CSF level induced by DT3, d6-DT3, and DT3+KTZ (ketoconazole) at the indicated times. Plasma G-CSF concentrations were determined at indicated time after DT3, d6-DT3, or DT3+KTZ administration (200 mg/Kg, subcutaneously for DT3 and d6-DT3, KTZ was given through gavage 3 times before given DT3); error bars represent means ± SD, n≥3. *P < 0.05 comparing with G-CSF concentrations stimulated by DT3 at 24 h.
3. Conclusion
We have designed and synthesized a deuterium substituted DT3 derivative, d6-DT3, in which the C-H bonds of the terminal methyl groups of DT3 were fully replaced by C-D bonds. Liver microsomal metabolic stability studies and in vivo PK studies in mice demonstrated that d6-DT3 is metabolically more stable than DT3. However, the in vivo G-CSF inducing effect of d6-DT3 is lower than that of DT3 likely due to its lower metabolic rate. These results indicate that the metabolite(s) of DT3/d6-DT3 might be responsible for G-CSF induction. The ω-hydroxylase metabolic pathway that mediates metabolism of vitamin E affords multiple carboxylic acid metabolites and it would be interesting to test the G-CSF stimulating activities and radio-protective effects of these metabolites. Although DT3 can work as both radio-protector and radio-mitigator, its radio-protective effect is superior to its radio-mitigating effect47 due to the delayed stimulation of G-CSF. It is possible that these carboxylic acid metabolites of DT3 might be better radio-mitigators than DT3 itself if they were able to induce more rapid G-CSF production.
4. Experimental section
4.1. Chemistry
General method: δ-Tocotrienol was separated from DeltaGold® using flash column filled with silica gel (230–400 mesh) as the stationary phase. Gradient elution was performed with ethyl acetate and hexanes (20/1 to 10/1). DeltaGold® was a gift from American River Nutrition, Inc. THF was taken from a solvent purification system that purifies solvents by filtration through two columns packed with activated alumina and a 4 Å molecular sieve. All commercially available solvent and reagents were used without further purification. If dry and oxygen-free conditions were required, reactions were performed using oven-dried glassware (130 °C) under a positive pressure of argon. Flash chromatography was performed using silica gel (230–400 mesh) as the stationary phase. Reaction progress was monitored by TLC (silica-coated glass plates) and visualized with p-anisaldehyde solution (recipe: 135 mL alcohol + 5 mL H2SO4 + 3.7 mL p-anisaldehyde + 1.5 mL glacial acetic acid) staining, or by GC-MS (Agilent, 5975 series system) or TLC-MS. NMR spectra were recorded in CDCl3 or d6-DMSO at 400 MHz for 1H, and 100 MHz for 13C NMR. Chemical shifts δ are given in ppm using tetramethylsilane as an internal standard. Multiplicities of NMR signals are designated as singlet (s), broad singlet (br s), doublet (d), doublet of doublets (dd), triplet (t), quartet (q), and multiplet (m). MS were recorded on an Agilent GC-MS (EI) or Advion Express (APCI and ESI) instrument.
4.1.1. (R)-2-((3E,7E)-4,8-dimethyl-12-(methyl-d3)trideca-3,7,11-trien-1-yl-13,13,13-d3)-6-(methoxymethoxy)-2,8-dimethylchromane (2)
From compound 1: To a stirring solution of 1 (64 mg, 0.081 mmol) in THF (2 mL) at −78 °C was added n-BuLi (2.5 M in hexane, 52 μL, 0.13 mmol). After stirring at −78 °C for 45 min, d6-propanone (8 μL, 0.098 mmol) was added. The mixture was allowed to stir at −78 °C for an additional 45 min. Aqueous NH4Cl solution was added to quench the reaction and the mixture was extracted twice with ethyl acetate. The combined organic phases were washed with brine, dried over anhydrous Na2SO4, filtered, and concentrated under vacuum. The crude product was column chromatographed on silica gel to afford the title compound (14 mg, 39% yield) as colorless oil.
From compound 3: To a stirring suspension of compound 4 (833 mg, 2.1 mmol) in THF (10 mL) was added KHMDS (0.5 M in THF, 5 mL, 2.5 mmol) at −78 °C. The mixture was stirred at −78 °C for 45 min, followed by addition of a solution of aldehyde 3 (800 mg, 1.93 mmol) in THF (5 mL). After stirring at −78 °C for an additional 45 min, aqueous NH4Cl solution was added. The mixture was then partitioned between water and ethyl acetate. The organic layer was collected and washed with brine, dried over anhydrous Na2SO4, filtered, and concentrated under vacuum. The crude product was column chromatographed on silica gel to give the title compound (660 mg, 76% yield) as colorless oil. 1H NMR (400 MHz, CDCl3) δ 6.66 (d, J = 2.7 Hz, 1H), 6.58 (d, J = 2.7 Hz, 1H), 5.16–5.02 (m, 5H), 3.47 (s, 3H), 2.71 (t, J = 6.2 Hz, 2H), 2.15-2.00 (m, 9H), 1.96 (dd, J = 8.0, 3.9 Hz, 4H), 1.84–1.69 (m, 2H), 1.67–1.53 (m, 8H), 1.25 (s, 3H); 13C NMR (100 MHz, CDCl3) δ 149.73, 147.26, 135.27 (2C), 135.10, 127.35, 124.55, 124.40, 124.30, 121.07, 117.39, 114.31, 95.46, 75.57, 55.94, 39.94, 39.86, 39.82, 31.43, 26.87, 26.73, 24.21 (2C), 22.73, 22.30, 16.32 (2C), 16.14, 16.03; MS (EI) m/z 446.4 (M+).
4.1.2. triphenyl(propan-2-yl-d7)phosphonium bromide (4)
A mixture of d7-2-bromopropane (1.5 mL, 15.1 mmol) and triphenyl phosphine (4.36 g, 16.6 mmol) was stirred in a pressure tube at 150 °C for 24 h. The resulting mixture was washed with a mixture of hexanes and ethyl acetate (1:1, v/v) to afford a white solid (3.6 g, 61% yield).36 1H NMR (400 MHz, DMSO) δ 7.94 – 7.86 (m, 9H), 7.80 – 7.75 (m, 6H). MS (ESI+) m/z 312 [M-Br]+.
4.1.3. (R)-2-((3E,7E)-4,8-dimethyl-12-(methyl-d3)trideca-3,7,11-trien-1-yl-13,13,13-d3)-2,8-dimethylchroman-6-ol (d6-DT3)
To a stirring solution of 2 (400 mg, 0.90 mmol) in THF (7 mL) was added HCl (4.0 N in 1,4-dioxane, 1.0 mL). The resulting mixture was stirred at room temperature for 2 h, aqueous NaHCO3 solution was added and the mixture was extracted twice with ethyl acetate. The combined organic layers were washed with brine, dried over anhydrous Na2SO4, filtered, and concentrated under reduced pressure. The crude product was purified by silica gel column chromatography to yield the title compound (335 mg, 95% yield). 1H NMR (400 MHz, CDCl3) δ 6.48 (d, J = 2.7 Hz, 1H), 6.38 (d, J = 2.7 Hz, 1H), 5.18–5.06 (m, 3H), 4.20 (s, 1H), 2.70 (t, J = 6.3 Hz, 2H), 2.17–2.03 (m, 9H), 2.01–1.93 (m, 4H), 1.85–1.70 (m, 2H), 1.69–1.61 (m, 1H), 1.61–1.51 (m, 7H), 1.26 (s, 3H); 13C NMR (100 MHz, CDCl3) δ 147.82, 146.15, 135.28 (2C), 135.12, 127.52, 124.56, 124.41, 124.31, 121.38, 115.75, 112.70, 75.47, 39.87, 39.83 (2C), 31.49, 26.88, 26.73, 24.18 (2C), 22.62, 22.31, 16.21 (2C), 16.15, 16.02; MS (EI) m/z 402.4 (M+).
4.2. In vitro metabolic stability assay
A stock solution of test compound in DMSO (687.5 μM) was diluted with acetonitrile to afford a solution in DMSO and acetonitrile (20% DMSO and 80% acetonitrile) with a concentration of 137.5 μM. Mouse liver microsome suspension was prepared by mixing mouse liver microsomes (20 mg protein/mL (Corning® GentestTM)) with 0.5 M EDTA and 0.2 M potassium phosphate buffer (pH 7.4) at a volume ratio of 25:2:765. NADPH generating solution was freshly prepared by mixing solution A (NADP+; Glc-6-PO4; MgCl2), solution B (G6PDH) and potassium phosphate buffer (pH 7.4) at a volume ratio of 3:1:14. One volume of test compound was pre-incubated with 109 volumes of microsome suspension at 37 °C for 30 min and the metabolic reaction was initiated by addition of 27.5 volume of NADPH solution. An equal volume of buffer instead of NADPH solution was added for the control sample. After incubating for a specific time (5 min, 15 min, or 30 min), aliquots of the incubating mixture were taken and added to cold acetonitrile (2 times the volume of incubating mixture) containing GT3 as an internal standard. The sample was then extracted with hexanes. The upper layer was transferred to a glass tube, dried under a stream of nitrogen and then reconstituted with acetonitrile. Acetonitrile solution was then analyzed by HPLC-UV. Propranolol were used as metabolism reference standard. Data were presented and analyzed with Graph Pad Prism6.
4.3. In vivo pharmacokinetics study
4.3.1. Animal housing
The animal protocol was reviewed and approved by the Institutional Animal Care and Use Committees (IACUC) of University of Arkansas for medical Sciences (UAMS). CD2F1 male mice aged 8–10 weeks (Charles River Breeding Labs) with average body weight at 27 g were randomly housed among cages and were kept under standardized condition with controlled humidity and temperature with 12/12 day/night cycle. Free access to water and chow was provided for mice.
4.3.2. Preparation
For SC injection, DT3/d6-DT3 was emulsified with PBS containing 5% tween 80. The volume of drug solution was adjusted to give the desired dose (100 μL/mouse). For IV injection, a mixture of DT3/d6-DT3 was emulsified with PBS containing 33% PEG400 and 2% tween 80 and the concentration was adjusted to give 150 μL/mouse. The emulsion was sterilized by filtering through 0.22 μm filter and the first 0.5 mL filtrate was discarded.
4.3.3. Animal treatment
Mice were randomly assigned to one of the following treatments: vehicle group (5% tween 80 in PBS for SC injection and PBS containing 33% PEG400 and 2% tween 80 for IV injection), DT3 treatment group, d6-DT3 treatment group (n = 4). After administration of the drug (200 mg/Kg subcutaneously or 50 mg/Kg intravenously), blood was collected into tubes coated with EDTA potassium through the retro-orbital vein at the following time points: for SC PK (0 min, 7.5 min, 15 min, 30 min, 1 h, 2 h, 4 h, 6 h, 8 h, 12 h, 24 h.); for IV PK (0 min, 5 min, 10 min, 30 min, 1 h, 2 h, 4 h, 6 h, 12 h, 24 h.).
4.3.4. Plasma collection and plasma drug concentration analysis
Blood collected from mice were kept on ice and centrifuged shortly after collection. Plasma was obtained by centrifugation (1200 rpm, 15 min, 4 °C) and stored (aliquoted) at −80 °C until analysis. For plasma drug concentration determination, 50 μL internal standard were added to each 50 μL of plasma, followed by addition of 100 μL of methanol (containing 2% (w/v) ascorbic acid) and 300 μL of heptane (containing 1% (w/v) BHT). The resulting mixture was vortexed and centrifuged (1200 rpm, 5 min, 25 °C) and the upper layer transferred to a pre-labeled testing tube and dried under a N2 stream to afford a residue. The residue was reconstituted with 100 μL of methanol, 10 μL of which was utilized for HPLC-fluorescence analysis.
4.4. In vivo G-CSF assay
CD2F1 mice were randomly assigned to cages and treated with vehicle (5% tween 80 in PBS), DT3, or d6-DT3 subcutaneously at a dose of 0.5 mM/Kg (200 mg/Kg of DT3 = 0.5 mM DT3/Kg, n = 3). Ketoconazole was suspended in corn oil and given to mice (5 mg/250 μL/mice) through oral gavage 3 times (once 26 hours prior to administration of DT3, once 14 hours prior to administration of DT3, and once 2 hours prior to administration of DT3). Blood was collected into EDTA potassium-coated tubes at 8 h and 24 h after vehicle/ DT3/ d6-DT3 administration. Mice were euthanized after blood collection. Blood collected from mice was kept on ice and centrifuged shortly after collection. Plasma was prepared by centrifugation (1200 rpm, 15 min, 4 °C) and stored at −80 °C until analysis. For the assay of time-dependent induction of G-CSF by DT3 and d6-DT3, ketoconazole was not used, and blood was collected at 8 h, 12 h, 24 h, and 48 h after vehicle/DT3/d6-DT3 administration. Plasma G-CSF concentration was determined using mouse G-CSF ELISA kit (Novex®). Every plasma sample was analyzed in duplicate and the average value was used in calculation. Standard curves were constructed for each plate by plotting absorption versus known concentrations of standard samples. Concentrations of test samples were determined from the appropriate standard curve using their absorption values.
Supplementary Material
Acknowledgement
This work was supported by the National Institute of General Medical Sciences of the NIH under grant number P20GM109005 and R01CA122023.
Abbreviations
- DT3
δ-tocotrienol
- GT3
γ-tocotrienol
- PK
pharmacokinetic
- G-CSF
granulocyte-colony stimulating factor
- NADPH
nicotinamide adenine dinucleotide phosphate
- AUC
area under curve
Footnotes
Appendix A. Supplementary material
1H NMR and 13C NMR spectra for compound 2, d6-DT3, and DT3 (PDF). Supplementary data to this article can be found online at xxxx.
Publisher's Disclaimer: This is a PDF file of an unedited manuscript that has been accepted for publication. As a service to our customers we are providing this early version of the manuscript. The manuscript will undergo copyediting, typesetting, and review of the resulting proof before it is published in its final form. Please note that during the production process errors may be discovered which could affect the content, and all legal disclaimers that apply to the journal pertain.
References
- (1).Brigelius-Flohé R; Traber MG Vitamin E: Function and Metabolism. FASEB J 1999, 13 (10), 1145–1155. 10.1096/fasebj.13.10.1145 [DOI] [PubMed] [Google Scholar]
- (2).Falk J; Munné-Bosch S Tocochromanol Functions in Plants: Antioxidation and Beyond. J Exp Bot. 2010, 61 (6), 1549–1566. 10.1093/jxb/erq030. [DOI] [PubMed] [Google Scholar]
- (3).Kamal-Eldin A; Appelqvist LA The Chemistry and Antioxidant Properties of Tocopherols and Tocotrienols. Lipids 1996, 31 (7), 671–701. 10.1007/BF02522884 [DOI] [PubMed] [Google Scholar]
- (4).Serbinova E; Kagan V; Han D; Packer L Free Radical Recycling and Intramembrane Mobility in the Antioxidant Properties of Alpha-Tocopherol and Alpha-Tocotrienol. Free Radic Biol Med. 1991, 10 (5), 263–275. [DOI] [PubMed] [Google Scholar]
- (5).Suzuki YJ; Tsuchiya M; Wassall SR; Choo YM; Govil G; Kagan VE; Packer L Structural and Dynamic Membrane Properties of .Alpha.-Tocopherol and .Alpha.-Tocotrienol: Implication to the Molecular Mechanism of Their Antioxidant Potency. Biochemistry 1993, 32 (40), 10692–10699. 10.1021/bi00091a020. [DOI] [PubMed] [Google Scholar]
- (6).Liu X; Gujarathi S; Zhang X; Shao L; Boerma M; Compadre CM; Crooks PA; Hauer-Jensen M; Zhou D; Zheng G Synthesis of (2R,8′S,3′E)-δ-Tocodienol, a Tocoflexol Family Member Designed to Have a Superior Pharmacokinetic Profile Compared to δ-Tocotrienol. Tetrahedron 2016, 72 (27), 4001–4006. 10.1016/j.tet.2016.05.028. [DOI] [PMC free article] [PubMed] [Google Scholar]
- (7).Peh HY; Tan WSD; Liao W; Wong WSF Vitamin E Therapy beyond Cancer: Tocopherol versus Tocotrienol. Pharmacol Ther. 2016, 162, 152–169. 10.1016/j.pharmthera.2015.12.003. [DOI] [PubMed] [Google Scholar]
- (8).Aggarwal BB; Sundaram C; Prasad S; Kannappan R Tocotrienols, the Vitamin E of the 21st Century: Its Potential against Cancer and Other Chronic Diseases. Biochem Pharmacol. 2010, 80 (11), 1613–1631. 10.1016/j.bcp.2010.07.043. [DOI] [PMC free article] [PubMed] [Google Scholar]
- (9).Li XH; Ghosh SP; Ha CT; Fu D; Elliott TB; Bolduc DL; Villa V; Whitnall MH; Landauer MR; Xiao M Delta-Tocotrienol Protects Mice from Radiation-Induced Gastrointestinal Injury. Radiat Res. 2013, 180 (6), 649–657. 10.1667/RR13398.1. [DOI] [PubMed] [Google Scholar]
- (10).Berbée M; Fu Q; Boerma M; Wang J; Kumar KS; Hauer-Jensen M Gamma-Tocotrienol Ameliorates Intestinal Radiation Injury and Reduces Vascular Oxidative Stress after Total-Body Irradiation by an HMG-CoA Reductase-Dependent Mechanism. Radiat Res. 2009, 171 (5), 596–605. 10.1667/RR1632.1. [DOI] [PMC free article] [PubMed] [Google Scholar]
- (11).Ghosh SP; Kulkarni S; Hieber K; Toles R; Romanyukha L; Kao T-C; Hauer-Jensen M; Kumar KS Gamma-Tocotrienol, a Tocol Antioxidant as a Potent Radioprotector. Int J Radiat Biol. 2009, 85 (7), 598–606. 10.1080/09553000902985128. [DOI] [PubMed] [Google Scholar]
- (12).Kulkarni S; Ghosh SP; Satyamitra M; Mog S; Hieber K; Romanyukha L; Gambles K; Toles R; Kao T-C; Hauer-Jensen M; et al. Gamma-Tocotrienol Protects Hematopoietic Stem and Progenitor Cells in Mice after Total-Body Irradiation. Radiat Res. 2010, 173 (6), 738–747. 10.1667/RR1824.1. [DOI] [PubMed] [Google Scholar]
- (13).Kulkarni S; Singh PK; Ghosh SP; Posarac A; Singh VK Granulocyte Colony-Stimulating Factor Antibody Abrogates Radioprotective Efficacy of Gamma-Tocotrienol, a Promising Radiation Countermeasure. Cytokine 2013, 62 (2), 278–285. 10.1016/j.cyto.2013.03.009. [DOI] [PubMed] [Google Scholar]
- (14).Ledet GA; Biswas S; Kumar VP; Graves RA; Mitchner DM; Parker TM; Bostanian LA; Ghosh SP; Mandal TK Development of Orally Administered γ-Tocotrienol (GT3) Nanoemulsion for Radioprotection. Int J Mol Sci 2016, 18 (1), 28 10.3390/ijms18010028. [DOI] [PMC free article] [PubMed] [Google Scholar]
- (15).Li XH; Ha CT; Fu D; Landauer MR; Ghosh SP; Xiao M Delta-Tocotrienol Suppresses Radiation-Induced MicroRNA-30 and Protects Mice and Human CD34+ Cells from Radiation Injury. PLos One 2015, 10 (3), e0122258 10.1371/journal.pone.0122258. [DOI] [PMC free article] [PubMed] [Google Scholar]
- (16).Li XH; Fu D; Latif NH; Mullaney CP; Ney PH; Mog SR; Whitnall MH; Srinivasan V; Xiao M Delta-Tocotrienol Protects Mouse and Human Hematopoietic Progenitors from Gamma-Irradiation through Extracellular Signal-Regulated Kinase/Mammalian Target of Rapamycin Signaling. Haematologica 2010, 95 (12), 1996–2004. 10.3324/haematol.2010.026492. [DOI] [PMC free article] [PubMed] [Google Scholar]
- (17).Satyamitra M; Ney P; Graves J; Mullaney C; Srinivasan V Mechanism of Radioprotection by δ-Tocotrienol: Pharmacokinetics, Pharmacodynamics and Modulation of Signalling Pathways. Br J Radiol 2012, 85 (1019), e1093–e1103. 10.1259/bjr/63355844. [DOI] [PMC free article] [PubMed] [Google Scholar]
- (18).Singh VK; Wise SY; Scott JR; Romaine PLP; Newman VL; Fatanmi OO Radioprotective Efficacy of Delta-Tocotrienol, a Vitamin E Isoform, Is Mediated through Granulocyte Colony-Stimulating Factor. Life Sciences 2014, 98 (2), 113–122. 10.1016/j.lfs.2014.01.065. [DOI] [PubMed] [Google Scholar]
- (19).Singh VK; Hauer-Jensen M γ-Tocotrienol as a Promising Countermeasure for Acute Radiation Syndrome: Current Status. Int J Mol Sci 2016, 17 (5). 10.3390/ijms17050663. [DOI] [PMC free article] [PubMed] [Google Scholar]
- (20).Singh VK; Kulkarni S; Fatanmi OO; Wise SY; Newman VL; Romaine PLP; Hendrickson H; Gulani J; Ghosh SP; Kumar KS; et al. Radioprotective Efficacy of Gamma-Tocotrienol in Nonhuman Primates. Radiat Res. 2016, 185 (3), 285–298. 10.1667/RR14127.1. [DOI] [PubMed] [Google Scholar]
- (21).Singh VK; Fatanmi OO; Verma A; Newman VL; Wise SY; Romaine PLP; Berg AN Progenitor Cell Mobilization by Gamma-Tocotrienol: A Promising Radiation Countermeasure. Health Phys. 2016, 111 (2), 85–92. 10.1097/HP.0000000000000458. [DOI] [PMC free article] [PubMed] [Google Scholar]
- (22).Sridharan V; Tripathi P; Aykin-Burns N; Krager KJ; Sharma SK; Moros EG; Melnyk SB; Pavliv O; Hauer-Jensen M; Boerma M A Tocotrienol-Enriched Formulation Protects against Radiation-Induced Changes in Cardiac Mitochondria without Modifying Late Cardiac Function or Structure. Radiat Res. 2015, 183 (3), 357–366. 10.1667/RR13915.1. [DOI] [PMC free article] [PubMed] [Google Scholar]
- (23).Suman S; Datta K; Chakraborty K; Kulkarni SS; Doiron K; Fornace AJ; Sree Kumar K; Hauer-Jensen M; Ghosh SP Gamma Tocotrienol, a Potent Radioprotector, Preferentially Upregulates Expression of Anti-Apoptotic Genes to Promote Intestinal Cell Survival. Food Chem Toxicol. 2013, 60, 488–496. 10.1016/j.fct.2013.08.011. [DOI] [PubMed] [Google Scholar]
- (24).Singh VK; Olabisi AO Nonhuman Primates as Models for the Discovery and Development of Radiation Countermeasures. Expert Opin Drug Discov. 2017, 12 (7), 695–709. 10.1080/17460441.2017.1323863. [DOI] [PMC free article] [PubMed] [Google Scholar]
- (25).Anscher MS; Chang MG; Moghanaki D; Rosu M; Mikkelsen RB; Holdford D; Skinner V; Grob BM; Sanyal A; Wang A; et al. A Phase II Study to Prevent Radiation-Induced Rectal Injury With Lovastatin. Am J Clin Oncol. 2016, 41 (6), 544–548. 10.1097/COC.0000000000000320. [DOI] [PMC free article] [PubMed] [Google Scholar]
- (26).Yap SP; Yuen KH; Lim AB Influence of Route of Administration on the Absorption and Disposition of Alpha-, Gamma- and Delta-Tocotrienols in Rats. J Pharm Pharmacol. 2003, 55 (1), 53–58. 10.1211/002235702450. [DOI] [PubMed] [Google Scholar]
- (27).Yap SP; Yuen KH; Wong JW Pharmacokinetics and Bioavailability of Alpha-, Gamma- and Delta-Tocotrienols under Different Food Status. J Pharm Pharmacol. 2001, 53 (1), 67–71. [DOI] [PubMed] [Google Scholar]
- (28).Yap SP; Yuen KH Influence of Lipolysis and Droplet Size on Tocotrienol Absorption from Self-Emulsifying Formulations. Int J Pharm. 2004, 281 (1), 67–78. 10.1016/j.ijpharm.2004.05.015. [DOI] [PubMed] [Google Scholar]
- (29).Ikeda S; Uchida T; Ichikawa T; Watanabe T; Uekaji Y; Nakata D; Terao K; Yano T Complexation of Tocotrienol with Gamma-Cyclodextrin Enhances Intestinal Absorption of Tocotrienol in Rats. Biosci Biotechnol Biochem. 2010, 74 (7), 1452–1457. 10.1271/bbb.100137. [DOI] [PubMed] [Google Scholar]
- (30).Liu X; Poddar S; Song L; Hendrickson H; Zhang X; Yuan Y; Zhou D; Zheng G Synthesis and Liver Microsomal Metabolic Stability Studies of a Fluorine-Substituted δ-Tocotrienol Derivative. ChemMedChem 2020. 10.1002/cmdc.201900676. [DOI] [PMC free article] [PubMed] [Google Scholar]
- (31).Schmidt C First deuterated drug approved. 2017, 35 (6), 493–494. 10.1038/nbt0617-493. [DOI] [PubMed] [Google Scholar]
- (32).Pirali T; Serafini M; Cargnin S; Genazzani AA Applications of Deuterium in Medicinal Chemistry. J Med Chem. 2019, 62 (11), 5276–5297. 10.1021/acs.jmedchem.8b01808. [DOI] [PubMed] [Google Scholar]
- (33).DeWitt SH; Maryanoff BE Deuterated Drug Molecules: Focus on FDA-Approved Deutetrabenazine. Biochemistry 2018, 57 (5), 472–473. 10.1021/acs.biochem.7b00765. [DOI] [PubMed] [Google Scholar]
- (34).Bardowell SA; Duan F; Manor D; Swanson JE; Parker RS Disruption of Mouse Cytochrome P450 4f14 (Cyp4f14 Gene) Causes Severe Perturbations in Vitamin E Metabolism. J Biol Chem. 2012, 287 (31), 26077–26086. 10.1074/jbc.M112.373597. [DOI] [PMC free article] [PubMed] [Google Scholar]
- (35).Sontag TJ; Parker RS Influence of Major Structural Features of Tocopherols and Tocotrienols on Their ω-Oxidation by Tocopherol-ω-Hydroxylase. J Lipid Res. 2007, 48 (5), 1090–1098. 10.1194/jlr.M600514-JLR200. [DOI] [PubMed] [Google Scholar]
- (36).West R; Wang Y; Atkinson J ω-Di-(Trideuteromethyl)-Tocotrienols as Probes for Membrane Orientation and Dynamics of Tocotrienols. J Label Compd Radiopharm 2008, 51 (13), 413–418. 10.1002/jlcr.1554. [DOI] [Google Scholar]
- (37).Baranczewski P; Stańczak A; Sundberg K; Svensson R; Wallin A; Jansson J; Garberg P; Postlind H Introduction to in Vitro Estimation of Metabolic Stability and Drug Interactions of New Chemical Entities in Drug Discovery and Development. Pharmacol Rep. 2006, 58 (4), 453–472. [PubMed] [Google Scholar]
- (38).Austin RP; Barton P; Cockroft SL; Wenlock MC; Riley RJ The Influence of Nonspecific Microsomal Binding on Apparent Intrinsic Clearance, and Its Prediction from Physicochemical Properties. Drug Metab Dispos. 2002, 30 (12), 1497–1503. 10.1124/dmd.30.12.1497. [DOI] [PubMed] [Google Scholar]
- (39).Deng L; Peng Y; Wu Y; Yang M; Ding Y; Chen Q; Fu Q Tissue Distribution of Emulsified γ-Tocotrienol and Its Long-Term Biological Effects after Subcutaneous Administration. Lipids Health Dis. 2014, 13, 66 10.1186/1476-511X-13-66. [DOI] [PMC free article] [PubMed] [Google Scholar]
- (40).Singh VK; Newman VL; Seed TM Colony-Stimulating Factors for the Treatment of the Hematopoietic Component of the Acute Radiation Syndrome (H-ARS): A Review. Cytokine 2015, 71 (1), 22–37. 10.1016/j.cyto.2014.08.003. [DOI] [PubMed] [Google Scholar]
- (41).Apikyan S; Diamond D Nuclear Terrorism and National Preparedness; Springer, 2015. [Google Scholar]
- (42).Sheets JJ; Mason JI Ketoconazole: A Potent Inhibitor of Cytochrome P-450-Dependent Drug Metabolism in Rat Liver. Drug Metab Dispos. 1984, 12 (5), 603–606. [PubMed] [Google Scholar]
- (43).Alvarez-Curto E; Milligan G Metabolism Meets Immunity: The Role of Free Fatty Acid Receptors in the Immune System. Biochem Pharmacol. 2016, 114, 3–13. 10.1016/j.bcp.2016.03.017. [DOI] [PubMed] [Google Scholar]
- (44).Bhutia YD; Ganapathy V Short, but Smart: SCFAs Train T Cells in the Gut to Fight Autoimmunity in the Brain. Immunity 2015, 43 (4), 629–631. 10.1016/j.immuni.2015.09.014. [DOI] [PMC free article] [PubMed] [Google Scholar]
- (45).Corrêa-Oliveira R; Fachi JL; Vieira A; Sato FT; Vinolo MA R. Regulation of Immune Cell Function by Short-Chain Fatty Acids. Clin Transl Immunology 2016, 5 (4), e73 10.1038/cti.2016.17. [DOI] [PMC free article] [PubMed] [Google Scholar]
- (46).Meijer K; de Vos P; Priebe MG Butyrate and Other Short-Chain Fatty Acids as Modulators of Immunity: What Relevance for Health? Curr Opin Clin Nutr Metab Care 2010, 13 (6), 715–721. 10.1097/MCO.0b013e32833eebe5. [DOI] [PubMed] [Google Scholar]
- (47).Satyamitra MM; Kulkarni S; Ghosh SP; Mullaney CP; Condliffe D; Srinivasan V Hematopoietic Recovery and Amelioration of Radiation-Induced Lethality by the Vitamin E Isoform δ-Tocotrienol. rare 2011, 175 (6), 736–745. 10.1667/RR2460.1. [DOI] [PubMed] [Google Scholar]
Associated Data
This section collects any data citations, data availability statements, or supplementary materials included in this article.


