Abstract
Cognitive diagnostic computerized adaptive testing (CD-CAT) aims to obtain more useful diagnostic information by taking advantages of computerized adaptive testing (CAT). Cognitive diagnosis models (CDMs) have been developed to classify examinees into the correct proficiency classes so as to get more efficient remediation, whereas CAT tailors optimal items to the examinee’s mastery profile. The item selection method is the key factor of the CD-CAT procedure. In recent years, a large number of parametric/nonparametric item selection methods have been proposed. In this article, the authors proposed a series of stratified item selection methods in CD-CAT, which are combined with posterior-weighted Kullback–Leibler (PWKL), nonparametric item selection (NPS), and weighted nonparametric item selection (WNPS) methods, and named S-PWKL, S-NPS, and S-WNPS, respectively. Two different types of stratification indices were used: original versus novel. The performances of the proposed item selection methods were evaluated via simulation studies and compared with the PWKL, NPS, and WNPS methods without stratification. Manipulated conditions included calibration sample size, item quality, number of attributes, number of strata, and data generation models. Results indicated that the S-WNPS and S-NPS methods performed similarly, and both outperformed the S-PWKL method. And item selection methods with novel stratification indices performed slightly better than the ones with original stratification indices, and those without stratification performed the worst.
Keywords: cognitive diagnostic assessment, computerized adaptive testing, nonparametric item selection method, stratification indices
Introduction
Cognitive diagnosis has recently received great attentions, as the U.S. government’s No Child Left Behind Act (2001) mandated that diagnostic feedback should be provided to students, teachers, and parents. Cognitive diagnostic tests provide a profile for each examinee, specifying which concepts and skills (a.k.a. attributes) students have mastered, so as to provide specific instructions for the subsequent teaching work. Therefore, the cognitive diagnostic test not only has an evaluation purpose, but also provides valuable information about each student’s learning demands. In the past three decades, a multitude of models have been proposed for cognitive diagnosis, such as the conjunctive “Deterministic Input, Noisy ‘And’ Gate” (DINA) model (Haertel, 1989; Junker & Sijtsma, 2001), the “Noisy Input, Deterministic ‘And’ Gate” (NIDA) model (Haertel, 1989; Junker & Sijtsma, 2001; Maris, 1999), the Fusion model (Hartz, 2002; Hartz et al., 2002), the higher-order DINA (HO-DINA) model (de la Torre & Douglas, 2004), the multiple-choice DINA (MC-DINA) model (de la Torre, 2009), the rule space model (Tatsuoka, 1983), the compensatory “Deterministic Input, Noisy ‘Or’ Gate” (DINO) model (Templin & Henson, 2006), the General Diagnostic model (GDM; von Davier, 2005, 2008), the log-linear cognitive diagnosis model (LCDM; Henson et al., 2009), and the generalized DINA (G-DINA; de la Torre, 2011) model, just to name a few.
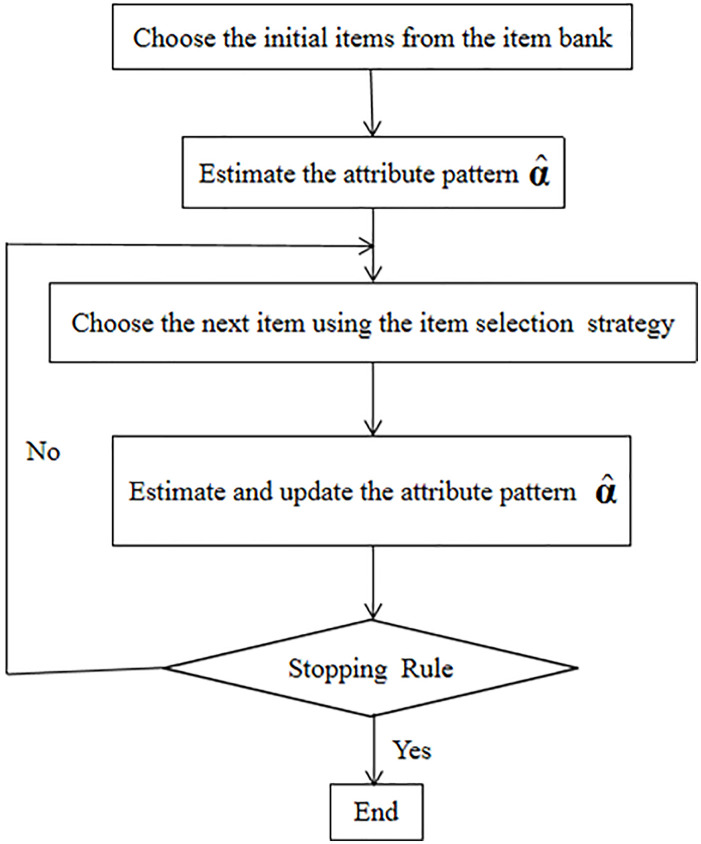
With the rapid development of computer technology and measurement theory, computerized adaptive testing (CAT) has been introduced into the field of testing since the early 1970s and has become a very popular test mode. In CAT, items are selected sequentially depending on the examinee’s responses to previous items and can be tailored to “best fit” the examinee’s latent traits (Cheng, 2008). Therefore, CAT may provide more effective and accurate estimates of latent traits using fewer items than conventional paper and pencil tests with a prefixed set of items (Weiss, 1982). So it is an interesting research question how CAT can be used to help improve cognitive diagnosis. There are some attempts to combine these two research areas and develop cognitive diagnostic computerized adaptive testing (CD-CAT; e.g., McGlohen & Chang, 2008; X. Xu et al., 2003). A version of CD-CAT has already been applied in determining whether or not students possess specific skills in the class (Jang, 2008). The purpose of CD-CAT is to classify examinees according to their latent states, thus using the latent class model as the measurement model. Therefore, it provides researchers and practitioners with challenges of using computer adaptive platforms for cognitive diagnostic testing. A diagram of the CD-CAT test process is shown in Figure 1.
Figure 1.
A flowchart of the CD-CAT test process.
Note. CD-CAT = cognitive diagnostic computerized adaptive testing.
Item selection methods play an important role in the CD-CAT procedure. In the past decade, many item selection strategies have been adopted for CD-CAT, including the Kullback–Leibler information index (KL; X. Xu et al., 2003), the Shannon entropy method (SHE; X. Xu et al., 2003), the posterior-weighted Kullback–Leibler index (PWKL; Cheng, 2009), hybrid Kullback–Leibler index (HKL; Cheng, 2009), the restrictive progressive method (RP; Wang et al., 2011), the mutual information algorithm (MI; Wang, 2013), the G-DINA model discrimination index (GDI; Kaplan et al., 2015), the posterior-weighted cognitive diagnostic model discrimination index (PWCDI; Zheng & Chang, 2016), and others. Specifically, the MI and PWCDI methods were proposed for short-length tests and were also suitable for the small-scale test. And Zheng and Chang (2016) indicated that the PWCDI method performed better than the MI method.
In addition, Chang et al. (2018) proposed the nonparametric item selection (NPS) method and the weighted nonparametric item selection (WNPS) method to select “best-fitting” items for each examinee, which only required specification of Q-matrix and did not depend on any statistical model, for educational settings with small samples. And Chang et al. (2018) illustrated that the NPS and WNPS methods outperformed the PWCDI and PWKL methods across all simulated conditions. It was worth noting that the nonparametric classification (NPC) method, developed by Chiu and Douglas (2013), was required in the NPS and WNPS methods to obtain the estimates of examinees’ attribute patterns in the CD-CAT process. The NPC method matched the observed item response patterns to the nearest ideal response pattern and only required specification of the Q-matrix to classify by proximity to the ideal response pattern. The NPC method requires no statistical parameter estimation and can be used on a sample size as small as 1 (Chiu & Douglas, 2013).
Recently, teachers and administrators have become increasingly interested in the tests for assessing several fine-grained chunks of knowledge (DiBello & Stout, 2007). Therefore, to achieve formative diagnostics and remedial instruction, one must provide more efficient and accurate attribute profile estimation for teachers and each examinee. Cheng et al. (2009) found that, in the CAT environment, stratification could improve measurement precision. To improve the classification accuracy, the authors propose a series of stratified item selection methods in CD-CAT, which are combined with the PWKL, NPS, and WNPS methods, and are named S-PWKL, S-NPS, and S-WNPS, respectively. Meanwhile, two different types of stratification indices were used: original versus novel. The item discrimination indicator for the DINA model, defined by Li et al. (2016), is extended to the ones for the DINO model and the reduced reparameterized unified model (RRUM), which were treated as the novel stratification indices.
Therefore, the first goal of this study is to apply the NPC method as the attribute profile estimation method in CD-CAT, whereas the PWKL method is used as the item selection method, and explore its performance against the common profile estimation method maximum a posteriori (MAP) across all manipulated conditions. The second and most primary goal is to illustrate the performance of the proposed item selection methods with different stratification indices and compare them to the PWKL, NPS, and WNPS methods without stratification. This study provides important evidence and insight to build a stratified CD-CAT framework in the future.
The rest of the article is organized as follows. First, a brief review of cognitive diagnosis models (CDMs) most widely used in CD-CAT is given. Next, two types of stratification indices and a series of stratified item selection methods in CD-CAT are introduced in detail. Third, the performances of the proposed item selection methods are evaluated via simulation studies. Last but not least, some conclusions and directions for the future work are provided.
CDMs
The latent class models of cognitive diagnosis are usually restricted based on assumptions about the basic process of the examinee’s responses to items. The authors only focus on three of them (i.e., DINA, DINO, and RRUM models). For a full review of different CDMs, please refer to Henson et al. (2009) and Rupp et al. (2010).
Some basic concepts and terms used in CDMs are introduced first. Let Yi = (Yi1, Yi2, . . ., YiJ) denote the ith examinee’s dichotomous item responses to J items, where i = 1, 2, . . ., N, with N indicating the number of examinees. Let αi = (αi1, αi2, . . ., αiK)′ denote the attribute profile of examinee i, where K is the number of attributes measured by the test, αik = 1 indicates that the ith examinee has mastered the kth attribute, and αik = 0 otherwise. The Q-matrix, Q = {qjk}(J×K), specifies the associations between items and attributes (Tatsuoka, 1985). It is a binary matrix with the entry qjk = 1 indicating that a correct response to item j requires mastery of the kth attribute when there is no guessing, and qjk = 0 otherwise. The Q-matrix is usually identified by content experts and psychometricians.
Conjunctive latent class models for cognitive diagnosis represent that answering an item correctly requires the mastery of all attributes specified in the Q-matrix for the item. These models also allow for slips and guesses in ways that distinguish the models from one another.
As a simple example of a conjunctive model, the DINA model was originally proposed by Haertel (1989), as an extension of the two-class model of Macready and Dayton (1977), and later discussed extensively by Junker and Sijtsma (2001). It relates item responses to a set of latent attributes. Let ηij be the ideal response which connects the ith examinee’s attribute pattern and elements of the Q-matrix. ηij = 1 indicates that the ith examinee possesses all the required attributes of item j, and ηij = 0 otherwise. It can be calculated as follows:
| (1) |
At the same time, the DINA model allows for “slipping” and “guessing.” Here, slips and guesses are modeled at the item level. sj = P(Yij = 0|ηij = 1) represents the probability of slipping on the jth item when examinee i has mastered all the attributes it requires. gj = P(Yij = 1|ηij = 0) denotes the probability of correctly answering the jth item when an examinee has not mastered all of the required attributes. The slipping and guessing parameters should meet the following constraint: 0 < gj < 1 −sj < 1, j = 1, 2, . . ., J.
The item response function (IRF) of the DINA model is
| (2) |
The DINA model requires only two easily interpretable parameters for each item, that is, sj and gj. Both item parameters and examinees’ attribute patterns can be obtained using the maximum likelihood estimation (MLE) method. The DINA model is therefore a popular and computationally efficient model.
The NIDA model, introduced by Maris (1999), and named by Junker and Sijtsma (2001), differs from the DINA model by defining attribute-level parameters (i.e., sk and gk). Let ηijk indicate whether or not the ith examinee correctly applied the kth attribute in completing the jth item. Slipping and guessing parameters are indexed by attribute and are defined as follows:
| (3) |
In the NIDA model, an item response is correct (i.e., Yij = 1) if all ηijk values are equal to 1, that is, . Assuming that ηijk’s are independent conditional on αi, the IRF has the form:
| (4) |
According to Equation 4, it can be seen that slipping and guessing parameters for different attributes are constant over items. Therefore, the NIDA model is somewhat restrictive and implies that IRFs remain the same for all items sharing the same attributes. It implies that item difficulty levels would be exactly the same for many items; however, this is unrealistic to apply to practical datasets. A straightforward extension of the NIDA model is the generalized NIDA (G-NIDA) model where the slipping and guessing parameters are allowed to vary across the items. Its IRF has the following form:
| (5) |
The IRF for the RRUM (Hartz et al., 2005) is given by
| (6) |
where denotes the probability of answering correctly for someone who possesses all of the required attributes and can be thought of as a penalty parameter for those who do not possess the kth attribute. By setting
| (7) |
it appears that RRUM is an alternative way of parametrizing the G-NIDA model (de la Torre, 2011). The ideal response is defined as follows:
| (8) |
Conjunctive models require the intersection of a set of attributes. However, disjunctive models, which can be considered as the “opposite” of conjunctive models, require mastery of at least one of the required attributes in the item. As an example, Templin and Henson (2006) introduced the DINO model. The IRF of the DINO model is expressed as
| (9) |
where is the ideal response and indicates whether or not at least one of the attributes required in item j is mastered, and the definitions of sj and gj are the same as the ones in the DINA model.
Method
To enhance the classification accuracy of the item selection methods, the authors proposed a series of stratified item selection methods by stratifying the item bank based on a stratification index, similar to the a-stratification method in CAT, in fixed-length CD-CAT. The key of CD-CAT item bank stratification is item discrimination indices for CDMs. Next, the authors will introduce two types of item discrimination indices for CDMs as the stratification indices.
Original Stratification Index
Rupp et al. (2010) introduced two types of item discrimination indices for CDMs: the classical test theory (CTT)-based global indices and the KL information–based indices, in which the CTT-based global indices can be regarded as the counterpart of the a parameter in the item response theory (IRT) and thus as the original stratification index (Zheng & Wang, 2017). The CTT-based global indices for the DINA, DINO, and RRUM models are as follows:
| (10) |
| (11) |
| (12) |
According to Equation 7, it can be obtained , and thus Equation 12 is equivalent to the following form:
| (13) |
Novel Stratification Index
For the DINA model, Li et al. (2016) and Lee (2017) examined the diagnostic quality of each item by the following indicator:
| (14) |
which is the odds ratio between responding correctly to item j conditional on ηij = 1 and responding correctly to item j conditional on ηij = 0. The item with the largest odds ratio is considered to be the most diagnostic item that discriminates well between examinees who have mastered attributes required by that item (i.e., ηij = 1) and those who have not mastered the required attributes (i.e., ηij = 0). Therefore, the above indicator can be treated as an item discrimination index, and thus, as the novel stratification criterion for the DINA model, it is denoted as .
Similarly, according to the definition of the novel stratification index and Equation 11, the novel stratification index for the DINO model can be defined as follows:
| (15) |
For RRUM, according to Equations 5 to 8, the following can be obtained:
| (16) |
Hence, based on the above definition and Equation 7, the novel stratification index for RRUM can be defined as follows:
| (17) |
Given the stratification index and the item selection method (e.g., the PWKL, NPS, or WNPS method), a simple stratification procedure for the CD-CAT can be described as follows:
Step 1: Partition the item bank into M levels according to the stratification index;
Step 2: Partition the test into M stages;
Step 3: In the mth stage, select nm items from the mth level based on the selection method given above (note that test length = n1+n2+ ⋯ +nM);
Step 4: Repeat Step 3 for m = 1, 2, . . ., M.
It is noted that the stratification method proposed here can be readily combined with all item selection methods. However, in this study, only the PWKL, NPS, and WNPS methods will be combined with the proposed stratification method, named S-PWKL, S-NPS,1 and S-WNPS2 methods, respectively.
According to Chang and Ying (1999), three factors should be considered in selecting M, the number of levels. The first factor is the variation of stratification indices within the level. If the item bank consists of items with disparate stratification indices, a relatively large number of levels are required. Conversely, if the item bank consists of items with similar stratification indices, only a small number of levels are required. The second and third factors are test length and item bank size, respectively. If the bank is large enough, M can be approximately equal to the test length.
In addition, the size of each level also needs to be determined. Normally, it should be proportional to the number of items being administered at that level, which ensures that exposure rates of items at different levels will be similar.
Simulation Study
The primary goals of our simulation are to (a) illustrate the performances of the proposed stratified item selection methods (i.e., S-PWKL, S-NPS, and S-WNPS) with different stratification indices and (b) compare them with the PWKL, NPS, and WNPS methods without stratification.
First, a simple simulation was carried out to evaluate the performance of the NPC method against MAP, which was a common profile estimation method, and the PWKL was used as the item selection method in CD-CAT. Results indicated that the NPC method was comparable to or better than the MAP method across almost all manipulated conditions. Interested readers can refer to Online Supplement for details.
Design
Item bank generation
Either of the DINA, DINO, and RRUM models was considered as the data generation model, respectively, with the number of attributes K∈ {3, 5} (Chiu et al., 2018; G. Xu et al., 2016) and the item bank size J = 350. The test length was L = 4K (Chang et al., 2018). The Q-matrix is a J×K matrix with for all j = 1, . . ., J and k = 1, . . ., K. Every item was constrained to measure at least one of K attributes to avoid trivial rows in the Q-matrix (Chang et al., 2018; Wang, 2013). The Q-matrix was regenerated from the Bernoulli(0.5) for each condition, but it was the same in each replication for that condition. For three CDMs, the guessing and slipping parameters were generated from U(0.1, 0.2) or U(0.2, 0.3), denoting high and low item qualities, respectively (Chang et al., 2018). The effect of the number of strata was also examined. The item bank was stratified into three and five strata (Yi & Chang, 2003) for each of the stratified methods with a similar number of items according to the ascending order of stratification indices described above. For the three-stratum condition, each of the first two strata consists of 117 items and the third stratum has 116 items. For the five-stratum condition, each stratum consists of 70 items.
Examinee generation
Following a similar setting to Chang et al. (2018), to investigate the effect of the error from item parameter calibration on the performance of the studied methods, three sample sizes, N0 = 30, 50, and 100, were considered. It was worth noting here that the calibration samples were used to compute the weight of each item for the WNPS algorithm and calibrate the item parameters for the parametric item selection method (i.e., the PWKL method). Like Chiu and Douglas (2013), N = 1000 examinees’ attribute patterns were generated from the multivariate normal threshold model, which was used to mimic a realistic situation where attributes were correlated and of unequal prevalence. The discrete α was linked to an underlying multivariate normal distribution, θi ~ MVN(0K, Σ), where the covariance matrix Σ had the following structure:
and ρ was set to be 0.5. Let θi = (θi1, θi2, . . ., θiK)′ denote the K-dimensional vector of latent continuous scores for examinee i. The attribute pattern αi = (αi1, αi2, . . ., αiK)′ was determined by
| (18) |
Item selection algorithms
Three item selection methods were used in this study, including S-PWKL (the baseline condition), S-NPS, and S-WNPS with three types of stratification indices (i.e., no stratification, original, and novel).
Parameter estimation
The attribute pattern estimates, , were obtained by the NPC method.
Stopping rule
The fixed-length method (L = 4K) was used to terminate the procedures.
Therefore, there were 3 (calibration sample size) × 2 (number of attributes) × 3 (data generation models) × 2 (item quality) × 1 (attribute structure) × 2 (number of strata) = 72 data generation conditions for the simulation study. For each condition, 100 replications were conducted.
Evaluation Criteria
Results are summarized in terms of two evaluation indices. They describe the agreement between the estimated and the known true attribute patterns. One is the pattern-wise agreement rate (PAR), denoting the correct classification rates of attribute patterns, formulated as
| (19) |
The other is the attribute-wise agreement rate (AAR), denoting the correct classification rates of individual attributes, defined as
| (20) |
The mean PAR and the mean AAR across the 100 replications were then obtained and reported.
Results
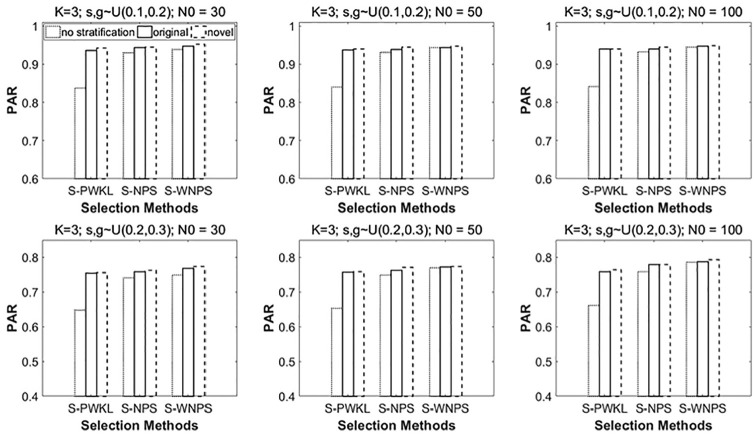
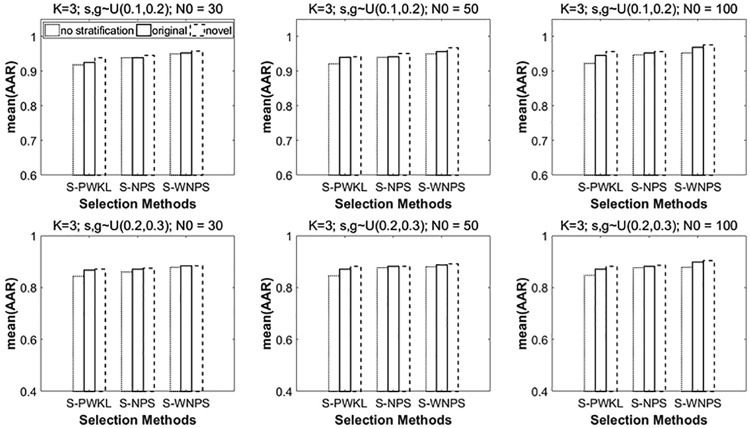
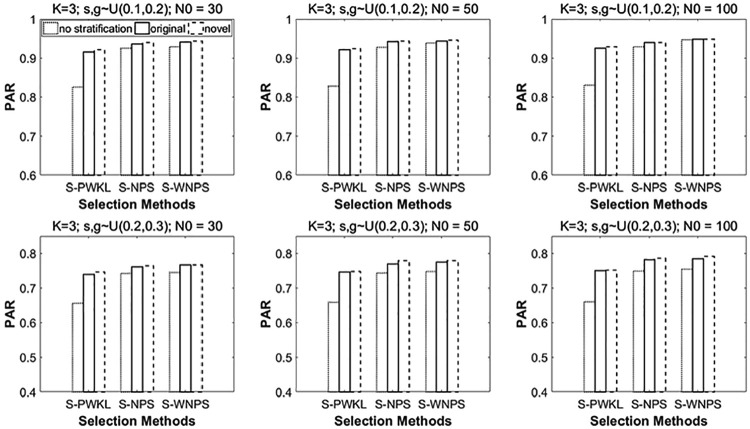
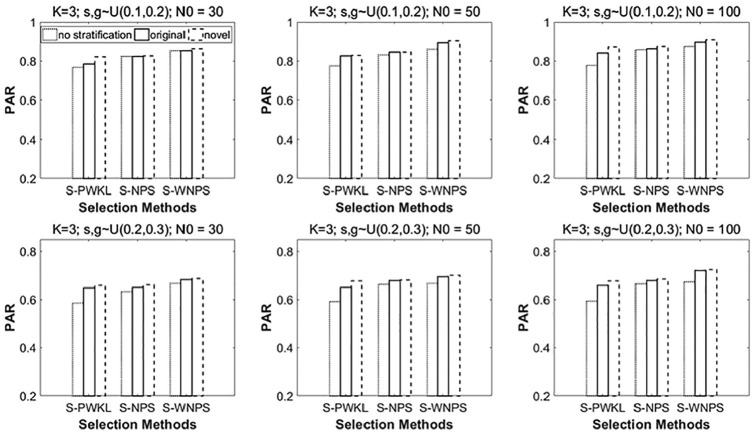
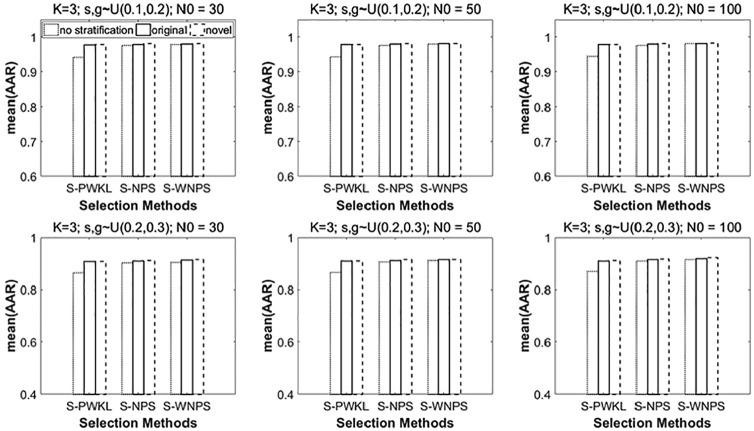
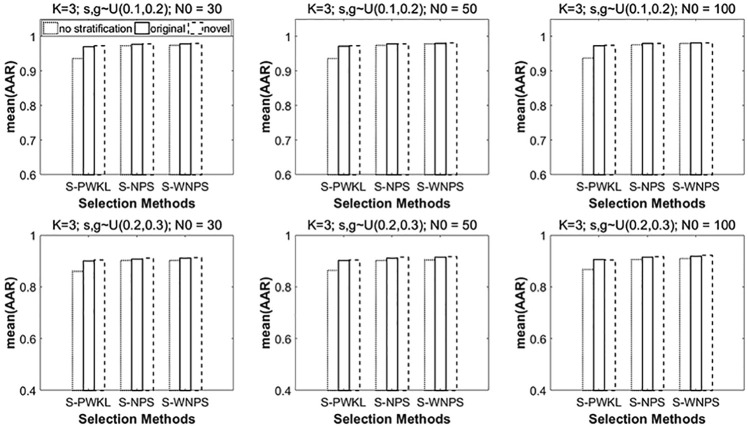
Summaries of PARs and AARs for various conditions when the number of attributes (K) was 3 and the number of strata (M) was 3 are presented in Figures 2 to 7.
Figure 2.
PARs under the DINA model when K = 3 and number of strata = 3.
Note. PARs = pattern-wise agreement rates; DINA = Deterministic Input, Noisy “And” Gate; PWKL = posterior-weighted Kullback–Leibler; NPS = nonparametric item selection; WNPS = weighted nonparametric item selection.
Figure 7.
Mean of AARs under the RRUM model when K = 3 and number of strata = 3.
Note. AARs = attribute-wise agreement rate; RRUM = reduced reparameterized unified model; PWKL = posterior-weighted Kullback–Leibler; NPS = nonparametric item selection; WNPS = weighted nonparametric item selection.
Figure 2 shows the PARs when the generating model is the DINA model. It contains six subfigures. From the top to the bottom row, the item quality changes from high to low quality. From the left to the right column, the calibration sample size (N0) increases from 30 to 100. Within each subfigure, the vertical axis represents the PARs and the horizontal axis represents three item selection methods (i.e., S-PWKL, S-NPS, S-WNPS). The performances of the above three item selection methods with different stratification indices are reflected in each subfigure by bars with different edges.
In Figure 2, going from the top to the bottom row, it is clear that, with the decrease of the item quality, that is, the guessing and slipping become larger, the PARs go down, which is expected. Going from the left to the right column, when the calibration sample size increases, the change in PARs is fairly small. In general, the top right subfigure shows the highest PARs, whereas the bottom left subfigure shows the lowest PARs. Within each subfigure, the item selection methods with novel stratification index performed slightly better than the item selection methods with original stratification index, and the item selection methods without stratification performed the worst, which indicated the efficiency of the novel stratification index proposed in this study. In addition, as found by Chang et al. (2018), the S-WNPS and S-NPS methods performed similarly, and both outperformed the S-PWKL item selection method. Furthermore, the S-NPS and S-WNPS methods without stratification (i.e., NPS and WNPS) considerably outperformed the parametric method (i.e., PWKL), and their corresponding PARs stayed high. It is worth noting that, applying the stratification, the discrepancy between the nonparametric methods and the parametric method decreased. This indicates that the stratification mechanism improved the classification accuracy of the three item selection methods, especially for the parametric method. This finding is consistent with previous studies (Chang & Ying, 1996, 1999, 2007; Hau & Chang, 2001).
Figures 3 and 4 are presented in the same way as Figure 2, for the conditions in which the underlying model is the DINO model and the RRUM model, respectively. The patterns are very similar. The PAR values under the DINO model are comparable to the ones under the DINA model, whereas the PAR values under the RRUM model are lower than those under the DINA and DINO models. The maximum difference is around 13%.
Figure 3.
PARs under the DINO model when K = 3 and number of strata = 3.
Note. PARs = pattern-wise agreement rates; DINO = Deterministic Input, Noisy “Or” Gate; PWKL = posterior-weighted Kullback–Leibler; NPS = nonparametric item selection; WNPS = weighted nonparametric item selection.
Figure 4.
PARs under the RRUM model when K = 3 and number of strata = 3.
Note. PARs = pattern-wise agreement rates; RRUM = reduced reparameterized unified model; PWKL = posterior-weighted Kullback–Leibler; NPS = nonparametric item selection; WNPS = weighted nonparametric item selection.
Figure 5 shows the AARs when the generating model is the DINA model. The top right subfigure shows that when the calibration sample size is 100 and the item quality is high, the AARs reach around 98% when the S-WNPS with the novel discrimination index is used as the item selection method. As the item quality becomes low, that is, the guessing and slipping go up, the AARs quickly drop. The lowest AAR is between 0.86 and 0.87 when S-PWKL without stratification (i.e., PWKL) is used, which occurs in the bottom left subfigure, where the item quality is low and the calibration sample size is the smallest (N0 = 30).
Figure 5.
Mean of AARs under the DINA model when K = 3 and number of strata = 3.
Note. AARs = attribute-wise agreement rate; DINA = Deterministic Input, Noisy “And” Gate; PWKL = posterior-weighted Kullback–Leibler; NPS = nonparametric item selection; WNPS = weighted nonparametric item selection.
Figures 6 and 7 summarize the AARs when the underlying model is the DINO model and the RRUM model, respectively. The trends are largely similar to those discussed above, when the underlying model is the DINA model.
Figure 6.
Mean of AARs under the DINO model when K = 3 and number of strata = 3.
Note. AARs = attribute-wise agreement rate; DINO = Deterministic Input, Noisy “Or” Gate; PWKL = posterior-weighted Kullback–Leibler; NPS = nonparametric item selection; WNPS = weighted nonparametric item selection.
The PARs and the AARs under various conditions when K is 5 and the number of strata is 3 are shown in Figures S1 to S6 (Online Supplement). The patterns and trends are all similar to Figures 2 to 7. Given the limited space, the authors will not describe them in detail here. As would be expected, when the number of attributes increased, the performance of the above three item selection methods decreased.
It can be observed from Figures S7 to S18 (Online Supplement) that the case with five strata shows the same kind of information as results when the number of strata is three. And all the stratified methods performed similarly when the number of strata increased from three to five. See details in Online Supplement.
Discussion
With the progress of science and computer technology, there has been growing interest in CD-CAT. The CD-CAT purports to obtain individualized diagnostic feedback with the efficiency brought by CAT (Cheng, 2009). And the item selection methods are the key to success in the CD-CAT procedure.
This article introduced two types of stratification indices and proposed a series of stratification item selection methods, which combined the PWKL, NPS, and WNPS methods (Chang et al., 2018), to enhance the classification performance of these item selection methods. Furthermore, the proposed item selection methods were compared against the original PWKL, NPS, and WNPS methods via the simulation study. Results demonstrated the feasibility of using the two types of stratification indices and advantages of item selection methods with a stratification mechanism over the ones without stratification, which is consistent with what the authors expected. Therefore, this study suggests a stratified CD-CAT framework for practitioners who intend to develop their own CD-CAT testing in the future.
The simulation design in this study was limited. Future studies can explore the termination criteria under more comprehensive conditions. In this study, only fixed-length CD-CAT is considered. The fixed-length termination rule, which has been used frequently in CAT, leads to different degrees of measurement precision for different examinees (Hsu et al., 2013; Hsu & Wang, 2015). Hence, the influence of variable-length CAT termination rule on the item selection methods and the corresponding terminal rules should be considered in the future. In addition, real CD-CAT programs need to consider operational issues, such as test security, nonstatistical context constraints, content balancing (e.g., balancing attribute coverage; Cheng, 2010), and the calibration of Q-matrix (Lim & Drasgow, 2017).
As it is known that the model-based classification methods required the users to prespecify the underlying model, the structure of the items (i.e., conjunctive or disjunctive) has to be known in advance to guarantee the adequate performance of the NPC method (Chiu & Douglas, 2013). However, Chiu et al. (2018) introduced a general nonparametric classification (GNPC) method, as an extension of the NPC method, and showed that the GNPC method assigned examinees to the correct proficiency classes with a high rate of accuracy when sample sizes were at the classroom level. However, usual statistical estimation techniques cannot be used in the context of small-scale assessment simply, because the sample sizes were too small to guarantee reliable estimations of item parameters and examinees’ attribute patterns. In addition, the most important feature of the GNPC method is that the GNPC method can be used to analyze data that conform to general CDMs, which remedied the shortcomings of the NPC method. Therefore, it is essential to introduce a general nonparametric item selection (GNPS) method based on the GNPC method, which is analogous to construct the NPS method based on the NPC method and investigate its performances with small-scale test settings.
Supplemental Material
Supplemental material, supplemental_material_pdf for Stratified Item Selection Methods in Cognitive Diagnosis Computerized Adaptive Testing by Jing Yang, Hua-Hua Chang, Jian Tao and Ningzhong Shi in Applied Psychological Measurement
Acknowledgments
The authors would like to thank the Editor in Chief, the Associate Editor, Dr. Xue Zhang, and two anonymous reviewers for their helpful comments on earlier drafts of this article.
The Hamming distance between the observed response and ideal response patterns was used in the NPS method (Chiu & Douglas, 2013).
In the WNPS method, the weighted Hamming distance was defined by weighting according to the inverse sample variance, , where indicated the proportion of examinees responding correctly to item j (Chiu & Douglas, 2013).
Footnotes
Declaration of Conflicting Interests: The author(s) declared no potential conflicts of interest with respect to the research, authorship, and/or publication of this article.
Funding: The author(s) disclosed receipt of the following financial support for the research, authorship, and/or publication of this article: This research was supported by the National Natural Science and Social Science Foundations of China (Grant No. 11571069).
ORCID iDs: Jing Yang  https://orcid.org/0000-0001-7453-4353
Supplemental Material: Supplemental material for this article is available online.
References
- Chang H. H., Ying Z. (1996). A global information approach to computerized adaptive testing. Applied Psychological Measurement, 20(3), 213–229. [Google Scholar]
- Chang H. H., Ying Z. (1999). a-stratified multistage computerized adaptive testing. Applied Psychological Measurement, 23, 211–222. [DOI] [PMC free article] [PubMed] [Google Scholar]
- Chang H. H., Ying Z. (2007). Computerized adaptive testing. In Salkind N. J. (Ed.), Encyclopedia of measurement and statistics (Vol. 1, pp. 170–173). SAGE. [Google Scholar]
- Chang Y. P., Chiu C. Y., Tsai R. C. (2019). Non-parametric CAT for CD in educational settings with small samples. Applied Psychological Measurement, 43(7), 543–561. [DOI] [PMC free article] [PubMed] [Google Scholar]
- Cheng Y. (2008). Computerized adaptive testing-new developments and applications [Unpublished doctoral dissertation]. University of Illinois at Urbana–Champaign. [Google Scholar]
- Cheng Y. (2009). When cognitive diagnosis meets computerized adaptive testing. Psychometrika, 74, 619–632. [Google Scholar]
- Cheng Y. (2010). Improving cognitive diagnostic computerized adaptive testing by balancing attribute coverage: The modified maximum global discrimination index method. Educational and Psychological Measurement, 70, 902–913. [Google Scholar]
- Cheng Y., Chang H. H., Douglas J., Guo F. (2009). Constraint-weighted a-stratification for computerized adaptive testing with non-statistical constraints: Balancing measurement efficiency and exposure control. Educational and Psychological Measurement, 69(1), 35–49. [Google Scholar]
- Chiu C. Y., Douglas J. A. (2013). A non-parametric approach to cognitive diagnosis by proximity to ideal response patterns. Journal of Classification, 30, 225–250. [Google Scholar]
- Chiu C. Y., Sun Y., Bian Y. (2018). Cognitive diagnosis for small educational programs: The general nonparametric classification method. Psychometrika, 83(2), 355–375. [DOI] [PubMed] [Google Scholar]
- de la Torre J. (2009). A cognitive diagnosis model for cognitively based multiple choice options. Applied Psychological Measurement, 33, 163–183. [Google Scholar]
- de la Torre J. (2011). The generalized DINA model framework. Psychometrika, 76, 179–199. [Google Scholar]
- de la Torre J., Douglas J. A. (2004). Higher-order latent trait models for cognitive diagnosis. Psychometrika, 69, 333–353. [Google Scholar]
- DiBello L. V., Stout W. (2007). Guest editors’ introduction and overview: IRT-based cognitive diagnostic models and related methods. Journal of Educational Measurement, 44(4), 285–291. [Google Scholar]
- Haertel E. H. (1989). Using restricted latent class models to map the skill structure of achievement items. Journal of Educational Measurement, 26, 301–321. [Google Scholar]
- Hartz S. (2002). A Bayesian framework for the Unified Model for assessing cognitive abilities: Blending theory with practice [Unpublished doctoral dissertation]. University of Illinois at Urbana–Champaign. [Google Scholar]
- Hartz S. M., Roussos L. A. (2005). The Fusion Model for skills diagnosis: Blending theory with practice. ETS Research Report. [Google Scholar]
- Hartz S., Roussos L., Stout W. (2002). Skill diagnosis: Theory and practice [Computer software user manual for Arpeggio software]. Educational Testing Service. [Google Scholar]
- Hau K. T., Chang H. H. (2001). Item selection in computerized adaptive testing: Should more discriminating items be used first? Journal of Educational Measurement, 38(3), 249–266. [Google Scholar]
- Henson R. A., Templin J. L., Willse J. T. (2009). Defining a family of cognitive diagnosis models using log-linear models with latent variables. Psychometrika, 74(2), 191–210. [Google Scholar]
- Hsu C. L., Wang W. C. (2015). Variable-length computerized adaptive testing using the higher order DINA model. Journal of Educational Measurement, 522(2), 125–143. [Google Scholar]
- Hsu C. L., Wang W. C., Chen S. Y. (2013). Variable-length computerized adaptive testing based on cognitive diagnosis models. Applied Psychological Measurement, 37, 563–582. [Google Scholar]
- Jang E. (2008). A framework for cognitive diagnostic assessment. In C. A. Chapelle, Y.-R. Chung, & J. Xu (Eds.), Towards on adaptive CALL: Natural language processing for diagnostic language assessment (pp. 117–131). Iowa State University. [Google Scholar]
- Junker B. W., Sijtsma K. (2001). Cognitive assessment models with few assumptions, and connections with non-parametric item response theory. Applied Psychological Measurement, 25, 258–272. [Google Scholar]
- Kaplan M., de la Torre J., Barrada J. R. (2015). New item selection methods for cognitive diagnosis computerized adaptive testing. Applied Psychological Measurement, 39(3), 167–188. [DOI] [PMC free article] [PubMed] [Google Scholar]
- Lee S. Y. (2017). Growth curve cognitive diagnosis models for longitudinal assessment [Unpublished doctoral dissertation]. University of California, Berkeley. [Google Scholar]
- Li F., Cohen A., Bottge B., Templin J. (2016). A latent transition analysis model for assessing change in cognitive skills. Educational and Psychological Measurement, 76(2), 181–204. [DOI] [PMC free article] [PubMed] [Google Scholar]
- Lim Y. S., Drasgow F. (2017). Non-parametric calibration of item-by-attribute matrix in cognitive diagnosis. Multivariate Behavioral Research, 52(5), 562–575. [DOI] [PubMed] [Google Scholar]
- Macready G. B., Dayton C. M. (1977). The use of probabilistic models in the assessment of mastery. Journal of Educational Statistics, 33, 379–416. [Google Scholar]
- Maris E. (1999). Estimating multiple classification latent class models. Psychometrika, 64, 187–212. [Google Scholar]
- McGlohen M. K., Chang H. (2008). Combining computer adaptive testing technology with cognitively diagnostic assessment. Behavioral Research Methods, 40, 808–821. [DOI] [PubMed] [Google Scholar]
- No Child Left Behind Act of 2001, Pub. L. No. 1-7-110 (2001). [Google Scholar]
- Rupp A. A., Templin J., Henson R. J. (2010). Diagnostic measurement: Theory, methods, and applications. Guilford Press. [Google Scholar]
- Tatsuoka K. K. (1983). Rule space: An approach for dealing with misconceptions based on item response theory. Journal of Educational Measurement, 20, 345–354. [Google Scholar]
- Tatsuoka K. K. (1985). A probabilistic model for diagnosing misconceptions by the pattern classification approach. Journal of Educational and Behavior Statistics, 10, 55–73. [Google Scholar]
- Templin J. L., Henson R. A. (2006). Measurement of psychological disorders using cognitive diagnosis models. Psychological Methods, 11, 287–305. [DOI] [PubMed] [Google Scholar]
- von Davier M. (2005). A general diagnostic model applied to language testing data (ETS Research Rep. No. RR-05-16). Educational Testing Service. [DOI] [PubMed] [Google Scholar]
- von Davier M. (2008). A general diagnostic model applied to language testing data. British Journal of Mathematical and Statistical Psychology, 61, 287–307. [DOI] [PubMed] [Google Scholar]
- Wang C. (2013). Mutual information item selection method in cognitive diagnostic computerized adaptive testing with short test length. Journal of Educational Measurement, 73(6), 1017–1035. [Google Scholar]
- Wang C., Chang H. H., Huebner A. (2011). Restrictive stochastic item selection methods in cognitive diagnostic computerized adaptive testing. Journal of Educational Measurement, 48(3), 255–273. [Google Scholar]
- Weiss D. J. (1982). Improving measurement quality and efficiency with adaptive testing. Applied Psychological Measurement, 6(4), 473–492. [Google Scholar]
- Xu G., Wang C., Shang Z. (2016). On initial item selection in cognitive diagnostic computerized adaptive testing. British Journal of Mathematical and Statistical Psychology, 69(3), 291–315. [DOI] [PubMed] [Google Scholar]
- Xu X., Chang H., Douglas J. (2003, April). A simulation study to compare CAT strategies for cognitive diagnosis [Paper presentation]. Annual Meeting of the American Educational Research Association, Chicago, IL, United States. [Google Scholar]
- Yi Q., Chang H. H. (2003). a-stratified cat design with content blocking. British Journal of Mathematical and Statistical Psychology, 56(2), 359–378. [DOI] [PubMed] [Google Scholar]
- Zheng C., Chang H. H. (2016). High-efficiency response distribution–based item selection algorithms for short-length cognitive diagnostic computerized adaptive testing. Applied Psychological Measurement, 40(8), 608–624. [DOI] [PMC free article] [PubMed] [Google Scholar]
- Zheng C., Wang C. (2017). Application of binary searching for item exposure control in cognitive diagnostic computerized adaptive testing. Applied Psychological Measurement, 41(7), 561–576. [DOI] [PMC free article] [PubMed] [Google Scholar]
Associated Data
This section collects any data citations, data availability statements, or supplementary materials included in this article.
Supplementary Materials
Supplemental material, supplemental_material_pdf for Stratified Item Selection Methods in Cognitive Diagnosis Computerized Adaptive Testing by Jing Yang, Hua-Hua Chang, Jian Tao and Ningzhong Shi in Applied Psychological Measurement


