

SUMMARY
Stem cell-derived β (SC-β) cells could provide unlimited human β cells toward a curative diabetes treatment. Differentiation of SC-β cells yields transplantable islets that secrete insulin in response to glucose challenges. Following transplantation into mice, SC-β cell function is comparable to human islets, but the magnitude and consistency of response in vitro are less robust than observed in cadaveric islets. Here, we profile metabolism of SC-β cells and islets to quantify their capacity to sense glucose and identify reduced anaplerotic cycling in the mitochondria as the cause of reduced glucose-stimulated insulin secretion in SC-β cells. This activity can be rescued by challenging SC-β cells with intermediate metabolites from the TCA cycle and late but not early glycolysis, downstream of the enzymes glyceraldehyde 3-phosphate dehydrogenase and phosphoglycerate kinase. Bypassing this metabolic bottleneck results in a robust, bi-phasic insulin release in vitro that is identical in magnitude to functionally mature human islets.
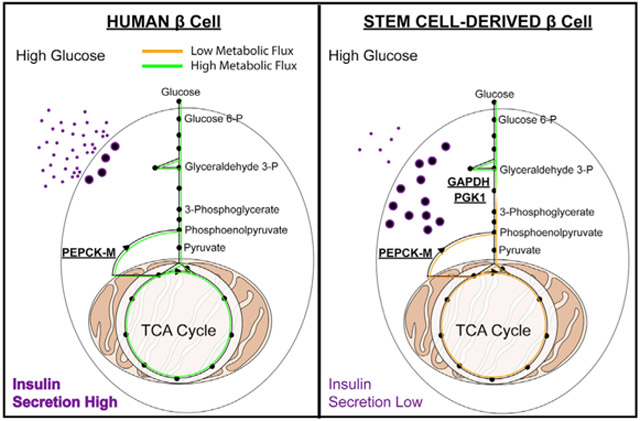
Graphical Abstract
In Brief
Glucose-stimulated insulin secretion is deficient in stem cell-derived β (SC-β) cells in vitro. Davis et al. use metabolomic analysis to define a glycolytic bottleneck inhibiting glucose metabolism and sensing in SC-β cells. Cell-permeable intermediates bypass this bottleneck, as does transplantation in vivo, producing insulin secretion indistinguishable from human islets.
INTRODUCTION
β cells in the pancreatic islet of Langerhans regulate blood sugar levels by secreting the peptide hormone insulin, which stimulates glucose uptake in peripheral tissues to maintain normoglycemia (Haeusler et al., 2018; Petersen and Shulman, 2018). Islets secrete insulin in response to rises in circulating glucose levels, coupling insulin secretion to increased glucose metabolism (Rorsman and Braun, 2013). Patients lacking sufficient insulin due to the autoimmune destruction of the islet β cell in type 1 diabetes (T1D) (Atkinson et al., 2014), or due to β cell dysfunction in type 2 diabetes (T2D) (Petersen and Shulman, 2018), are treated with administration of exogenous insulin—a lifesaving therapy, but one that incompletely recapitulates the functional glycemic control of the islet (Russell et al., 2014). Transplantation of human cadaveric islet tissue successfully restores glycemic control in T1D patients, but at a cost of immune suppression to prevent allo-rejection (Gamble et al., 2018; Shapiro et al., 2000), and is limited by available healthy islet tissue for transplantation (Lakey et al., 1996). Both of these challenges can, in principle, be solved by using human stem cell-derived β (SC-β) cells.
Early reports of differentiated insulin-producing cells from pluripotent stem sources resulted in a cell type with little glucose responsiveness (Kroon et al., 2008; D’Amour et al., 2006). We developed a six-step protocol that directed differentiation of human pluripotent stem cells into SC-β cells that successfully responded to sequential glucose challenges (Pagliuca et al., 2014). Other protocols have also achieved similar results, in all cases exhibiting higher insulin secretion after in vitro glucose challenge (Russ et al., 2015; Rezania et al., 2014). Subsequent protocol modifications aimed at improving SC-β cell function have utilized small-molecule screening (Ghazizadeh et al., 2017), altered culture conditions for differentiation (Nair et al., 2019; Velazco-Cruz et al., 2019), or activated genes upregulated during development of mature, functional islets (Yoshihara et al., 2016). However, none of the resulting cells achieved an in vitro glucose-stimulated insulin secretion (GSIS) response equivalent to that of cadaveric islets in terms of the magnitude of insulin secretion or a biphasic pattern of insulin release. Shifts in β cell metabolism during normal development contribute to functional maturation (Wortham et al., 2018). Similar metabolomic studies have not yet been replicated in SC-β cells and offer a more direct approach to improve metabolic glucose sensing in in vitro-differentiated β cells. Following transplantation and engraftment, SC-β cells perform as well as cadaveric islets; it is their in vitro functional state that is deficient (Motté et al., 2014; Robert et al., 2018). In all, while glucose-responsive, insulin-secreting cells have been obtained by in vitro differentiation of stem cells, the differentiated cells do not fully recapitulate the biphasic insulin secretion in vitro that is observed with human cadaveric islets.
In this report, we use metabolic analyses to examine glucose responsiveness in SC-β cells and identify the biochemical disconnect that prevents a fully islet-like response to glucose challenge in vitro. We demonstrate that SC-β cells are capable of an insulin secretion phenotype in vitro that is indistinguishable from fully functional cadaveric islets and describe a bottleneck in glucose metabolism that limits glucose responsiveness in SC-β cells. This bottleneck resides at the activities of the glycolytic “housekeeping” enzymes, glyceraldehyde 3-phosphate dehydrogenase (GAPDH) and phosphoglycerate kinase (PGK1), restricting the SC-β cell GSIS phenotype. Bypassing this bottleneck in glucose metabolism fully rescues insulin secretion during nutrient challenge. Determining how best to correct this metabolic oddity will lead to the generation of fully functional SC-β cells in vitro.
RESULTS
Glucose-Stimulated Insulin Secretion in Stem Cell-Derived β Cells and Healthy Cadaveric Islets
SC-β cells respond to glucose in vitro by secreting higher levels of insulin during glucose challenge (Pagliuca et al., 2014; Rezania et al., 2014; Russ et al., 2015). These differentiated clusters contain 20%–40% SC-β cells, which are primarily defined by expression of the transcription factor Nkx6.1 and the processed C-peptide fragment of insulin (Pagliuca et al., 2014), but also contain other endocrine cells including α (glucagon-expressing) and δ (somatostatin-expressing) cells at lower frequencies (Veres et al., 2019). We analyzed a large cohort (n = 92) of unsorted differentiations from human embryonic stem (hES) cell-derived (HUES8) and some induced pluripotent stem (iPS) cell-derived (1016) backgrounds, as well as cadaveric islets controls. On average, cadaveric islets display a much larger magnitude of insulin secretion in response to glucose (Figure 1A) compared to SC-β cells (Figure 1B). While individual SC-β cell differentiations exhibit variable glucose responsiveness, compiling data across a wide range of differentiations results in a modest but statistically significant difference in glucose challenge conditions. Presented as a stimulation index, or fold-change in insulin secretion during hyperglycemic culture conditions, the cadaveric islet response to glucose challenge is approximately 10-fold higher than basal secretion, whereas SC-β clusters respond with an average of 2.2-fold higher secretion. Direct membrane depolarization using 30 mM KCl results in similar magnitudes of maximal insulin release (Figures 1C and 1D) in cadaveric islets and SC-β cells of approximately 20-fold over basal insulin release. While differing in glucose response, SC-β cells and cadaveric islets retain similar overall insulin content (Figure 1E). Dynamic perifusion reveals similar bi-phasic insulin secretion patterns in both cell types, although again the magnitude of SC-β response is roughly 20% of that observed for cadaveric islets, similar to static incubation (Figures 1F and 1G). These results replicate previous reports of a muted insulin secretion response to glucose but not KCl challenge with a variety of protocols to generate SC-β cells (Millman et al., 2016; Pagliuca et al., 2014; Velazco-Cruz et al., 2019; Nair et al., 2019; Russ et al., 2015; Rezania et al., 2014).
Figure 1. Insulin Secretion Profiles in SC-β Cells.

(A and B) Glucose response profile of human cadaveric islets (n = 7) (A) and differentiated SC-β cells (n = 92) (B) challenged with low glucose (2.8 mM), high glucose (16.7 mM), or KCl (30 mM) in low-glucose buffer for 60 min.
(C and D) Stimulation index of cadaveric islets (C) and SC-β cells (D) after glucose or KCl challenge. Stimulation indices are indicated above each column.
(E) Total insulin content profile of human cadaveric islets and SC-β cells (n = 7 and 24 for human islets and SC-β cells, respectively).
(F and G) Dynamic perifusion insulin secretion profile of cadaveric islets (n = 3) (F) and SC-β cells (n = 4) (G).
Statistical analysis was carried out using two-way ANOVA with Dunnett’s correction for multiple hypothesis testing. For all experiments shown, color denotes a unique biological replicate within an experiment. Replicates within a biological group are the same color. Data are represented as mean ± SD.
Insulin Secretion Capacity
Because the magnitudes of insulin release after KCl depolarization are similar in cadaveric islets and SC-β cells (Figures 1A and 1B), we asked whether the smaller SC-β GSIS response is due to a defect in glucose metabolism that underlies ATP-mediated depolarization or alternatively an inability of SC-β cells to undergo membrane depolarization following a glucose challenge. We perifused SC-β clusters and cadaveric islets with glucose, followed by modifiers of ATP-sensitive K+ (KATP) channel activity (diazoxide and tolbutamide) and cAMP/PKA (forskolin)-mediated amplification of insulin release (Tengholm and Gylfe, 2017). Cadaveric islets respond at a similar magnitude to high glucose and the KATP channel inhibitor tolbutamide challenge separated by a return to baseline secretion with KATP channel activator diazoxide exposure as has been previously reported (Henquin et al., 2015). Further exposure to the cAMP/PKA activator forskolin increases insulin release in cadaveric islets (Figure 2A). SC-β cells exhibited a weaker response to glucose than cadaveric islets with a slight reduction in insulin release after diazoxide exposure. In contrast, tolbutamide challenge induced a large magnitude of insulin release, approaching the magnitude of secretion observed in cadaveric islets. Further potentiation of insulin secretion after forskolin exposure had a strong effect on SC-β cell insulin release, resulting in a similar magnitude of approximately 0.1% of total insulin content per minute in both cell types (Figure 2B). These results demonstrate that SC-β cell KATP channels are functional and regulate (re)polarization in a time period and magnitude similar to cadaveric islets.
Figure 2. Analysis of SC-β Cell Secretory Machinery.

(A and B) Dynamic perifusion of human cadaveric islets (A) or SC-β cells (B) with glucose (G2.8 = 2.8 mM glucose; G16.7 = 16.7 mM glucose), insulin secretion modifiers added for the durations shown above (diazoxide and tolbutamide used at 100 μM, forskolin at 10 μM). Each set of data points is a biological replicate.
(C) Uptake of fluorescent glucose analog 2-NBDG after 15-min incubation in TSQ+ cells of human cadaveric islets (above) and SC-β cells (below).
(D and E) Oxygen consumption profile of human cadaveric islets (n = 4) (D) and SC-β cells (n = 3) (E).
(F) Mitotracker Green dye uptake in human cadaveric islets (above) and SC-β cells (below).
(G and H) ATP-independent insulin secretion in dynamic perifusion of cadaveric islets (G) or SC-β cells (H).
For all experiments shown, individually labeled samples in a legend or separate colors within a graph denote a unique biological replicate within an experiment. Data are represented as mean ± SD.
Live-Cell Labeling of Zinc Content to Isolate SC-β Cells
Clusters of differentiated SC-β cells are heterogenous (Rezania et al., 2014; Pagliuca et al., 2014; Russ et al., 2015), containing a and β cells as well as other endocrine and non-endocrine cells, and might more appropriately be called SC-islets (Veres et al., 2019). To minimize this heterogeneity, we devised a method to isolate SC-β cells using zinc content-based sorting. Zinc coordinates the storage of hexameric, crystalline insulin in the secretory vesicles of β cells (Dodson and Steiner, 1998). Use of colorimetric and fluorescent zinc-binding dyes has facilitated imaging and sorting of islet β cells in human and rodents (Lukowiak et al., 2001; Burdette et al., 2003; Meeusen et al., 2011; Latif et al., 1988). The live-cell dye 6-methoxy-8-p-toluenesulfonamido-quinoline (TSQ) has an excitation/emission spectrum in the UV/violet range, allowing for combinations of other more common spectra at longer wavelengths (Meeusen et al., 2011). TSQHigh cells are observable by flow cytometry, and the size of this population reflects the total size of the insulin+ population in SC-islets (Figure S1A). Using this approach, it is possible to enrich the endocrine SC-β population from differentiations in pluripotent cell lines as well as cadaveric islets (Figure S1B) (Davis et al., 2019).
Glucose Uptake and Oxidative Phosphorylation
To investigate glucose metabolism in SC-β cells, we measured their capacity to transport glucose across the cell membrane. Using the fluorescent glucose analog 2-NBDG (Zou et al., 2005), flow-cytometric analysis of glucose uptake appears similar in the TSQHigh population of SC-β cells to that of cadaveric islets (Figure 2C). We also observed a glucose-dependent increase in oxygen consumption rate (OCR) after glucose challenge in both cadaveric islets and SC-β cells following TSQ-sorting and reaggregation (Figures 2D and 2E). However, there was a substantial difference in maximal OCR capacity after decoupling the inner mitochondrial membrane using carbonyl cyanide 4-(trifluoromethoxy) phenylhydrazone (FCCP). While cadaveric islets maintain a spare respiratory capacity sustained for more than 1 h after exposure to FCCP, SC-β cells are unable to maintain fully uncoupled OCR and rapidly lose electron transport chain activity. Quantifying ATP synthase-driven OCR (rate of OCR above ATP synthase inhibition with oligomycin A) confirmed this difference between the two β cell sources (Figure S1C). Interestingly, the comparison of mitochondrial content with both flow cytometry (MitoTracker Green FM dye) and real-time PCR from genomic and mitochondrial DNA, showed that SC-β cells contain equal or higher amounts of mitochondrial mass per cell compared to cadaveric islets (Figures 2F and S1D) (Phillips et al., 2014). These results suggest that SC-β cells contain metabolically dysfunctional mitochondria or that there is an insufficient metabolic supply to sustain the electron transport chain during glucose challenge while decoupled.
ATP-Independent Insulin Secretion Pathway
β cell release of insulin also occurs through pathways other than KATP channel-mediated depolarization. This is driven by products of glucose metabolism and is referred to as the KATP-independent pathway of insulin release (Komatsu et al., 2013). To assess this process, we perifused SC-β cells or cadaveric islets with 100 μM tolbutamide to maintain β cell depolarization in the presence of low, 2.8 mM glucose. After 20 min, glucose levels were increased in the presence of constant tolbutamide. Cadaveric islets exhibited variable but on average higher secretion of insulin after glucose challenge (Figure 2G), as metabolism of glucose further potentiates insulin release independent of KATP channel activity. In contrast, SC-β cells did not increase insulin secretion (Figure 2H) after increasing glucose levels. This supports the hypothesis that glucose metabolism is deficient in SC-β cells, as both KATP-dependent and -independent glucose-induced insulin release are diminished. Thus, the metabolism of glucose itself is the process inhibiting full GSIS in SC-β cells.
Quantification of SC-β Cell Metabolism
After demonstrating SC-β cells do not metabolize and sense glucose as well as islets, we sought to characterize glucose metabolism in SC-β cells using an unbiased approach. We utilized the recently developed mass isotopomer multi-ordinate spectral analysis (MIMOSA) technique pairing 13C glucose tracing and mass spectrometry (Alves et al., 2015) to track flux through glycolysis and the TCA cycle in stimulatory glucose conditions. This analysis allows for measuring both mass and position of labeled carbons to infer contribution from distinct metabolic pools derived from labeled glucose. Utilizing TSQ enrichment of SC-β cells as described earlier (Davis et al., 2019), reaggregates of 5,000 cells were cultured after sorting for 72 h. The resulting enriched clusters contained a majority of SC-β cells in addition to a smaller population of poly-hormonal cells. Clusters composed of more than half SC-β cells and of this total cell number/cluster are similar to the composition of unsorted cadaveric islets that were used as controls (Hart and Powers, 2019; Brissova et al., 2005) (Figure S1B). Clusters enriched to this level also resemble recent reports of purified and reaggregated differentiated cells to improve GSIS phenotypes in vitro (Nair et al., 2019; Veres et al., 2019). As previously described (Alves et al., 2015), cells were incubated in 9 mM glucose and 4 mM glutamine for 3 h in base DMEM medium to establish steady-state metabolism in a stimulatory concentration of glucose before exposure to the same medium with uniformly labeled 13C glucose (Figure 3A). Analyzing 13C accumulation as a function of atomic percent enrichment (APE), we first quantified buildup of labeled glycolytic intermediates. Accumulation of 13C in the early glycolysis-derived metabolites dihydroxyacetone phosphate, glycerol-3-phosphate, and phosphoenolpyruvate (PEP) derived from 2-phosphoglycerate (PEP M+3) occurred at similar rates over the first 15 min of exposure in cadaveric islets (n = 6) and SC-β cells (n = 6) (Figures 3B-3D).
Figure 3. MIMOSA Metabolomic Profiling of SC-β Cells.

(A) Outline of experimental protocol for metabolomic profiling using MIMOSA, starting with reaggregates of SC-β cells sorted for TSQ and propidium iodide (PI) fluorescence.
(B–D) Atomic percent enrichment (APE) of 13C in dihydroxyacetone phosphate (B), glycerol-3-phosphate (C), and phosphoenol pyruvate (PEP) (D).
(E and F) APE of malate M+3 (Purple) and PEP M+2 (Green) in cadaveric islets (E) and SC-β cells (F).
(G) Dihydroxyacetone phosphate (DHAP), glycerol-3-phosphate (G3P), and PEP pool size in cadaveric islets (purple) and SC-β clusters (green).
(H) Adjusted PEPCK-M activity to PEP metabolite pool size.
(I) Western blot for pyruvate carboxylase (PC) and PEPCK-M enzyme expression. Images from the same experiment at different exposures per blot were edited together for ease of presentation.
(J) Summary of results from MIMOSA metabolomic profiling. Metabolites in red are inferred to be decreased from MIMOSA analysis.
Statistical analysis in (G) was performed using a two-way ANOVA with Sidak’s multiple-comparisons test. Error bars represent SEM. Data are represented as mean ± SEM.
Mitochondrial Metabolism
Major differences in 13C enrichment between SC-β cells and cadaveric islets appeared in mitochondrial metabolite pools involved in anaplerosis and cataplerosis. As the TCA cycle produces NADH from pyruvate metabolism, intermediates in the cycle are also used in other mitochondrial processes and in the cytoplasm (Jensen et al., 2008). Anaplerosis is the process of “refilling” metabolites of the TCA cycle to sustain mitochondrial metabolism, maintaining a balance between their loss (cataplerosis) and replenishment to sustain oxidative phosphorylation to produce ATP. 13C accumulation in malate from anaplerotic generation of oxaloacetate (malate M+3) and phosphoenolpyruvate (PEP) derived from oxaloacetate (PEP M+2) was much slower in SC-β cells than cadaveric islets (Figures 3E and 3F). Mitochondria-derived PEP drives GSIS in the islet, and loss of its production is incompatible with successful insulin secretory responses (Kibbey et al., 2007; Stark et al., 2009; Jesinkey et al., 2019). Further examination of PEP levels in SC-β cells revealed that the total PEP metabolite pool derived from both glycolysis and oxaloacetate was also much smaller in SC-β cells than cadaveric islets (Figure 3G). Normalizing the calculated mitochondrial phosphoenolpyruvate carboxykinase (PEPCK-M) enzymatic activity to the PEP pool size reveals even lower SC-β cell PEPCK-M activity compared to cadaveric islets (Figure 3H). Low PEPCK-M flux is not due to a lack of the enzyme, as both pyruvate carboxylase (PC) and PEPCK-M are highly expressed in SC-β cells and cadaveric islets (Figure 3I). These reactions ensure sufficient TCA cycle intermediate concentrations to maintain continuous activity within mitochondria. In rodents, PEPCK-M-derived PEP provides as much as 40% of the pyruvate pool during high-glucose challenge and loss of either PEPCK-M or the GTP-specific isoform of succinyl CoA-synthetase (SCS-GTP) abrogates GSIS (Stark et al., 2009; Jesinkey et al., 2019). The lack of PEPCK-M activity observed in this experiment is incompatible with robust GSIS, as it will prevent the coupling of mitochondrial GTP production with insulin secretion. While the enzymatic components for this cycle are expressed in SC-β cells, it appears that the glucose-induced anaplerotic flux through PC that occurs during glucose challenge in the normal islet is not achieved in differentiated SC-β cells cultured in stimulatory glucose concentrations (Figure 3J) (Jesinkey et al., 2019; Alves et al., 2015; Jensen et al., 2006, 2008).
Dilution of 13C Signal in Citrate
13C label enrichment in TCA cycle metabolites in the pyruvate dehydrogenase-mediated “forward direction” was similar between SC-β cells and cadaveric islets in all pools examined except for citrate, which had a surprising and significantly lower APE than downstream metabolites in SC-β cells. This lower enrichment indicates that a large fraction of citrate was in disequilibrium throughout the cell, consistent with a citrate pool excluded from the mitochondria of SC-β cells, as we do not observe dilution of 13C label in the subsequent steps of the TCA cycle (Figure S2A). The citrate transporter (CIC) antiports mitochondrial PEP and malate in exchange for citrate in the cell (Stark et al., 2009). The observed reduction in PEP and malate replenishment could decrease exchange via the CIC, causing the abnormal citrate labeling in these experiments. Slowed or inhibited citrate metabolism might also contribute to lower metabolic flux and dampened GSIS driven by a lack of PEPCK-M activity.
TCA Cycle Metabolites as Secretagogues
PEPCK-M depends on mitochondrial GTP derived from enzyme activity of the SCS-GTP (Stark et al., 2009; Jesinkey et al., 2019). Loss of this enzyme inhibits PEPCK-M activity as GTP is no longer generated from the TCA cycle. Cell-permeable forms of metabolites that have methyl ester groups to facilitate diffusion across the membrane have been valuable tool compounds to study effects of specific metabolic intermediates on GSIS (Jain et al., 1975; Kabra et al., 2017; MacDonald, 1993). To test the effects of metabolites on insulin release, SC-β differentiations were dissociated and reaggregated for 48 h before static GSIS assays were performed in 96-well V-bottom plates. We activated PEPCK-M and PEP cycling to drive the TCA cycle by exposing SC-β cells to mono-methyl succinate (MacDonald, 1993; MacDonald and Fahien, 1990) to test whether stimulating the TCA cycle with exogenous succinate would result in PEPCK-M synthesis of PEP and induce insulin secretion. Strikingly, in contrast to high glucose, methyl-succinate exposure resulted in insulin secretion to the same levels as KCl exposure in SC-β cells and cadaveric islets (Figure 4A). We also tested SC-β response to other TCA cycle substrates including methyl-pyruvate (Kabra et al., 2017), α-ketoisocaproic acid (Heissig et al., 2005), and β-hydroxybutyrate (Figures 4B, S3A, and S3B), all of which raise matrix acetyl CoA. In all cases, we observed insulin release in both SC-β cells and cadaveric islets. On average, both α-ketoisocaproate and β-hydroxybutyrate exhibited lower secretion than high glucose in human islets. In contrast, SC-β cells exhibited lower secretion at 10 mM but very strong secretion at 20 mM levels.
Figure 4. Some Cell-Permeable Intermediates Drive Insulin Secretion in SC-β Cells.

Intermediate metabolite insulin secretion responses for cadaveric islets and SC-β cells. Cadaveric islets or differentiated SC-β cells were dissociated and reaggregated for 48–72 h before 1-h incubation in indicated conditions after a 2-h fast at 2.8 mM glucose.
(A) Mono-methyl succinate response profiles in cadaveric islets (left) and SC-β cells (right).
(B and C) Response profiles to methyl-pyruvate (B) and glyceraldehyde (C) in cadaveric islets and SC-β cells.
(D) SC-β response to glycerate.
(E) SC-β response to methyl-3-phosphoglyerate (m-3-PG).
(F) SC-β response to methyl-2-phosphoglyerate (m-2-PG).
(G) Schematic representation of metabolite effects on SC-β cell insulin secretion. Metabolites entering the TCA cycle or late glycolysis successfully induce insulin release (blue arrows). Cell-permeable metabolites of early glycolysis or glucose itself generate a much smaller magnitude of insulin release (red arrows).
Data points are individual replicate values. Colors denote separate batches of differentiated cells, treated as biological replicates. The p values were calculated using a two-way ANOVA with Dunnett’s multiple testing correction. For all experiments shown, color denotes a unique biological replicate within an experiment. Replicates within a biological group are the same color. Data are represented as mean ± SD.
A Bottleneck in Glycolysis Limits GSIS
Because robust insulin secretion is induced with all mitochondrial substrates tested, we worked forward through glycolysis to identify the earliest glucose-derived metabolite inducer of SC-β cell insulin secretion. The non-polar metabolites glyceraldehyde and dihydroxyacetone are cell-permeable fuel sources that contribute to metabolism at the steps of glyceraldehyde-3-phosphate and dihydroxyacetone phosphate, respectively (Figures 4C and S3C) (Jain et al., 1975; Juntti-Berggren et al., 2003; MacDonald and Fahien, 1990). These two intermediates are produced after the six-carbon chain of fructose 1,6-bisphosphate is cleaved into two, three-carbon chains by aldolase (Marsh and Lebherz, 1992). In both cases, we observed low insulin secretion response in SC-β cells at the same magnitude of high glucose, but full insulin secretion response in cadaveric islets at the level of KCl. These results also support our earlier observations that glucose uptake in SC-β cells is normal. As glucose is transported into SC-β cells but does not fully stimulate insulin release, bypassing the proximal metabolic steps downstream of glucokinase also does not enhance insulin secretion.
Following these results, we exposed SC-β cells and cadaveric islets to glyceric acid, the non-phosphorylated precursor to 2- and 3-phosphoglycerate and the downstream metabolite from glyceraldehyde-3-phosphate metabolism. In this condition, SC-β cells secrete insulin at the same magnitude as KCl depolarization in response to glyceric acid, identical to the response observed in cadaveric islets to glucose and other secretagogues (Figures 4D and S3D). To further validate this result, we exposed SC-β cells to methylated forms of 2- and 3-phosphoglycerate, which are cell-permeable and metabolized (Hitosugi et al., 2012). Methyl-2 and methyl-3 phosphoglycerate both stimulated insulin release at a magnitude indistinguishable from KCl challenge (Figures 4E and 4F). These results demonstrate the ability of SC-β cells to sense and respond to changes in metabolic flux and point to the metabolism of glyceraldehyde-3-phosphate as the defect, or bottleneck, preventing full GSIS in SC-β cells (Figure 4G). Because glucose is present in fasting and intermediate stimulatory conditions, we repeated these results in the absence of glucose or its presence at a stimulatory level to determine whether these intermediates require or potentiate the effects of glucose in SC-β cells (Figures S3E and S3F). For both TCA cycle stimulation using monomethyl-succinate and activation of glycolysis using methyl-3-phosphoglycerate (m-3-PG), these results were independent of glucose concentration and were not enhanced by its presence at a higher level. Finally, we tested whether the ability to stimulate full, islet-like insulin secretion with intermediate metabolites is conserved in SC-β cells derived from other pluripotent cell sources. We differentiated the 1016, non-diabetic iPS cell line using the same differentiation protocol into SC-β cells and repeated our GSIS experiments using m-3-PG and methyl-succinate (n = 4) (Figures S3G and S3H). In both cases, we observed the same magnitude of insulin release in KCl and the respective metabolite, indistinguishable from the patterns observed in hES-derived SC-β cells. These findings further support that this disconnect in glucose sensing observed in SC-β cells is conserved in genetically distinct cell lines and a fundamental characteristic of in vitro-differentiated islets.
Insulin Secretion in SC-β Cells after m-3-PG Exposure
All metabolites downstream of the GAPDH and PGK1 reactions, beginning with m-3-PG, stimulate insulin release at the level of cadaveric islet responses to those intermediate metabolites and KCl-positive controls. To determine whether SC-β cells secrete insulin in an appropriate temporal pattern after exposure to glyceric acid, we perifused SC-β cells with 10 mM glyceric acid or glyceraldehyde, the cell-permeable, unphosphorylated forms of 3-phosphoglycerate and glyceraldehyde-3-phophate, respectively (Figure 5A). Insulin secretion occurred in a bi-phasic manner with a first and second phase of insulin release after glyceric acid exposure but not glyceraldehyde. This biphasic insulin secretion at the magnitude of a KCl challenge has not been previously obtained by any other in vitro manipulation of SC-β cells (Pagliuca et al., 2014; Russ et al., 2015; Rezania et al., 2014; Nair et al., 2019; Velazco-Cruz et al., 2019). The peak of first-phase insulin release after glyceric acid challenge matched the magnitude of KCl challenge, in contrast to glyceraldehyde exposure. Quantifying insulin secreted by integrating area under the curve and normalizing to total time in low glucose and each treatment, intermediate 10 mM glyceric acid exposure achieved a much higher level of insulin release than glyceraldehyde (Figure 5B), confirming findings using static GSIS assays.
Figure 5. Metabolic Stimulation of Glycolysis Drives Physiological Insulin Secretion in SC-β Cells.

(A) Dynamic perifusion of SC-β cells with 10 mM glyceric acid (green) or 10 mM glyceraldehyde (purple). G2.8 and G16.7 refer to 2.8 and 16.7 mM glucose, respectively.
(B) Area under the curve from dynamic GSIS data in (A).
(C) Insulin secretion stimulated by m-3-PG is ablated by inhibition of ATP synthase using oligomycin A.
(D) Blocking anaplerotic pyruvate carboxylase activity using phenylacetate disrupts m-3-PG effect on insulin secretion.
(E) ATP-independent insulin secretion is also stimulated in SC-β cells using m-3-PG.
(F–I) Calcium flux in TSQ-enriched SC-β cells after high glucose (F), low glucose with 30 mM KCl (G), 100 μM tolbutamide (H), or 10 mM m-3-PG (I).
(J) Images from Fluo-4 signal during fasting (top row) and 20 s after exposure with the indicated KRB solution (bottom row). Scale bars represent 500 μm.
The p values for (B), (C), and (D) were calculated using a two-way ANOVA with Dunnett’s multiple hypothesis correction. For all experiments shown, color denotes a unique biological replicate within an experiment. Replicates within a biological group are the same color. Data are represented as mean ± SD. In (A), each labeled sample is a biological replicate from a separate differentiation.
We sought to identify mechanisms responsible for insulin release after exposure to intermediate metabolites in SC-β cells. We first demonstrated insulin secretion induced by these intermediates results from their metabolism. Inhibition of ATP synthase and production of cytoplasmic ATP/ADP flux necessary for β cell depolarization using oligomycin A was sufficient to ablate insulin secretion after m-3-PG or methyl-succinate challenge in low glucose (Figures 5C and S4A). Earlier metabolomic analysis specifically revealed a lack of glucose-stimulated anaplerotic cycling underlying the lack of GSIS in SC-β cells. To demonstrate that these intermediates achieve insulin secretion by inducing anaplerosis, we inhibited activity of pyruvate carboxylase, responsible for the same glucose-stimulated anaplerotic cycle identified as deficient in our metabolomic analysis, using phenylacetate (Bahl et al., 1997). This was sufficient to ablate the effects of both m-3-PG and methyl-succinate, further demonstrating that these intermediate substrates are metabolized and stimulate insulin secretion by rescuing defective anaplerotic cycling (Figures 5D and S4B). Previous data presented in Figure 2H suggested the lack of GSIS is partially caused by a lack of KATP-independent insulin release after glucose challenge in SC-β cells. This same experiment using m-3-PG robustly induces insulin secretion in the presence of tolbutamide, demonstrating metabolism of 3-PG produces both KATP-dependent and KATP-independent signals that drive GSIS in vitro (Figure 5E) (Komatsu et al., 2013). We also attempted to quantify the change in ATP/ADP ratios after each glucose or intermediate challenge condition. SC-islets cells were fasted for 2 h followed by a 10-min exposure to each condition, and lysates were analyzed by mass spectrometry. The ATP/ADP ratio did show an upward trend with m-3-PG exposure but was not statistically significant when measured in unsorted clusters (Figure S4C). We also demonstrated that these intermediates do not affect cell viability when dissociated SC-β cells are fasted and exposed to glucose, m-3-PG, or methyl-succinate (Figure S4D).
We next tested whether insulin secretion is accompanied by cytosolic calcium flux with exposure to m-3-PG. TSQ-sorted and reaggregated SC-β cells were immobilized on Matrigel and exposed to the live-cell cytosolic calcium indicator Fluo-4 (Kenty and Melton, 2015). Clusters were imaged for 5 min before and after challenge with 16.7 mM glucose, 30 mM KCl, 100 μM tolbutamide, or 10 mM m-3-PG (Figures 5F-5J). As expected, SC-β cells undergo a smaller calcium flux in glucose compared to that following a KCl challenge or tolbutamide challenge. In contrast, we observed a significant calcium flux after exposing SC-β cells to m-3-PG. Quantifying the area under the curve for in these experiments, the magnitude of calcium release is similar between m-3-PG and tolbutamide conditions but not high-glucose challenge (Figure S4E). Calcium fluxes propagate as a wave across SC-β clusters after m-3-PG exposure, similar to other reports using other cell-permeable intermediates that bypass early glycolysis (Dahlgren et al., 2005), suggesting SC-β clusters formed interconnected organoids after enrichment and re-aggregation. The connectivity of these reaggregates may underlie improvements in GSIS after reaggregation reported recently (Videos S1, S2, S3, and S4) (Nair et al., 2019; Veres et al., 2019).
GAPDH Activity Is Reduced in SC-β Cells
Bypassing GAPDH and PGK1 enzymatic activity in SC-β cell glycolysis results in insulin secretion at the same magnitude as the positive control KCl and that observed in cadaveric islets. This insulin secretion effect also works in part through anaplerotic cycling. To determine whether PEP levels change after exposure to m-3-PG, SC-islets were fasted in 2.8 mM glucose and subsequently exposed to low glucose, high glucose, or low glucose with 10 mM m-3-PG for 10 min before lysis. Exposure to m-3-PG robustly increased cellular PEP content (Figure 6A), both confirming that m-3-PG is metabolized in the cell and demonstrating that PEP levels are increased as physiological insulin release is stimulated. We also tested whether exposure to m-3-PG affected the cellular redox state and NAD/NADH balance. Mass spectrometry analysis of SC-islets after 10-min exposure to glucose or m-3-PG following a 2-h fast reveals a decreasing but not statistically significant trend in the total cellular NAD/NADH ratio in both high glucose and m-3-PG exposures (Figure S5A).
Figure 6. Activity of GAPDH Is Perturbed in SC-β Cells.

(A) Quantification of cellular PEP in different GSIS conditions from SC-islets.
(B) Western blot of lysates from differentiated SC-β cells and cadaveric islets for GAPDH and PGK1. These human islet lysates were from samples used in GAPDH and PGK activity assays. Each band is a separate preparation of human islets or differentiation of SC-β cells.
(C) GAPDH enzyme activity in cadaveric islets, undifferentiated human embryonic stem cells (hES), and differentiated SC-β cells.
(D) PGK activity in cadaveric islets, undifferentiated hES cells, and differentiated SC-β cells.
(E) GAPDH western blot of lysates from DSS-cross-linking in primary islets, hES cells, and differentiated SC-β cells.
(F) GSIS on GAPDH and PGK1-overexpressing SC-β cells.
(G) Model of SC-β cell inhibition of GSIS caused by decreased GAPDH activity underlying decreased PEP flux.
The p values were calculated using two-way ANOVA with Dunnett’s multiple hypothesis correction. For all experiments shown, color denotes a unique biological replicate within an experiment. Replicates within a biological group are the same color. Each data point in (C) and (D) represents a unique biological replicate for human islets (separate donors), SC-β cells (separate differentiations), and hES cells (different passages). Spaces in western blot panels indicate where images from the same experiment were edited together for ease of presentation. Data are represented as mean ± SD.
Protein levels of both GAPDH and PGK1 enzymes are comparable in SC-β cells and cadaveric islets, suggesting that inhibition of GSIS is not due to a lack of either enzyme’s abundance (Figure 6B). To measure the enzymatic activity for both GAPDH and PGK1, fresh lysates from cadaveric islets, undifferentiated hES cells, or differentiated SC-β clusters were collected and assayed for GAPDH or PGK activity. Both GAPDH (Figures 6C and S5C) and, to a lesser magnitude, PGK1 (Figures 6D and S5D) exhibited lower enzyme activity per microgram of lysate than human cadaveric islets. GAPDH functions as a tetramer composed of two dimers that loosely associate with PGK1 (Hoagland and Teller, 1969; Tomokuni et al., 2010), converting glyceraldehyde-3-phosphate to 3-phosphoglycerate through its shortlived, unstable 1,3-bisphosphoglycerate intermediate. To visualize the active GAPDH enzyme conformation in live cells, cadaveric islets, undifferentiated pluripotent stem cells (hES), and SC-β cells were briefly exposed to the cell-permeable cross-linking agent disuccinimidyl suberate (DSS), and lysates were analyzed by western blot. Islets and hES cell lysates contained similar amounts of active GAPDH multimers, which are present at much lower levels in differentiated SC-β cells (Figure 6E). Furthermore, we were able to determine that loss of this multimer occurs during pancreatic specification in our differentiation protocol (Figure S5B). Loss of GAPDH enzymatic activity has been observed in contexts of acetylation and S-nitrosylation during cell stress, although we do not detect significant levels of these post-translational modifications in GAPDH immunoprecipitated from SC-islets (Figures S5E-S5G) (Suarez et al., 2015; Jayaguru and Mohr, 2011; Sen et al., 2008; Hara et al., 2005; Mazzola and Sirover, 2003). We also attempted to detect any post-translational modifications of PGK1 but were unable to detect these marks on the protein (data not shown).
After demonstrating reduced GAPDH and slightly lower PGK1 activities, we attempted to increase GAPDH, PGK1, or both enzymes’ activities and measured GSIS in each condition. Using lentiviral overexpression of GAPDH, PGK1, or a combination of both enzymes, we achieved an infection efficiency of approximately 97% in each condition (Figure S5H). However, we did not see any shift in stimulation index after lentiviral overexpression in SC-β cells (n = 6) (Figures 6F and S5I).
We also attempted to chemically activate GAPDH and PGK using previously published small molecules. GAPDH is known to be nitrosylated and acetylated to inhibit its functional activity, although we did not see strong signal for these post-translational modifications after immunoprecipitation. We used two compounds shown to prevent inhibition of GAPDH, deprenyl hydrochloride and the inducible nitric oxide synthase inhibitor 1400W, to prevent acetylation and nitrosylation, respectively (Figures S5J and S5K) (Jia et al., 2014; Hara et al., 2006). We did not observe a change in glucose stimulation of SC-β cells in either condition. Similarly, we also tried to activate PGK activity by enhancing its ability to release ATP for more enzymatic processivity by treating cells with Terazosin (Figure S5L) and by inhibiting PTEN, which was recently reported to suppress PGK activity by reversing its autophosphorylation at tyrosine 324 (Figure S5M) (Qian et al., 2019). We did not observe any change in glucose responsiveness using Terazosin to stimulate ATP release, and observed a small but significant shift in stimulation index after bpV exposure to inhibit PTEN activity. Our ability to slightly improve insulin release by targeting these steps in glycolysis further suggests these enzyme activities are the location of the bottleneck in GSIS for SC-β cells, but that the molecular targets of these small molecules are not likely responsible for the deficient GSIS phenotype in SC-islets. It is also possible that the bottleneck at the GAPDH and PGK1 steps of glycolysis are caused by parallel metabolic processes in SC-β cells that indirectly create this blockade in glucose metabolism at the activities of GAPDH and PGK1.
Taken together, these results demonstrate that GSIS in SC-β cells is limited by the enzymatic conversion of glyceraldehyde-3-phosphate to 3-phosphoglycerate, which is catalyzed by the enzymes GAPDH and PGK1. Both enzymes, in particular GAPDH, exhibit reduced enzyme activity in SC-islet lysates compared to cadaveric islets. This decreased capacity to flux carbons from glucose through late glycolysis and the TCA cycle results in decreased mitochondrial GTP production and its subsequent stimulation of PEP cycling through PEPCK-M (Figure 6G), as was detected through metabolomic analysis, and is directly affected by exposure of SC-β cells to metabolizable substrates downstream of the GAPDH and PGK1 reactions in glycolysis. Rescue of these processes through the use of cell-permeable intermediates results in islet-like insulin secretion in both magnitude and pattern of release when the activity of GAPDH and PGK1 are made unnecessary for glucose-dependent metabolism. We do not yet know whether increased enzyme activity from GAPDH, or PGK1, or both will be sufficient to rescue glucose responsiveness in SC-β cells, but this work has pinpointed these two enzymatic steps as the disconnect between glucose uptake and glucose sensing in SC-β cells. Further analysis of how glucose metabolism changes during differentiation of pluripotent cells in vitro and how metabolism of these cells changes as transplanted SC-β cells undergo in vivo functional maturation will shed light on how early and late glycolysis are disconnected in differentiated SC-β cells in vitro. In summary, this report demonstrates a bottleneck in glycolysis mutes the GSIS response of SC-β cells in vitro—a deficiency correlated with decreased enzyme activities of GAPDH, and to a smaller degree, PGK1. Treating differentiated SC-β cells with metabolized, cell-permeable intermediates that skip these enzymatic steps in glycolysis results in islet-like insulin secretion and acts through the same mechanisms that underlie glucose sensing in functional islets. Determining the cause of this inhibition and how to couple early glycolysis to PEP flux in vitro should generate SC-β cells with a GSIS profile indistinguishable from human cadaveric islets.
DISCUSSION
Insulin secretory capacity is an essential characteristic of the islet. While nearly all reports of insulin-producing cells differentiated from human pluripotent stem cells in vitro have measured this phenomenon, their glucose sensing and regulation of insulin secretion have not achieved the magnitude or patterns of release observed with human cadaveric islets in vitro. We demonstrate here that the insulin secretion capacity of SC-β cells is very similar to healthy cadaveric islets in their ability to regulate de- and re-polarization of the cell membrane and secrete more than 10% of their insulin content over 60 min after direct depolarization with KCl or by manipulating their KATP channel activity. These results suggest that the muted ability of SC-β cells to secrete insulin in response to glucose is a metabolic failure, not a defect in secretory machinery. Furthermore, maximal insulin release after challenge with metabolic intermediates in both cadaveric islets and SC-β cells occurs at a similar magnitude to KCl response.
Recent publications on stem cell-derived β cells have sought to understand how changes in culture or differentiation factors affect the GSIS phenotype in vitro (Velazco-Cruz et al., 2019; Nair et al., 2019; Ghazizadeh et al., 2017; Yoshihara et al., 2016). Some experiments pointed to mitochondrial activity as a component of improved in vitro function (Nair et al., 2019), but to date a direct mechanism for improved function has remained elusive. Our approach to investigate glucose-driven metabolic flux in SC-β cells and cadaveric islets revealed a lack of PEPCK-M activity in differentiated stem cells. While TCA cycle metabolism is stimulated during glucose challenge, anaplerotic cycling through PC in the mitochondria is a more robustly activated metabolic response to glucose challenge in the islet (Jesinkey et al., 2019; Alves et al., 2015; Jensen et al., 2008). In the SC-β cell, slow glycolytic flux appears to limit downstream PEPCK-M-facilitated GSIS and can be rescued by using cell-permeable metabolites. The slowed PEPCK-M activity prevents a necessary mitochondrial GTP sensing mechanism from coupling increased glucose metabolism to PEP cycling—a process that has recently been described as an obligate component of β cell glucose responsiveness (Stark and Kibbey, 2014; Stark et al., 2009; Kibbey et al., 2007). An increased cytosolic ATP/ADP ratio, derived from oxidative phosphorylation in mitochondria under high-glucose conditions is a major driver of depolarization and insulin release, and this flux is necessary for glucose responsiveness as loss of mitochondrial activity abrogates GSIS in the islet as well as cell-permeable intermediate-induced insulin release in SC-β cells. The present findings remind us that other signals derived from the mitochondria can play a role in the GSIS mechanism and warrant attention as we study and fine-tune SC-β cells with the aim of obtaining the most functionally mature cells possible by directed differentiation of pluripotent stem cells.
Other glycolytic enzymes including fructose 1,6-bisphosphatase and hexokinase are more commonly regarded as major regulators of the rate of cytoplasmic metabolism (Lenzen, 2014). However, bypassing these regulatory steps in glycolysis of SC-β cells does not result in robust insulin release. GAPDH does represent a potential regulator of glycolysis, as its activity is regulated by NAD+ availability and its activity provides substrate for the first ATP-generating step of glycolysis (White and Garcin, 2017; Zhang et al., 2015). The islet β cell has unique metabolic properties, downregulating enzymes nearly ubiquitously expressed in other tissues and expressing glycolytic enzymes that play a regulatory role absent in other tissues (Lemaire et al., 2016; Pullen et al., 2010). Glucokinase in the β cell has an uncharacteristically high KM and is uninhibited by rises in cytosolic glucose-6-phosphate (Sener et al., 1986; Meglasson and Matschinsky, 1984). Islets also exhibit increased expression of glucose-6-phosphatase (G6PC2), which further regulates the first glycolytic intermediate pool of the β cell (Hutton and O’Brien, 2009), glucose 6-phosphate. It appears that GAPDH or PGK may play a limiting role in SC-β cell glucose metabolism and sensing, or that activity of these enzymes are indirectly inhibited due to an abnormal metabolic state in glycolysis, which ultimately prevents glucose-induced anaplerotic flux in differentiated SC-β cells in vitro. The magnitude of reduced GAPDH activity observed in cell lysates from SC-β cells, compared with human islets or undifferentiated hES cells, may not be low enough to prevent glycolytic flux and GSIS alone, as GAPDH has high enzymatic capacity. However, this may be due to conditions of the in vitro assay providing unlimited substrate or relieving a protein-protein interaction suppressing GAPDH activity within the SC-β cell. Whether this bottleneck in glucose metabolism is a unique characteristic of in vitro-differentiated human SC-islets or reflects GAPDH and PGK1 regulation in the bona fide β cell remains to be determined.
This study was able to analyze metabolism of glucose in differentiated SC-β cells, identifying suppressed generation of PEP within the mitochondria as a consequence of a glycolytic deficiency. We were further able to pinpoint the disconnect between early and late glycolysis in SC-β cell glucose response and demonstrated bypassing this bottleneck in glycolysis results in dramatic increases in intracellular PEP, accompanying a mature islet-like insulin secretion profile. This ability to induce insulin secretion is conserved across both hES and iPS-derived SC-β cells and appears to be a general characteristic of differentiated SC-islets. At the location of this metabolic disconnect between late and early glycolysis are the reactions of GAPDH and PGK1. We were also able to detect reduced GAPDH activity in differentiated SC-β cells. However, we were unable to rescue this enzyme’s activity to confer islet-like glucose responsiveness in SC-β cells. It remains unknown whether this defect is caused by a post-translational modification we were unable to detect with proteomic analysis or whether this defect is caused by another metabolic imbalance within the SC-β cell that indirectly prevents enzymatic conversion of glyceraldehyde-3-phosphate to 3-phosphoglycerate. Further studies will be required to determine which of these possibilities is responsible for the lack of glucose responsiveness in SC-β cells. Toward the goal of producing a fully islet-like glucose response in vitro from differentiated SC-β cells, we have identified the location of the major block in glucose metabolism and sensing in differentiated islets and identified other fuel sources that can be used to stimulate metabolism-driven insulin release in SC-β cells that act through the same pathways that facilitate GSIS, which will be useful for the SC-β community.
SC-β cells also appear to metabolize α-ketoisocaproate and β-hydroxybutyrate at a higher level than islets, as they are able to stimulate insulin release at high concentrations in non-stimulatory glucose concentrations, whereas functionally mature islets do not (MacDonald, 2007). This may be related to the decreased glycolytic flux we have observed if basal metabolism is adapted to sustain normal cellular function in the presence of this decoupling of early and late glycolysis. This difference from human islet physiology may be reconciled when protocols to differentiate fully glucose-responsive SC-β cells are developed. SC-β cell in vitro physiology is important if these cells are to be effectively used in screens for insulinotropic factors or compounds to stimulate β cell proliferation, as glucose plays central roles in both processes (Bonner-Weir et al., 1989). Our findings suggest that metabolic intermediates can recapitulate some aspects of β cell physiology and could be used with current protocols to simulate glucose-induced proliferation, glucotoxicity, or insulin secretion toward discovery of new anti-diabetes therapies.
Bypassing GAPDH and PGK activity with cell-permeable metabolites results in robust, bi-phasic insulin release, which has not been previously observed in SC-β cells. In contrast, other previously published glycolytic intermediates, immediately upstream of these activities, do not improve the magnitude of insulin released over that observed with glucose challenge. The magnitude and fold-change of insulin secretion in both the first and second phases of release equals that of a KCl challenge. SC-β cells have the capacity to sense metabolic flux in a nutrient-rich environment, but their GSIS phenotype is limited by a bottleneck in glucose metabolism, which is not yet mature in vitro but may be corrected in vivo, as SC-β GSIS profiles improve over time after transplantation into mice (Robert et al., 2018; Motté et al., 2014). How this bottleneck forms during in vitro differentiation and its mechanism are questions that still remain. Determining the molecular nature of this glycolytic disconnect and appropriately coupling early and late glycolysis in the SC-β cell to stimulate PEPCK-M cycling in high glucose will significantly advance the field toward production of functionally mature SC-β cells, indistinguishable from bona fide human islets, for disease modeling and cell therapies for diabetic patients.
STAR★METHODS
RESOURCE AVAILABILITY
Lead Contact
Further information and requests for resources and reagents should be directed to and will be fulfilled by the Lead Contact, Douglas A. Melton (dmelton@harvard.edu).
Materials Availability
This study did not generate any unique reagents. When appropriate, details and source information to synthesize non-commercially available intermediate chemicals are provided and original literature source cited. The corresponding author can be contacted for further details.
Data and Code Availability
Underlying data and modeling of mass spectra in C-Wave are available upon request from the corresponding author.
EXPERIMENTAL MODEL AND SUBJECT DETAILS
Human Embryonic Stem Cell and Induced Pluripotent Stem Cell Lines
Pluripotent stem cell lines were used in accordance with approval by Harvard University’s Embryonic Stem Cell Research Oversight (ESCRO) committee. HUES8 is a male human embryonic stem cell line derived at Harvard University in the Melton Laboratory. 1016 is a male induced pluripotent stem cell (iPSC) line derived at Columbia University. Both lines were maintained in 3-dimensional suspension cultures and regularly karyotyped.
Cadaveric Donor Islets
Islets for study were purchased from Prodo Laboratories, NDRI, and the University of Miami. All islets were isolated from healthy donors at the time of death and used within 7 days of shipment. All islet studies were performed in accordance with IRB approved procedures at Harvard University under protocol IRB16-0013. For all studies, replicates of human islets represent separately procured and tested human cadaveric islet batches. For more information on islet preparations used, see Table S1.
METHOD DETAILS
Culture and Passage of Pluripotent Stem Cells
Pluripotent stem cell lines were cultured in mTeSR 1® media. Both planar and suspension cultures were fed with fresh medium every 24 hours. After dissociation with TriplE trypsin or Accutase for planar or suspension cultures, respectively, cells were re-plated using a 1:1000 dilution of Rho Kinase inhibitor Y27632 for the first 24 hours-post split to maintain cell survival. Planar cultures were maintained on tissue culture plates pre-coated using maintenance Matrigel from Stem Cell Technologies previously described (Pagliuca et al., 2014). After dissociation cells were counted using a Vi-cell automated cell counter and plated at a density of 65,000 cells per cm2. Suspension maintenance lines were dissociated and re-seeded every 72 hours at a concentration of 0.5 million cells per mL and planar cells were dissociated and re-plated every 72-96 hours depending on survival and confluency at the time of passage.
Differentiation of SC-β Cells
Differentiation of SC-β cells were accomplished using the protocol previously published (Pagliuca et al., 2014) with the following adjustments. Suspension cultures were differentiated 48- or 72-hours post-seeding once clusters achieved an average diameter or approximately 200 μm. Stage 2 induction of foregut endoderm was carried out for 48 hours rather than 72 hours. Stage 3 induction was performed in the absence of the BMP inhibitor LDN, and stage 4 differentiations were performed including 1:1000 dilutions of Rho Kinase inhibitor to improve cell survival and cluster integrity as well as a 1:2000 dilution of Activin A. Finally, stage 6 clusters were either maintained in CMRLS + 10% FBS as previously described, or in a simpler MCDB131-based medium used in stages 3 and 4 of the differentiation protocol. CMRLS was used when comparing metabolism of SC-β cells and cadaveric islets for consistency in culture medium used. For other GSIS-based experiments S3 base medium was used.
Use of Fluorescent Zinc Dyes
SC-β cells were sorted using TSQ live cell dye purchased from ENZO life sciences. TSQ was resuspended at a concentration of 25 mg / mL in DMSO and diluted at 1:2000 in PBS or FACS buffer before analysis by flow cytometry. Analysis when sorting or on the LSR II was performed using an ultraviolet light source. Use of TSQ with the Fortessa or Attune NxT was performed using the violet channel.
FACS Isolation of SC-β Cells
SC-β cells were dissociated and resuspended in FACS buffer containing 2% Hyclone FBS, 0.5% BSA, 25 μM EDTA, and 1:1000 dilution of Rho Kinase inhibitor filtered with a 0.4 μM sterile filter. After resuspension and addition of TSQ and Propidium Iodide (1:100) cells were kept on ice and sorted using either the FACSARIA III, MoFlo XDP, or MoFlo Astrios in the Harvard Bauer Flow Cytometry Core. After enrichment of SC-β cells samples were spun down at 350 rcf. and used for their downstream applications as described elsewhere.
Oxygen Consumption Rate Assays
Oxygen consumption was measured using the Seahorse XFe24 analyzer with islet capture microplates. Plates were prepared as described by the manufacturer with sensors calibrated overnight in XF calibration buffer at 37 degrees in atmospheric conditions without CO2 supplementation. Approximately 40 human islets or SC-β cluster reaggregates were assayed for oxygen consumption rate in each well of an islet capture plate. Each biological replicate had at least four technical replicates which were averaged for presentation of oxygen consumption rate. Islet material was allowed to recover for up to 96 hours after reaggregation or shipping for human islets. Basal Seahorse XF Medium contained 2.8 mM glucose and 1% Hyclone FBS. Each experiment was run with a 2 minute mix, 2 minute wait, and 5 minute measurement period for all data points collected. All data was normalized to a sample of islets or clusters collected while plates were prepared and lysed for BCA protein content analysis.
Static GSIS Assays
Stage 6 cells were dissociated using accutase and triturated before quenching in S3 medium. After resuspension in basal medium with a 1:1000 dilution of Rho Kinase inhibitor cells were counted and resuspended at a concentration of 50,000 cells per mL. Using a multichannel pipette and trough, 96-well V-bottom low attachment plates were filled with 100 μL per well of cell suspension and spun at 230 rcf. for 5 minutes in plates. Clusters were allowed to re-aggregate for at least 48 hours and fed at 48-hour intervals after reaggregation. Medium was aspirated using a 12-well aspirating manifold after spinning re-aggregates to the bottom of each well. Fresh Kreb’s Ringer Buffer was prepared for each experiment from salts to improve consistency of results. Plates were spun down and cells were washed twice in low, 2.8 mM Glucose KRB. Plates were allowed to fast for 120 minutes at 37 degrees in 2.8 mM glucose KRB followed by another wash step and replacement of KRB with low, high, KCl, or other treatments in KRB as described per experiment. Plates were spun, incubated for 1 hour at 37 degrees in a 5% CO2 incubator, re-spun and the top 70 μL of supernatant collected and some representative wells were lysed in 100μL of RIPA to calculate total insulin content per cell. Supernatant was re-spun in 96 well PCR plates at 350 rcf. and the top 50 μL of supernatant was collected and frozen at −20 degrees until analysis. For all experiments provided, SC-β samples refer to distinct, individually differentiated samples of SC-β cells. The same sample was never used twice for a single experiment or used on separate days for the same data analysis. In all experiments, the value, n, refers to biological replicates of separate human islet donors or SC-β differentiations.
Dynamic GSIS Perifusion Assays
KRB was prepared the same as described above. Clusters were allowed to fast in low, 2.8 mM glucose for 2 hours followed by loading into dynamic perifusion chambers as described previously (Bentsi-Barnes et al., 2011) in the BioRep perifusion instrument. After cell loading, low glucose KRB was flowed over chambers for 30 minutes at a rate of 100 μL per minute to allow clusters to adjust to the change in flow pressure. Supernatant was then collected and frozen at −20 degrees before analysis. Total insulin content was calculated by lysing the same volume of clusters and running a 1:1000 dilution of this lysate alongside perifusion samples at the time of ELISA assay. In dynamic perifusion experiments, approximately 20 islets or SC-β clusters were measured for each technical replicate, of which three were performed per biological replicate. Human islets or SC-β 1/2/3 refers to human islet donor or SC-β differentiation number 1/2/3 for which each data point is the average of 3 technical replicates each consisting of approximately 20 islets or differentiated clusters.
Insulin ELISAs
Insulin samples were stored as previously described before thawing at room temperature on the day of analysis. Samples were loaded into either the Alpco human insulin ELISA for in vitro GSIS analysis or ultrasensitive human insulin ELISAs for in vivo maturation GSIS samples as described in the manufacturer’s protocol. After developing ELISA plates and stopping the reaction, absorbance was read at 450 nm and 605 nm for sample and background absorbance, respectively. Lysed insulin content samples were also run at a 1:100 dilution in RIPA buffer simultaneously. Each plate run contained its own standard set for internal control. For dynamic perifusion assays samples were serially diluted for an appropriate absorbance value.
Quantification of Mitochondrial Content
Mitochondrial mtDNA content was analyzed using Real Time PCR and primers as previously described (Phillips et al., 2014). Primers were custom-ordered through Thermo Fisher using the same sequences. Mitochondrial mass was also measured using MitoTracker Green as a measure of total mass. After incubation in MitoTracker Green as described by the manufacturer in suspension, cells were washed and analyzed by flow cytometry. Genomic DNA was extracted using the DNEasy Blood and Tissue DNA isolation kit by QIAGEN.
MIMOSA 13C Tracing
SC-β clusters were enriched using TSQ-based sorting and reaggregation. After reaggregation cells were washed and incubated in simple DMEM medium (D5030, Sigma-Aldrich) created from powder on the day of analysis using 4 mM Glutamine and 9 mM Glucose as previously described (Alves et al., 2015). After allowing clusters to reach steady state metabolism for 3 hours, clusters were treated with uniformly labeled 13C glucose (Cambridge Isotope Laboratories) for 0-180 minutes followed by lysis in quench buffer described by Alves et al. After quenching, samples were frozen on dry ice and shipped overnight to Yale University for Mass Spectrometric analysis. Analysis was carried out using electrospray into an ABSCIEX 5500 QTRAP with SelexION differential mobility separation using the same settings in multiple reaction monitoring in negative mode as previously described (Alves et al., 2015). Values were generated as a function of signal enrichment and described at Atomic Percent Enrichment (APE). Final values were calculated at Yale University by TA using Wave software and using the same standards for labeled intermediates as described in Alves et al. (2015).
Western Blot
Protein samples were collected in RIPA buffer containing Protease and Phosphatase inhibitors. After lysis samples were quantified using Pierce BCA Rapid Gold Protein Assay. After calculation samples were diluted to a mass of 5 ug protein and combined with Pierce loading buffer and reducing reagent. After boiling for 10 minutes samples were run using BioRad AnyKD gels and transferred onto nitrocellulose membranes. Membranes were blocked for 30 minutes in 3% BCA in TBST and primary antibodies were incubated overnight in 0.1% BCA in TBST according to manufacturer suggested primary antibody dilutions. HRP-conjugated secondary antibodies were incubated at a 1:10,000 dilution and developed either on film or in the BioRad ChemiDoc instrument.
Intermediate Metabolite Treatment
Intermediate metabolite GSIS assays were performed as described above, using low glucose basal KRB solution and supplemented with 5, 10, and 20 mM metabolite mixture. Metabolites were measured as powder and added to KRB.
Generation of m-2-PG and m-3-PG
Generation of methylated 2-PG and 3-PG was achieved using the same protocol described previously (Hitosugi et al., 2012). Samples were added as salt to HCl in methanol and mixed at room temperature. Samples were then dried, resulting in a white solid which was weighed and used for experiments described in the manuscript. Resulting compounds were confirmed using nuclear magnetic resonance. These samples were kept at 4 degrees when not in use.
Calcium Flux Imaging
TSQ-sorted clusters were plated in maintenance Matrigel as described previously. Fluorescence was quantified using the Axiozoom V16 instrument in the Harvard Center for Biological Imaging. Image analysis was performed in ImageJ after collection and generation of image files in ZEN software. Clusters were allowed to fast for 2 hours before dye incorporation. Clusters were then washed 3 times and maintained in low glucose KRB until replacement with KRB with indicated additions. All images were collected using 50 mSec exposure times. Images were then separated into individual channels and the green channel of each set of clusters was concatenated as pre- and post-treatment in a single file. Images were normalized based on intensity to 0-150 using ImageJ software and converted into .AVI files shown in the supplemental material. Regions of interest (3 per cluster) were drawn and measured for each frame of the experiment. Image intensity values per ROI were then normalized to the average intensity during fasting conditions and quantified as a ratio over the average fasting ROI intensity normalized to area and background without cells for each individual sample. Data were then graphed in Prism software and the area under the curve for each condition was calculated and used to determine statistical differences in Fluo-4 intensity during each treatment.
Immunoprecipitation
Clusters were lysed in Pierce IP Lysis buffer containing HALT protease/phosphatase inhibitor cocktail dilution at 1:100. After quantifying protein concentration 500 μg of lysate was incubated in primary antibody overnight at 4 degrees according to manufacturer recommended antibody dilutions. After overnight incubation Protein G Dynabeads were washed in IP Lysis buffer and incubated with shaking for 1 hour at 4 degrees. After incubation beads were washed in IP Lysis buffer and protein was eluted from beads using boiling in SDS-Urea buffer. Samples were evenly diluted and run in western blot without quantification but normalized using H+L bands.
Mass Spectrometry Analysis of Post-translational Modifications
After immunoprecipitation and confirmation via western blot, SDS-PAGE gels were run and expected bands for GAPDH and PGK1 were cut out from the gel without stain. After bands were cut from the gels, the samples were washed in 50% acetonitrile for 2 hours at room temperature to dehydrate samples. Gel blocks were then stored at 4 degrees until analysis by the Bauer Proteomics Core at Harvard.
Live Cell Protein Cross-linking
Live cells were crosslinked using the cell-permeable DSS compound from Thermo Fisher. Cells were incubated in PBS with 5mM DSS compound for 30 minutes. The reaction was quenched by addition of 1M Tris-HCl. Clusters were spun down and quenched using RIPA. Protein concentration was determined as described for western blots above and bands for monomer and multimers were cut apart in the membrane and developed separately for improved clarity.
GAPDH Activity Assays
GAPDH activity was determined using the Abcam GAPDH colorimetric assay kit (ab204732). Lysates were collected in the provided buffer on ice and quantified by BCA assay. 5 μg of lysate was then loaded into each reaction in a 96 well plate including background wells numbering three and one, respectively. Background reactions excluded glyceraldehyde-3-phosphate substrate for the GAPDH reaction. This assay monitors the conversion of the substrate glyceraldehyde-3-phosphate to 1,3-bisphosphoglycerate and NADH. NADH generated from GAPDH activity present in cell lysates is coupled to a proprietary developer with the kit in each reaction mix, using NADH generated by GAPDH to drive a second colorimetric reaction in each well. After addition of reaction mix, the plate was incubated at 37 degrees for the duration of the assay. The assay was maintained at pH 7.2 as per manufacturer instructions. Each well was scanned every 30 s, and in all experiments at least one replicate of SC-islets, human islets, and undifferentiated human embryonic stem cells were included for comparison, totaling approximately 16 reactions plus NADH standards in duplicate. Accumulation of NADH was indirectly monitored at 450 nm to detect the developer reaction product in kinetic mode for 15 minutes. After normalization to background, the change in NADH over time was calculated using the first two time points collected from each experiment, normalized to change in time and protein loaded. Data shown of the raw conversion values are the first 10 time points of the reaction.
PGK Activity Assay
PGK activity was determined using the BioVision PGK activity assay (K194) Cell lysates were collected on ice using the provided lysis buffer and quantified by BCA assay. 5 μg of lysate was loaded into each reaction in the provided 96 well plates. Each sample was read in triplicate with a single background reaction omitting the PGK substrate, 3-phosphoglyceric acid. This reaction converts 3-phosphoglycerate and ATP to ADP and 1,3-Bisphosphoglycerate. This reaction is coupled to a second, proprietary “developer” reaction to consume NADH included within the reaction. As with GAPDH activity assays, each experiment contained at least one biological replicate of each cell type for human cadaveric islets, SC-islets, and undifferentiated human embryonic stem cells. NADH consumption was monitored using kinetic reading mode on a FluoStar optima plate reader at 340 nm every 30 s at room temperature. Consumption of NADH was calculated using provided NADH standards after normalizing each set of reactions to the matched background control sample. For the activity assay reported the first two time points were used to quantify PGK activity. Data shown are the first ten data points of the NADH consumed in this reaction.
Mass Spectrometry Quantification of NAD/NADH and ATP/ADP Ratios
SC-islets were fasted in 2.8 mM glucose KRB for 2 hours followed by exposure to low glucose (2.8 mM glucose), high glucose (16.7 mM), or low glucose with 5 mM m-3-PG. Clusters of cells were then snap-frozen on dry ice and lysed in 75% Ethanol and 2.5 mM HEPES (pH 7.1) extraction buffer containing 1.33 μM labeled ATP (Cambridge Isotope Laboratories DLM-8922-CA-20) internal standard, for 10 minutes at 80°C with vortexing. Lysates were centrifuged at max speed for 10 minutes at 4°C and the aqueous fraction was dried and resuspended in 1% acetic acid in water, pH 9 to preserve NAD redox state.
Lentiviral Overexpression of GAPDH and PGK1
All overexpression plasmids were purchased from Origene as frozen plasmids, all derived from the parental pLenti-C-Myc-DDK backbone (RC202309L1). 293T cells were plated in Poly-L-Lysine-coated 15 cm2 dishes and lipofected using Trans-IT 293 reagent (Mirus) and supernatant was collected after 72 hours. Supernatant was concentrated using Lenti-X concentrator (Takara) and presence of viral particles were confirmed using Lenti Go-Stix (Takara). Lentivirus was then resuspended in S3 medium and cells were exposed overnight at 37 degrees in a 5% CO2 incubator followed by washing in fresh medium every 24 hours for 3 days, followed by dissociation and reaggregation as described for static GSIS and insulin release analyzed as described above.
QUANTIFICATION AND STATISTICAL ANALYSIS
Statistical analyses are described in detail where reported. Statistical analyses were carried out using Graphpad Prism software. Statistical assays were performed as described in each figure legend. Any outlier values in GSIS data were identified using Dixon’s Q test and excluded if the Q test values exceeded a 95% confidence interval. n represents number of biological replicates in all cases where reported. Biological replicates refer to unique donor-derived batches of human islets or unique differentiations of SC-islets produced from unique suspension cultures.
Supplementary Material
KEY RESOURCES TABLE
| REAGENT or RESOURCE | SOURCE | IDENTIFIER |
|---|---|---|
| Antibodies | ||
| Rat anti-C-peptide | Developmental Studies Hybridoma Bank at the University of Iowa | GN-ID4; RRID:AB_2255626 |
| Mouse anti-NKX6.1 | Developmental Studies Hybridoma Bank at the University of Iowa | F55A12; RRID:AB_532379 |
| Rabbit anti-Beta Tubulin | Cell Signaling Technology | 2128; RRID:AB_823664 |
| Mouse anti-PGK1/2 | Santa Cruz Biotechnology | SC-48342; RRID:AB_628116 |
| Rabbit anti-GAPDH | Cell Signaling Technology | 5174; RRID:AB_10622025 |
| Rabbit anti-PC | Sigma Aldrich | HPA043922; RRID:AB_2678732 |
| Rabbit anti-PCK2 | Cell Signaling Technology | 8565; RRID:AB_11217628 |
| Biological Samples | ||
| Human Cadaveric Islets | See Table S1 | N/A |
| Chemicals, Peptides, and Recombinant Proteins | ||
| Phenylacetate | Sigma Aldrich | P16621 |
| Tris-HCl pH 8.5 | VWR | 100219-630 |
| Disposable spinner flasks | Corning | CLS3578 |
| mTeSR basal medium | StemCell Technologies, Inc. | 85850 |
| MCDB131 Basal Medium | Sigma Aldrich | M8537 |
| Fetal Bovine Serum | Life Technologies | 16000044 |
| Fluo-4 | Life Technologies | F14217 |
| Oligomycin A | Fisher Scientific | 49545510MG |
| Disuccinyl Suberate | Life Technologies | 4449754 |
| U-13C Glucose | Cambridge Isotope Laboratories | CLM-1396-0.25 |
| L-Glutamine | Sigma Aldrich | G3126 |
| TSQ | Fisher Scientific | 50850395 |
| Propidium Iodide | Sigma Aldrich | P4864 |
| Sodium Fluoride | Sigma Aldrich | 919 |
| 96 well V-bottom plates | Fisher Scientific | 12565460 |
| methyl Succinate | Sigma Aldrich | P4241-50EA |
| Methyl-pyruvate | VWR | AAA13966 |
| Glyceraldehyde | Sigma Aldrich | 49800 |
| Glyceric Acid | Santa Cruz Biotechnology | SC-234508 |
| Dihydroxyacetone | Santa Cruz Biotechnology | SC499029 |
| B-hydroxybutyrate | Sigma Aldrich | 166898 |
| Ketoisocaproate | VWR | AAH60076-03 |
| D-3-Phosphoglyceric Acid | Santa Cruz Biotechnology | SC-214793B |
| D-2-Phosphoglyceric Acid | Sigma Aldrich | 79470 |
| Tolbutamide | Sigma Aldrich | T0891 |
| Diazoxide | Sigma Aldrich | D9035 |
| Forskolin | Fisher Scientific | NC9084630 |
| MitoTracker Green FM | Life Technologies | M7514 |
| RIPA Lysis Buffer | Fisher Scientific | P189901 |
| Glucose | Sigma Aldrich | G7021 |
| Potassium Chloride | Sigma Aldrich | P9541 |
| Sodium Chloride | Sigma Aldrich | S3014 |
| Calcium Chloride | Sigma Aldrich | C7902 |
| Magnesium Sulfate | Sigma Aldrich | M7506 |
| Sodium Phosphate, Dibasic | Sigma Aldrich | S3264 |
| Potassium Phosphate, Monobasic | Sigma Aldrich | P9791 |
| Sodium Bicarbonate | Sigma Aldrich | S5761 |
| HEPES Buffer | Life Technologies | 15630080 |
| Dynabeads Protein G | Life Technologies | 10003D |
| Bovine Serume Albumin, Fatty acid-free, Fraction V | EMD Millipore | 126575 |
| 2-NBDG | Life Technologies | N13195 |
| Critical Commercial Assays | ||
| Seahorse 24 Xf Mito Fuel Stress Test | Agilent | 103015-100 |
| Seahorse 24 well islet capture plate | Agilent | 101122-100 |
| PGK1 Activity Assay | Biovision | K194 |
| GAPDH enzyme activity assay | Abcam | ab204732 |
| PEP colorimetric Assay | Sigma Aldrich | MAK102-1KT |
| Alpco Human Insulin ELISA | APCO Diagnostics | 80-INSHUU-E10.1 |
| Experimental Models: Cell Lines | ||
| HUES8 hES | Derived In-house | N/A |
| 1016 iPS | Columbia University | N/A |
| Oligonucleotides | ||
| B2M Forward: GCTGGGTAGCTCTAAACAATGTATTCA | This Paper adapted from Phillips et al., 2014 | N/A |
| B2M Reverse: CCATGTACTAACAAATGTCTAAAATGGT | This Paper adapted from Phillips et al., 2014 | N/A |
| B2M FAM Probe: CAGCAGCCTATTCTGC | This Paper adapted from Phillips et al., 2014 | N/A |
| mtMajArc Forward: CTGTTCCCCAACCTTTTCCT | This Paper adapted from Phillips et al., 2014 | N/A |
| mtMajArc Reverse: CCATGATTGTGAGGGGTAGG | This Paper adapted from Phillips et al., 2014 | N/A |
| mtMajArc FAM Probe: GACCCCCTAACAACCCCC | This Paper adapted from Phillips et al., 2014 | N/A |
| mtMinArc Forward: CTAAATAGCCCACACGTTCCC | This Paper adapted from Phillips et al., 2014 | N/A |
| mtMinArc Reverse: AGAGCTCCCGTGAGTGGTTA | This Paper adapted from Phillips et al., 2014 | N/A |
| mtMinArc FAM Probe: CATCACGATGGATCACAGGT | This Paper adapted from Phillips et al., 2014 | N/A |
| Recombinant DNA | ||
| Empty Myc-DDK Lentivirus Plasmid | Origene | PS100064;http://www.origene.com/catalog/vectors/lentiviral-gene-expression-vectors/ps100064/plenti-c-myc-ddk-lentiviral-gene-expression-vector |
| GAPDH Myc-DDK Lentivirus Plasmid | Origene | RC202309L1; https://www.origene.com/cDNA_clone/LentiORF/NM_002046/RC202309L1V/GAPDH.aspx |
| PGK1 Myc-DDK Lentivirus Plasmid | Origene | RC211172L1 |
| Software and Algorithms | ||
| Prism | Graphpad | N/A |
| Wave | Agilent | N/A |
| Zen | Zeiss | N/A |
| ImageJ | National Institutes of Health | https://imagej.nih.gov/ij/ |
| Flowjo | Becton, Dickinson and Company | N/A |
| Other | ||
| AxioZoom 16 | N/A | |
| BioRep Dynamic Perifusion System | N/A | |
| Seahorse XFe 24 well Analyzer | N/A | |
Highlights.
Glucose-stimulated insulin secretion (GSIS) in SC-β cells is deficient in vitro
This deficiency is caused by a lack of anaplerotic cycling in high glucose
Metabolites from late glycolysis rescue anaplerotic cycling and insulin secretion
This bottleneck correlates with reduced GAPDH activity in SC-β cells in vitro
ACKNOWLEDGMENTS
The authors would like to thank Can Kayatekin, José Rivera-Feliciano, Nadav Sharon, Nils Bergenhem, and Stephanie Tsai for helpful discussion and advice for this work. A special thanks to Gerald Shulman for his suggestions and introductions as well as Susan Bonner-Weir and Gordon Weir for advice and sharing expertise. This work was supported by grants from the National Institutes of Health and the National Institute of Diabetes and Digestive and Kidney Diseases: UC4 DK104159 and UC4 DK104165. We would also like to acknowledge the Harvard Center for Biological Imaging, The Mass Spectrometry and Proteomics Resource Laboratory, and the Bauer Flow Cytometry Core for use of resources and expertise in calcium imaging, post-translational modification analysis, and live-cell sorting, respectively.
Footnotes
SUPPLEMENTAL INFORMATION
Supplemental Information can be found online at https://doi.org/10.1016/j.celrep.2020.107623.
DECLARATION OF INTERESTS
D.A.M. is the scientific founder of and an adviser for Semma Therapeutics and serves on the board of directors (BOD) of Blue Bird Bio.
REFERENCES
- Alves TC, Pongratz RL, Zhao X, Yarborough O, Sereda S, Shirihai O, Cline GW, Mason G, and Kibbey RG (2015). Integrated, step-wise, mass-isotopomeric flux analysis of the TCA cycle. Cell Metab. 22, 936–947. [DOI] [PMC free article] [PubMed] [Google Scholar]
- Atkinson MA, Eisenbarth GS, and Michels AW (2014). Type 1 diabetes. Lancet 383, 69–82. [DOI] [PMC free article] [PubMed] [Google Scholar]
- Bahl JJ, Matsuda M, DeFronzo RA, and Bressler R (1997). In vitro and in vivo suppression of gluconeogenesis by inhibition of pyruvate carboxylase. Biochem. Pharmacol 53, 67–74. [DOI] [PubMed] [Google Scholar]
- Bentsi-Barnes K, Doyle ME, Abad D, Kandeel F, and Al-Abdullah I (2011). Detailed protocol for evaluation of dynamic perifusion of human islets to assess β-cell function. Islets 3, 284–290. [DOI] [PMC free article] [PubMed] [Google Scholar]
- Bonner-Weir S, Deery D, Leahy JL, and Weir GC (1989). Compensatory growth of pancreatic beta-cells in adult rats after short-term glucose infusion. Diabetes 38, 49–53. [DOI] [PubMed] [Google Scholar]
- Brissova M, Fowler MJ, Nicholson WE, Chu A, Hirshberg B, Harlan DM, and Powers AC (2005). Assessment of human pancreatic islet architecture and composition by laser scanning confocal microscopy. J. Histochem. Cytochem 53, 1087–1097. [DOI] [PubMed] [Google Scholar]
- Burdette SC, Frederickson CJ, Bu W, and Lippard SJ (2003). ZP4, an improved neuronal Zn2+ sensor of the Zinpyr family. J. Am. Chem. Soc 125, 1778–1787. [DOI] [PubMed] [Google Scholar]
- D’Amour KA, Bang AG, Eliazer S, Kelly OG, Agulnick AD, Smart NG, Moorman MA, Kroon E, Carpenter MK, and Baetge EE (2006). Production of pancreatic hormone-expressing endocrine cells from human embryonic stem cells. Nat. Biotechnol 24, 1392–1401. [DOI] [PubMed] [Google Scholar]
- Dahlgren GM, Kauri LM, and Kennedy RT (2005). Substrate effects on oscillations in metabolism, calcium and secretion in single mouse islets of Langerhans. Biochim. Biophys. Acta 1724, 23–36. [DOI] [PubMed] [Google Scholar]
- Davis JC, Helman A, Rivera-Feliciano J, Langston CM, Engquist EN, and Melton DA (2019). Live cell monitoring and enrichment of stem cell-derived β cells using intracellular zinc content as a population marker. Curr. Protoc. Stem Cell Biol 51, e99. [DOI] [PMC free article] [PubMed] [Google Scholar]
- Dodson G, and Steiner D (1998). The role of assembly in insulin’s biosynthesis. Curr. Opin. Struct. Biol 8, 189–194. [DOI] [PubMed] [Google Scholar]
- Gamble A, Pepper AR, Bruni A, and Shapiro AMJ (2018). The journey of islet cell transplantation and future development. Islets 10, 80–94. [DOI] [PMC free article] [PubMed] [Google Scholar]
- Ghazizadeh Z, Kao DI, Amin S, Cook B, Rao S, Zhou T, Zhang T, Xiang Z, Kenyon R, Kaymakcalan O, et al. (2017). ROCKII inhibition promotes the maturation of human pancreatic beta-like cells. Nat. Commun 8, 298. [DOI] [PMC free article] [PubMed] [Google Scholar]
- Haeusler RA, McGraw TE, and Accili D (2018). Biochemical and cellular properties of insulin receptor signalling. Nat. Rev. Mol. Cell Biol 19, 31–44. [DOI] [PMC free article] [PubMed] [Google Scholar]
- Hara MR, Agrawal N, Kim SF, Cascio MB, Fujimuro M, Ozeki Y, Takahashi M, Cheah JH, Tankou SK, Hester LD, et al. (2005). S-nitrosylated GAPDH initiates apoptotic cell death by nuclear translocation following Siah1 binding. Nat. Cell Biol 7, 665–674. [DOI] [PubMed] [Google Scholar]
- Hara MR, Thomas B, Cascio MB, Bae BI, Hester LD, Dawson VL, Dawson TM, Sawa A, and Snyder SH (2006). Neuroprotection by pharmacologic blockade of the GAPDH death cascade. Proc. Natl. Acad. Sci. USA 103, 3887–3889. [DOI] [PMC free article] [PubMed] [Google Scholar]
- Hart NJ, and Powers AC (2019). Use of human islets to understand islet biology and diabetes: progress, challenges and suggestions. Diabetologia 62, 212–222. [DOI] [PMC free article] [PubMed] [Google Scholar]
- Heissig H, Urban KA, Hastedt K, Zünkler BJ, and Panten U (2005). Mechanism of the insulin-releasing action of alpha-ketoisocaproate and related alpha-keto acid anions. Mol. Pharmacol 68, 1097–1105. [DOI] [PubMed] [Google Scholar]
- Henquin JC, Dufrane D, Kerr-Conte J, and Nenquin M (2015). Dynamics of glucose-induced insulin secretion in normal human islets. Am. J. Physiol. Endocrinol. Metab 309, E640–E650. [DOI] [PubMed] [Google Scholar]
- Hitosugi T, Zhou L, Elf S, Fan J, Kang HB, Seo JH, Shan C, Dai Q, Zhang L, Xie J, et al. (2012). Phosphoglycerate mutase 1 coordinates glycolysis and biosynthesis to promote tumor growth. Cancer Cell 22, 585–600. [DOI] [PMC free article] [PubMed] [Google Scholar]
- Hoagland VD Jr., and Teller DC (1969). Influence of substrates on the dissociation of rabbit muscle D-glyceraldehyde 3-phosphate dehydrogenase. Biochemistry 8, 594–602. [DOI] [PubMed] [Google Scholar]
- Hutton JC, and O’Brien RM (2009). Glucose-6-phosphatase catalytic subunit gene family. J. Biol. Chem 284, 29241–29245. [DOI] [PMC free article] [PubMed] [Google Scholar]
- Jain K, Logothetopoulos J, and Zucker P (1975). The effects of d- and l-glyceraldehyde on glucose oxidation, insulin secretion and insulin biosynthesis by pancreatic islets of the rat. Biochim. Biophys. Acta 399, 384–394. [DOI] [PubMed] [Google Scholar]
- Jayaguru P, and Mohr S (2011). Nuclear GAPDH: changing the fate of Müller cells in diabetes. J. Ocul. Biol. Dis. Infor 4, 34–41. [DOI] [PMC free article] [PubMed] [Google Scholar]
- Jensen MV, Joseph JW, Ilkayeva O, Burgess S, Lu D, Ronnebaum SM, Odegaard M, Becker TC, Sherry AD, and Newgard CB (2006). Compensatory responses to pyruvate carboxylase suppression in islet beta-cells. Preservation of glucose-stimulated insulin secretion. J. Biol. Chem 281, 22342–22351. [DOI] [PubMed] [Google Scholar]
- Jensen MV, Joseph JW, Ronnebaum SM, Burgess SC, Sherry AD, and Newgard CB (2008). Metabolic cycling in control of glucose-stimulated insulin secretion. Am. J. Physiol. Endocrinol. Metab 295, E1287–E1297. [DOI] [PMC free article] [PubMed] [Google Scholar]
- Jesinkey SR, Madiraju AK, Alves TC, Yarborough OH, Cardone RL, Zhao X, Parsaei Y, Nasiri AR, Butrico G, Liu X, et al. (2019). Mitochondrial GTP links nutrient sensing to beta cell health, mitochondrial morphology, and insulin secretion independent of OxPhos. Cell Rep. 28, 759–772.e10. [DOI] [PMC free article] [PubMed] [Google Scholar]
- Jia J, Arif A, Terenzi F, Willard B, Plow EF, Hazen SL, and Fox PL (2014). Target-selective protein S-nitrosylation by sequence motif recognition. Cell 159, 623–634. [DOI] [PMC free article] [PubMed] [Google Scholar]
- Juntti-Berggren L, Webb DL, Arkhammar PO, Schultz V, Schweda EK, Tornheim K, and Berggren PO (2003). Dihydroxyacetone-induced oscillations in cytoplasmic free Ca2+ and the ATP/ADP ratio in pancreatic beta-cells at substimulatory glucose. J. Biol. Chem 278, 40710–40716. [DOI] [PubMed] [Google Scholar]
- Kabra UD, Pfuhlmann K, Migliorini A, Keipert S, Lamp D, Korsgren O, Gegg M, Woods SC, Pfluger PT, Lickert H, et al. (2017). Direct substrate delivery into mitochondrial fission-deficient pancreatic islets rescues insulin secretion. Diabetes 66, 1247–1257. [DOI] [PubMed] [Google Scholar]
- Kenty JH, and Melton DA (2015). Testing pancreatic islet function at the single cell level by calcium influx with associated marker expression. PLoS ONE 10, e0122044. [DOI] [PMC free article] [PubMed] [Google Scholar]
- Kibbey RG, Pongratz RL, Romanelli AJ, Wollheim CB, Cline GW, and Shulman GI (2007). Mitochondrial GTP regulates glucose-stimulated insulin secretion. Cell Metab. 5, 253–264. [DOI] [PMC free article] [PubMed] [Google Scholar]
- Komatsu M, Takei M, Ishii H, and Sato Y (2013). Glucose-stimulated insulin secretion: a newer perspective. J. Diabetes Investig 4, 511–516. [DOI] [PMC free article] [PubMed] [Google Scholar]
- Kroon E, Martinson LA, Kadoya K, Bang AG, Kelly OG, Eliazer S, Young H, Richardson M, Smart NG, Cunningham J, et al. (2008). Pancreatic endoderm derived from human embryonic stem cells generates glucose-responsive insulin-secreting cells in vivo. Nat. Biotechnol 26, 443–452. [DOI] [PubMed] [Google Scholar]
- Lakey JR, Warnock GL, Rajotte RV, Suarez-Alamazor ME, Ao Z, Shapiro AM, and Kneteman NM (1996). Variables in organ donors that affect the recovery of human islets of Langerhans. Transplantation 61, 1047–1053. [DOI] [PubMed] [Google Scholar]
- Latif ZA, Noel J, and Alejandro R (1988). A simple method of staining fresh and cultured islets. Transplantation 45, 827–830. [PubMed] [Google Scholar]
- Lemaire K, Thorrez L, and Schuit F (2016). Disallowed and allowed gene expression: two faces of mature islet beta cells. Annu. Rev. Nutr 36, 45–71. [DOI] [PubMed] [Google Scholar]
- Lenzen S (2014). A fresh view of glycolysis and glucokinase regulation: history and current status. J. Biol. Chem 289, 12189–12194. [DOI] [PMC free article] [PubMed] [Google Scholar]
- Lukowiak B, Vandewalle B, Riachy R, Kerr-Conte J, Gmyr V, Belaich S, Lefebvre J, and Pattou F (2001). Identification and purification of functional human beta-cells by a new specific zinc-fluorescent probe. J. Histochem. Cytochem 49, 519–528. [DOI] [PubMed] [Google Scholar]
- MacDonald MJ (1993). Metabolism of the insulin secretagogue methyl succinate by pancreatic islets. Arch. Biochem. Biophys 300, 201–205. [DOI] [PubMed] [Google Scholar]
- MacDonald MJ (2007). Synergistic potent insulin release by combinations of weak secretagogues in pancreatic islets and INS-1 cells. J. Biol. Chem 282, 6043–6052. [DOI] [PubMed] [Google Scholar]
- MacDonald MJ, and Fahien LA (1990). Insulin release in pancreatic islets by a glycolytic and a Krebs cycle intermediate: contrasting patterns of glyceraldehyde phosphate and succinate. Arch. Biochem. Biophys 279, 104–108. [DOI] [PubMed] [Google Scholar]
- Marsh JJ, and Lebherz HG (1992). Fructose-bisphosphate aldolases: an evolutionary history. Trends Biochem. Sci 17, 110–113. [DOI] [PubMed] [Google Scholar]
- Mazzola JL, and Sirover MA (2003). Subcellular localization of human glyceraldehyde-3-phosphate dehydrogenase is independent of its glycolytic function. Biochim. Biophys. Acta 1622, 50–56. [DOI] [PubMed] [Google Scholar]
- Meeusen JW, Tomasiewicz H, Nowakowski A, and Petering DH (2011). TSQ (6-methoxy-8-p-toluenesulfonamido-quinoline), a common fluorescent sensor for cellular zinc, images zinc proteins. Inorg. Chem 50, 7563–7573. [DOI] [PMC free article] [PubMed] [Google Scholar]
- Meglasson MD, and Matschinsky FM (1984). New perspectives on pancreatic islet glucokinase. Am. J. Physiol 246, E1–E13. [DOI] [PubMed] [Google Scholar]
- Millman JR, Xie C, Van Dervort A, Gürtler M, Pagliuca FW, and Melton DA (2016). Generation of stem cell-derived β-cells from patients with type 1 diabetes. Nat. Commun 7, 11463. [DOI] [PMC free article] [PubMed] [Google Scholar]
- Motté E, Szepessy E, Suenens K, Stangé G, Bomans M, Jacobs-Tulleneers-Thevissen D, Ling Z, Kroon E, and Pipeleers D; Beta Cell Therapy Consortium EU-FP7 (2014). Composition and function of macroencapsulated human embryonic stem cell-derived implants: comparison with clinical human islet cell grafts. Am. J. Physiol. Endocrinol. Metab 307, E838–E846. [DOI] [PubMed] [Google Scholar]
- Nair GG, Liu JS, Russ HA, Tran S, Saxton MS, Chen R, Juang C, Li ML, Nguyen VQ, Giacometti S, et al. (2019). Recapitulating endocrine cell clustering in culture promotes maturation of human stem-cell-derived β cells. Nat. Cell Biol 21, 263–274. [DOI] [PMC free article] [PubMed] [Google Scholar]
- Pagliuca FW, Millman JR, Gürtler M, Segel M, Van Dervort A, Ryu JH, Peterson QP, Greiner D, and Melton DA (2014). Generation of functional human pancreatic β cells in vitro. Cell 159, 428–439. [DOI] [PMC free article] [PubMed] [Google Scholar]
- Petersen MC, and Shulman GI (2018). Mechanisms of insulin action and insulin resistance. Physiol. Rev 98, 2133–2223. [DOI] [PMC free article] [PubMed] [Google Scholar]
- Phillips NR, Sprouse ML, and Roby RK (2014). Simultaneous quantification of mitochondrial DNA copy number and deletion ratio: a multiplex real-time PCR assay. Sci. Rep 4, 3887. [DOI] [PMC free article] [PubMed] [Google Scholar]
- Pullen TJ, Khan AM, Barton G, Butcher SA, Sun G, and Rutter GA (2010). Identification of genes selectively disallowed in the pancreatic islet. Islets 2, 89–95. [DOI] [PubMed] [Google Scholar]
- Qian X, Li X, Shi Z, Xia Y, Cai Q, Xu D, Tan L, Du L, Zheng Y, Zhao D, et al. (2019). PTEN suppresses glycolysis by dephosphorylating and inhibiting autophosphorylated PGK1. Mol. Cell 76, 516–527 e7. [DOI] [PubMed] [Google Scholar]
- Rezania A, Bruin JE, Arora P, Rubin A, Batushansky I, Asadi A, O’Dwyer S, Quiskamp N, Mojibian M, Albrecht T, et al. (2014). Reversal of diabetes with insulin-producing cells derived in vitro from human pluripotent stem cells. Nat. Biotechnol 32, 1121–1133. [DOI] [PubMed] [Google Scholar]
- Robert T, De Mesmaeker I, Stangé GM, Suenens KG, Ling Z, Kroon EJ, and Pipeleers DG (2018). Functional beta cell mass from device-encapsulated hESC-derived pancreatic endoderm achieving metabolic control. Stem Cell Reports 10, 739–750. [DOI] [PMC free article] [PubMed] [Google Scholar]
- Rorsman P, and Braun M (2013). Regulation of insulin secretion in human pancreatic islets. Annu. Rev. Physiol 75, 155–179. [DOI] [PubMed] [Google Scholar]
- Russ HA, Parent AV, Ringler JJ, Hennings TG, Nair GG, Shveygert M, Guo T, Puri S, Haataja L, Cirulli V, et al. (2015). Controlled induction of human pancreatic progenitors produces functional beta-like cells in vitro. EMBO J. 34, 1759–1772. [DOI] [PMC free article] [PubMed] [Google Scholar]
- Russell SJ, El-Khatib FH, Sinha M, Magyar KL, McKeon K, Goergen LG, Balliro C, Hillard MA, Nathan DM, and Damiano ER (2014). Outpatient glycemic control with a bionic pancreas in type 1 diabetes. N. Engl. J. Med 371, 313–325. [DOI] [PMC free article] [PubMed] [Google Scholar]
- Sen N, Hara MR, Kornberg MD, Cascio MB, Bae BI, Shahani N, Thomas B, Dawson TM, Dawson VL, Snyder SH, and Sawa A (2008). Nitric oxide-induced nuclear GAPDH activates p300/CBP and mediates apoptosis. Nat. Cell Biol 10, 866–873. [DOI] [PMC free article] [PubMed] [Google Scholar]
- Sener A, Malaisse-Lagae F, Giroix MH, and Malaisse WJ (1986). Hexose metabolism in pancreatic islets: compartmentation of hexokinase in islet cells. Arch. Biochem. Biophys 251, 61–67. [DOI] [PubMed] [Google Scholar]
- Shapiro AM, Lakey JR, Ryan EA, Korbutt GS, Toth E, Warnock GL, Kneteman NM, and Rajotte RV (2000). Islet transplantation in seven patients with type 1 diabetes mellitus using a glucocorticoid-free immunosup-pressive regimen. N. Engl. J. Med 343, 230–238. [DOI] [PubMed] [Google Scholar]
- Stark R, and Kibbey RG (2014). The mitochondrial isoform of phosphoenolpyruvate carboxykinase (PEPCK-M) and glucose homeostasis: has it been overlooked? Biochim. Biophys. Acta 1840, 1313–1330. [DOI] [PMC free article] [PubMed] [Google Scholar]
- Stark R, Pasquel F, Turcu A, Pongratz RL, Roden M, Cline GW, Shulman GI, and Kibbey RG (2009). Phosphoenolpyruvate cycling via mitochondrial phosphoenolpyruvate carboxykinase links anaplerosis and mitochondrial GTP with insulin secretion. J. Biol. Chem 284, 26578–26590. [DOI] [PMC free article] [PubMed] [Google Scholar]
- Suarez S, McCollum GW, Jayagopal A, and Penn JS (2015). High glucose-induced retinal pericyte apoptosis depends on association of GAPDH and Siah1. J. Biol. Chem 290, 28311–28320. [DOI] [PMC free article] [PubMed] [Google Scholar]
- Tengholm A, and Gylfe E (2017). cAMP signalling in insulin and glucagon secretion. Diabetes Obes. Metab 19 (Suppl 1), 42–53. [DOI] [PubMed] [Google Scholar]
- Tomokuni Y, Goryo K, Katsura A, Torii S, Yasumoto K, Kemnitz K, Takada M, Fukumura H, and Sogawa K (2010). Loose interaction between glyceraldehyde-3-phosphate dehydrogenase and phosphoglycerate kinase revealed by fluorescence resonance energy transfer-fluorescence lifetime imaging microscopy in living cells. FEBS J. 277, 1310–1318. [DOI] [PubMed] [Google Scholar]
- Velazco-Cruz L, Song J, Maxwell KG, Goedegebuure MM, Augsornworawat P, Hogrebe NJ, and Millman JR (2019). Acquisition of dynamic function in human stem cell-derived β cells. Stem Cell Reports 12, 351–365. [DOI] [PMC free article] [PubMed] [Google Scholar]
- Veres A, Faust AL, Bushnell HL, Engquist EN, Kenty JH, Harb G, Poh YC, Sintov E, Gürtler M, Pagliuca FW, et al. (2019). Charting cellular identity during human in vitro β-cell differentiation. Nature 569, 368–373. [DOI] [PMC free article] [PubMed] [Google Scholar]
- White MR, and Garcin ED (2017). D-Glyceraldehyde-3-phosphate dehydrogenase structure and function. Subcell. Biochem 83, 413–453. [DOI] [PubMed] [Google Scholar]
- Wortham M, Benthuysen JR, Wallace M, Savas JN, Mulas F, Divakaruni AS, Liu F, Albert V, Taylor BL, Sui Y, et al. (2018). Integrated in vivo quantitative proteomics and nutrient tracing reveals age-related metabolic re-wiring of pancreatic beta cell function. Cell Rep. 25, 2904–2918.e8. [DOI] [PMC free article] [PubMed] [Google Scholar]
- Yoshihara E, Wei Z, Lin CS, Fang S, Ahmadian M, Kida Y, Tseng T, Dai Y, Yu RT, Liddle C, et al. (2016). ERRg is required for the metabolic maturation of therapeutically functional glucose-responsive β cells. Cell Metab. 23, 622–634. [DOI] [PMC free article] [PubMed] [Google Scholar]
- Zhang JY, Zhang F, Hong CQ, Giuliano AE, Cui XJ, Zhou GJ, Zhang GJ, and Cui YK (2015). Critical protein GAPDH and its regulatory mechanisms in cancer cells. Cancer Biol. Med 12, 10–22. [DOI] [PMC free article] [PubMed] [Google Scholar]
- Zou C, Wang Y, and Shen Z (2005). 2-NBDG as a fluorescent indicator for direct glucose uptake measurement. J. Biochem. Biophys. Methods 64, 207–215. [DOI] [PubMed] [Google Scholar]
Associated Data
This section collects any data citations, data availability statements, or supplementary materials included in this article.
Supplementary Materials
Data Availability Statement
Underlying data and modeling of mass spectra in C-Wave are available upon request from the corresponding author.