

Abstract
The current study determined the natural angiogenic molecules using an unbiased metabolomics approach. A chick chorioallantoic membrane (CAM) model was used to examine pro- and antiangiogenic molecules, followed by gas chromatography–mass spectrometry (GCMS) analysis. Vessel formation was analyzed quantitatively using the angiogenic index (p < 0.05). At embryonic day one, a white streak or circle area was observed when vessel formation begins. GCMS analysis and database search demonstrated that angiogenesis may initiate when oleic, cholesterol, and linoleic acids increased in the area of angiogenic reactions. The gain of function study was conducted by the injection of cholesterol and oleic acid into a chick embryo to determine the role of each lipid in angiogenesis. We propose that oleic acid, cholesterol, and linoleic acid are natural molecules that set the platform for the initiation stage of angiogenesis before other proteins including the vascular endothelial growth factor, angiopoietin, angiotensin, and erythropoietin join as the angiome in sprout extension and vessel maturation.
Introduction
Angiogenesis involves the assembly of angioblasts, vessel sprouting, and pericyte conscripting, as well as the formation of branches, tubes, and capillaries by the endothelial smooth muscle cells from the current vessel network.1−4 The vascular network formed by the proangiogenic factors functions in the transportation of oxygen and nutrients to various tissues where they are required for growth and proper development. Angiogenesis is controlled by the balance between anti- or proangiogenic activity, resulting from soluble and membrane-bound factors, including neutrophils, stem cell factors, semaphorins, ephrins, matrix metalloproteinase, endostatin, proteases, cytokines, and chemokines. Uncontrolled angiogenesis has been implicated in pathophysiological conditions including cancer, inflammation, diabetes, and neurodegeneration.5−7
Numerous stages of sprout extension and vessel maturation have been studied extensively; however, the exact molecular mechanisms that initiate the angiogenic reactions remain elusive.2,8−13 Previously, we demonstrated that natural products containing a conjugated double bond, including anthocyanin extracts from Hibiscus sabdariffa, may control proper angiogenesis.14 The results provided evidence that anthocyanin is an antiangiogenic modulator that can be used to treat uncontrolled neovascular-related diseases, possibly binding to vascular endothelial growth factor receptor 2 (VEGFR2).
In this study, we hypothesized that specific natural molecules present in chick embryo are implicated in angiogenic initiation, either to upregulate or downregulate the process. To test the hypothesis, we examined the natural molecules as a promoter or inhibitor using chick chorioallantoic membrane (CAM) models with an unbiased metabolomics approach by gas chromatography–mass spectrometry (GCMS) and vessel morphology analysis. Our experiments demonstrated that oleic acid, linoleic acid, and cholesterol could be involved in the initial step of vessel formation.
Results and Discussion
White Lipid Complex as the Angiogenesis Initiators
When a fertilized chick embryo is incubated, the first sign was observed that a white lipid complex area was formed as the angiogenesis initiation signature (Figure 1).15 The white streak or circular area was analyzed further in chick embryo incubation day 1 (ED = 1). The white lipid complex was collected from 8, 16, and 24 h for kinetic analysis, and time-dependent changes were observed. The white area becomes evident by time (8, 16, and 24 h), and the area becomes smaller and distinct. Pixels of each area were analyzed using 3D analysis in ImageJ software.
Figure 1.

White lipid complex area as the angiogenesis initiation signature. The white streak or circular area was observed in chick embryo incubation day 1 (ED = 1). The white area was expanded for analysis for 8, 16, and 24 h, and pixels of each area were analyzed using the 3D tool in ImageJ software.
Next, we examined the metabolome of the chicken embryo on day 1 (ED 1). After 24 h of incubation, the white rounded section was distinguished, as shown by the arrow (Figure 2). Molecules in two distinct areas of A and B were extracted using a solvent mixture consisting of chloroform, methanol, and water (or phosphate-buffered saline, PBS). The hydrophobic molecules extracted using the organic solvent were analyzed by GCMS.
Figure 2.
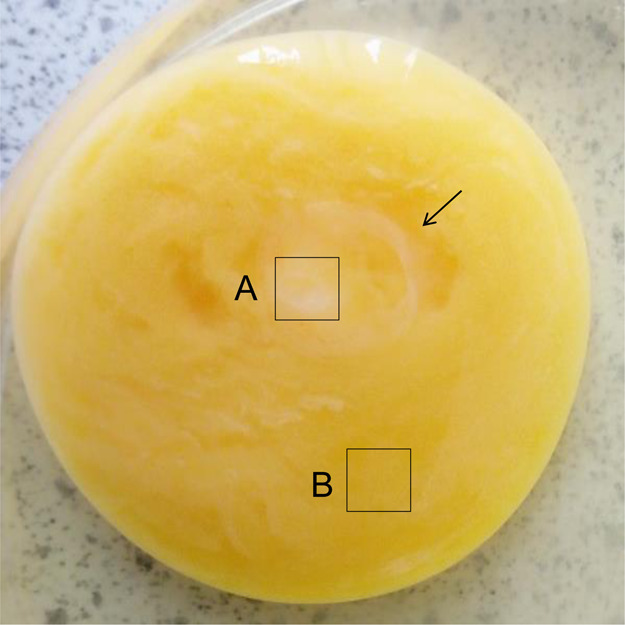
Unbiased metabolomics analysis of chicken embryo on day 1 (ED 1). After 24 h of incubation, the white rounded section was distinguished, as shown by the arrow. Organic molecules were extracted from two distinct areas of A and B using chloroform, methanol, and PBS. The hydrophobic molecules from areas A and B were analyzed by GCMS.
To compare the white lipid complex with the vessel area, we further examined the metabolome of the chicken embryo at day 7 (ED 7). After 7 days of incubation, blood vessel formation was distinguished, as shown by area A (Figure 3). Three distinct areas of A (vessel area), B (vessel starting point), and C (nonvessel area) were extracted using a solvent mixture (chloroform, methanol, and PBS). The hydrophobic molecules were analyzed by GCMS and compared to molecules from day 1.16−18
Figure 3.
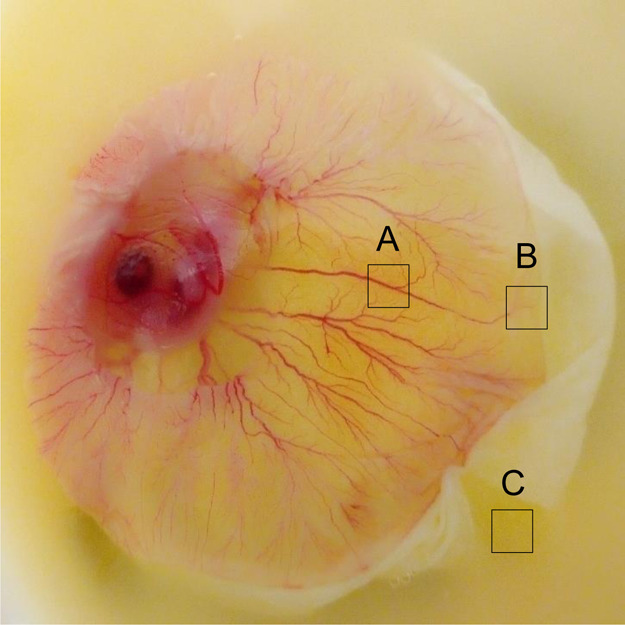
Unbiased metabolomics analysis of chicken embryo at day 7 (ED 7). After 7 days of incubation, blood vessel formation was distinguished, as shown by area A. Organic molecules were extracted from three distinct areas of A (vessel area), B (vessel starting area), and C (nonvessel area) and were extracted using chloroform, methanol, and PBS. The hydrophobic molecules from areas A, B, and C were analyzed by GCMS.
GCMS Analysis of Angiogenic Molecules
The unknown molecules from Figures 2 and 3 were analyzed using GCMS (Figure 4). We observed two distinct peaks at 22 and 25 min from the white area (Figure 2A), indicating two molecules of the highest concentrations (10–12-fold) at embryonic day 1 in the vessel area. Unknown molecules in the nonvessel area at embryonic day 1 were also analyzed by GCMS. The result shows that 12 molecules exist between 8 and 30 min of retention time (Figure 5).
Figure 4.

GCMS chromatogram of the vessel area at chick embryonic day 1. One gram of white area was collected and extracted using an organic solvent mixture. Molecules in the white area were analyzed using GCMS to identify molecular weight and fragmentation patterns. Two distinct peaks at 22 and 25 min were further analyzed for the second mass spectrum for m/z values for the molecular ion peak (M+) and the tallest base peak. The X-axis represents retention time (minutes), and the Y-axis shows relative abundance.
Figure 5.

GCMS chromatogram of the nonvessel area at chick embryo day 1. One gram of the white area was collected and extracted using an organic solvent mixture. Molecules in the nonvessel area were analyzed using GCMS to identify molecular weight and fragmentation patterns. Twelve peaks between 5 and 30 min were further analyzed for the second mass spectrum for m/z values. The X-axis represents retention time (minutes), and the Y-axis shows relative abundance.
The two distinct peaks at 22 and 25 min in the white area, as the angiogenesis initiation signature, were further analyzed by the mass to charge ratio (m/z) and relative abundance (Figure 6). The fragmentation pattern of the major peaks at 22 min is assigned as follows: C3 = 71, C4 = 86, C7′ = 97, C7 = 129, C19–CH3OH = 264, and the molecular ion peak M+ = 282 (Figure 6A).
Figure 6.

GCMS analysis of the vessel area at 22 min. (A) Molecules in the white circular area at 22 min were analyzed by their molecular weight and fragmentation pattern. The fragmentation pattern of the major peaks is assigned as follows: C3 = 71, C4 = 86, C7′ = 97, C7 = 129, and molecular ion M+ (C18) = 282. (B) Database search identified the unknown molecule as oleic acid, as the positive control. m/z values of all fragments were compared to an authentic sample of oleic acid (not shown) and the known spectrum of oleic acid from the database.
The major peaks with m/z and the relative abundance at 22 min were identified by the database search as oleic acid compared to the positive control (Figure 6B). m/z values of all fragments were compared to the authentic sample of oleic acid and the known spectrum of oleic acid from the database.19−22
The next major peak at 25 min in the vessel area was identified as cholesterol using GCMS analysis (Figure 7). The major peaks are fragments of cholesterol that include C4 = 55, C7 = 97, C11 = 145, C16 = 231, 241, C19 = 275, M+–OH = 369, and the molecular ion as M+ (C27) = 386 (Figure 7A). The identity of the major angiogenic molecule was validated by the comparison to the positive control (Figure 7B). m/z values of all fragments were compared to the authentic sample of cholesterol and the known spectrum of cholesterol from the database.23,24
Figure 7.

GCMS analysis of the vessel area at 25 min. (A) Molecules in the white circular area at 25 min were analyzed by their molecular weight and fragmentation pattern. Fragmentation pattern of the major peaks are assigned as follows: C4 = 55, C7 = 97, C11 = 145, C16 = 231, 241, C19 = 275, M + −OH = 369, and molecular ion as M+ (C27) = 386. (B) Database search identified the unknown molecule as cholesterol, as a positive control. m/z values of all fragments were compared to an authentic sample of cholesterol (not shown) and the known spectrum of cholesterol from the database.
Interestingly, we observed one more molecule at the 25 min peak from the vessel area, and GCMS analysis demonstrated it as linoleic acid (Figure 8). The major peaks include C4′ = 55, C3 = 72, C4 = 87, C7 = 94, C7′ = 97, C7 = 135, C11 = 150, M+–CO2 = 236, and the molecular ion peak M+ = 280 (Figure 8A). The database search identified the unknown molecule as linoleic acid compared to the positive control (Figure 8B). m/z values of all fragments were compared to the known spectrum of linoleic acid from the database.20,25−27 GCMS analysis of the vessel area from Figure 3 also demonstrated that oleic acid, linoleic acid, and cholesterol are the major angiogenesis signature molecules.
Figure 8.

GCMS analysis of the vessel area at 25 min. (A) Molecules in the white circular area at 25 min were analyzed by their molecular weight and fragmentation pattern. The fragmentation pattern of the major peaks is assigned as follows: C4′ = 55, C3 = 72, C4 = 87, C7 = 94, C7′ = 97, C7 = 135, C11 = 150, M+–CO2 = 236, and molecular ion peak M+ = 280. (B) Database search identified the unknown molecule as linoleic acid, shown as a positive control. m/z values of all fragments were compared to an authentic sample of linoleic acid and the known spectrum of linoleic acid from the database.
Next, we examined potential angiogenic molecules using a gain-of-function approach by the addition of cholesterol and oleic acid into the chick embryo. Accelerated vessel formation was observed by the injection of cholesterol+ (55 mg) and cholesterol++ (110 mg) in a dose-dependent manner, compared to the negative control (solvent only) (Figure 9). Cholesterol was injected on the CAM after preincubation day 2, and vessel formation was analyzed postinjection of cholesterol day 1.
Figure 9.

Cholesterol addition experiment. The gain-of-function study was conducted by the addition of cholesterol+ (55 mg), cholesterol++ (110 mg), and the control (solvent only). Cholesterol was added after preincubation, day 2, and chick embryo was analyzed postinjection of cholesterol, day 1. Scale bar = 10 mm.
The kinetic study for gain of function was conducted by the injection of cholesterol at different concentrations and examined at various time points. Two optimized concentrations of cholesterol (55 and 110 mg) were injected after preincubation day 2, and chick embryo was analyzed postinjection of cholesterol day 4, showing time-dependent vessel growth after the addition of cholesterol (Figure 10). However, postinjection of cholesterol day 1 showed the more drastic changes in vessel growth than postinjection of cholesterol day 4, indicating that the effect of cholesterol on angiogenesis is significant (p < 0.001) at an early time point. The injection of oleic acid showed a similar pattern of vessel growth as cholesterol addition (Figure 11).
Figure 10.

Cholesterol addition experiment. The gain-of-function study was conducted by the addition of cholesterol+ (55 mg), cholesterol++ (110 mg), and the control (solvent only). Cholesterol was added after preincubation, day 2, and chick embryo was analyzed postinjection of cholesterol, day 4. Scale bar = 10 mm.
Figure 11.

Cholesterol or oleic acid addition experiment. Gain-of-function study was conducted by the addition of cholesterol+ (55 mg), cholesterol++ (110 mg), oleic acid + (45 mg), and oleic acid ++ (200 mg) compared to the negative control (solvent only). Cholesterol or oleic acid were added after preincubation, day 2, and chick embryo was analyzed postinjection, day 4. Vessel morphology was further analyzed using bioinformatics tools including Angiogenesis Analyzer. Scale bar = 5 mm.
Time-dependent and dose-dependent vessel growth were analyzed quantitatively using bioinformatics tools, including Angiogenesis Analyzer and AutoTube. To determine the angiogenic morphology systematically, we measured 21 angiogenic indices using Angiogenic Analyzer macro (Gilles Carpentier, http://image.bio.methods.free.fr/ImageJ/Angiogenesis-Analyzer-for-ImageJ) on cholesterol-treated versus control chick embryos (CAM). The Angiogenic Analyzer detects vessel networks and analyzes the vascular organization of endothelial cells. To evaluate the proangiogenic effects of oleic acid, cholesterol, and linoleic acid, the Analyzer obtains a quantitative evaluation of the vessel network by extracting characteristic information of the angiogenic images. Cholesterol/oleic acid-treated samples were analyzed using the raw image and the edge/inverted image (Figure 11).
We determined the angiogenic parameters, including extremities, nodes, junctions, master junction, master segments, master segment length, meshes, total mesh area, number of segments, isolated elements and branches, number of segments, branches, number of isolated elements, total length, total branch length, total segment length, total branch length, total isolated branch length, branching interval, total segment length/branches, mesh index, master segment length/master segments, and mean mesh size (Supporting Information, Figures S1–S5, Table S1). Quantitative analysis revealed that cholesterol++ (110 mg) generated longer vessels and more branches compared to the control and less cholesterol+ (55 mg) addition (p < 0.001) (Figure 12). GCMS analysis showed that specific lipids increased to generate the white circle area just before massive angiogenic reactions, implying that the hydrophobic microenvironment might be required for the initial vessel growth.
Figure 12.

Angiogenic analysis by bioinformatics tools. Vessel morphology, including vessel length and branches, was analyzed quantitatively using the angiogenic index. The vessel length is longer in cholesterol+ (twofold) and cholesterol++ (sixfold) compared to the negative control (vehicle only) at preincubation, day 2 and postinjection, day 1.
Abnormal vessel formations accelerate the progression of specific angiogenic diseases in the retina including diabetic retinopathy (DR) and age-related macular degeneration (AMD).28−35 Adequate vessel growth and maintenance represent the coordinated process of endothelial cell proliferation, matrix remodeling, and differentiation. Uncontrolled angiogenic reactions are the major pathological components of the late stage of wet AMD when abnormal blood vessels are developed in the macula.36
The chick embryo model is a powerful tool to analyze the angiogenic factors, including proteins, small molecules, and cells.37−42 The CAM is an indicator of vessel morphology, containing highly vascularized tissues with short kinetics as 21 days of phenotypic time points.43−47
Previously, our proteomic studies under stress conditions identified the molecular changes in the retina and retinal pigment epithelium (RPE). Our data demonstrated that certain lipids were altered, including cardiolipin and cholesterol as specific biomarkers of angiogenesis and apoptosis in the retina and RPE under stress conditions.48
In addition, we determined the mechanism underlying normal and pathological angiogenesis, regulated by H. sabdariffa extracts as natural antiangiogenic molecules, whereas vegetable lipids may accelerate vessel growth. We suggested that anthocyanin from the Hibiscus plant may bind to VEGFR2 to inhibit angiogenesis. We compared antiangiogenic anthocyanin to selected fatty acid mixtures as angiogenic stimulators. Fatty acids, including oleic (18:1), linoleic (18:2, w6), linolenic (18:3, w3), palmitic (16:0), and palmitoleic (16:1), upregulated vessel length and branches by 20–50% compared to the negative control.
The current study determines the angiogenesis initiators in the chick embryo using a metabolomics approach including mass spectrometry and vessel morphology analysis. Despite the fact that the angiogenesis-related proteins including VEGF and erythropoietin have been considered as proangiogenic factors, the molecular function of small organic molecules remains elusive. It is a reasonable hypothesis that specific lipids may play certain roles in angiogenesis based on pro- and antiangiogenic reactions including free fatty acids or cholesterol.
Fatty Acids as Angiogenic Stimulators
Fatty acids are effective proangiogenic factors including eicosanoid that regulates vascular endothelial cell proliferation, migration, and capillary formation.49−54 Free fatty acids induce activation of signal transduction pathways that mediate several biological processes in addition to the role of the energy source of many carbon–carbon bonds.55−58
The current experiments indicate that oleic acid, cholesterol, and linoleic acid may act as potential molecular determinants and initiators of angiogenesis for the proper balance of acceleration and inhibition signaling that controls the vascular microenvironment. The natural angiogenic molecules could be a potential target for the treatment of uncontrolled angiogenic diseases including DR and AMD.
Oleic acid is a C18 monounsaturated fatty acid with the double bond at C9, activating G protein-coupled receptors including ERK1/2 to induce cancer cell proliferation.59,60 Oleic acid exists in normal serum (50 μmol/L), but with a higher concentration (>0.025 mmol/L), oleic acid may induce tumor cell development.61,62 Oleic acid induces proliferation, matrix metalloproteinase-9 (MMP-9) secretion, migration, and invasion.63
In terms of protein–metabolite interaction, oleic acid induces AKT1 and AKT2 activation and an increase in NFκB-DNA binding activity in cancer cells.60,64−66 Endothelial cell migration in vessel growth requires oleic acid-specific proteins including FFAR1, FFAR4, EGFR, AKT, and PI3K. Recently, it has been reported that nitro-oleic acid enhances regional angiogenesis in an abdominal wall defect murine model.67−69
Angiogenesis is regulated by cholesterol efflux from endothelial cells to high-density lipoproteins via apoA-I binding protein.70 Higher microvessel density was observed from the high-cholesterol/high-fat diet to conclude that hypercholesterolemia accelerates tumor growth and induces angiogenesis in vivo.71−73
Conjugated linoleic acid has controversy as an antiangiogenic or proangiogenic molecule based on the kinetics and dose-dependent mechanisms in the various models.74−77 As an accelerator of angiogenesis, linoleic acid can enhance the plasminogen activator inhibitor 1 (PAI-1) and induce angiogenesis by suppression of angiostatin. Linoleic acid does not alter tumor cell growth in vitro; however, dietary linoleic acid upregulates tumor growth in vivo.
Linoleic acid upregulates leukotriene B4 (LTB4), tumor necrosis factor-α (TNF-α), and cytokine-induced neutrophil chemotaxis (CINC-2αβ) and downregulates macrophage inflammatory protein-1 (MIP-1) and macrophage chemoattractant protein-1 (MCP-1).78 Furthermore, linoleic acid induces angiogenesis through specific mediators including angiopoietin-2 (ANGPT-2) and VEGF. Linoleic acid with the conjugated double bonds may have dual roles as an antiangiogenic, antioxidative molecule (double bond oxidation) and a proangiogenic molecule as a free fatty acid complex for vessel growth and angiogenic protein recruiter under the microenvironment. Our data imply that the initial reactions of angiogenesis may demand specific unsaturated fatty acids and cholesterol for their carbon building block and an energy source.
Conclusions
In this study, we hypothesized that the proangiogenic and antiangiogenic molecules exist as the natural angiogenic determinants, which regulate the development of blood vessel networks. We identified the lipid complex as the angiogenesis signature and vessel growth molecules through a metabolomics approach. Mass spectrometry analysis identified oleic acid, cholesterol, and linoleic acid as natural angiogenesis initiators that control vessel growth in a time-dependent and dose-dependent manner. Quantitative determination of angiogenesis using 21 angiogenic indexes provided the evidence that the uncovered lipids initiate angiogenesis and are a potential drug target for treating uncontrolled angiogenesis-related diseases, including DR and AMD.79−82
Materials and Methods
In Vivo Experiments
We followed the NIH Guide and the Association for Research in Vision and Ophthalmology (ARVO) statement for in vivo experiments. Avian embryos are not considered live animals under the Public Health Service (PHS) policy. The use of chicken embryos at gestation day 12 and younger does not require an Animal Use Protocol Application from the Institutional Animal Care and Use Committee (IACUC). Chick embryos younger than embryonic day 13 (ED13) are assumed unable to experience pain. Therefore, ED13 and younger embryos were euthanized by hypothermia, typically conducted by placing the eggs in a −20 °C freezer or <4 °C for 4 h. Embryonic death was confirmed by decapitation, membrane disruption, or maceration. Chick embryos between ED13–ED17 can experience pain and were euthanized by cervical dislocation.
Chick Embryo Incubation
We used CAM assay to investigate the vascular morphology and angiogenic molecules using metabolomics approaches including mass spectrometry analysis.83−85 Fertilized eggs of white Leghorn chickens were purchased from Veterinary Research Institute Jos and incubated for 1–21 days at 37.5 °C with 62–72% humidity in a laboratory incubator with continuous rotation. Chick embryos were incubated for each day (ED1–ED21) and harvested in Petri dishes.
For lipid addition experiments, both dose-dependent effects and time-dependent vessel growth were examined. Cholesterol (55, 110 mg) or oleic acid (45, 200 mg) in PBS/dimethyl sulfoxide was added after preincubation day 2 using a microsyringe (200 μL capacity, Hamilton Company, Bonaduz, Switzerland) through the hole (0.2 mm diameter) made with forceps. Solvent toxicity was validated by the negative control (vehicle only). After lipid addition, the chick embryo was sealed with 3M transparent scotch tape and further incubated for 1–4 days followed by harvest and vessel analysis.
Lipid Extraction from Chick Embryo
One gram of each sample was collected from the vessel area, vessel beginning area, and nonvessel areas of the chick embryo and extracted using organic solvents (methanol 2 mL, water or PBS 4 mL, and chloroform 8 mL). The mixtures were mixed using a vortex until the solution becomes homogenous. The samples were centrifuged (3500g for 5 min). The lower phase was collected into vials and evaporated to dryness at room temperature (27 ± 3 °C), and the samples were subsequently dissolved in hexane and were used for biochemical analysis.86,87
GCMS Analysis
GCMS analysis was carried out using an Agilent Technologies gas chromatograph (Agilent 7890A) coupled to a mass spectrometer (Agilent 5975C) and fitted with an autosampler (Agilent 7683B). Samples (0.2 μL) were injected using a split ratio of 1:1 by the autosampler into the inlet. The capillary column (DB-5MS 30 m × 0.322 mm × 0.25 μm) with a temperature limit of 325 °C was used, and temperature programming was initiated at 60 °C for 1 min and continued to increase by 10 °C/min to 280 °C for 21 min, giving rise to a total of 35 min run time. Helium gas of 99.99% purity was used as the carrier gas at a flow rate of 1.1 mL/min at a pressure of 5.154 psi. Finally, the identity of the samples was obtained through the interpretation of the mass spectrum from the database of the National Institute Standard and Technology (NIST 2014 and NIST 2011).
The unknown component of the mass spectrum was compared to the known compounds stored in the database of the instrument. The metabolome database (http://www.hmdb.ca/spectra/ms/search) was searched manually for the confirmation of lipids presented by the NIST database, according to their mass to charge ratio, fragmentation pattern, and relative abundance.23,27,88,89
Angiogenic Analysis of the Chick Embryo CAM
Vessel morphology was analyzed quantitatively using 21 angiogenic parameters by bioinformatics tools that include Angiogenesis Analyzer macro connected ImageJ software.90−94 Angiogenesis Analyzer macro was installed in the toolsets (Gilles Carpentier, http://image.bio.methods.free.fr/ImageJ/Angiogenesis-Analyzer-for-ImageJ). Each image was converted into a 16-bit image, and HUVEC phase contrast/Fluo images were analyzed to show vessel morphology. Besides, the following software was used for comparison, AutoTube (https://github.com/autotubularity/autotube), AngioTool (http://angiotool.nci.nih.gov), REAVER (https://github.com/bacorliss/public_REAVER), VESSGEN 2D (https://software.nasa.gov/software/ARC-17621-1), and Vessel Analysis (https://imagej.net/Vessel_Analysis). The angiogenic analysis showed changes in vessel morphology including vessel length, branches, and extremities; nodes were identified as three neighbors; twig, segment delimited by two junctions and a branch. A junction is implicated only in-branch, and master junctions are delimiting master segments. The master tree is composed of master segments associated with master junctions delimiting the meshes. Two close master junctions can be fused into a unique master junction and the underlying segment.
Statistical Analysis
Stat View software was used for statistical analysis. Two-group comparisons were analyzed by the two-tailed t-test, and multiple comparisons were evaluated by ANOVA and Tukey or Dunnet tests, as appropriate. Values are presented as the mean of three technically independent experiments with a large number of biological samples (n = 282). P < 0.05 is considered statistically significant.
Acknowledgments
The current research was supported in part by Research Assistantship and Teaching Assistantship from the American University of Nigeria and Julia Foundation. The authors are grateful to Emmanuel Alakunle and Ikenna George for their excellent technical assistance.
Glossary
Abbreviations
- CAM
chorioallantoic membrane
- GCMS
gas chromatography–mass spectrometry
- VEGF
vascular endothelial growth factor
- DR
diabetic retinopathy
- AMD
age-related macular degeneration
- RPE
retinal pigment epithelium
Supporting Information Available
The Supporting Information is available free of charge at https://pubs.acs.org/doi/10.1021/acsomega.0c02850.
Angiogenic analysis of vessel morphology; quantitative analysis of vessel morphology; total mesh area; raw data of extremities, nodes, and junctions; angiogenesis analysis; and representative analysis of cholesterol-added vessel morphology using Angiogenesis Analyzer (PDF)
The authors declare no competing financial interest.
Supplementary Material
References
- Caolo V.; Molin D. G. M.; Post M. J. Notch Regulation of Hematopoiesis, Endothelial Precursor Cells, and Blood Vessel Formation: Orchestrating the Vasculature. Stem Cells Int. 2012, 2012, 1–9. 10.1155/2012/805602. [DOI] [PMC free article] [PubMed] [Google Scholar]
- Zarogoulidis P.; Tsakiridis K.; Karapantzou C.; Lampaki S.; Kioumis I.; Pitsiou G.; Papaiwannou A.; Hohenforst-Schmidt W.; Huang H.; Kesisis G.; Karapantzos I.; Chlapoutakis S.; Korantzis I.; Mpakas A.; Karavasilis V.; Mpoukovinas I.; Li Q.; Zarogoulidis K. Use of Proteins as Biomarkers and Their Role in Carcinogenesis. J. Cancer 2015, 6, 9–18. 10.7150/jca.10560. [DOI] [PMC free article] [PubMed] [Google Scholar]
- Hakuno D.; Kimura N.; Yoshioka M.; Fukuda K. Molecular Mechanisms Underlying the Onset of Degenerative Aortic Valve Disease. J. Mol. Med. 2009, 87, 17–24. 10.1007/s00109-008-0400-9. [DOI] [PubMed] [Google Scholar]
- Tirziu D.; Simons M. Angiogenesis in the Human Heart: Gene and Cell Therapy. Angiogenesis 2005, 8, 241–251. 10.1007/s10456-005-9011-z. [DOI] [PubMed] [Google Scholar]
- Hollborn M.; Iandiev I.; Seifert M.; Schnurrbusch U. E. K.; Wolf S.; Wiedemann P.; Bringmann A.; Kohen L. Expression of HB-EGF by Retinal Pigment Epithelial Cells in Vitreoretinal Proliferative Disease. Curr. Eye Res. 2006, 31, 863–874. 10.1080/02713680600888807. [DOI] [PubMed] [Google Scholar]
- Liang G.; Chen G.; Wei X.; Zhao Y.; Li X. Small Molecule Inhibition of Fibroblast Growth Factor Receptors in Cancer. Cytokine Growth Factor Rev. 2013, 24, 467–475. 10.1016/j.cytogfr.2013.05.002. [DOI] [PubMed] [Google Scholar]
- Cheng R.; Ma J.-x. Angiogenesis in Diabetes and Obesity. Rev. Endocr. Metab. Disord. 2015, 16, 67–75. 10.1007/s11154-015-9310-7. [DOI] [PMC free article] [PubMed] [Google Scholar]
- Garnier D.; Milsom C.; Magnus N.; Meehan B.; Weitz J.; Yu J.; Rak J. Role of the Tissue Factor Pathway in the Biology of Tumor Initiating Cells. Thromb. Res. 2010, 125, S44–S50. 10.1016/S0049-3848(10)70012-8. [DOI] [PubMed] [Google Scholar]
- Zamora D. O.; Riviere M.; Choi D.; Pan Y.; Planck S. R.; Rosenbaum J. T.; David L. L.; Smith J. R. Proteomic Profiling of Human Retinal and Choroidal Endothelial Cells Reveals Molecular Heterogeneity Related to Tissue of Origin. Mol. Vision 2007, 13, 2058–2065. [PubMed] [Google Scholar]
- Pio R.; Ajona D.; Lambris J. D. Complement Inhibition: A Promising Concept for Cancer Treatment. Semin. Immunol. 2013, 25, 54–64. 10.1016/j.smim.2013.04.001. [DOI] [PMC free article] [PubMed] [Google Scholar]
- Huss W. J.; Lai L.; Barrios R. J.; Hirschi K. K.; Greenberg N. M. Retinoic Acid Slows Progression and Promotes Apoptosis of Spontaneous Prostate Cancer. Prostate 2004, 61, 142–152. 10.1002/pros.20097. [DOI] [PubMed] [Google Scholar]
- Oude Elferink R. P. J.; Bolier R.; Beuers U. H. Lysophosphatidic Acid and Signaling in Sensory Neurons. Biochim. Biophys. Acta, Mol. Cell Biol. Lipids 2015, 1851, 61–65. 10.1016/j.bbalip.2014.09.004. [DOI] [PubMed] [Google Scholar]
- Abak A.; Abhari A.; Rahimzadeh S. Exosomes in Cancer: Small Vesicular Transporters for Cancer Progression and Metastasis, Biomarkers in Cancer Therapeutics. PeerJ 2018, 6, e4763 10.7717/peerj.4763. [DOI] [PMC free article] [PubMed] [Google Scholar]
- Joshua M.; Okere C.; Sylvester O. D.; Yahaya M.; Precious O.; Dluya T.; Um J.-Y.; Neksumi M.; Boyd J.; Vincent-Tyndall J.; Choo D.-W.; Gutsaeva D. R.; Jahng W. J. Disruption of Angiogenesis by Anthocyanin-Rich Extracts of Hibiscus Sabdariffa. Int. J. Sci. Eng. Res. 2017, 8, 299–307. 10.14299/ijser.2017.02.009. [DOI] [PMC free article] [PubMed] [Google Scholar]
- Raffaella Zocchi M.; Poggi A. Editorial [Hot Topic: Targeting the Microenvironment in Hematological Malignancies: How to Condition Both Stromal and Effector Cells to Overcome Cancer Spreading(Guest Editors: Maria Raffaella Zocchi and Alessandro Poggi)]. Curr. Med. Chem. 2011, 18, 5172–5173. 10.2174/092986711798184235. [DOI] [PubMed] [Google Scholar]
- Frömel T.; Kohlstedt K.; Popp R.; Yin X.; Awwad K.; Barbosa-Sicard E.; Thomas A. C.; Lieberz R.; Mayr M.; Fleming I. Cytochrome P4502S1: A Novel Monocyte/Macrophage Fatty Acid Epoxygenase in Human Atherosclerotic Plaques. Basic Res. Cardiol. 2013, 108, 319. 10.1007/s00395-012-0319-8. [DOI] [PubMed] [Google Scholar]
- Saito K.; Dubreuil V.; Arai Y.; Wilsch-Brauninger M.; Schwudke D.; Saher G.; Miyata T.; Breier G.; Thiele C.; Shevchenko A.; Nave K.-A.; Huttner W. B. Ablation of Cholesterol Biosynthesis in Neural Stem Cells Increases Their VEGF Expression and Angiogenesis but Causes Neuron Apoptosis. Proc. Natl. Acad. Sci. U.S.A. 2009, 106, 8350–8355. 10.1073/pnas.0903541106. [DOI] [PMC free article] [PubMed] [Google Scholar]
- Pickens C. A.; Sordillo L. M.; Comstock S. S.; Harris W. S.; Hortos K.; Kovan B.; Fenton J. I. Plasma Phospholipids, Non-Esterified Plasma Polyunsaturated Fatty Acids and Oxylipids Are Associated with BMI. Prostaglandins, Leukotrienes Essent. Fatty Acids 2015, 95, 31–40. 10.1016/j.plefa.2014.12.001. [DOI] [PMC free article] [PubMed] [Google Scholar]
- Fang M.; Ivanisevic J.; Benton H. P.; Johnson C. H.; Patti G. J.; Hoang L. T.; Uritboonthai W.; Kurczy M. E.; Siuzdak G. Thermal Degradation of Small Molecules: A Global Metabolomic Investigation. Anal. Chem. 2015, 87, 10935–10941. 10.1021/acs.analchem.5b03003. [DOI] [PMC free article] [PubMed] [Google Scholar]
- Momchilova S.; Antonova D.; Marekov I.; Kuleva L.; Nikolova-Damyanova B.; Jham G. Fatty Acids, Triacylglycerols, and Sterols in Neem Oil (Azadirachta Indica A. Juss) as Determined by a Combination of Chromatographic and Spectral Techniques. J. Liq. Chromatogr. Relat. Technol. 2007, 30, 11–25. 10.1080/10826070601034188. [DOI] [Google Scholar]
- Wang T.; Yu W. G.; Powell W. S. Formation of Monohydroxy Derivatives of Arachidonic Acid, Linoleic Acid, and Oleic Acid during Oxidation of Low Density Lipoprotein by Copper Ions and Endothelial Cells. J. Lipid Res. 1992, 33, 525–537. [PubMed] [Google Scholar]
- Jung H.-J.; Lee W.-Y.; Yoo Y. S.; Chung B. C.; Choi M. H. Database-Dependent Metabolite Profiling Focused on Steroid and Fatty Acid Derivatives Using High-Temperature Gas Chromatography–Mass Spectrometry. Clin. Chim. Acta 2010, 411, 818–824. 10.1016/j.cca.2010.02.068. [DOI] [PubMed] [Google Scholar]
- Koumanov K. S.; Tessier C.; Momchilova A. B.; Rainteau D.; Wolf C.; Quinn P. J. Comparative Lipid Analysis and Structure of Detergent-Resistant Membrane Raft Fractions Isolated from Human and Ruminant Erythrocytes. Arch. Biochem. Biophys. 2005, 434, 150–158. 10.1016/j.abb.2004.10.025. [DOI] [PubMed] [Google Scholar]
- Tauchi-Sato K.; Ozeki S.; Houjou T.; Taguchi R.; Fujimoto T. The Surface of Lipid Droplets Is a Phospholipid Monolayer with a Unique Fatty Acid Composition. J. Biol. Chem. 2002, 277, 44507–44512. 10.1074/jbc.M207712200. [DOI] [PubMed] [Google Scholar]
- Rojo L. E.; Villano C. M.; Joseph G.; Schmidt B.; Shulaev V.; Shuman J. L.; Lila M. A.; Raskin I. Original Contribution: Wound-Healing Properties of Nut Oil from Pouteria Lucuma. J. Cosmet., Dermatol. Sci. Appl. 2010, 9, 185–195. 10.1111/j.1473-2165.2010.00509.x. [DOI] [PMC free article] [PubMed] [Google Scholar]
- Muslim N. S.; Ng K. W.; Itam A.; Nassa Z. D.; Ismail Z.; Abdul Maji A. M. S. Evaluation of Cytotoxic, Anti-Angiogenic and Antioxidant Properties of Standardized Extracts of Strobilanthes Crispus Leaves. Int. J. Pharmacol. 2010, 6, 591–599. 10.3923/ijp.2010.591.599. [DOI] [Google Scholar]
- Walczak J.; Bocian S.; Kowalkowski T.; Trziszka T.; Buszewski B. Determination of Omega Fatty Acid Profiles in Egg Yolk by HILIC-LC-MS and GC-MS. Food Anal. Methods 2017, 10, 1264–1272. 10.1007/s12161-016-0655-7. [DOI] [Google Scholar]
- Higashimoto Y.; Matsui T.; Nishino Y.; Taira J.; Inoue H.; Takeuchi M.; Yamagishi S.-i. Blockade by Phosphorothioate Aptamers of Advanced Glycation End Products-Induced Damage in Cultured Pericytes and Endothelial Cells. Microvasc. Res. 2013, 90, 64–70. 10.1016/j.mvr.2013.08.010. [DOI] [PubMed] [Google Scholar]
- Fleetwood F.; Klint S.; Hanze M.; Gunneriusson E.; Frejd F. Y.; StÅhl S.; Löfblom J. Simultaneous Targeting of Two Ligand-Binding Sites on VEGFR2 Using Biparatopic Affibody Molecules Results in Dramatically Improved Affinity. Sci. Rep. 2015, 4, 7518. 10.1038/srep07518. [DOI] [PMC free article] [PubMed] [Google Scholar]
- Hu H.; He L.; Li L.; Chen L. Apelin/APJ System as a Therapeutic Target in Diabetes and Its Complications. Mol. Genet. Metab. 2016, 119, 20–27. 10.1016/j.ymgme.2016.07.012. [DOI] [PubMed] [Google Scholar]
- Jo D. H.; Kim S.; Kim D.; Kim J. H.; Jon S.; Kim J. H. VEGF-Binding Aptides and the Inhibition of Choroidal and Retinal Neovascularization. Biomaterials 2014, 35, 3052–3059. 10.1016/j.biomaterials.2013.12.031. [DOI] [PubMed] [Google Scholar]
- Markovets A. M.; Fursova A. Z.; Kolosova N. G. Therapeutic Action of the Mitochondria-Targeted Antioxidant SkQ1 on Retinopathy in OXYS Rats Linked with Improvement of VEGF and PEDF Gene Expression. PLoS One 2011, 6, e21682 10.1371/journal.pone.0021682. [DOI] [PMC free article] [PubMed] [Google Scholar]
- Ohno-Matsui K.; Yoshida T.; Uetama T.; Mochizuki M.; Morita I. Vascular Endothelial Growth Factor Upregulates Pigment Epithelium-Derived Factor Expression via VEGFR-1 in Human Retinal Pigment Epithelial Cells. Biochem. Biophys. Res. Commun. 2003, 303, 962–967. 10.1016/S0006-291X(03)00446-7. [DOI] [PubMed] [Google Scholar]
- Klettner A.; Kaya L.; Flach J.; Lassen J.; Treumer F.; Roider J. Basal and Apical Regulation of VEGF-A and Placenta Growth Factor in the RPE/Choroid and Primary RPE. Mol. Vision 2015, 21, 736–748. [PMC free article] [PubMed] [Google Scholar]
- Pechan P.; Rubin H.; Lukason M.; Ardinger J.; DuFresne E.; Hauswirth W. W.; Wadsworth S. C.; Scaria A. Novel Anti-VEGF Chimeric Molecules Delivered by AAV Vectors for Inhibition of Retinal Neovascularization. Gene Ther. 2009, 16, 10–16. 10.1038/gt.2008.115. [DOI] [PubMed] [Google Scholar]
- Gehrs K. M.; Anderson D. H.; Johnson L. V.; Hageman G. S. Age-related Macular Degeneration—Emerging Pathogenetic and Therapeutic Concepts. Ann. Med. 2006, 38, 450–471. 10.1080/07853890600946724. [DOI] [PMC free article] [PubMed] [Google Scholar]
- Baharara J.; Namvar F.; Mousavi M.; Ramezani T.; Mohamad R. Anti-Angiogenesis Effect of Biogenic Silver Nanoparticles Synthesized Using Saliva Officinalis on Chick Chorioalantoic Membrane (CAM). Molecules 2014, 19, 13498–13508. 10.3390/molecules190913498. [DOI] [PMC free article] [PubMed] [Google Scholar]
- Jia K.; Lin M.; Kong D.; Jia Q. Recombinant Expression and Bioactivity Characterization of TAT-Fused Thymosin Β10. Protein J. 2019, 38, 675–682. 10.1007/s10930-019-09855-2. [DOI] [PubMed] [Google Scholar]
- Sohn K.-H.; Lee H.-Y.; Chung H.-Y.; Young H.-S.; Yi S.-Y.; Kim K.-W. Anti-Angiogenic Activity of Triterpene Acids. Cancer Lett. 1995, 94, 213–218. 10.1016/0304-3835(95)03856-R. [DOI] [PubMed] [Google Scholar]
- Al-Jamal K. T.; Al-Jamal W. T.; Akerman S.; Podesta J. E.; Yilmazer A.; Turton J. A.; Bianco A.; Vargesson N.; Kanthou C.; Florence A. T.; Tozer G. M.; Kostarelos K. Systemic Antiangiogenic Activity of Cationic Poly-L-Lysine Dendrimer Delays Tumor Growth. Proc. Natl. Acad. Sci. U.S.A. 2010, 107, 3966–3971. 10.1073/pnas.0908401107. [DOI] [PMC free article] [PubMed] [Google Scholar]
- Mathew S. A.; Bhonde R. R. Omega-3 Polyunsaturated Fatty Acids Promote Angiogenesis in Placenta Derived Mesenchymal Stromal Cells. Pharmacol. Res. 2018, 132, 90–98. 10.1016/j.phrs.2018.04.002. [DOI] [PubMed] [Google Scholar]
- Naik M.; Brahma P.; Dixit M. A Cost-Effective and Efficient Chick Ex-Ovo CAM Assay Protocol to Assess Angiogenesis. Methods Protoc. 2018, 1, 19. 10.3390/mps1020019. [DOI] [PMC free article] [PubMed] [Google Scholar]
- Kamble S. S.; Gacche R. N. Evaluation of Anti-Breast Cancer, Anti-Angiogenic and Antioxidant Properties of Selected Medicinal Plants. Eur. J. Intern. Med. 2019, 25, 13–19. 10.1016/j.eujim.2018.11.006. [DOI] [Google Scholar]
- Pal P.; Hales K.; Petrik J.; Hales D. B. Pro-Apoptotic and Anti-Angiogenic Actions of 2-Methoxyestradiol and Docosahexaenoic Acid, the Biologically Derived Active Compounds from Flaxseed Diet, in Preventing Ovarian Cancer. J. Ovarian Res. 2019, 12, 49–64. 10.1186/s13048-019-0523-3. [DOI] [PMC free article] [PubMed] [Google Scholar]
- Nowak-Sliwinska P.; Alitalo K.; Allen E.; Anisimov A.; Aplin A. C.; Auerbach R.; Augustin H. G.; Bates D. O.; van Beijnum J. R.; Bender R. H. F.; Bergers G.; Bikfalvi A.; Bischoff J.; Böck B. C.; Brooks P. C.; Bussolino F.; Cakir B.; Carmeliet P.; Castranova D.; Cimpean A. M.; Cleaver O.; Coukos G.; Davis G. E.; De Palma M.; Dimberg A.; Dings R. P. M.; Djonov V.; Dudley A. C.; Dufton N. P.; Fendt S.-M.; Ferrara N.; Fruttiger M.; Fukumura D.; Ghesquière B.; Gong Y.; Griffin R. J.; Harris A. L.; Hughes C. C. W.; Hultgren N. W.; Iruela-Arispe M. L.; Irving M.; Jain R. K.; Kalluri R.; Kalucka J.; Kerbel R. S.; Kitajewski J.; Klaassen I.; Kleinmann H. K.; Koolwijk P.; Kuczynski E.; Kwak B. R.; Marien K.; Melero-Martin J. M.; Munn L. L.; Nicosia R. F.; Noel A.; Nurro J.; Olsson A.-K.; Petrova T. V.; Pietras K.; Pili R.; Pollard J. W.; Post M. J.; Quax P. H. A.; Rabinovich G. A.; Raica M.; Randi A. M.; Ribatti D.; Ruegg C.; Schlingemann R. O.; Schulte-Merker S.; Smith L. E. H.; Song J. W.; Stacker S. A.; Stalin J.; Stratman A. N.; Van de Velde M.; van Hinsbergh V. W. M.; Vermeulen P. B.; Waltenberger J.; Weinstein B. M.; Xin H.; Yetkin-Arik B.; Yla-Herttuala S.; Yoder M. C.; Griffioen A. W. Consensus Guidelines for the Use and Interpretation of Angiogenesis Assays. Angiogenesis 2018, 21, 425–532. 10.1007/s10456-018-9613-x. [DOI] [PMC free article] [PubMed] [Google Scholar]
- Ribatti D. The Chick Embryo Chorioallantoic Membrane (CAM) Assay. Reprod. Toxicol. 2017, 70, 97–101. 10.1016/j.reprotox.2016.11.004. [DOI] [PubMed] [Google Scholar]
- Lai C. J.; Cheng H. C.; Lin C. Y.; Huang S. H.; Chen T. H.; Chung C. J.; Chang C. H.; Wang H. D.; Chuu C. P. Activation of Liver X Receptor Suppresses Angiogenesis via Induction of ApoD. FASEB J. 2017, 31, 5568–5576. 10.1096/fj.201700374R. [DOI] [PubMed] [Google Scholar]
- Sripathi S. R.; He W.; Atkinson C. L.; Smith J. J.; Liu Z.; Elledge B. M.; Jahng W. J. Mitochondrial–Nuclear Communication by Prohibitin Shuttling under Oxidative Stress. Biochemistry 2011, 50, 8342–8351. 10.1021/bi2008933. [DOI] [PMC free article] [PubMed] [Google Scholar]
- Capozzi M. E.; Savage S. R.; McCollum G. W.; Hammer S. S.; Ramos C. J.; Yang R.; Bretz C. A.; Penn J. S. The Peroxisome Proliferator-Activated Receptor-β/δ Antagonist GSK0660 Mitigates Retinal Cell Inflammation and Leukostasis. Exp. Eye Res. 2020, 190, 107885. 10.1016/j.exer.2019.107885. [DOI] [PMC free article] [PubMed] [Google Scholar]
- Wallace J. G.; Bellissimo C. J.; Yeo E.; Fei Xia Y.; Petrik J. J.; Surette M. G.; Bowdish D. M. E.; Sloboda D. M. Obesity during Pregnancy Results in Maternal Intestinal Inflammation, Placental Hypoxia, and Alters Fetal Glucose Metabolism at Mid-Gestation. Sci. Rep. 2019, 9, 17621. 10.1038/s41598-019-54098-x. [DOI] [PMC free article] [PubMed] [Google Scholar]
- Carnevale L. N.; Das A.. Novel Anti-Inflammatory and Vasodilatory ω-3 Endocannabinoid Epoxide Regioisomers. The Role of Bioactive Lipids in Cancer, Inflammation and Related Diseases; Advances in Experimental Medicine and Biology; Springer Nature: Switzerland, 2019; pp 219–232. [DOI] [PubMed] [Google Scholar]
- Pidgeon G. P.; Lysaght J.; Krishnamoorthy S.; Reynolds J. V.; O’Byrne K.; Nie D.; Honn K. V. Lipoxygenase Metabolism: Roles in Tumor Progression and Survival. Cancer Metastasis Rev. 2007, 26, 503–524. 10.1007/s10555-007-9098-3. [DOI] [PubMed] [Google Scholar]
- Vara-Messler M.; Buccellati C.; Pustina L.; Folco G.; Rovati G. E.; Hoxha M. A Potential Role of PUFAs and COXIBs in Cancer Chemoprevention. Prostaglandins Other Lipid Mediators 2015, 120, 97–102. 10.1016/j.prostaglandins.2015.04.003. [DOI] [PubMed] [Google Scholar]
- Brglez V.; Lambeau G.; Petan T. Secreted Phospholipases A2 in Cancer: Diverse Mechanisms of Action. Biochimie 2014, 107, 114–123. 10.1016/j.biochi.2014.09.023. [DOI] [PubMed] [Google Scholar]
- Speake B. K.; Noble R. C.; Murray A. M. B. The Utilization of Yolk Lipids by the Chick Embryo. World’s Poult. Sci. J. 1998, 54, 319–334. 10.1079/WPS19980022. [DOI] [Google Scholar]
- Xu K.; Mao X.; Mehta M.; Cui J.; Zhang C.; Xu Y. A Comparative Study of Gene-Expression Data of Basal Cell Carcinoma and Melanoma Reveals New Insights about the Two Cancers. PLoS One 2012, 7, e30750 10.1371/journal.pone.0030750. [DOI] [PMC free article] [PubMed] [Google Scholar]
- Icard P.; Kafara P.; Steyaert J.-M.; Schwartz L.; Lincet H. The Metabolic Cooperation between Cells in Solid Cancer Tumors. Biochim. Biophys. Acta, Rev. Cancer 2014, 1846, 216–225. 10.1016/j.bbcan.2014.06.002. [DOI] [PubMed] [Google Scholar]
- Zock P. L.; de Vries J. H.; Katan M. B. Impact of Myristic Acid versus Palmitic Acid on Serum Lipid and Lipoprotein Levels in Healthy Women and Men. Arterioscler., Thromb., Vasc. Biol. 1994, 14, 567–575. 10.1161/01.ATV.14.4.567. [DOI] [PubMed] [Google Scholar]
- Lager S.; Jansson T.; Powell T. L. Differential Regulation of Placental Amino Acid Transport by Saturated and Unsaturated Fatty Acids. Am. J. Physiol.: Cell Physiol. 2014, 307, C738–C744. 10.1152/ajpcell.00196.2014. [DOI] [PMC free article] [PubMed] [Google Scholar]
- Doronzo G.; Viretto M.; Barale C.; Russo I.; Mattiello L.; Anfossi G.; Trovati M. Oleic Acid Increases Synthesis and Secretion of VEGF in Rat Vascular Smooth Muscle Cells: Role of Oxidative Stress and Impairment in Obesity. Int. J. Mol. Sci. 2013, 14, 18861–18880. 10.3390/ijms140918861. [DOI] [PMC free article] [PubMed] [Google Scholar]
- Manning J. M.; Gebre A. K.; Edwards I. J.; Wagner W. D.; Rudel L. L.; Parks J. S. Dietary Polyunsaturated Fat Decreases Interaction between Low Density Lipoproteins and Arterial Proteoglycans. Lipids 1994, 29, 635–641. 10.1007/BF02536098. [DOI] [PubMed] [Google Scholar]
- Aardema H.; Van Tol H. T. A.; Vos P. L. A. M. 196 Steroid Concentrations in Bovine Follicular Fluid Are Affected by Metabolic Stress. Reprod., Fertil. Dev. 2020, 32, 226. 10.1071/RDv32n2Ab196. [DOI] [Google Scholar]
- Kim P. Y.; Zhong M.; Kim Y.-S.; Sanborn B. M.; Allen K. G. D. Long Chain Polyunsaturated Fatty Acids Alter Oxytocin Signaling and Receptor Density in Cultured Pregnant Human Myometrial Smooth Muscle Cells. PLoS One 2012, 7, e41708 10.1371/journal.pone.0041708. [DOI] [PMC free article] [PubMed] [Google Scholar]
- Liu Z.; Xiao Y.; Yuan Y.; Zhang X.; Qin C.; Xie J.; Hao Y.; Xu T.; Wang X. Effects of Oleic Acid on Cell Proliferation through an Integrin-Linked Kinase Signaling Pathway in 786-O Renal Cell Carcinoma Cells. Oncol. Lett. 2013, 5, 1395–1399. 10.3892/ol.2013.1160. [DOI] [PMC free article] [PubMed] [Google Scholar]
- Yang C.; Lim W.; Bazer F. W.; Song G. Oleic Acid Stimulation of Motility of Human Extravillous Trophoblast Cells Is Mediated by Stearoyl-CoA Desaturase-1 Activity. MHR: Basic Sci. Reprod. Med. 2017, 23, 755–770. 10.1093/molehr/gax051. [DOI] [PubMed] [Google Scholar]
- Uehara H.; Takahashi T.; Oha M.; Ogawa H.; Izumi K. Exogenous Fatty Acid Binding Protein 4 Promotes Human Prostate Cancer Cell Progression. Int. J. Cancer 2014, 135, 2558–2568. 10.1002/ijc.28903. [DOI] [PubMed] [Google Scholar]
- Vazquez M. M.; Gutierrez M. V.; Salvatore S. R.; Puiatti M.; Dato V. A.; Chiabrando G. A.; Freeman B. A.; Schopfer F. J.; Bonacci G. Nitro-Oleic Acid, a Ligand of CD36, Reduces Cholesterol Accumulation by Modulating Oxidized-LDL Uptake and Cholesterol Efflux in RAW264.7 Macrophages. Redox Biol. 2020, 36, 101591. 10.1016/j.redox.2020.101591. [DOI] [PMC free article] [PubMed] [Google Scholar]
- D’Amore A.; Fazzari M.; Jiang H. B.; Luketich S. K.; Luketich M. E.; Hoff R.; Jacobs D. L.; Gu X.; Badylak S. F.; Freeman B. A.; Wagner W. R. Nitro-Oleic Acid (NO2-OA) Release Enhances Regional Angiogenesis in a Rat Abdominal Wall Defect Model. Tissue Eng., Part A 2018, 24, 889–904. 10.1089/ten.tea.2017.0349. [DOI] [PMC free article] [PubMed] [Google Scholar]
- Mathers A. R.; Carey C. D.; Killeen M. E.; Salvatore S. R.; Ferris L. K.; Freeman B. A.; Schopfer F. J.; Falo L. D. Topical Electrophilic Nitro-Fatty Acids Potentiate Cutaneous Inflammation. Free Radical Biol. Med. 2018, 115, 31–42. 10.1016/j.freeradbiomed.2017.11.009. [DOI] [PMC free article] [PubMed] [Google Scholar]
- Fang L.; Choi S.-H.; Baek J. S.; Liu C.; Almazan F.; Ulrich F.; Wiesner P.; Taleb A.; Deer E.; Pattison J.; Torres-Vázquez J.; Li A. C.; Miller Y. I. Control of Angiogenesis by AIBP-Mediated Cholesterol Efflux. Nature 2013, 498, 118–122. 10.1038/nature12166. [DOI] [PMC free article] [PubMed] [Google Scholar]
- Pelton K.; Coticchia C. M.; Curatolo A. S.; Schaffner C. P.; Zurakowski D.; Solomon K. R.; Moses M. A. Hypercholesterolemia Induces Angiogenesis and Accelerates Growth of Breast Tumors in Vivo. Am. J. Pathol. 2014, 184, 2099–2110. 10.1016/j.ajpath.2014.03.006. [DOI] [PMC free article] [PubMed] [Google Scholar]
- Llaverias G.; Danilo C.; Wang Y.; Witkiewicz A. K.; Daumer K.; Lisanti M. P.; Frank P. G. A Western-Type Diet Accelerates Tumor Progression in an Autochthonous Mouse Model of Prostate Cancer. Am. J. Pathol. 2010, 177, 3180–3191. 10.2353/ajpath.2010.100568. [DOI] [PMC free article] [PubMed] [Google Scholar]
- Gustavsson C.; Agardh C.-D.; Zetterqvist A. V.; Nilsson J.; Agardh E.; Gomez M. F. Vascular Cellular Adhesion Molecule-1 (VCAM-1) Expression in Mice Retinal Vessels Is Affected by Both Hyperglycemia and Hyperlipidemia. PLoS One 2010, 5, e12699 10.1371/journal.pone.0012699. [DOI] [PMC free article] [PubMed] [Google Scholar]
- Smith A. N.; Muffley L. A.; Bell A. N.; Numhom S.; Hocking A. M. Unsaturated Fatty Acids Induce Mesenchymal Stem Cells to Increase Secretion of Angiogenic Mediators. J. Cell. Physiol. 2012, 227, 3225–3233. 10.1002/jcp.24013. [DOI] [PMC free article] [PubMed] [Google Scholar]
- Rose D. P.; Hatala M. A. Dietary Fatty Acids and Breast Cancer Invasion and Metastasis. Nutr. Cancer 1994, 21, 103–111. 10.1080/01635589409514309. [DOI] [PubMed] [Google Scholar]
- Basak S.; Das M. K.; Duttaroy A. K. Fatty Acid-Induced Angiogenesis in First Trimester Placental Trophoblast Cells: Possible Roles of Cellular Fatty Acid-Binding Proteins. Life Sci. 2013, 93, 755–762. 10.1016/j.lfs.2013.09.024. [DOI] [PubMed] [Google Scholar]
- Sikorski A. M.; Hebert N.; Swain R. A. Conjugated Linoleic Acid (CLA) Inhibits New Vessel Growth in the Mammalian Brain. Brain Res. 2008, 1213, 35–40. 10.1016/j.brainres.2008.01.096. [DOI] [PubMed] [Google Scholar]
- Rodrigues H. G.; Vinolo M. A. R.; Sato F. T.; Magdalon J.; Kuhl C. M. C.; Yamagata A. S.; Pessoa A. F. M.; Malheiros G.; dos Santos M. F.; Lima C.; Farsky S. H.; Camara N. O. S.; Williner M. R.; Bernal C. A.; Calder P. C.; Curi R. Oral Administration of Linoleic Acid Induces New Vessel Formation and Improves Skin Wound Healing in Diabetic Rats. PLoS One 2016, 11, e0165115 10.1371/journal.pone.0165115. [DOI] [PMC free article] [PubMed] [Google Scholar]
- Wong C. W.; Yanagi Y.; Lee W.-K.; Ogura Y.; Yeo I.; Wong T. Y.; Cheung C. M. G. Age-Related Macular Degeneration and Polypoidal Choroidal Vasculopathy in Asians. Prog. Retinal Eye Res. 2016, 53, 107–139. 10.1016/j.preteyeres.2016.04.002. [DOI] [PubMed] [Google Scholar]
- Cheng Y.-S.; Linetsky M.; Gu X.; Ayyash N.; Gardella A.; Salomon R. G. Light-Induced Generation and Toxicity of Docosahexaenoate-Derived Oxidation Products in Retinal Pigmented Epithelial Cells. Exp. Eye Res. 2019, 181, 325–345. 10.1016/j.exer.2018.09.012. [DOI] [PMC free article] [PubMed] [Google Scholar]
- Wright C.; Ambati J.. Age-Related Macular Degeneration and Vision Impairment. In Advances in Geroscience; Springer International Publishing: Cham, 2016; pp 471–507. [Google Scholar]
- Saxena R.; Singh D.; Saklani R.; Gupta S. K. Clinical Biomarkers and Molecular Basis for Optimized Treatment of Diabetic Retinopathy: Current Status and Future Prospects. Eye Brain 2016, 8, 1–13. 10.2147/EB.S69185. [DOI] [PMC free article] [PubMed] [Google Scholar]
- Lokman N. a.; Elder A. S. F.; Ricciardelli C.; Oehler M. K. Chick Chorioallantoic Membrane (CAM) Assay as an In Vivo Model to Study the Effect of Newly Identified Molecules on Ovarian Cancer Invasion and Metastasis. Int. J. Mol. Sci. 2012, 13, 9959–9970. 10.3390/ijms13089959. [DOI] [PMC free article] [PubMed] [Google Scholar]
- Deryugina E. I.; Quigley J. P. Chick Embryo Chorioallantoic Membrane Model Systems to Study and Visualize Human Tumor Cell Metastasis. Histochem. Cell Biol. 2008, 130, 1119–1130. 10.1007/s00418-008-0536-2. [DOI] [PMC free article] [PubMed] [Google Scholar]
- Lokman N. A.; Elder A. S. F.; Ricciardelli C.; Oehler M. K. Chick Chorioallantoic Membrane (CAM) Assay as an In Vivo Model to Study the Effect of Newly Identified Molecules on Ovarian Cancer Invasion and Metastasis. Int. J. Mol. Sci. 2012, 13, 9959–9970. 10.3390/ijms13089959. [DOI] [PMC free article] [PubMed] [Google Scholar]
- Schiff R. I.; Gennaro J. F. The Influence of the Buffer on Maintenance of Tissue Lipid in Specimens for Scanning Electron Microscopy. Scanning Electron Microsc. 1979, 3, 449–458. [PubMed] [Google Scholar]
- Hollingdale M. R.; Vinson J. W.; Herrmann J. E. Immunochemical and Biological Properties of the Outer Membrane-Associated Lipopolysaccharide and Protein of Rochalimaea Quintana. J. Infect. Dis. 1980, 141, 672–679. 10.1093/infdis/141.5.672. [DOI] [PubMed] [Google Scholar]
- Liu A.; Chang J.; Lin Y.; Shen Z.; Bernstein P. S. Long-Chain and Very Long-Chain Polyunsaturated Fatty Acids in Ocular Aging and Age-Related Macular Degeneration. J. Lipid Res. 2010, 51, 3217–3229. 10.1194/jlr.M007518. [DOI] [PMC free article] [PubMed] [Google Scholar]
- Hegde K. R.; Varma S. D. Electron Impact Mass Spectroscopic Studies on Mouse Retinal Fatty Acids: Effect of Diabetes. Ophthalmic Res. 2009, 42, 9–14. 10.1159/000219679. [DOI] [PMC free article] [PubMed] [Google Scholar]
- Das N. M.; Hatsell S.; Nannuru K.; Huang L.; Wen X.; Wang L.; Wang L.-H.; Idone V.; Meganck J. A.; Murphy A.; Economides A.; Xie L. In Vivo Quantitative Microcomputed Tomographic Analysis of Vasculature and Organs in a Normal and Diseased Mouse Model. PLoS One 2016, 11, e0150085 10.1371/journal.pone.0150085. [DOI] [PMC free article] [PubMed] [Google Scholar]
- Macía I.; Graña M.; Paloc C. Knowledge Management in Image-Based Analysis of Blood Vessel Structures. Knowl. Inf. Syst. 2012, 30, 457–491. 10.1007/s10115-010-0377-x. [DOI] [Google Scholar]
- Montoya-Zegarra J. A.; Russo E.; Runge P.; Jadhav M.; Willrodt A.-H.; Stoma S.; Nørrelykke S. F.; Detmar M.; Halin C. AutoTube: A Novel Software for the Automated Morphometric Analysis of Vascular Networks in Tissues. Angiogenesis 2019, 22, 223–236. 10.1007/s10456-018-9652-3. [DOI] [PMC free article] [PubMed] [Google Scholar]
- Onal S.; Uludag G.; Oray M.; Mengi E.; Herbort C. P.; Akman M.; Metin M. M.; Koc Akbay A.; Tugal-Tutkun I. Quantitative Analysis of Structural Alterations in the Choroid of Patients with Active Behçet Uveitis. Retina 2018, 38, 828–840. 10.1097/IAE.0000000000001587. [DOI] [PubMed] [Google Scholar]
- Jonathan E.; Enfield J.; Leahy M. J.. Correlation Mapping: Rapid Method for Retrieving Microcirculation Morphology from Optical Coherence Tomography Intensity Images. Dynamics and Fluctuations in Biomedical Photonics VIII; BiOS, SPIE: San Francisco, 2011; p 78980M. [Google Scholar]
Associated Data
This section collects any data citations, data availability statements, or supplementary materials included in this article.