

ABSTRACT
Background
Resistance exercise and dietary protein stimulate muscle protein synthesis (MPS). The rate at which proteins are digested and absorbed into circulation alters peak plasma amino acid concentrations and may modulate postexercise MPS. A novel mineral modified milk protein concentrate (mMPC), with identical amino acid composition to standard milk protein concentrate (MPC), was formulated to induce rapid aminoacidemia.
Objectives
The aim of this study was to determine whether rapid aminoacidemia and greater peak essential amino acid (EAA) concentrations induced by mMPC would stimulate greater postresistance exercise MPS, anabolic signaling, and ribosome biogenesis compared to standard dairy proteins, which induce a small but sustained plasma essential aminoacidemia.
Methods
Thirty healthy young men (22.5 ± 3.0 y; BMI 23.8 ± 2.7 kg/m2) received primed constant infusions of l-[ring-13C6]-phenylalanine and completed 3 sets of leg presses and leg extensions at 80% of 1 repetition. Afterwards, participants were randomly assigned in a double-blind fashion to consume 25 g mMPC, MPC, or calcium caseinate (CAS). Vastus lateralis biopsies were collected at rest, and 2 and 4 h post exercise.
Results
Plasma EAA concentrations, including leucine, were 19.2–26.6% greater in the mMPC group 45–90 min post ingestion than in MPC and CAS groups (P < 0.001). Myofibrillar fractional synthetic rate from baseline to 4 h was increased by 82.6 ± 64.8%, 137.8 ± 72.1%, and 140.6 ± 52.4% in the MPC, mMPC, and CAS groups, respectively, with no difference between groups (P = 0.548). Phosphorylation of anabolic signaling targets (P70S6KThr389, P70S6KThr421/Ser424, RPS6Ser235/236, RPS6Ser240/244, P90RSKSer380, 4EBP1) were elevated by <3-fold at both 2 and 4 h post exercise in all groups (P < 0.05).
Conclusions
The amplitude of plasma leucine and EAA concentrations does not modulate the anabolic response to resistance exercise after ingestion of 25 g dairy protein in young men. This trial was registered at http://www.anzctr.org.au/ as ACTRN12617000393358.
Keywords: human, resistance exercise, milk protein, amino acids, fractional synthetic rate, anabolic signaling, ribosome biogenesis
Introduction
Muscle mass begins to decline in middle age, which accelerates in later life, leading to physical frailty and a higher risk of both mortality and morbidity (1, 2). Achieving a high peak muscle mass through resistance training in young adulthood and middle age may help to maintain physical function and metabolic health in later life (3). Both protein intake and exercise are important for muscle mass maintenance, primarily by increasing muscle protein synthesis (MPS) rates (4). The efficiency of MPS is primarily regulated by the mechanistic target of rapamycin (mTOR) pathway (5). mTOR is a central protein target that integrates signals from muscle contraction and nutrition to coordinate 2 main processes: translational capacity (the amount of ribosomes available) and translation efficiency (the amount of protein produced per mRNA) (6, 7). Most research has focused on translational efficiency as the main regulator of MPS in humans (8). However, it is possible that in some situations translational capacity could limit MPS or muscle hypertrophy (9) as ribosomal content increases proportionally with muscle size after resistance training (10, 11) and in animal models of overload (6). Pre-ribosomal RNA (pre-rRNA) has also been shown to respond to postexercise protein feeding in older men (12).
Milk protein primarily comprises 2 distinct types of protein; whey protein accounts for 20% of milk proteins and is characterized by a rapid rate of digestion and a rapid but transient peak aminoacidemia (13). The remaining 80% of milk protein exists as casein, which is slowly digested, and results in a more sustained but lower peak aminoacidemia (13). Previous studies have shown that whey protein was more effective than casein for increasing MPS after a single bout of resistance exercise in young and older adults (14, 15). Based on these studies and a body of similar work (16–18), it has been suggested that magnitude and rate of aminoacidemia (particularly of leucine) is the primary nutritional stimulator of postexercise MPS. This has been termed the leucine trigger hypothesis (4), which is supported by further studies that isolated the role of aminoacidemia by manipulating feeding patterns of the same dose of protein, suggesting that the magnitude of peak aminoacidemia is an important determinant of postexercise MPS (16, 19). However, a number of postexercise protein ingestion studies in which participants have ingested proteins that vary slightly in amino acids composition but vary greatly in the magnitude of aminoacidemia induced, have failed to support a role of aminoacidemia distinct from protein dose in regulating postexercise MPS (20–24). Recently, technology has become available that allows the rate and magnitude of aminoacidemia to be manipulated while controlling for amino acid content by creating a rapidly digested milk protein concentrate with modified mineral content to disrupt the formation of casein micelles (mMPC).
Interpretation of the role of aminoacidemia in regulation of postexercise MPS is complicated by conflicting information from studies manipulating feeding patterns (16, 25) and studies of proteins that vary in both amino acid composition and rate of appearance of dietary protein-derived amino acids into circulation during the postprandial period (14, 23). Therefore, the primary aim of this study was to determine whether consumption of a protein that induces a large but transient aminoacidemia (mMPC) would result in a larger postexercise MPS response than a protein with an identical amino acid composition but which induced a small but sustained aminoacidemia [milk protein concentrate (MPC)] or a control [calcium caseinate (CAS)]. The secondary aim was to measure the effects of these dietary protein manipulations on upstream regulators of MPS, including mTOR pathway targets and markers of ribosome biogenesis during recovery from resistance exercise. It is hypothesized that the more rapid and higher magnitude of aminoacidemia induced by mMPC will result in higher postexercise MPS than that observed after MPC or CAS ingestion. It is also hypothesized that this will be mediated by greater mTOR pathway signaling and increased pre-rRNA expression in the mMPC group.
Methods
Participant recruitment
Healthy young men (n = 30) between the ages of 18 and 35 y with no lower body resistance training in the previous 6 months were recruited using social media. Participants were eligible if they had a BMI between 18 and 30 kg/m2, were nonsmokers, free of cardiovascular, musculoskeletal, or metabolic conditions, and were not taking any medications or supplements of any kind. Subjects were randomly assigned according to a 1:1:1 ratio using www.random.org. Participant flow through the trial is shown in Figure 1. All participants gave their informed consent for inclusion before they participated in the study. The study received ethical approval from the Health and Disability Committee Ethics Committee (New Zealand), reference 16/CEN/206. This study was registered with the Australia New Zealand Clinical Trials as ACTRN12617000393358.
FIGURE 1.

CONSORT diagram of the process through the phases of a 3-group parallel randomized trial. CAS, calcium caseinate; mMPC, mineral modified milk protein concentrate; MPC, milk protein concentrate.
Experimental protocol
A parallel single-dose randomized design was used. Participants were asked to refrain from any strenuous exercise and alcohol consumption for at least 72 h before the trial day. At least 72 h before the trial day, participants underwent a DXA scan (Lunar Prodigy) to quantify lean, fat, and total body mass. Participants were familiarized with the leg presses and leg extensions, and performed a single set of each exercise where failure was achieved in ≤6 repetitions. The Brzycki equation (26) was then used to estimate 1 repetition maximum (1RM) for each exercise. On the day before the test, participants were provided a standard evening meal (60en% carbohydrate, 20en% protein, 20en% fat) containing ∼40% of their daily energy requirements as estimated by the Harris‒Benedict equation (27). The meal was consumed before 2200 the night before the trial day. After an overnight fast, participants arrived at the clinic at 0700 and a 20-gauge plastic catheter was inserted into an antecubital vein and used to collect a baseline blood sample. A slow saline drip was provided to control hydration-state and keep the catheter patent. A muscle biopsy (∼100 mg) was collected from the vastus lateralis using a Bergström needle modified for manual suction under local anesthesia (2% xylocaine). Visible fat and connective tissue were dissected away, and the biopsy was immediately frozen in liquid nitrogen. After the biopsy, another catheter (22-gauge) was inserted into the contralateral antecubital vein and a primed constant infusion of l-[ring-13C6]-phenylalanine (prime: 2 µmol/kg; infusion: 0.05 µmol·kg−1·min−1) was commenced and maintained for the remainder of the trial. After 3 h of rest, a second biopsy was obtained from the contralateral leg. Participants then performed 2 warmup sets (10 repetitions) of leg presses at 50% and 70% of 1RM, followed by 3 sets (10 repetitions) at 80% 1RM of leg presses and leg extensions, with 2 min of rest between sets, and the final set of each exercise performed until failure. Immediately afterwards, participants consumed 1 of the 3 dairy protein beverages within 5 min of the conclusion of exercise. Participants rested quietly in a supine position with further biopsies being collected at 2 and 4 h after exercise. Blood samples were collected at 180, 120, 60, and 0 min pre intervention, and 15, 30, 45, 60, 90, 120, 180, and 240 min post intervention.
Study beverages
Participants were randomly assigned to consume 25 g MPC (Fonterra Co-operative Group Ltd.), mMPC (Fonterra Co-operative Group Ltd.), or CAS (Fonterra Co-operative Group Ltd.) in a double-blind fashion. The mMPC was manufactured from fresh skim milk using ultrafiltration, and underwent proprietary processes modifying the mineral profile, and disrupting the casein micelle, which results in a more rapid aminoacidemia without altering amino acid composition or hydrolyzing proteins. Each ingredient was dissolved in 350 mL of water and mixed with 7.8 mg free l-[ring-13C6]-phenylalanine to enrich the beverage to ∼6% of total phenylalanine. The macronutrient and amino acid compositions of the beverages are displayed in Table 1.
TABLE 1.
Macronutrient and amino acid composition of each protein beverage1
| MPC | mMPC | CAS | |
|---|---|---|---|
| Energy, kJ/25 g | 535 | 556 | 439 |
| Protein, g/25 g | 25 | 25 | 25 |
| Carbohydrate, g/25 g | 3.7 | 6.0 | 0.1 |
| Fat, g/25 g | 1.45 | 1.0 | 0.5 |
| Alanine, g/25 g | 0.91 | 0.91 | 0.75 |
| Arginine, g/25 g | 0.94 | 0.94 | 0.95 |
| Aspartic acid, g/25 g | 2.04 | 2.04 | 1.78 |
| Cystine, g/25 g | 0.20 | 0.20 | 0.18 |
| Glutamic acid, g/25 g | 6.06 | 6.06 | 5.58 |
| Glycine, g/25 g | 0.50 | 0.50 | 0.48 |
| Histidine, g/25 g | 0.73 | 0.73 | 0.70 |
| Isoleucine, g/25 g | 1.39 | 1.39 | 1.33 |
| Leucine, g/25 g | 2.61 | 2.61 | 2.35 |
| Lysine, g/25 g | 2.16 | 2.16 | 2.00 |
| Methionine, g/25 g | 0.76 | 0.76 | 0.75 |
| Phenylalanine, g/25 g | 1.33 | 1.33 | 1.30 |
| Proline, g/25 g | 2.63 | 2.63 | 2.75 |
| Serine, g/25 g | 1.46 | 1.46 | 1.45 |
| Threonine, g/25 g | 1.18 | 1.18 | 1.08 |
| Tryptophan, g/25 g | 0.44 | 0.44 | 0.33 |
| Tyrosine, g/25 g | 1.39 | 1.39 | 1.45 |
| Valine, g/25 g | 1.61 | 1.61 | 1.68 |
Values are displayed as 25-g doses of protein, n = 10/group. CAS, calcium caseinate; mMPC, mineral modified milk protein concentrate; MPC, milk protein concentrate.
Blood biochemistry
Baseline blood biochemistry and time course concentrations of plasma glucose were measured as previously described (28). Briefly, plasma HDL cholesterol, LDL cholesterol, TGs, and total cholesterol were measured with the Roche Cobas c311 autoanalyzer (Roche). Time course plasma concentrations of insulin were measured with the Roche Cobas e411 autoanalyzer (Roche) using electrochemiluminescence immune-assay.
Plasma amino acid concentrations
Plasma free amino acids were assessed by ultra-performance liquid chromatography as previously described (29) with l-norvaline as an internal standard. The ultra-performance liquid chromatography was organized with a Thermo Scientific Dionex Ultimate 3000 pump, auto sampler, column oven, fluorescence detector (ThermoFisher Scientific), and a Kinetex C18 column headed by a Krudkatcher inline filter (Phenomenex). Chromeleon 7.1 software (ThermoFisher Scientific) was used to capture data.
Muscle fractional synthesis rate
Protein extraction was conducted similarly to a previous study (30). Briefly, frozen muscle samples between 30 and 60 mg were homogenized for 40 s at 20 Hz using a TissueLyser (Qiagen) in buffer (10 μL/mg 25 mM Tris 0.5% v/v Triton X-100) and protease/phosphatase inhibitor cocktail with 5 mmol/L EDTA solution [Halt Protease and Phosphatase Inhibitor Cocktail (100X), Thermo Scientific, #78,446]. The samples were centrifuged at 4500 × g for 15 min at 4°C to isolate the cytosolic fraction. The supernatant was collected in a fresh tube for western blot analysis and frozen at −80°C, while the pellet was used to calculate the rate of protein synthesis for a myofibrillar-enriched fraction.
Myofibrillar protein-bound and plasma-free l-[ring-13C6]-phenylalanine enrichments were quantified as previously described (31). Briefly, the protein pellets were hydrolyzed overnight in 6 M HCL at 110°C. Free amino acids were purified using cation exchange chromatography and dried under vacuum, followed by resuspension in 60% methanol. Liquid chromatography separation was performed on a Thermo Hypercarb column (4.6 × 100 mm, 5 μm) with mobile phase A (0.1% formic acid in water) and mobile phase B (0.1% formic acid in acetonitrile). Samples were analyzed using a 5500 QTRAP liquid chromatography-tandem mass spectrometer and the mass spectra were acquired under positive electrospray ionization with the ion spray voltage at +5500 V. The curtain gas, ion source gas 1, and ion source gas 2 were 35, 65, and 55 pounds/square inch, respectively. The l-[ring-13C6]-phenylalanine enrichments were determined by multiple reaction monitoring at m/z 166.0 → 103.0 and 172.0 → 109.0 for unlabeled and labelled l-[ring-13C6]-phenylalanine, respectively. Software Analyst 1.6.2 (Agilent) was used for data acquisition and analysis.
l-[ring-13C6]-phenylalanine enrichments in plasma were determined by GC-MS analysis using electron impact ionization by ion monitoring at m/z of 336 (m + 0) and 342 (m + 6) for unlabeled and labeled phenylalanine, respectively.
Myofibrillar fractional synthetic rate (FSR) was calculated using the standard equation of precursor to product divided by the increment in tracer enrichment into the myofibrillar proteins by the enrichment of the plasma free precursor pool over time.
 |
(1) |
FSR is the fractional synthetic rate measure; Em2 and Em1 are the protein-bound enrichments from the muscle biopsies, and so the difference between these determines the change in bound protein enrichment between the 2 time points; Eplasma is the time weight mean of phenylalanine enrichment in plasma during the incorporation period; and t is the isotope incorporation time.
Western blotting
Protein content in the homogenate was determined using a Pierce BCA Protein Assay Kit (Thermo Fisher Scientific). Samples were prepared to contain 20 µg protein, suspended in Laemmli buffer and boiled at 95°C for 10 min. Protocol for sample separation via SDS-PAGE, protein transfer, antibody binding, and imaging were performed as previously described (30). Primary antibodies used to measure all protein targets are found in Supplemental Table 1. Densitometry analysis of protein bands was performed using Image J software. Abundance of proteins of interest was normalized for protein loading by stripping and re-probing membranes for GAPDH. Sample western blots are displayed in Supplemental Figure 1.
Real-time qPCR
Total RNA and DNA were extracted from ∼20 mg muscle tissue using AllPrep DNA/RNA/miRNA Universal Kit (QIAGEN GmbH). Total RNA concentration, DNA concentration, and purity were measured using a NanoDrop 1000 running 3.1.2 NanoDrop software (Biolab). cDNA was synthesized using High-Capacity RNA-to-cDNA kit (Life Technologies).
Real-time qPCR was conducted on a LightCycler 480 II (Roche Applied Science), using SYBR Green I master mix (Roche Applied Science). A total of 8 reference genes were run on all samples, and the 3 most stable genes across all time points were selected for normalization (valosin containing protein, chromosome 1 open reading frame 43, endoplasmic membrane protein 7). Target genes were, CMYC, eukaryote initiation factor 4E (EIF4E), 60S ribosome subunit biogenesis protein NIP7 homolog (NIP7), RNA polymerase I subunit B (POLR1B), transcription initiation factor 1A (TIF1A), and upstream binding factor (UBF). The primer sequences for all gene targets, including all housekeeper genes, are listed in Supplemental Table 2.
Target rRNAs were 45S pre-rRNA, 28S, 18S, 5.8S, and 5S. The primers were all designed by QIAGEN, using RT2 Profiler PCR Arrays. The product details are displayed in Supplemental Table 3.
Statistical analysis
Statistical analysis was performed on SigmaPlot 13.0 (Systat Software, Inc.). Normality was assessed with the Shapiro-Wilk test, log transformations were used for data that was not normally distributed. Differences in gene expression, anabolic signaling, MPS and amino acid concentrations were assessed with 2-factor repeated measures ANOVA with time as within-subject factor and group as a between-subject factor. Between- and within-group differences were assessed with Holm-Šídák post hoc analysis when statistically significant interactions were observed. AUC was calculated in 2 ways as a measure of amino acid availability, pAUC was calculated as the total positive area above baseline whereas iAUC was the integrated sum of the area both above and below baseline. One-factor ANOVA was used to assess between group differences in AUC. A priori sample size calculations were conducted to detect a postexercise between-group difference in FSR of 0.0225%/h with 80% power, α set at 5% and SD of 0.013 based on our previous work (32). This calculation yielded a sample size of 10 participants/group. All data are reported as means ± SDs in the text and tables. Significance is set at α ≤0.05.
Results
Participant characteristics
Participant baseline characteristics are displayed in Table 2. There were no differences between supplement groups for age (P = 0.197), body mass characteristics (P ≥ 0.417), leg strength (P ≥ 0.732), and plasma biochemistry (P ≥ 0.311).
TABLE 2.
Baseline characteristics of participants allocated to MPC, mMPC, or CAS in the fasted state1
| MPC | mMPC | CAS | P | |
|---|---|---|---|---|
| Age, y | 23.7 ± 3.3 | 21.3 ± 2.1 | 22.7 ± 3.2 | 0.197 |
| Body mass, kg | 75.9 ± 9.9 | 82.6 ± 12.1 | 77.4 ± 11.4 | 0.900 |
| Lean mass, kg | 59.1 ± 7.8 | 61.0 ± 5.3 | 58.8 ± 8.6 | 0.417 |
| BMI, kg/m2 | 23.7 ± 2.8 | 24.2 ± 2.9 | 23.8 ± 2.6 | 0.770 |
| Total body fat, % | 17.4 ± 6.1 | 20.6 ± 10.3 | 19.6 ± 5.5 | 0.650 |
| Leg press 1RM, kg | 179.9 ± 42.3 | 172.4 ± 19.7 | 169.0 ± 27.8 | 0.732 |
| Leg extensions 1RM, kg | 109.1 ± 35.0 | 107.3 ± 18.0 | 113.1 ± 30 | 0.898 |
| Plasma insulin, µU/mL | 9.4 ± 5.1 | 8.5 ± 2.5 | 10.8 ± 6.0 | 0.583 |
| Plasma glucose, mmol/L | 5.3 ± 0.4 | 5.4 ± 0.3 | 5.4 ± 0.2 | 0.951 |
| Plasma HDL cholesterol, mmol/L | 1.3 ± 0.3 | 1.3 ± 0.3 | 1.4 ± 0.4 | 0.966 |
| Plasma LDL cholesterol, mmol/L | 3.0 ± 0.5 | 2.4 ± 0.6 | 2.8 ± 0.9 | 0.311 |
| Plasma TG, mmol/L | 1.0 ± 0.3 | 1.1 ± 0.7 | 0.9 ± 0.3 | 0.636 |
| Plasma total cholesterol, mmol/L | 4.5 ± 0.6 | 4.0 ± 0.7 | 4.4 ± 0.9 | 0.398 |
Values are means ± SDs, n = 10/group. CAS, calcium caseinate; mMPC, mineral modified milk protein concentrate; MPC, milk protein concentrate; 1RM, 1 repetition maximum.
Plasma insulin and glucose
There was a significant group × time interaction for plasma insulin (P < 0.001, Figure 2A), such that the mMPC group had a greater concentration at 60 min when compared with both MPC (P = 0.011) and CAS (P < 0.001) groups. Insulin concentrations were elevated above baseline at 30 min in all groups (P < 0.001), at 60 min for the mMPC (P < 0.001) and MPC (P = 0.005) groups, and at 90 min for the mMPC group only (P = 0.028).
FIGURE 2.
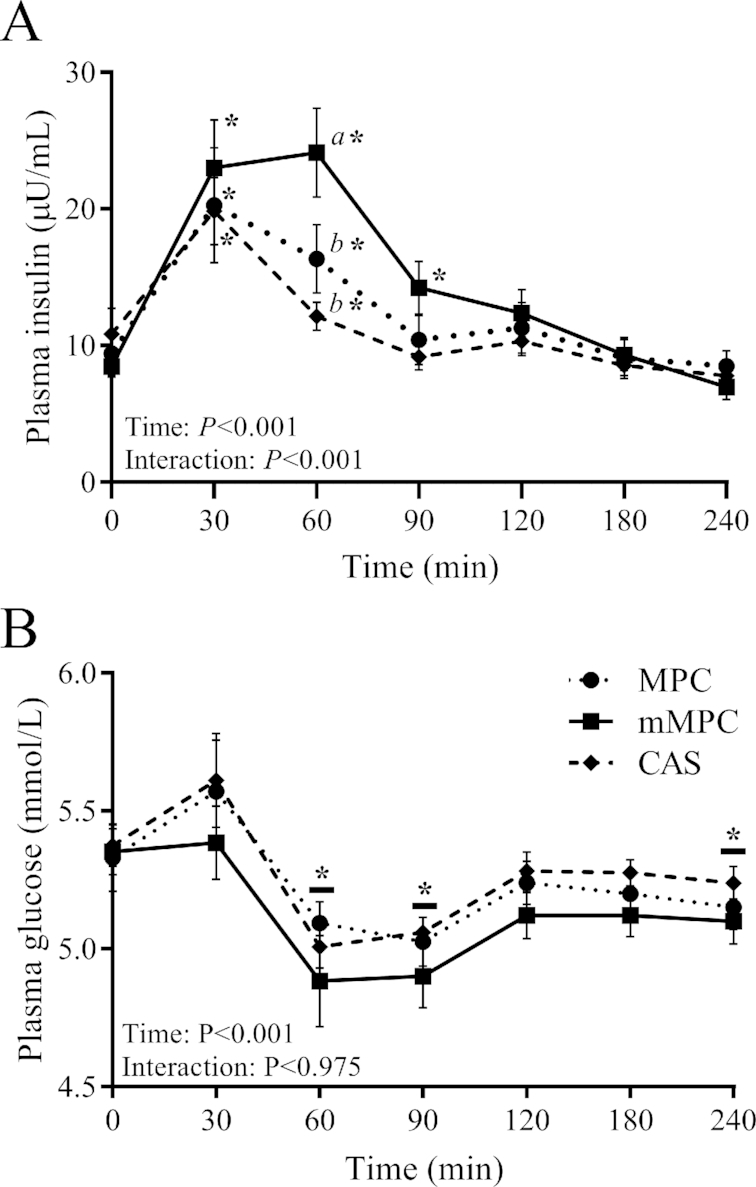
Plasma insulin (A) and glucose (B) concentrations after consumption of mMPC, CAS, or MPC protein beverages over 240 min in healthy young men. Values represent means ± SEMs, n = 10/group. Data were analyzed with 2-factor repeated measures ANOVA. Labelled means without a common letter differ at that time point. *Different from respective group's baseline; a horizontal bar indicates a main effect of time for all 3 groups. CAS, calcium caseinate; mMPC, mineral modified milk protein concentrate; MPC, milk protein concentrate.
There was no group × time interaction for plasma glucose (P = 0.975, Figure 2B). There was a main effect of time for a decrease in glucose concentrations below baseline at 60 and 90 min (P < 0.001) and at 240 min (P = 0.037).
Plasma amino acids
There was a group × time interaction for changes in plasma total amino acid (TAA) concentrations (P = 0.034, Figure 3A). TAA concentrations were elevated above baseline at 45 min for all groups (P ≤ 0.022), at 60 min for mMPC and MPC groups (P ≤ 0.012), and at 90 min for mMPC group only (P < 0.001). There were no differences in pAUC or iAUC between groups for TAA over the 240 min period (P = 0.158 and P = 0.732, respectively).
FIGURE 3.
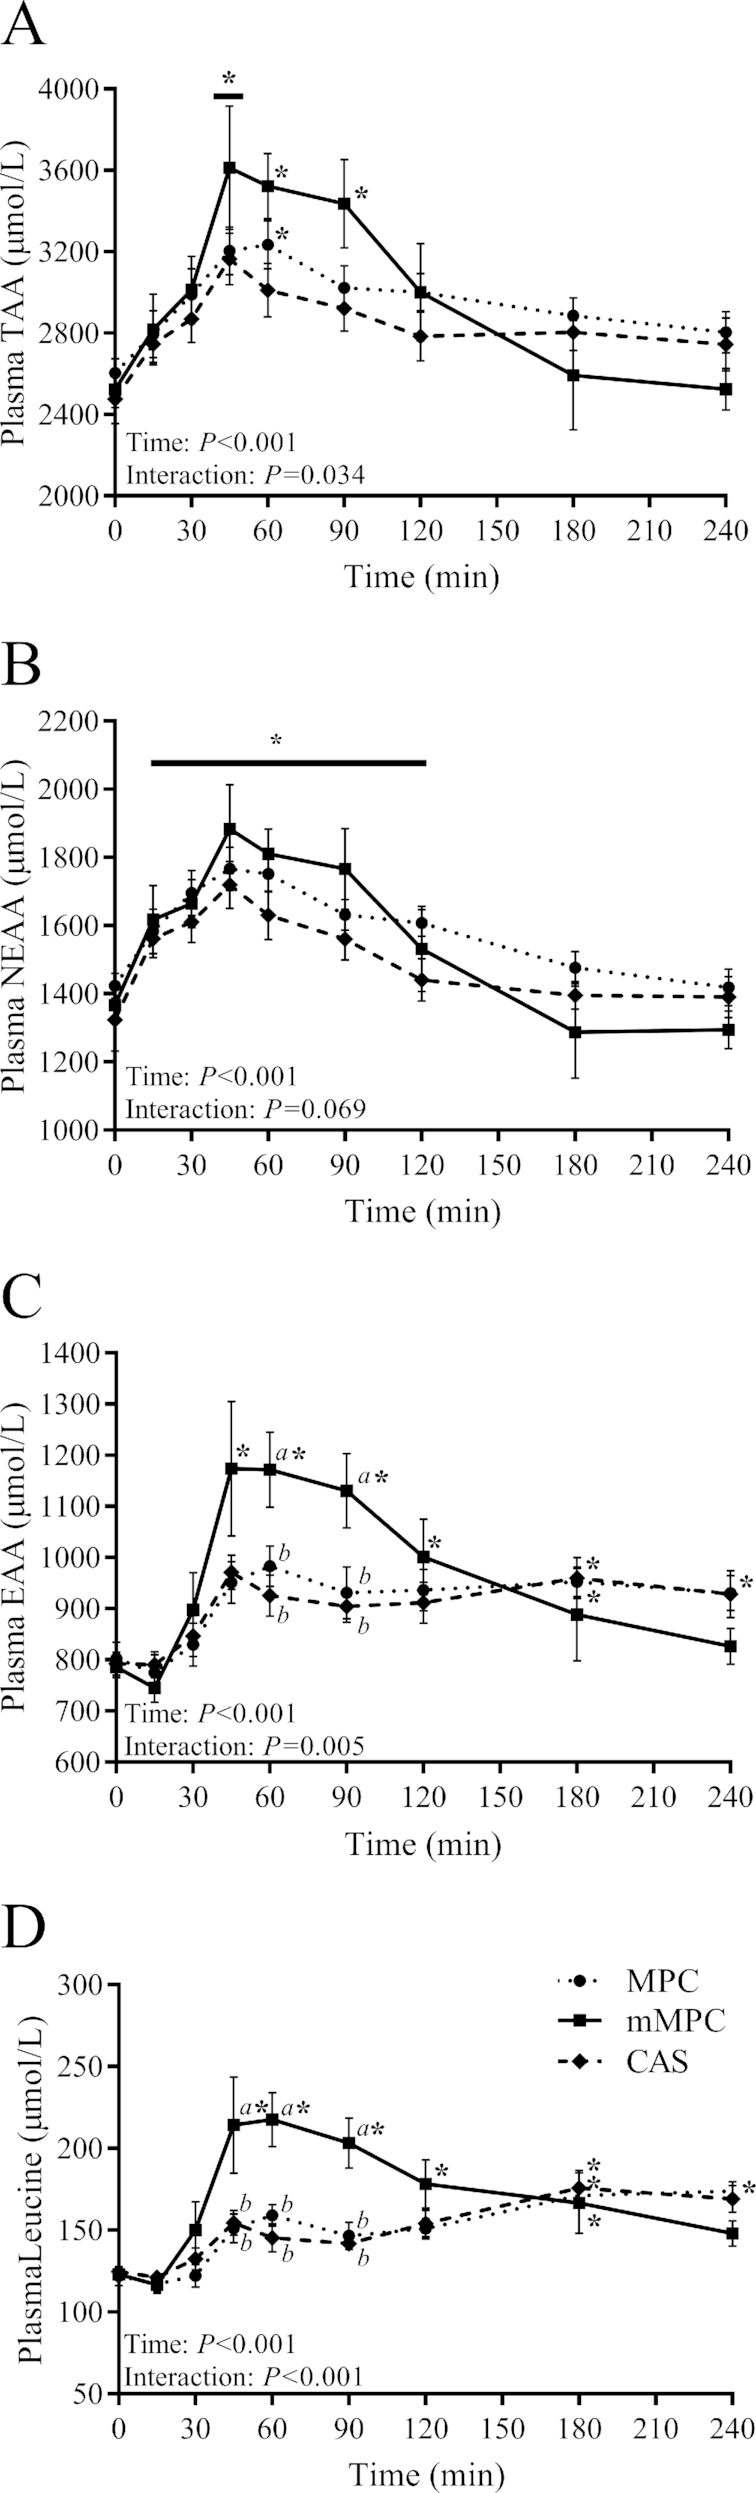
Plasma concentrations of TAA (A), NEAA (B), EAA (C), and leucine (D) after consumption of mMPC, CAS, or MPC protein beverages over 240 min in healthy young men. Values represent means ± SEMs, n = 10/group. Data were analyzed with 2-factor repeated measures ANOVA. Labelled means without a common letter differ at that time point. *Different from respective group's baseline; a horizontal bar indicates a main effect of time for all 3 groups. CAS, calcium caseinate; EAA, essential amino acids; mMPC, mineral modified milk protein concentrate; MPC, milk protein concentrate; NEAA, nonessential amino acids; TAA, total amino acids.
Plasma nonessential amino acids (NEAAs) showed a trend for group × time interaction (P = 0.069, Figure 3B). There was a main effect of time for an increase in NEAA concentrations above baseline from 15 to 120 min (P ≤ 0.044). There were no differences in pAUC or iAUC between groups for NEAAs over the 240 min period (P = 0.598 and P = 0.975, respectively).
There was a group × time interaction for changes in plasma essential amino acid (EAA) concentrations (P = 0.005, Figure 3C), such that the mMPC group had a greater concentration than both the MPC and CAS groups at 60 and 90 min (P ≤ 0.023). EAA concentrations were elevated above baseline from 45 to 120 min for the mMPC group only (P ≤ 0.029), only at 180 min for the CAS group (P = 0.030), and from 180 to 240 min for the MPC group (P ≤ 0.031). pAUC for EAAs was greater in the mMPC group when compared to both the MPC and CAS groups (48% compared with MPC, P = 0.036; 69% compared with CAS, P = 0.003), whereas there was a trend for differences in iAUC between groups (P = 0.057).
There was a group × time interaction for plasma leucine concentration (P < 0.001, Figure 3D), such that the mMPC group had a greater concentration than both the MPC and CAS groups from 45 to 90 min (P ≤ 0.001). Leucine concentrations were above baseline from 45 to 180 min (P ≤ 0.006) for the mMPC group, only at 180 min for the CAS group (P = 0.044), and from 180 to 240 min for the MPC group (P ≤ 0.031). pAUC for leucine was greater for the mMPC group than in both MPC and CAS groups (54% compared with MPC, P = 0.010; 58% compared with CAS, P = 0.007), whereas there was a trend for differences in iAUC between groups (P = 0.061).
Ribosomal RNA
There was no group × time interaction observed for total RNA concentration (P = 0.958), 45S pre-rRNA (P = 0.759), 28S (P = 0.986), 18S (P = 0.253), 5.8S (P = 0.739), and 5S (P = 0.245). There was no increase above baseline at any time for all RNAs (Supplemental Table 4). However, there was a trend for an increase in 45S pre-rRNA concentration above baseline at 4 h (P = 0.088).
There was no group × time interaction observed for the expression of CMYC (P = 0.601, Figure 4A), EIF4E (P = 0.531, Figure 4B), NIP7 (P = 0.998, Figure 4C), TIF1A (P = 0.764, Figure 4D), POLR1B (P = 0.948, Figure 4E), and UBF (P = 0.987, Figure 4F). There was a main effect of time for increased expression above baseline at 2 and 4 h for CMYC (P < 0.001), EIF4E (P < 0.001), and NIP7 (P ≤ 0.002), and above baseline at 4 h only for TIF1A (P ≤ 0.001) and POLR1B (P ≤ 0.005). In addition, the expression of EIF4E (P = 0.001), NIP7 (P = 0.037), TIF1A (P = 0.001) and POLR1B (P = 0.005) was higher at 4 h than 2 h. There was a main effect of time for decreased expression of UBF below baseline at 2 and 4 h (P ≤ 0.003). In addition, UBF expression at 4 h was lower than expression at 2 h (P = 0.026).
FIGURE 4.

Tukey's box and whisker plots illustrate the changes in ribosome biogenesis regulatory genes CMYC (A), EIF4E (B), NIP7 (C), TIF1A (D), POLR1B (E), and UBF (F) after consumption of mMPC, CAS, or MPC protein beverages at 2 and 4 h in healthy young men. Middle horizontal line represents the median, values displayed as 95% CI, n = 10/group. Data were analyzed with 2-factor repeated measures ANOVA. *Indicates significant difference to baseline ( P ≤ 0.05). #Indicates when 4 h is significantly different to 2 h (P ≤ 0.05). A horizontal bar indicates a main effect of time for all 3 groups. CAS, calcium caseinate; EIF4E, eukaryote initiation factor 4E; mMPC, mineral modified milk protein concentrate; MPC, milk protein concentrate; NIP7, 60S ribosome subunit biogenesis protein NIP7 homolog; POLR1B, RNA polymerase I subunit B; TIF1A, transcription initiation factor IA; UBF, upstream binding factor; 3HK, the 3 most stable housekeeper genes.
Anabolic signaling
There was no group × time interaction of either phosphorylation site of AKT (AKTThr308, P = 0.509, Figure 5A; AKTSer473, P = 0.973, Figure 5B). There was a main effect of time for increased phosphorylation above baseline at 2 h for AKTThr308 (P < 0.001), followed by decreased expression at 4 h below that seen at 2 h (P = 0.002). There was a main effect of time for decreased phosphorylation at 4 h below baseline and 2 h for AKTSer473 (P ≤ 0.002).
FIGURE 5.

Tukey’s box and whisker plots illustrate the changes in anabolic signaling targets via the mTOR pathway, AKTThr308 (A), AKTSer473 (B), P70S6KThr389 (C), P70S6KThr421/Ser424 (D), RPS6Ser235/236 (E), and RPS6Ser240/244 (F) after consumption of mMPC, CAS, or MPC protein beverages at 2 and 4 h in healthy young men. Middle horizontal line represents the median, values displayed at 95% CI, n = 10/group. Data were analyzed with 2-factor repeated measures ANOVA. *Indicates significant difference to baseline (P ≤ 0.05). #Indicates when 4 h is significantly different to 2 h (P ≤ 0.05). A horizontal bar indicates a main effect of time for all 3 groups. AKT, protein kinase B; CAS, calcium caseinate; GAPDH, glyceraldehyde 3 phosphate dehydrogenase; mMPC, mineral modified milk protein concentrate; MPC, milk protein concentrate; mTOR, mechanistic target of rapamycin; P70S6K, ribosomal protein S6 kinase beta 1; RPS6, ribosomal protein S6.
There was no group × time interaction of either phosphorylation site of P70S6K (P70S6KThr389, P = 0.600, Figure 5C; P70S6KThr421/Ser424, P = 0.200, Figure 5D). There was a main effect of time for increased phosphorylation above baseline for P70S6KThr389 and P70S6KThr421/Ser424 at 2 h (P < 0.001 and P < 0.001, respectively) and 4 h (P < 0.001 and P = 0.001, respectively). Phosphorylation of P70S6KThr421/Ser424 at 4 h had decreased from 2 h (P = 0.023).
There was no group × time interaction of either phosphorylation site of RPS6 (RPS6Ser235/236, P = 0.780, Figure 5E; RPS6Ser240/244, P = 0.825, Figure 5F). There was a main effect of time for increased phosphorylation above baseline for RPS6Ser235/236 and RPS6Ser240/244 at 2 h (P < 0.001 and P < 0.001, respectively) and 4 h (P < 0.001 and P < 0.001, respectively). Phosphorylation of RPS6Ser235/236 and RPS6Ser240/244 at 4 h had decreased from 2 h (P = 0.012 and P = 0.010, respectively).
Phosphorylation of 4EBP1 was measured by a mobility shift of the electrophoretic bands as described by Kimball et al. (33) and us (34). There was no group × time interaction for 4EBP1α (P = 0.443, Figure 6A), 4EBP1β (P = 0.485, Figure 6B), 4EBP1γ (P = 0.143, Figure 6C), and 4EBP1δ (P = 0.283, Figure 6D). There was a main effect of time for increased phosphorylation above baseline at 2 h for 4EBP1α, 4EBP1β, 4EBP1γ, and 4EBP1δ (P = 0.008; P < 0.001; P < 0.001; P < 0.001, respectively), and at 4 h for 4EBP1γ and 4EBP1δ (P = 0.041 and P = 0.001, respectively). Phosphorylation of 4EBP1δ at 4 h had decreased from 2 h (P = 0.030).
FIGURE 6.
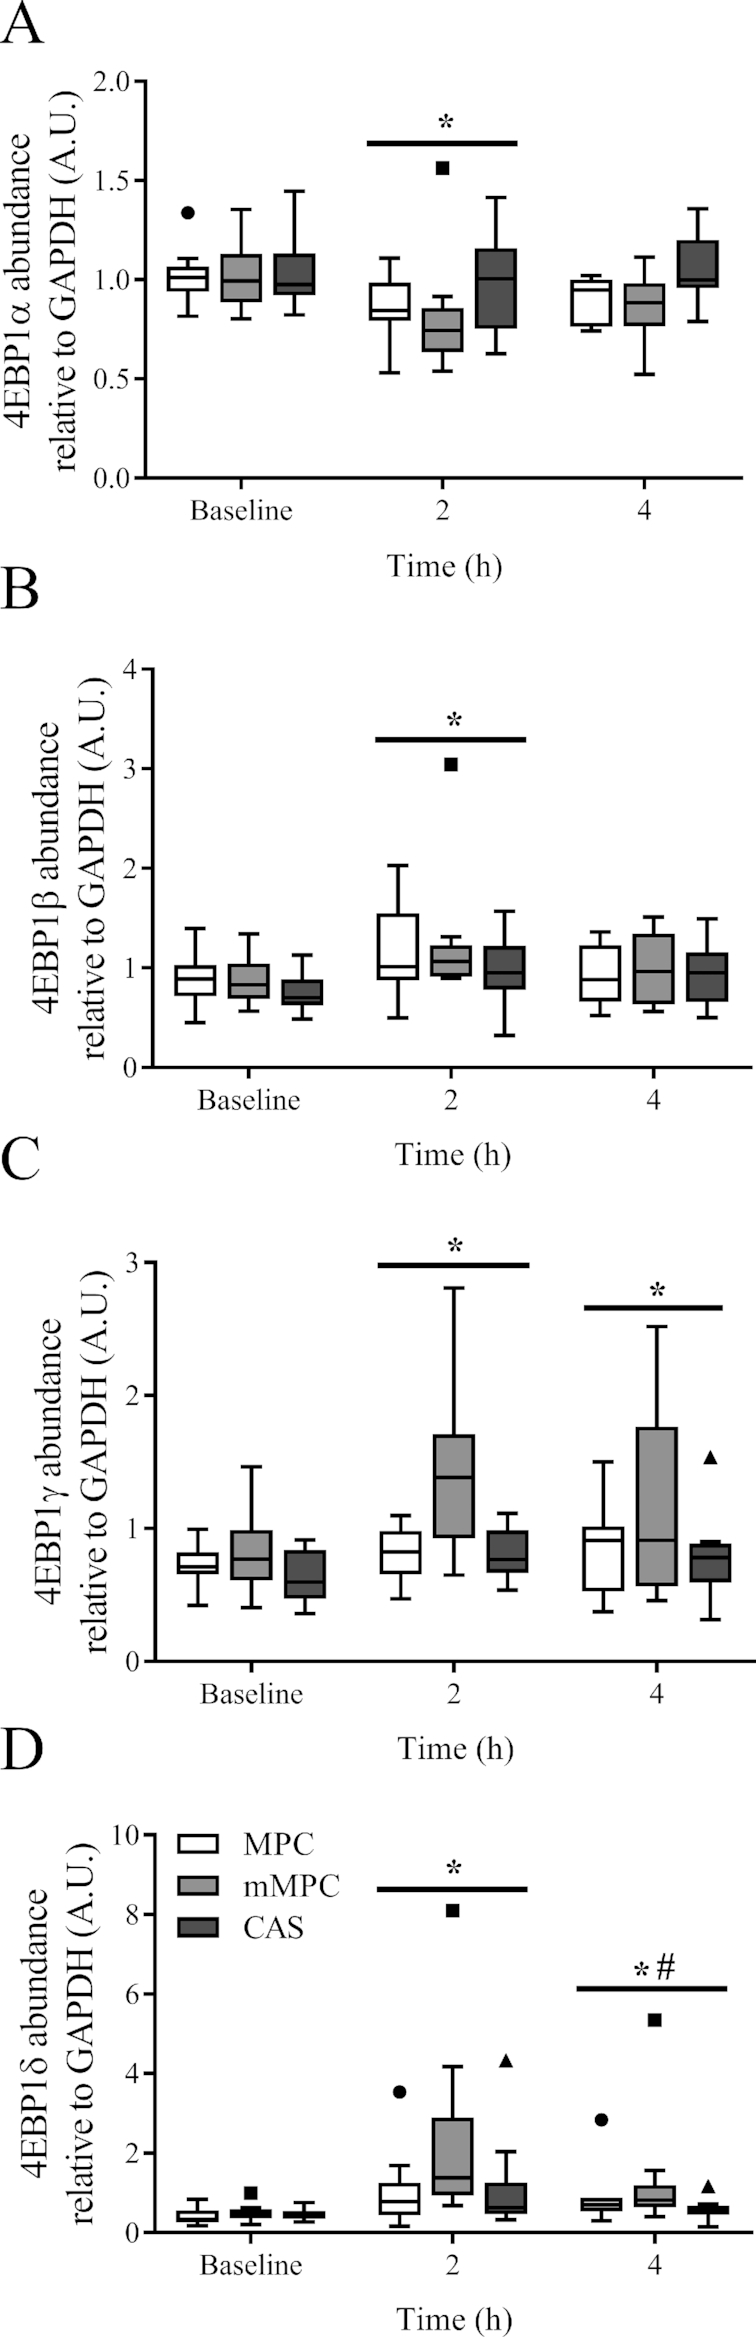
Tukey's box and whisker plots illustrate the changes in phosphorylation of 4EBP1α (A), 4EBP1β (B), 4EBP1γ (C), and 4EBP1δ (D) after consumption of mMPC, CAS, or MPC protein beverages at 2 and 4 h in healthy young men. Middle horizontal line represents the median, values displayed at 95% CI, n = 10/group. Data were analyzed with 2-factor repeated measures ANOVA. *Indicates significant difference to baseline (P ≤ 0.05). #Indicates when 4 h is significantly different to 2 h (P ≤ 0.05). A horizontal bar indicates a main effect of time for all 3 groups. CAS, calcium caseinate; GAPDH, glyceraldehyde 3 phosphate dehydrogenase; mMPC, mineral modified milk protein concentrate; MPC, milk protein concentrate; 4EBP1, eukaryotic translation initiation factor 4E binding protein 1.
Thr197/202 Thr197/202There was no group × time interaction for phosphorylation of targets along the MAPK signaling cascade (P38 MAPKThr180/182, P = 0.300, Figure 7A; MNKThr197 /202, P = 0.719, Figure 7B; ERK1/2Thr202/204, P = 0.081, Figure 7C; P90RSKSer380, P = 0.260, Figure 7D). There was a main effect of time for increased phosphorylation at 2 h for P38 MAPKThr180/182, MNK, and P90RSKSer380 (P < 0.001; P < 0.001; P = 0.022, respectively), and at 4 h for P38 MAPKThr180/182, MNK, and P90RSKSer380 (P = 0.001; P < 0.001; P = 0.040, respectively).
FIGURE 7.
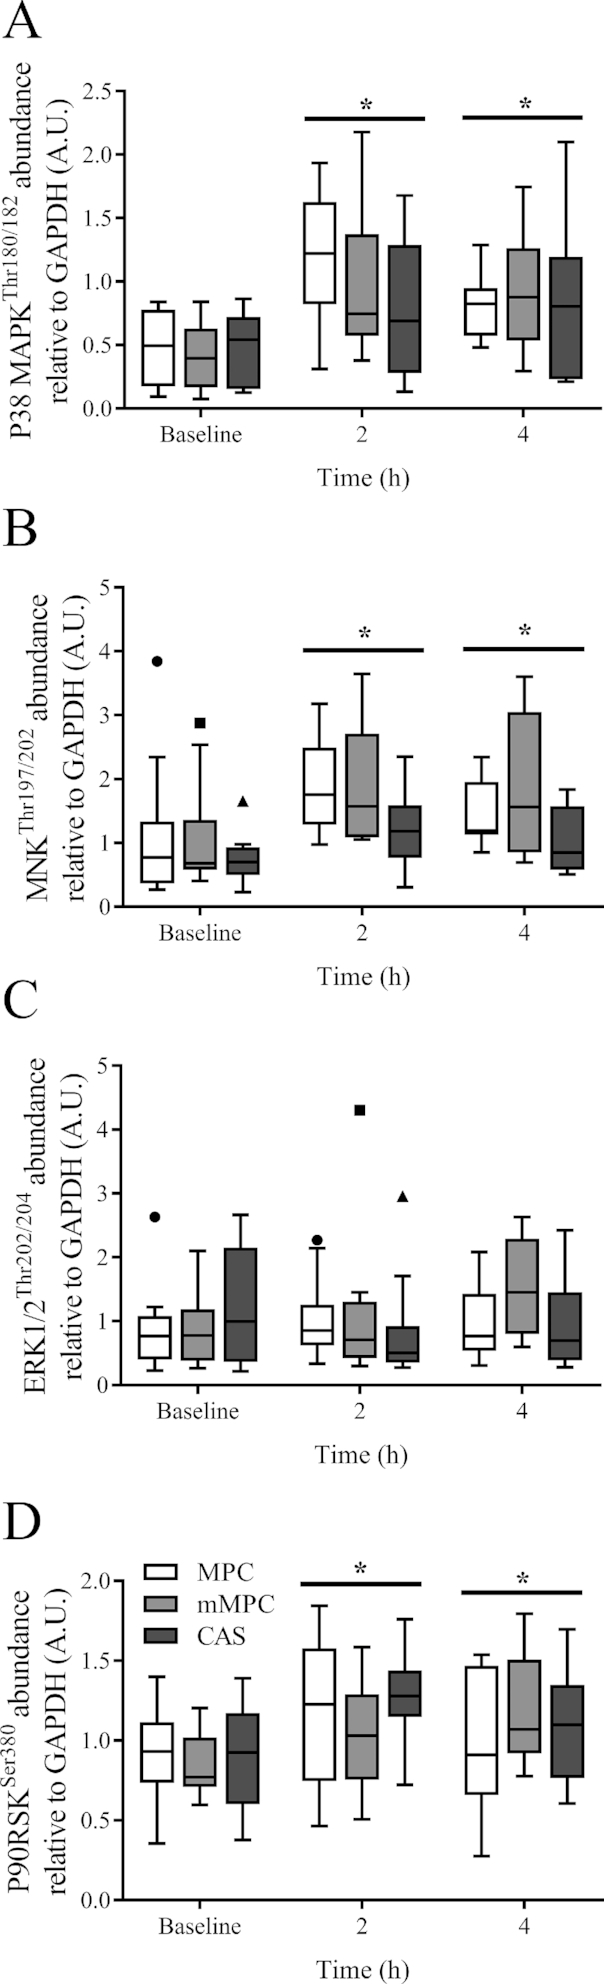
Tukey's box and whisker plots illustrate the changes in MAPK signaling cascade, P38 MAPKThr180/182 (A), MNKThr197/202 (B), ERK1/2Thr202/204 (C), and P90RSKSer380 (D) after consumption of mMPC, CAS, or MPC protein beverages at 2 and 4 h in healthy young men. Middle horizontal line represents the median, values displayed at 95% CI, n = 10/group. Data were analyzed with 2-factor repeated measures ANOVA. *Indicates significant difference to baseline (P ≤ 0.05). A horizontal bar indicates a main effect of time for all 3 groups. CAS, calcium caseinate; ERK1/2, extracellular signal regulated kinase 1/2; GAPDH, glyceraldehyde 3 phosphate dehydrogenase; mMPC, mineral modified milk protein concentrate; MNK, mitogen activated protein kinase interacting protein kinase; MPC, milk protein concentrate; P38 MAPK, P38 mitogen activated protein kinase; P90RSK, P90 ribosomal S6 kinase.
Muscle fractional synthesis rate
Resting myofibrillar fractional synthesis rate (FSR) was calculated over a 3 h baseline incorporation period and there was no group × time interaction (P = 0.560, Figure 8A). The FSR for the first 2 h after consumption of the protein beverage was elevated above baseline (P = 0.006) with no difference between groups. The FSR between 2 and 4 h remained elevated above baseline (P < 0.001), and not different to that during the first 2 h (P = 0.132). FSR was elevated above baseline even when expressed as an aggregate rate from 0 to 4 h (0.062 ± 0.027%, P < 0.001, Figure 8B). There was no group × time interaction for translation efficiency (P = 0.575, Figure 8C). However, this was elevated above baseline at 2 and 4 h (P = 0.028 and P = 0.002, respectively).
FIGURE 8.
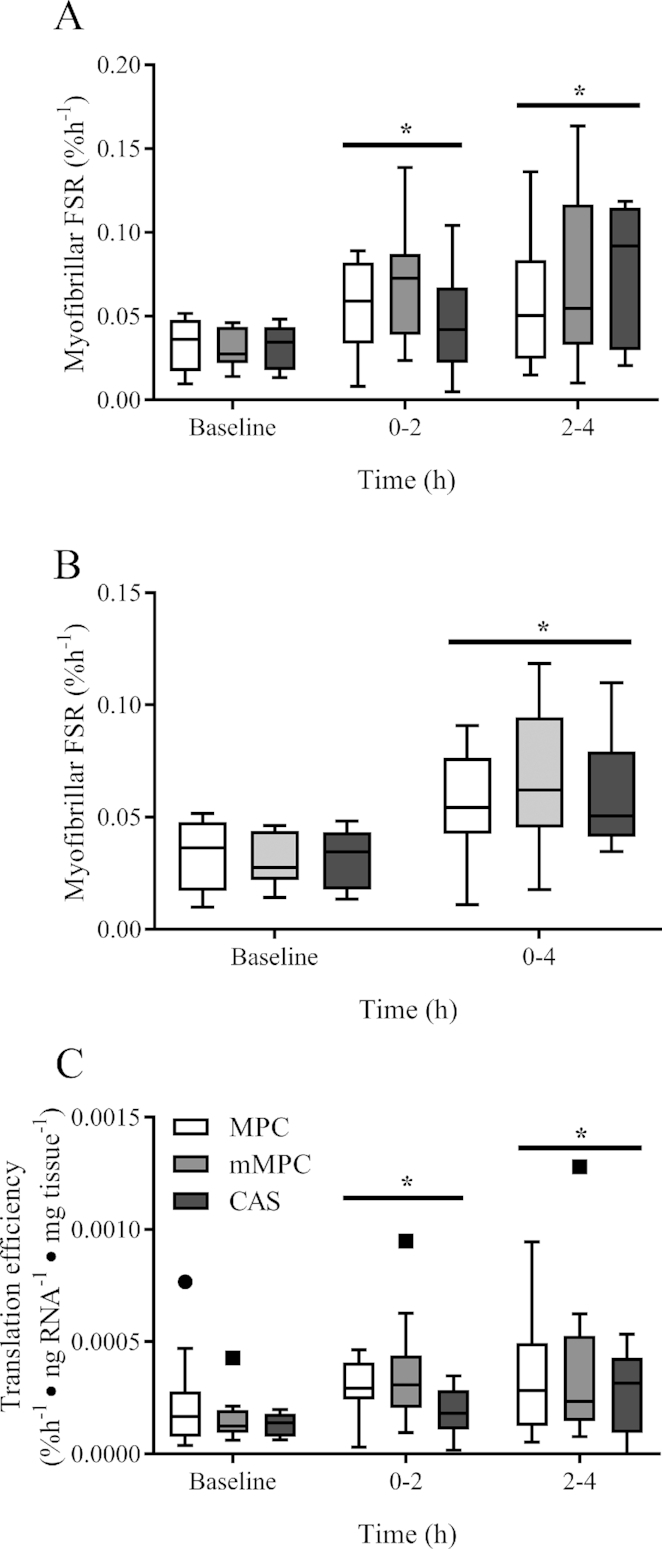
Tukey's box and whisker plots illustrate the changes in myofibrillar fractional synthesis rate (A), aggregated myofibrillar fractional synthesis rate (B), and translation efficiency of FSR relative to RNA concentration per mg of tissue (C) after consumption of mMPC, CAS, or MPC protein beverages between baseline and 4 h in healthy young men. Middle horizontal line represents the median, values displayed at 95% CI, n = 10/group. Data were analyzed with 2-factor repeated measures ANOVA. *Indicates significant difference to baseline (P ≤ 0.05). #Indicates when 4 h is significantly different to 2 h (P ≤ 0.05). A horizontal bar indicates a main effect of time for all 3 groups. CAS, calcium caseinate; mMPC, mineral modified milk protein concentrate; MPC, milk protein concentrate.
There was a group × time interaction for plasma isotope enrichment (P = 0.031, Figure 9), such that at 60 min mMPC was less than MPC (P = 0.027) and CAS (P = 0.048). Plasma phenylalanine enrichment was above baseline at 30, 60, 90, and 120 min in MPC (P ≤ 0.016) and CAS (P ≤ 0.037).
FIGURE 9.
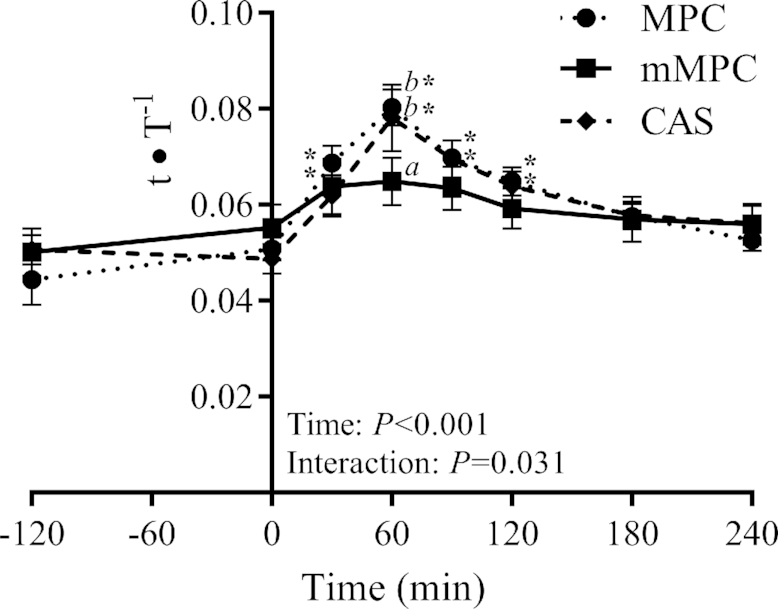
Plasma concentration of l-[ring-13C6]-phenylalanine enrichment (tracee-to-tracer ratio; t∙T−1) 180 min before and 240 min after consumption of mMPC, CAS, or MPC protein beverages in healthy young men. Values represent means ± SEMs, n = 10/group. Data were analyzed with 2-factor repeated measures ANOVA. Labelled means without a common letter differ at that time point. *Different from respective group's baseline. CAS, calcium caseinate; mMPC, mineral modified milk protein concentrate; MPC, milk protein concentrate.
Discussion
The importance of large increases in blood leucine and essential amino acid concentrations in regulation of postexercise anabolic potential has not been clearly defined in response to bolus protein ingestion. The present study characterized anabolic signaling mechanisms and postexercise MPS in response to a dairy protein source specifically processed to result in a more pronounced aminoacidemia when compared with its native state. We showed that the ingestion of 25 g mMPC resulted in a much larger, but more transient, plasma EAA response despite being matched for AA content with standard MPC. However, these overt differences in plasma aminoacidemia, net exposure of amino acids (leucine and EAAs), and insulin responses induced by the mMPC condition did not enhance postexercise MPS, anabolic signaling mechanisms, or markers of ribosome biogenesis when compared with MPC or CAS conditions. As such, the magnitude or timing of peak amplitude of aminoacidemia does not regulate the anabolic response when a maximal dose of high-quality dairy protein is consumed immediately after resistance exercise in untrained young men.
Previous studies have shown the importance of manipulating blood EAA concentrations within close temporal proximity of exercise bouts to maximize anabolic action on muscles. For example, the postexercise MPS response to quickly and slowly digesting proteins, such as whey and casein, respectively, have been previously examined. It has been shown that whey protein ingestion resulted in a superior postexercise MPS response when compared with the ingestion of casein (14, 17), whereas other groups observed no differences (21, 22). The ability of these studies to isolate the effects of the degree of aminoacidemia on muscle anabolic potential is confounded by the differences in AA composition between whey and casein. To overcome this limitation, studies have been conducted in which postexercise peak aminoacidemia has been manipulated by feeding the same dose of protein as a single bolus or a number of pulsed feeds. These studies show that bolus feeding gives a larger but more transient aminoacidemia result in greater postexercise MPS (16, 19). However, the pulsed feeding pattern is a possible confounder. The present study is unique as mMPC was specifically manufactured to manipulate aminoacidemia while matching both AA composition and feeding pattern, in conjunction with resistance exercise to sensitize the muscle to feeding. Our results do not support a role of the pattern of plasma aminoacidemia in enhancing mTOR signaling pathways or MPS when a 25 g bolus dose of protein is consumed during recovery from resistance exercise in young men.
According to the leucine trigger hypothesis, blood leucine concentrations, as a proxy for intramuscular concentrations, have been suggested to reflect the magnitude of the MPS response (14, 35). However, the results from the current study did not reflect this hypothesis as the peak leucine concentration from mMPC was much greater than MPC and CAS, but the stimulation of postexercise MPS was the same between all 3 protein supplements. Indeed, it is likely that the minimal stimulatory leucine threshold was achieved in all ingested protein conditions to stimulate a robust MPS response. However, our current finding is in agreement with multiple recent studies that have shown that peak blood leucine concentrations do not appear to be a primary determinant of the magnitude of the MPS response both at rest and after exercise in middle-aged and older adults (23, 24, 30, 36). These findings add further support to other work showing (21, 24, 37) that once a maximal dose of higher-quality protein is ingested, additional modifications to change the intrinsic qualities of the protein being ingested have minimal bearing on the postexercise MPS response. Churchward-Venne et al. have shown that whey protein was able to sustain the MPS response for a longer duration than a smaller dose of whey protein supplemented with EAA and leucine during recovery from resistance exercise (38). Hence, it is possible that whey protein may contain anabolic components, other than amino acids, which could be responsible for some of its previously observed benefits (39). However, it is likely that in most cases when a sufficient dose of protein is provided, whey and MPC would induce similar anabolic responses even after exercise.
Recent evidence has suggested resistance training-induced muscle hypertrophy may be related to increased translational capacity through the process of ribosome biogenesis (10). Ribosome biogenesis is the process of synthesizing new ribosomes from ribosomal RNA. However, few studies have examined the role of nutrition in regulating postexercise ribosome biogenesis, yet it has been suggested that dairy protein might augment this response (12). The current study did not find any changes in the rRNA markers (45S pre-rRNA, 28S, 18S, 5.8S, and 5S) associated with ribosome biogenesis up to 4 h after protein ingestion and resistance exercise. Previous studies have reported that 45S pre-rRNA does not change up to 3 h post exercise (10, 40, 41), but reported a ∼2-fold increase at 4 h post exercise (42) and a ∼1.5-fold increase at 24 h post exercise (41). In the current study, 45S pre-rRNA did not change up to 4 h post exercise, which disagrees with the findings from Nader et al. (42). The difference may be a result of the muscle group studied, where Nader et al. (42) exercised the biceps brachii, and the current study exercised the vastus lateralis. Previous work in the vastus lateralis did not observe an increase in 45S pre-rRNA in the early hours after exercise (10, 41). Despite this, in the current study, a trend for an increase for 45S pre-rRNA was observed at 4 h, which may indicate initiation of ribosome biogenesis. Genes including CMYC and NIP7, which regulate ribosome biogenesis, had increased expression at 4 h post exercise, suggesting that a later measurement time point would have been more appropriate to capture the ribosome biogenesis response.
The presumed difference in rates of phenylalanine appearance, based on the blood EAA concentrations, induced by the mMPC and the other 2 proteins resulted in differences in plasma precursor availability within the early postprandial phase between the conditions. We enriched the study beverages with a tracer to minimize disturbances in plasma tracer enrichment from the appearance of unlabeled dietary phenylalanine into circulation (43). Specifically, l-[ring-13C6]-phenylalanine was added to each beverage to account for ∼6% of total phenylalanine content, with the same amount being added to each beverage to maintain blinding. This resulted in a transient increase in plasma tracer enrichment in the CAS and MPC groups and a disruption of steady-state isotopic enrichment. Thus, it is possible we are providing a low estimate of the MPS response in the MPC and CAS conditions during the early postexercise period (0–120 min). However, when considering the entire postprandial period (0–240 min) this tracer disruption is less germane. Given that the MPC and CAS MPS responses were equivalent to the response elicited by mMPC, despite a slight underestimation of early MPS in the CAS and MPC groups, it is unlikely that tracer disruption had a bearing on refutation of the hypothesis that mMPC would induce a greater MPS response than MPC or CAS.
Currently, ∼20 g is accepted to be the maximal dose of high-quality protein required to maximally stimulate MPS after lower body exercise in young adults (43, 44). The current study provided 25 g to account for individuals with larger body masses to ensure that each would be consuming a maximal dose (45). The present study does not support the role of aminoacidemia in regulating MPS, anabolic signaling, or ribosome biogenesis when a maximal dose of protein was ingested, but it is unknown if aminoacidemia may play a role in regulating MPS in response to suboptimal doses of protein or in more clinically compromised populations.
Supplementary Material
Acknowledgments
The authors’ responsibilities were as follows—CJM, DC-S, DSP, ACF, and NAB: designed the study; AHC, CJM, and RFD: collected the data; AHC, RDF, JWB, UP, NZ, ZL, and NAB: analyzed the data; CJM and AHC: conducted the statistical analysis; AHC and CJM: wrote the paper; CJM: takes final responsibility for the contents of the manuscript; and all authors: edited the manuscript and approved the final paper.
Notes
Supported by New Zealand Primary Growth Partnership (PGP) post-farm gate program, funded by Fonterra Co-operative Group Ltd and the NZ Ministry for Primary Industries (MPI).
Author disclosures: AHC, JWB, NZ, UP, ZL, and NAB, no conflicts of interest; DC-S, CJM, and RFD received financial support from the New Zealand Primary Growth Partnership (PGP) post-farm gate program, funded by Fonterra Co-operative Group Ltd and the NZ Ministry for Primary Industries (MPI), to conduct this study. SDP is the Fonterra Chair in Human Nutrition, University of Auckland; ACF is a current employee of Fonterra Co-operative Group Ltd.
Supplemental Tables 1–4 and Supplemental Figure 1 are available from the “Supplementary data” link in the online posting of the article and from the same link in the online table of contents at https://academic.oup.com/jn/.
Abbreviations used: AKT, protein kinase B; CAS, calcium caseinate; EAA, essential amino acid; EIF4E, eukaryote initiation factor 4E; ERK1/2, extraceullar signal regulated kianse 1/2; FSR, fractional synthetic rate; GAPDH, glyceraldehyde 3 phosphate dehydrogenase; mMPC, mineral modified milk protein concentrate; MPC, milk protein concentrate; MPS, muscle protein synthesis; MNK, mitogen activated protein kinase interacting protein kinase; mTOR, mechanistic target of rapamycin; NEAA, nonessential amino acid; NIP7, 60S ribosome subunit biogenesis protein NIP7 homolog; POLR1B, RNA polymerase I subunit B; pre-rRNA, pre-ribosomal RNA; P38 MAPK, P38 mitogen activated protein kinase; P70S6K, ribosomal protein S6 kinase beta 1; P90RSK, P90 ribosomal S6 kinase; RPS6, ribosomal protein S6; TAA, total amino acid; TIF1A, transcription initiation factor 1A; UBF, upstream binding factor; 1RM, 1 repetition maximum; 4EBP1, eukaryotic translation initiation factor 4E binding protein 1.
References
- 1. Kim TN, Choi KM.. Sarcopenia: definition, epidemiology, and pathophysiology. J Bone Metab. 2013;20(1):1–10. [DOI] [PMC free article] [PubMed] [Google Scholar]
- 2. Cruz-Jentoft AJ, Baeyens JP, Bauer JM, Boirie Y, Cederholm T, Landi F, Martin FC, Michel J-P, Rolland Y, Schneider SM et al.. Sarcopenia: European Consensus on Definition and Diagnosis: Report of the European Working Group on Sarcopenia in Older People. Age Ageing. 2010;39(4):412–23. [DOI] [PMC free article] [PubMed] [Google Scholar]
- 3. Keller K, Engelhardt M.. Strength and muscle mass loss with aging process. Age and strength loss. Muscles Ligaments Tendons J. 2013;3(4):346–50. [PMC free article] [PubMed] [Google Scholar]
- 4. Phillips SM. A brief review of critical processes in exercise-induced muscular hypertrophy. Sport Med. 2014;44(Suppl 1):71–7. [DOI] [PMC free article] [PubMed] [Google Scholar]
- 5. Drummond MJ, Dreyer HC, Fry CS, Glynn EL, Rasmussen BB. Nutritional and contractile regulation of human skeletal muscle protein synthesis and mTORC1 signaling. J Appl Physiol. 2009;106(4):1374–84. [DOI] [PMC free article] [PubMed] [Google Scholar]
- 6. Nakada S, Ogasawara R, Kawada S, Maekawa T, Ishii N. Correlation between ribosome biogenesis and the magnitude of hypertrophy in overloaded skeletal muscle. PLoS One. 2016;11(1):e0147284. [DOI] [PMC free article] [PubMed] [Google Scholar]
- 7. Wen Y, Alimov AP, McCarthy JJ. Ribosome biogenesis is necessary for skeletal muscle hypertrophy. Exerc Sport Sci Rev. 2016;44(3):110–5. [DOI] [PMC free article] [PubMed] [Google Scholar]
- 8. Brook MS, Wilkinson DJ, Mitchell WK, Lund JN, Szewczyk NJ, Greenhaff PL, Smith K, Atherton PJ. Skeletal muscle hypertrophy adaptations predominate in the early stages of resistance exercise training, matching deuterium oxide-derived measures of muscle protein synthesis and mechanistic target of Rapamycin Complex 1 signaling. FASEB J. 2015;29(11):4485–96. [DOI] [PubMed] [Google Scholar]
- 9. Figueiredo VC, McCarthy JJ.. Regulation of ribosome biogenesis in skeletal muscle hypertrophy. Physiology. 2018;34(1):30–42. [DOI] [PMC free article] [PubMed] [Google Scholar]
- 10. Figueiredo VC, Caldow MK, Massie V, Markworth JF, Cameron-Smith D, Blazevich AJ. Ribosome biogenesis adaptation in resistance training-induced human skeletal muscle hypertrophy. Am J Physiol Endocrinol Metab. 2015;309(1):E72–83. [DOI] [PubMed] [Google Scholar]
- 11. Stec MJ, Kelly NA, Many GM, Windham ST, Tuggle SC, Bamman MM. Ribosome biogenesis may augment resistance training-induced myofiber hypertrophy and is required for myotube growth in vitro. Am J Physiol Endocrinol Metab. 2016;310(8):E652–61. [DOI] [PMC free article] [PubMed] [Google Scholar]
- 12. Figueiredo VC, Zeng N, D'Souza RF, Markworth JF, Della Gatta PA, Petersen A, Barnett MPG, Cameron-Smith D. High dose of whey protein after resistance exercise promotes 45 S preribosomal RNA synthesis in older men. Nutrition. 2017;50:105–7. [DOI] [PubMed] [Google Scholar]
- 13. Dangin M, Boirie Y, Garcia-Rodenas C, Gachon P, Fauquant J, Callier P, Ballevre O, Beaufrere B. The digestion rate of protein is an independent regulating factor of postprandial protein retention. Am J Physiol Endocrinol Metab. 2001;280(2):E340–8. [DOI] [PubMed] [Google Scholar]
- 14. Tang JE, Moore DR, Kujbida GW, Tarnopolsky MA, Phillips SM. Ingestion of whey hydrolysate, casein, or soy protein isolate: effects on mixed muscle protein synthesis at rest and following resistance exercise in young men. J Appl Physiol. 2009;107(3):987–92. [DOI] [PubMed] [Google Scholar]
- 15. Burd NA, Yang Y, Moore DR, Tang JE, Tarnopolsky MA, Phillips SM. Greater stimulation of myofibrillar protein synthesis with ingestion of whey protein isolate v. micellar casein at rest and after resistance exercise in elderly men. Br J Nutr. 2012;108:958–62. [DOI] [PubMed] [Google Scholar]
- 16. West DWD, Burd NA, Coffey VG, Baker SK, Burke LM, Hawley JA, Moore DR, Stellingwerff T, Phillips SM. Rapid aminoacidemia enhances myofibrillar protein synthesis and anabolic intramuscular signaling responses after resistance exercise. Am J Clin Nutr. 2011;94(3):795–803. [DOI] [PubMed] [Google Scholar]
- 17. Pennings B, Boirie Y, Senden JMG, Gijsen AP, Kuipers H, Van Loon LJC. Whey protein stimulates postprandial muscle protein accretion more effectively than do casein and casein hydrolysate in older men. Am J Clin Nutr. 2011;93:997–1005. [DOI] [PubMed] [Google Scholar]
- 18. Boirie Y, Dangin M, Gachon P, Vasson MP, Maubois JL, Beaufrere B. Slow and fast dietary proteins differently modulate postprandial protein accretion. Proc Natl Acad Sci U S A. 1997;94(26):14930–5. [DOI] [PMC free article] [PubMed] [Google Scholar]
- 19. Areta JL, Burke LM, Ross ML, Camera DM, West DWD, Broad EM, Jeacocke NA, Moore DR, Stellingwerff T, Phillips SM et al.. Timing and distribution of protein ingestion during prolonged recovery from resistance exercise alters myofibrillar protein synthesis. J Physiol. 2013;591(9):2319–31. [DOI] [PMC free article] [PubMed] [Google Scholar]
- 20. Tipton KD, Elliott TA, Cree MG, Wolf SE, Sanford AP, Wolfe RR. Ingestion of casein and whey proteins result in muscle anabolism after resistance exercise. Med Sci Sports Exerc. 2004;36(12):2073–81. [DOI] [PubMed] [Google Scholar]
- 21. Reitelseder S, Agergaard J, Doessing S, Helmark IC, Lund P, Kristensen NB, Frystyk J, Flyvbjerg A, Schjerling P, Van Hall G et al.. Whey and casein labeled with L-[1-13C]leucine and muscle protein synthesis: effect of resistance exercise and protein ingestion. Am J Physiol Endocrinol Metab. 2011;300:E231–42. [DOI] [PubMed] [Google Scholar]
- 22. Dideriksen KJ, Reitelseder S, Petersen SG, Hjort M, Helmark IC, Kjaer M, Holm L. Stimulation of muscle protein synthesis by whey and caseinate ingestion after resistance exercise in elderly individuals. Scand J Med Sci Sports. 2011;21(6):e372–83. [DOI] [PubMed] [Google Scholar]
- 23. Reidy PT, Walker DK, Dickinson JM, Gundermann DM, Drummond MJ, Timmerman KL, Fry CS, Borack MS, Cope MB, Mukherjea R et al.. Protein blend ingestion following resistance exercise promotes human muscle protein synthesis. J Nutr. 2013;143(4):410–6. [DOI] [PMC free article] [PubMed] [Google Scholar]
- 24. Borack MS, Reidy PT, Husaini SH, Markofski MM, Deer RR, Richison AB, Lambert BS, Cope MB, Mukherjea R, Jennings K et al.. Soy-dairy protein blend or whey protein isolate ingestion induces similar postexercise muscle mechanistic target of rapamycin complex 1 signaling and protein synthesis responses in older men. J Nutr. 2016;146(12):2468–75. [DOI] [PMC free article] [PubMed] [Google Scholar]
- 25. Mitchell WK, Phillips BE, Williams JP, Rankin D, Lund JN, Wilkinson DJ, Smith K, Atherton PJ. The impact of delivery profile of essential amino acids upon skeletal Muscle protein synthesis in older men: clinical efficacy of pulse vs. bolus supply. Am J Physiol Endocrinol Metab. 2015;309(5):E450–7. [DOI] [PubMed] [Google Scholar]
- 26. Brzycki M. Strength testing—predicting a one-rep max from reps-to-fatigue. J Phys Educ Recreat Danc. 1993;64(1):88–90. [Google Scholar]
- 27. Roza AM, Shizgal HM.. The Harris–Benedict equation reevaluated: resting energy requirements and the body cell mass. Am J Clin Nutr. 1984;40(1):168–82. [DOI] [PubMed] [Google Scholar]
- 28. Mitchell CJ, Zeng N, D'Souza RF, Mitchell SM, Aasen K, Fanning AC, Poppitt SD, Cameron-Smith D. Minimal dose of milk protein concentrate to enhance the anabolic signalling response to a single bout of resistance exercise; a randomised controlled trial. J Int Soc Sports Nutr. 2017;14:17. [DOI] [PMC free article] [PubMed] [Google Scholar]
- 29. Milan AM, D'Souza RF, Pundir S, Pileggi CA, Thorstensen EB, Barnett MPG, Markworth JF, Cameron-Smith D, Mitchell CJ. Older adults have delayed amino acid absorption after a high protein mixed breakfast meal. J Nutr Health Aging. 2015;19(8):839–45. [DOI] [PubMed] [Google Scholar]
- 30. Mitchell CJ, McGregor RA, D'Souza RF, Thorstensen EB, Markworth JF, Fanning AC, Poppitt SD, Cameron-Smith D. Consumption of milk protein or whey protein results in a similar increase in muscle protein synthesis in middle aged men. Nutrients. 2015;7(10):8685–99. [DOI] [PMC free article] [PubMed] [Google Scholar]
- 31. Beals JW, Sukiennik RA, Nallabelli J, Emmons RS, van Vliet S, Young JR, Ulanov AV, Li Z, Paluska SA, De Lisio M et al.. Anabolic sensitivity of postprandial muscle protein synthesis to the ingestion of a protein-dense food is reduced in overweight and obese young adults. Am J Clin Nutr. 2016;104(4):1014–22. [DOI] [PubMed] [Google Scholar]
- 32. Mitchell CJ, McGregor R, Cameron-Smith D. Understanding the sensitivity of muscle protein synthesis to dairy protein in middle-aged men. Int Dairy J. 2017;63(Aug 2016):35–41. [Google Scholar]
- 33. Kimball SR, Gordon BS, Moyer JE, Dennis MD, Jefferson LS. Leucine induced dephosphorylation of Sestrin2 promotes mTORC1 activation. Cell Signal. 2016;28(8):896–906. [DOI] [PMC free article] [PubMed] [Google Scholar]
- 34. Zeng N, D'Souza RF, Sorrenson B, Merry TL, Barnett MPG, Mitchell CJ, Cameron-Smith D. The putative leucine sensor Sestrin2 is hyperphosphorylated by acute resistance exercise but not protein ingestion in human skeletal muscle. Eur J Appl Physiol. 2018;118(6):1241–53. [DOI] [PubMed] [Google Scholar]
- 35. Norton LE, Layman DK, Bunpo P, Anthony TG, Brana D V, Garlick PJ. The leucine content of a complete meal directs peak activation but not duration of skeletal muscle protein synthesis and mammalian target of rapamycin signaling in rats. J Nutr. 2009;139(6):1103–9. [DOI] [PubMed] [Google Scholar]
- 36. Churchward-Venne TA, Snijders T, Linkens AMA, Hamer HM, van Kranenburg J, van Loon LJC. Ingestion of casein in a milk matrix modulates dietary protein digestion and absorption kinetics but does not modulate postprandial muscle protein synthesis in older men. J Nutr. 2015;145(7):1438–45. [DOI] [PubMed] [Google Scholar]
- 37. Reitelseder S, Agergaard J, Doessing S, Helmark IC, Schjerling P, van Hall G, Kjaer M, Holm L. Positive muscle protein net balance and differential regulation of atrogene expression after resistance exercise and milk protein supplementation. Eur J Nutr. 2014;53(1):321–33. [DOI] [PubMed] [Google Scholar]
- 38. Churchward-Venne TA, Breen L, Di Donato DM, Hector AJ, Mitchell CJ, Moore DR, Stellingwerff T, Breuille D, Offord EA, Baker SK et al.. Leucine supplementation of a low-protein mixed macronutrient beverage enhances myofibrillar protein synthesis in young men: a double-blind, randomized trial. Am J Clin Nutr. 2014;99(2):276–86. [DOI] [PubMed] [Google Scholar]
- 39. Mobley CB, Mumford PW, McCarthy JJ, Miller ME, Young KC, Martin JS, Beck DT, Lockwood CM, Roberts MD. Whey protein-derived exosomes increase protein synthesis and hypertrophy in C2-C12 myotubes. J Dairy Sci. 2017;100(1):48–64. [DOI] [PubMed] [Google Scholar]
- 40. Fyfe JJ, Bishop DJ, Bartlett JD, Hanson ED, Anderson MJ, Garnham AP, Stepto NK. Enhanced skeletal muscle ribosome biogenesis, yet attenuated mTORC1 and ribosome biogenesis-related signalling, following short-term concurrent versus single-mode resistance training. Sci Rep. 2018;8(1):560. [DOI] [PMC free article] [PubMed] [Google Scholar]
- 41. Figueiredo VC, Roberts LA, Markworth JF, Barnett MPG, Coombes JS, Raastad T, Peake JM, Cameron-Smith D. Impact of resistance exercise on ribosome biogenesis is acutely regulated by post-exercise recovery strategies. Physiol Rep. 2016;4(2):e12670. [DOI] [PMC free article] [PubMed] [Google Scholar]
- 42. Nader GA, von Walden F, Liu C, Lindvall J, Gutmann L, Pistilli EE, Gordon PM. Resistance exercise training modulates acute gene expression during human skeletal muscle hypertrophy. J Appl Physiol. 2014;116(6):693 LP–702. [DOI] [PubMed] [Google Scholar]
- 43. Moore DR, Robinson MJ, Fry JL, Tang JE, Glover EI, Wilkinson SB, Prior T, Tarnopolsky MA, Phillips SM. Ingested protein dose response of muscle and albumin protein synthesis after resistance exercise in young men. Am J Clin Nutr. 2009;89(1):161–8. [DOI] [PubMed] [Google Scholar]
- 44. Witard OC, Jackman SR, Breen L, Smith K, Selby A, Tipton KD. Myofibrillar muscle protein synthesis rates subsequent to a meal in response to increasing doses of whey protein at rest and after resistance exercise. Am J Clin Nutr. 2014;99(1):86–95. [DOI] [PubMed] [Google Scholar]
- 45. Moore DR, Churchward-Venne TA, Witard O, Breen L, Burd NA, Tipton KD, Phillips SM. Protein ingestion to stimulate myofibrillar protein synthesis requires greater relative protein intakes in healthy older versus younger men. J Gerontol A Biol Sci Med Sci. 2015;70(1):57–62. [DOI] [PubMed] [Google Scholar]
Associated Data
This section collects any data citations, data availability statements, or supplementary materials included in this article.