Reporting summary
Further information on research design is available in the Nature Research Reporting Summary linked to this paper.
Alzheimer’s disease is an incurable neurodegenerative disorder in which neuroinflammation has a critical function1. However, little is known about the contribution of the adaptive immune response in Alzheimer’s disease2. Here, using integrated analyses of multiple cohorts, we identify peripheral and central adaptive immune changes in Alzheimer’s disease. First, we performed mass cytometry of peripheral blood mononuclear cells and discovered an immune signature of Alzheimer’s disease that consists of increased numbers of CD8+ T effector memory CD45RA+ (TEMRA) cells. In a second cohort, we found that CD8+ TEMRA cells were negatively associated with cognition. Furthermore, single-cell RNA sequencing revealed that T cell receptor (TCR) signalling was enhanced in these cells. Notably, by using several strategies of single-cell TCR sequencing in a third cohort, we discovered clonally expanded CD8+ TEMRA cells in the cerebrospinal fluid of patients with Alzheimer’s disease. Finally, we used machine learning, cloning and peptide screens to demonstrate the specificity of clonally expanded TCRs in the cerebrospinal fluid of patients with Alzheimer’s disease to two separate Epstein-Barr virus antigens. These results reveal an adaptive immune response in the blood and cerebrospinal fluid in Alzheimer’s disease and provide evidence of clonal, antigen-experienced T cells patrolling the intrathecal space of brains affected by age-related neurodegeneration.
Neuroinflammation is a pathological hallmark of Alzheimer’s disease (AD). Although much effort has been dedicated to understanding innate inflammation in AD, little is known about the adaptive immune response. The lymphatic system of the brain carries immune cells from the cerebrospinal fluid (CSF) and connects to the deep cervical lymph nodes3, enabling peripheral T cells to respond to brain antigens. However, whether T cells enter the brain to perpetuate neuroinflammation in AD is unknown.
Interaction between the T cell receptor (TCR) and antigen presented by the major histocompatibility complex (MHC) is critical to adaptive immunity. When T cells recognize cognate antigen, they clonally expand4. TCR sequences are so diverse that they are essentially unique to an individual T cell. Thus, finding two or more T cells with the same TCR sequence is evidence of clonal expansion5. Several small studies have reported changes in the distribution6–9, function and cytokine secretion of peripheral T cells10–12 in AD (Supplementary Table 1), but the antigens that drive these changes are unknown.
We integrated analyses of multiple cohorts and used several methods to assess adaptive immunity in AD (Fig. 1a). First, we used mass cytometry to study peripheral blood mononuclear cells (PBMCs) from patients with AD and patients with prodromal mild cognitive impairment (MCI) (cohort 1; Fig. 1a, Supplementary Table 2). We age-matched patients to cognitively typical, healthy control individuals (Extended Data Fig. 1a). In addition, we confirmed diagnoses as MCI or AD by: (1) reduced cognitive scores (Extended Data Fig. 1b); (2) reduced ratios of amyloid-β (Aβ):phosphorylated tau and Aβ:total tau within the CSF (Extended Data Fig. 1c, d); and (3) volumetric loss of brain regions as measured by magnetic resonance imaging (MRI) (Extended Data Fig. 1e). We developed a panel of immune markers (Supplementary Table 3) that enabled major subsets of PBMCs to be identified (Extended Data Fig. 2). We then used spanning-tree progression analysis of density-normalized events (SPADE) to perform unsupervised clustering (Extended Data Fig. 3a). Notably, we detected an increase in a population of CD8+ cells in patients with MCI or AD (cluster 63; Fig. 1b). Plotting all SPADE clusters for P value versus fold change, the cluster that was most highly increased among patients was cluster 63 (Extended Data Fig. 3b). Quantification of individual subjects revealed higher values for this cluster in patients with MCI or AD than controls (Fig. 1c). Finally, marker expression for this cluster corresponded to CD3+CD8+CD27− T effector memory CD45RA+ (TEMRA) cells (Fig. 1d)−a T cell population with potent effector functions that include the secretion of proinflammatory cytokines and cytotoxic molecules13.
Fig. 1 |. Peripheral CD8+ TEMRA cells are increased in AD and are negatively associated with cognition.
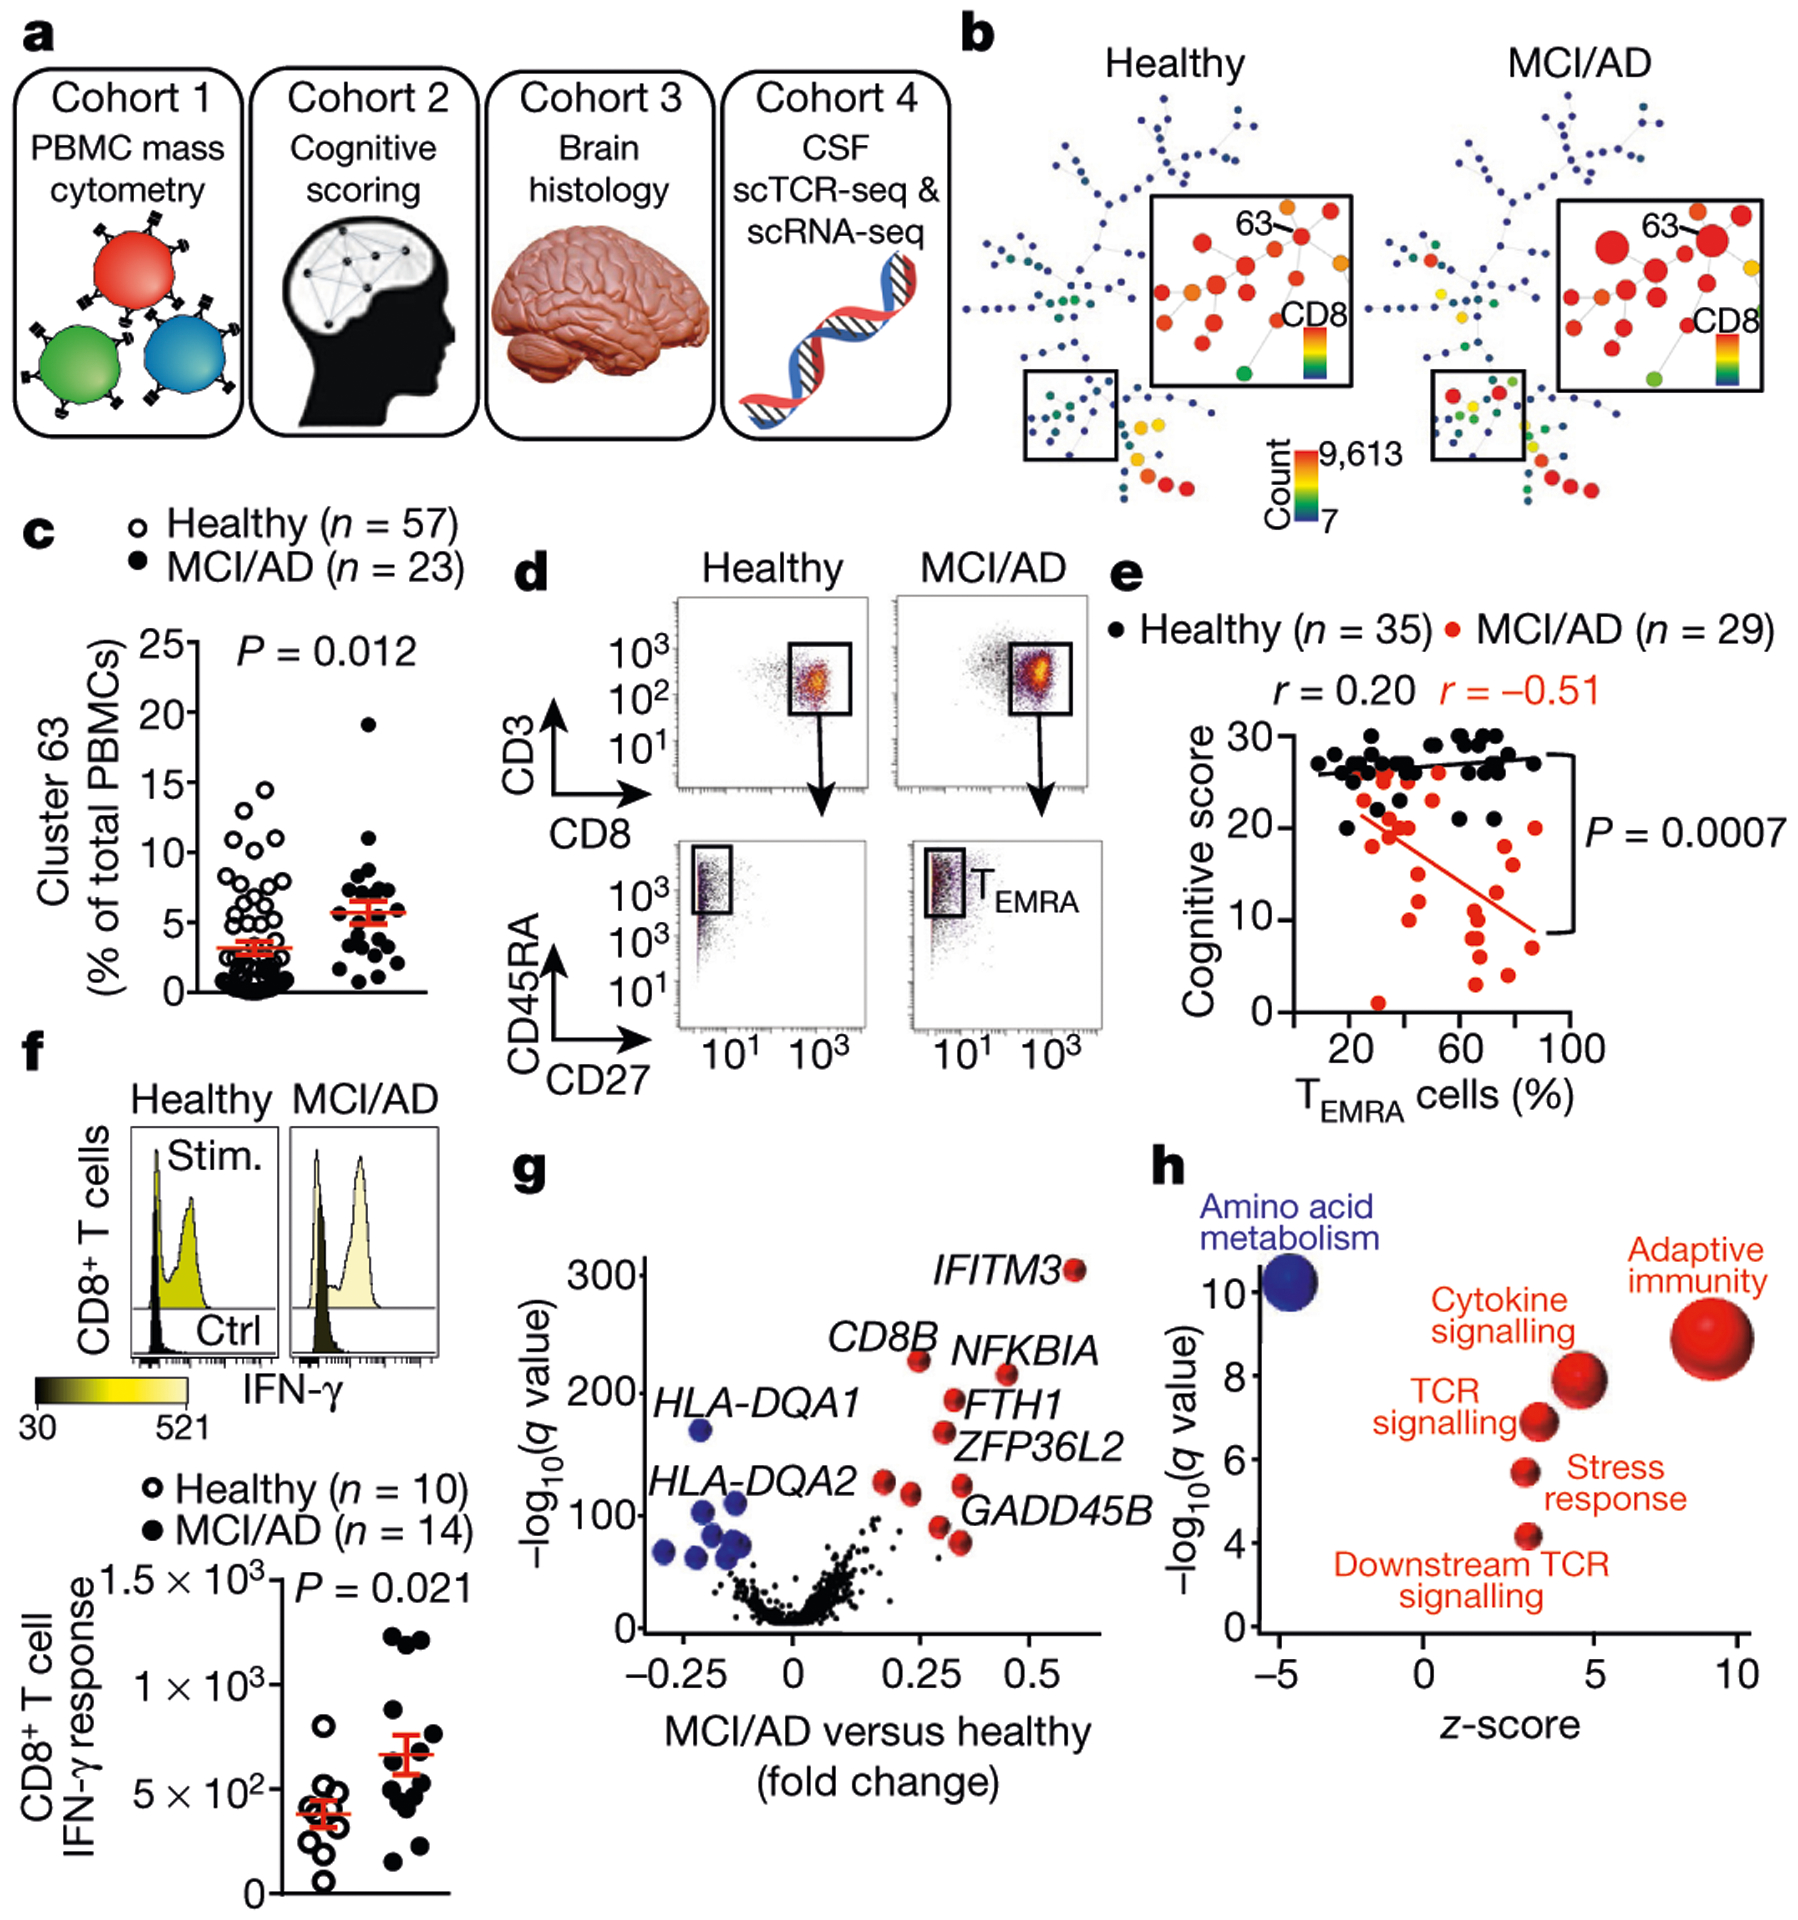
a, Four cohorts were used to assess adaptive immunity in AD. b, Representative SPADE trees of PBMCs from healthy individuals and patients with MCI or AD in cohort 1 show an increased abundance of a CD8+ cluster (cluster 63) in patients with MCI or AD. Background tree nodes are sized according to cell counts. Insets are coloured according to CD8 expression. c, Quantification of cluster 63 as a percentage of total PBMCs. The percentage of cluster 63 cells is significantly higher in patients with MCI or AD than healthy control individuals. Mean ± s.e.m.; unpaired two-sided t-test with Welch’s correction. d, Marker expression analysis of cluster 63 corresponds to a CD3+CD8+CD45RA+CD27− TEMRA population. Data in c, d were pooled from seven independent experiments with similar results. e, Linear regression showing the inverse correlation between cognitive score and the percentage of CD8+ TEMRA cells in individuals from cohort 2. Pearson’s correlation r values are shown for each group. The significance of the difference between the two data sets was measured by ANCOVA. f, Stimulation with PMA and ionomycin (stim.) induces increased expression of IFN-γ in CD8+ T cells from patients with MCI or AD. Mean ± s.e.m.; unpaired two-sided t-test with Welch’s correction. g, Differential expression analysis (scRNA-seq) of CD8+ Temra cells from healthy individuals (n = 7) and patients with MCI or AD (n = 6) shows upregulated TCR signalling. Model-based analysis of single-cell transcriptomics (MAST) differential expression test with Benjamini-Hochberg correction. h, Pathway analysis of differentially expressed genes in CD8+ TEMRA cells from patients with MCI or AD (n = 6 subjects) versus healthy individuals (n = 7 subjects) shows increased antigenic stimulation of CD8+ TEMRA cells in patients with MCI or AD. Fisher’s exact test with Benjamini-Hochberg correction. Pathways (circles) with positive z-scores are coloured red; those with negative z-scores are coloured blue. The size of the circle corresponds to the size of the z -score (two-sided).
We next used cluster identification, characterization and regression (CITRUS)14 to determine whether clusters could predict disease status. Notably, CITRUS identified a significantly altered cluster (arbitrarily numbered 229992) that corresponds to CD3+CD8+CD45RA+ T cells (Extended Data Fig. 3c). Quantification revealed higher percentages of this population in patient PBMCs than controls (Extended Data Fig. 3d). Moreover, marker expression again pointed to TEMRA cells (Extended Data Fig. 3e). Next, we used a regularized supervised learning algorithm from CITRUS to determine populations of T cells that predicted whether a sample belonged to healthy groups or those with disease. Notably, cluster 229992 combined with nine additional clusters was 80% predictive of disease (Extended Data Fig. 3f, Supplementary Table 4). Next, we used our mass cytometry dataset to derive 41 immune variables, which showed differences between patients and healthy controls in relation to CD8+ T cells (Supplementary Table 5). Specifically, we detected an increase in CD8+ T cells in patients versus controls (Extended Data Fig. 4a), with a concomitant decrease in the ratio of CD4+ to CD8+ T cells (Extended Data Fig. 4b). Subsets of CD8+ T cells were also altered in PBMCs from patients with MCI or AD: effector cells were overrepresented (Extended Data Fig. 4c), whereas memory cells were underrepresented (Extended Data Fig. 4d). Together, these results demonstrate an adaptive immune signature of AD that consists of increased peripheral CD8+ TEMRA cells.
To further investigate the role of CD8+ T cells in MCI and AD, we assessed the relationship between cognition and populations of memory T cells in a separate cohort (cohort 2) (Fig. 1a, Extended Data Fig. 5a). This revealed a negative correlation in MCI and AD between CD8+ TEMRA cells and cognition (Fig. 1e), whereas percentages of T central memory (TCM) and T effector memory (TEM) cells were positively correlated (Extended Data Fig. 5b). Age did not influence the levels of CD8+ TEMRA cells in either group (Extended Data Fig. 5c). We next tested whether functional differences exist in the peripheral CD8+ T cells of patients with MCI or AD. We stimulated PBMCs with phorbol 12-myristate 13-acetate (PMA) and ionomycin, and then measured the levels of two effector cytokines: interferon-y (IFN- γ) and tumour necrosis factor (TNF) (Extended Data Fig. 5d). After stimulation with PMA, CD8+ T cells from patients with MCI or AD had significantly higher levels of IFN-γ than did control CD8+ T cells (Fig. 1f), and TNF also trended towards significance (Extended Data Fig. 5e). Overall, these data identify an antigen-experienced population of CD8+ TEMRA cells that has potent effector functions−including the ability to secrete proinflammatory cytokines−in the peripheral immune system of patients with MCI or AD.
The proinflammatory effector phenotype of peripheral antigen-experienced CD8+ TEMRA cells in MCI and AD prompted us to test whether CD8+ TEMRA cells from patients with MCI and AD were transcriptionally distinct. We performed droplet-based single-cell RNA sequencing (scRNA-seq) on sorted CD8+ TEMRA cells from populations of PBMCs from patients with MCI or AD and control individuals (Extended Data Fig. 6a). Differential expression and pathway analysis revealed a significant decrease in amino acid metabolism and an increase in TCR and cytokine signalling in CD8+ TEMRA cells in MCI and AD (Fig. 1g, h, Extended Data Fig. 6b, c). Collectively, these results indicate greater antigenic stimulation of peripheral CD8+ TEMRA cells in patients with MCI and AD than controls.
We next sought to determine whether CD8+ T cells were present in the brain of patients with AD. We assessed post-mortem brains from a third cohort (cohort 3) comprising control individuals (no neurological disease) and patients with AD (Supplementary Table 6) by using immunohistochemistry to examine the expression of CD8 and Aβ and analyse the proximity of CD8+ T cells to the cerebral vasculature. We noted numerous extravascular CD8+ T cells in the perivascular space of blood vessels with cerebral amyloid angiopathy in the hippocampi of three AD brains (Fig. 2a); by contrast, CD8+ T cells were not observed surrounding blood vessels in control brains (Extended Data Fig. 7a). Notably, we detected CD8+ T cells adjacent to Aβ plaques (Extended Data Fig. 7b–d). We also detected significantly more CD3+CD8+ T cells in AD-affected hippocampi than control hippocampi (Fig. 2b, Extended Data Fig. 7e). CD8+ T cells associated with microtubule associated protein 2 (MAP2)+ neuronal processes in AD-affected hippocampi (Fig. 2c). We also noted an association of CD8+ T cells with neurofilament heavy (NEFH)+ neuronal processes in an APP/PS1 mouse model of AD (Extended Data Fig. 7f), and confirmed this association by electron microscopy (Extended Data Fig. 7g). Finally, we also detected CD3+CD8+ T cells in the leptomeninges adjacent to the hippocampus in brains from patients with AD (Fig. 2d).
Fig. 2 |. CD8+ T cells enter the brain in patients with AD.
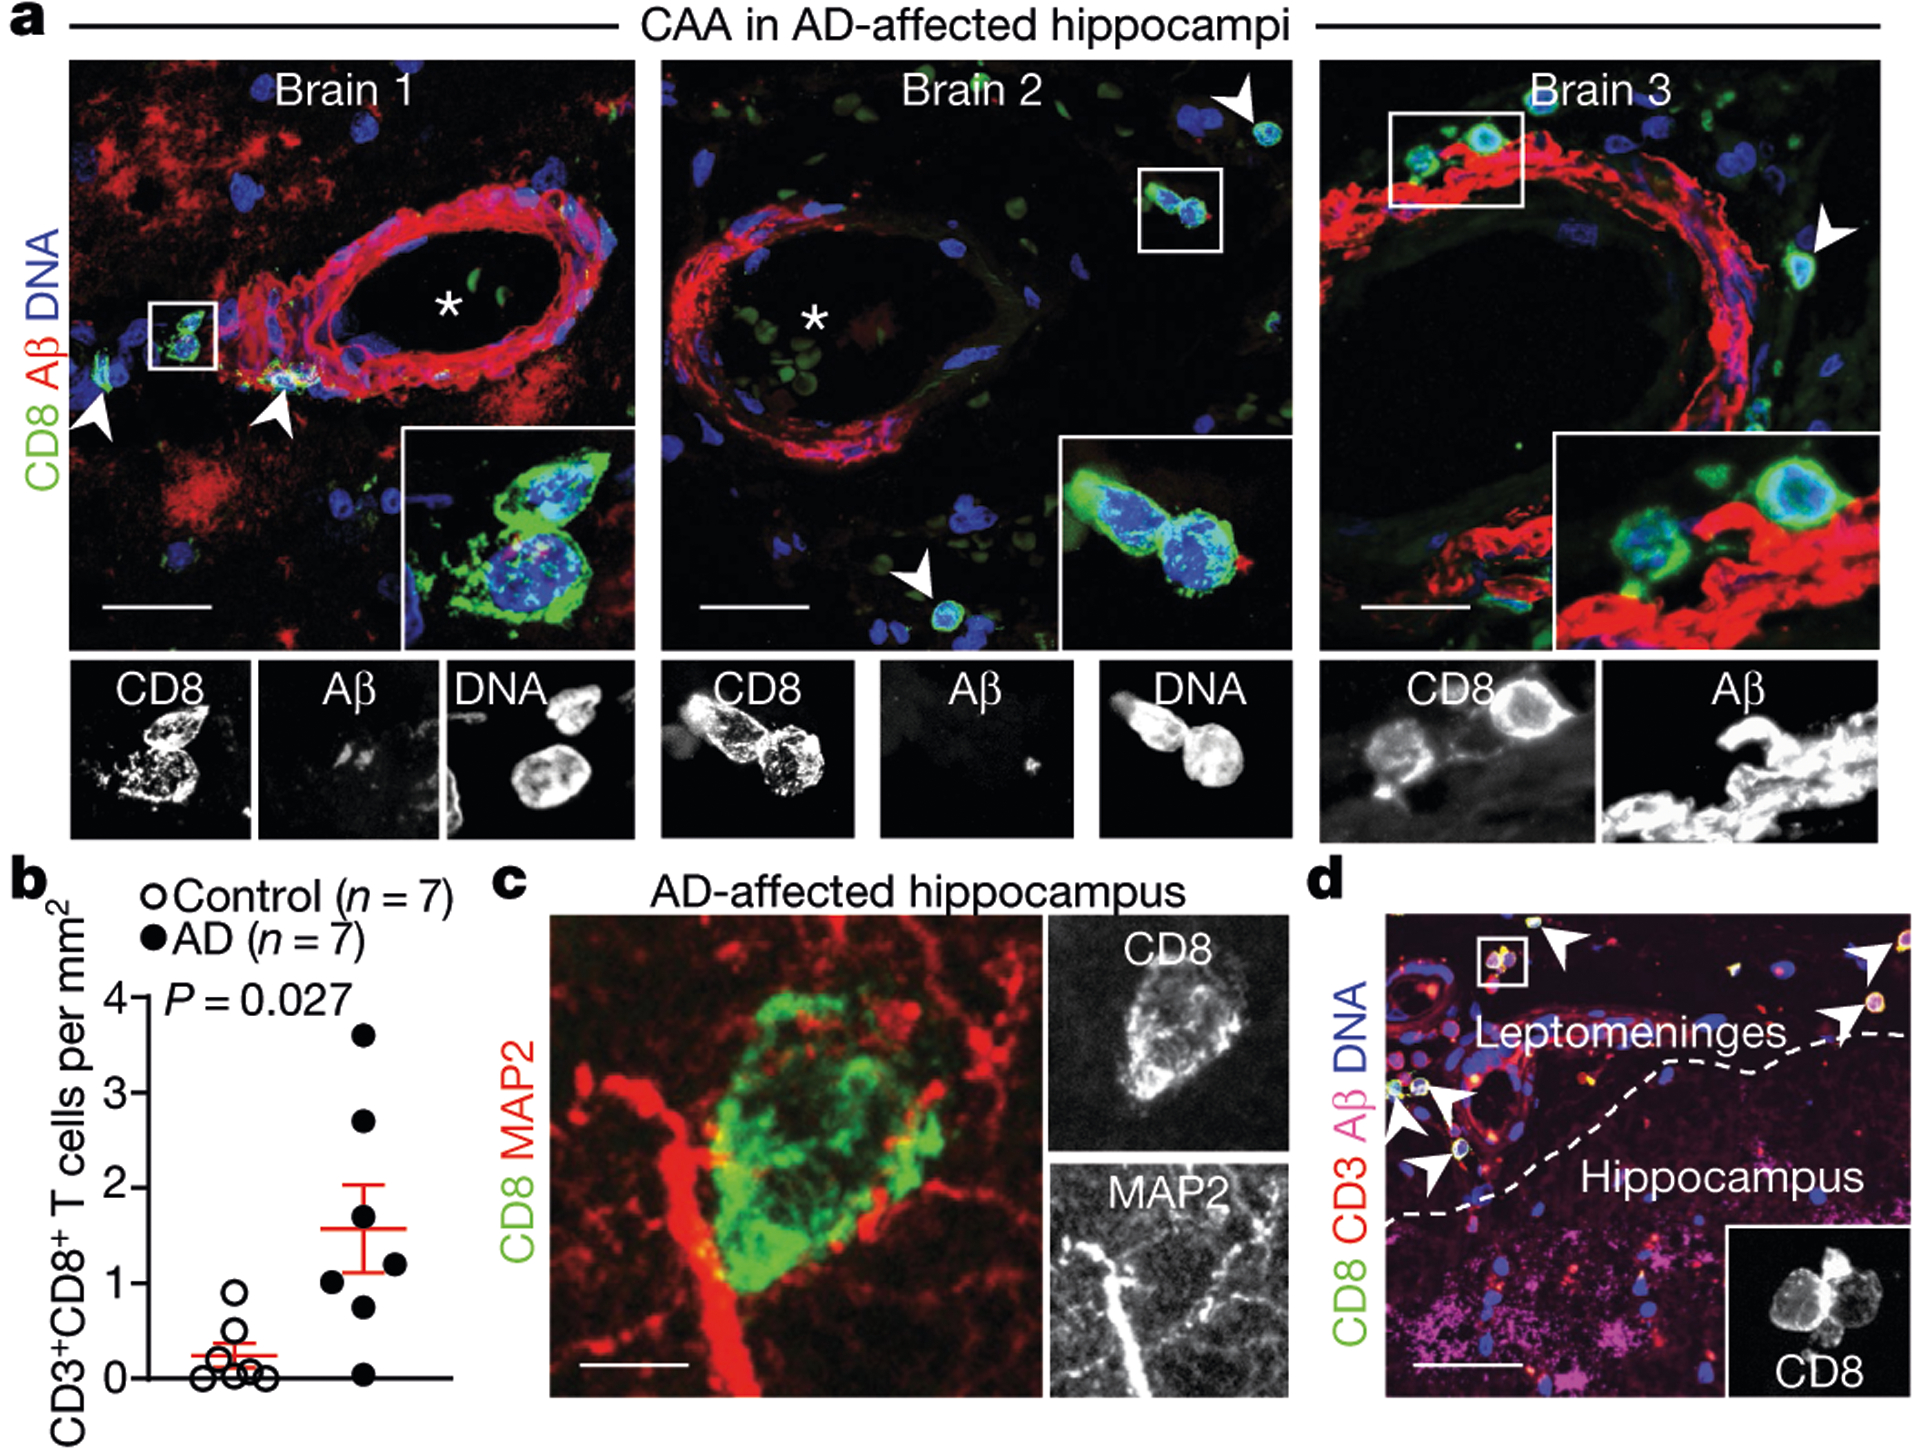
a, Confocal imaging of cerebral amyloid angiopathy (CAA) in the post-mortem brain of a patient with AD from cohort 3 shows CD8+ T cells in the perivascular space of Aβ+ blood vessels with cerebral amyloid angiopathy in three AD-affected hippocampi. Arrowheads indicate CD8+ T cells; asterisks indicate blood vessel lumen. Scale bars, 20 μm. b, Higher numbers of CD8+ T cells were detected in AD-affected than control hippocampi. Mean ± s.e.m.; unpaired two-sided t-test with Welch’s correction. c, A CD8+ T cell is shown associated with MAP2+ neuronal processes. d, CD8+ T cells are localized to the leptomeninges and adjacent to hippocampal AP plaques. Scale bar, 100 μm. Data in c, d were replicated in three independent experiments.
The localization of CD8+ T cells to brain leptomeninges led us to investigate whether antigen-specific cells also patrol the CSF. CSF immunity is relatively uncharacterized in healthy elderly individuals15,16. Therefore, we enumerated immune cells in CSF from ten healthy elderly subjects (Extended Data Fig. 8a). We found that CSF from these individuals contained mostly T cells, with a minority of innate immune cells and an undetectable amount of B cells (Extended Data Fig. 8b). Notably, the CD8+ T cell repertoire of CSF from elderly individuals was composed almost exclusively of TEM cells, and TEMRA cells made up around 20% of this TEM population (Extended Data Fig. 8c).
As TEMRA cells are associated with immunological memory, we investigated whether clonally expanded T cells patrol the CSF in healthy individuals, patients with AD and patients with Parkinson’s disease (PD; used as a control because antigen-specific T cells were recently discovered in vitro in PBMC samples from patients with PD17) in a separate cohort (cohort 4; Fig. 3a, Supplementary Table 2). We used two methods to assess clonal expansion: plate-based sequencing (plate-seq) and droplet-based sequencing (drop-seq). We first performed plate-seq of TCRs from CSF T cells of healthy controls (n = 5), patients with AD (n = 3) and patients with PD (n = 2) (Extended Data Fig. 8d). Clonally expanded cells were mostly CD8+ T cells, although we also detected CD4+ T cell clones in nearly all subjects (Extended Data Fig. 8e, Supplementary Table 7). Strikingly, one patient with AD had a massively expanded clone that comprised 44% of all CD8+ TCRs (Fig. 3b). Analysis of marker expression identified this clone as CD8+CD45RA+CD27− TEMRA cells (Fig. 3c). Together, these results provide the first evidence (to our knowledge) that clonally expanded CD8+ T cells patrol the CSF in brains that are affected by age-related neurodegeneration.
Fig. 3 |. Clonal expansion of CD8+ TEMRA cells in the CSF of patients with AD.
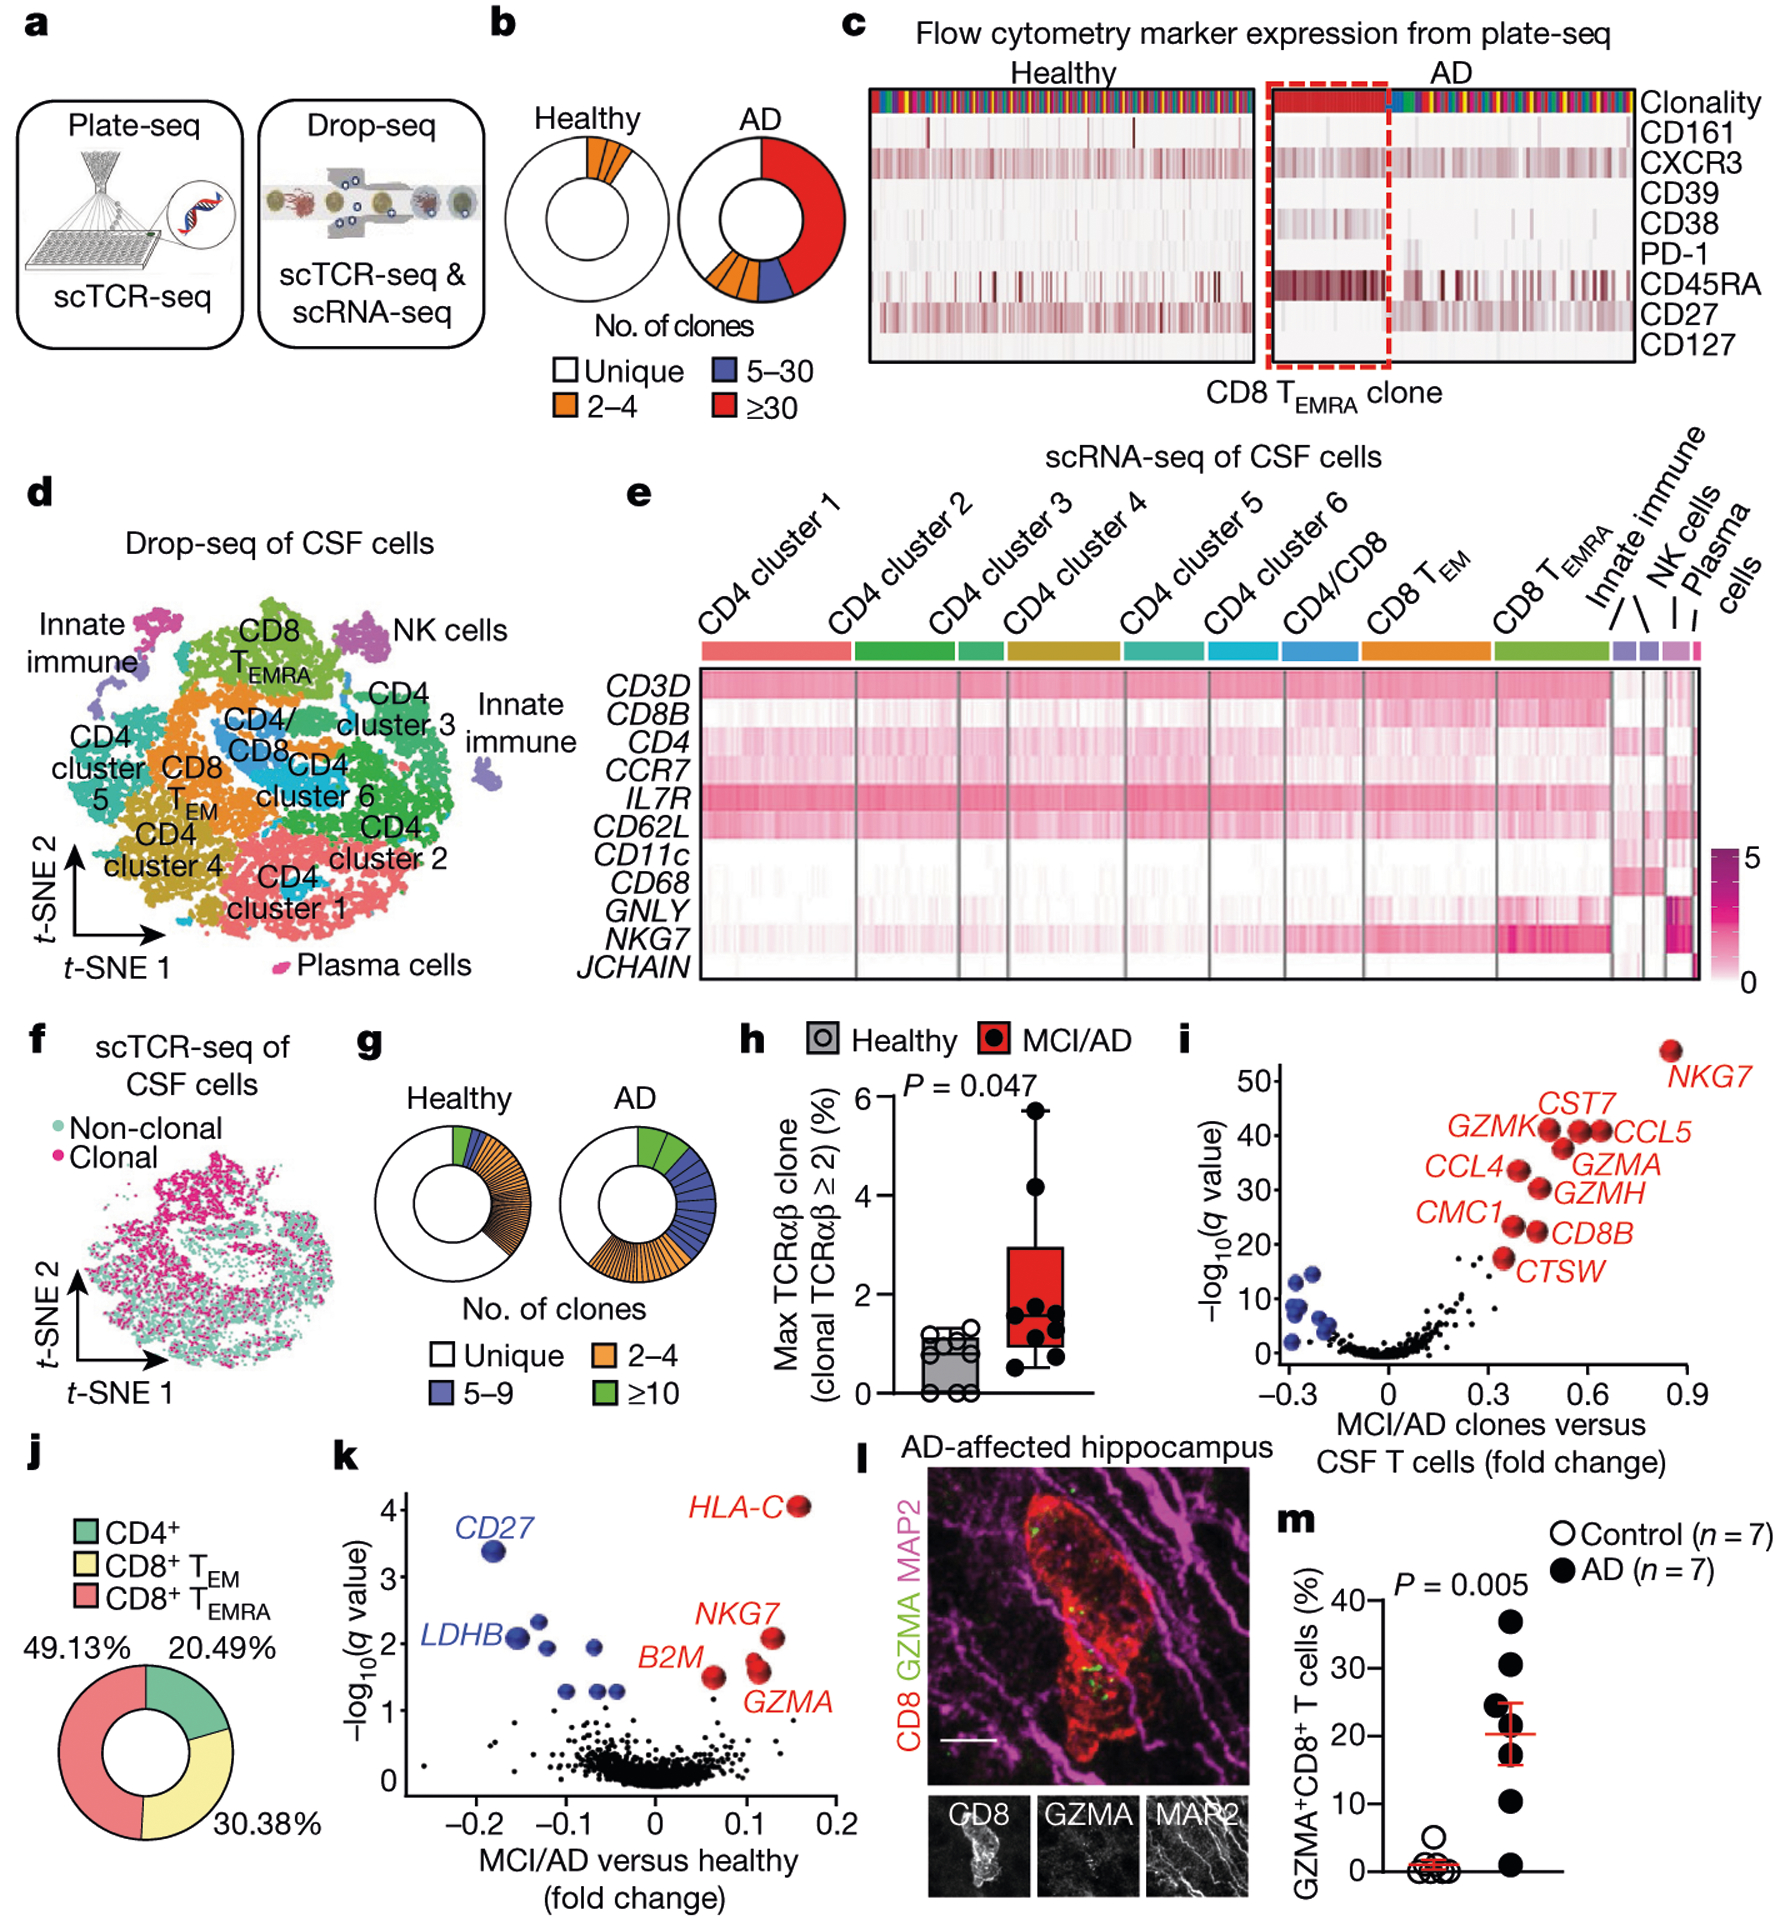
a, Plate-seq and drop-seq methods used for scTCR-seq and scRNA-seq of immune cells of the CSF in patients from cohort 4. b, CD8+ TCRαβ clonality (plate-seq) in the CSF of patients with AD and healthy control individuals. c, The top (most expanded) clone in AD had a marker expression profile of CD8+CD45RA+CD27− TEMRA cells. Data were replicated in two independent experiments. d, CSF cells analysed by drop-seq and clustered by multidimensional reduction with t-SNE, showing populations of immune cells that include CD8+ TEMRA cells (n = 9 healthy control individuals (10,876 cells); n = 9 patients with MCI or AD (10,391 cells)). e, Marker expression of CSF clusters, including CD8+ TEMRA cells. CD62L is also known as SELL; CD11c is also known as ITGAX. Data were pooled from three independent experiments. f, Concentration of clonal cells in locations of CD8+ T cell clusters (n = 9 subjects per group). g, Representative plots of CD8+ TCRαβ clonality (drop-seq) in age-matched subjects shows enhanced clonal expansion and more highly expanded clones in AD. Clones are coloured by proportion of the total TCRαβ sequences. h, Quantification of maximum clones (% TCRαβ sequences) shows a higher percentage in patients with MCI or AD than healthy control individuals (n = 9 subjects per group). Samples lacking clonal cells were scored as zero. Box plots show median and 25th to 75th percentiles, and whiskers indicate the minimum and maximum values. Unpaired two-sided f-test with Welch’s correction. i, Differential expression of highly expanded clones (clonal TCRαβ > 5) revealed increased expression of cytotoxic effector genes. MAST differential expression test with Benjamini-Hochberg correction (n = 9 patients with MCI or AD). j , Quantification of highly expanded clones (clonal TCRαβ > 5) showed that 49.13% of them are CD8+ TEMRA cells (n = 9 patients with MCI or AD). k, Increased expression of B2M, NKG7and GZMA in clonal CD8+ T cells from patients with MCI or AD. MAST differential expression test with Benjamini-Hochberg correction (n = 9 subjects/group). l, A hippocampal CD8+ T cell in an AD-affected brain (cohort 3) shows expression of GZMA adjacent to MAP2+ neuronal processes. Scale bar, 5 pm. Data were replicated in three independent experiments. m, Percentages of CD8+ T cells that express GZMA in control and AD-affected hippocampi. Mean ± s.e.m.; unpaired two-sided t-test with Welch’s correction.
To examine potential changes in gene expression in clonal CD8+ T cell populations in AD, we sorted live cells of the CSF (Extended Data Fig. 8f) and used drop-seq to validate our plate-seq findings. Multidimensional reduction and visualization with t-distributed stochastic neighbour embedding (t-SNE) showed that most CSF cells were T cells (Fig. 3d, e). This cellular and molecular characterization of the CSF in elderly individuals and patients with AD indicates that the intrathecal immune compartment contains almost exclusively T cells of the TEM subtype. Clusters were composed of a mixture of groups, sexes and patients (Extended Data Fig. 8g). We next performed single-cell TCR sequencing (scTCR-seq) on these cells, which showed that clonal T cells colocalized with CD8+ T cells (Fig. 3f). We observed numerous highly expanded CD8+ clones in CSF from patients with MCI or AD, whereas this expansion occurred less frequently in CSF from control individuals (Fig. 3g). Quantification of the most highly expanded (maximum) clone for each subject revealed that the percentages of the maximum clone were higher in patients with MCI or AD than in control individuals (Fig. 3h). Differential expression analysis of clones that were highly expanded in MCI and AD (that is, more than five T cells with the same TCRαβ sequence) revealed increased expression of cytotoxic effector genes, including natural killer cell granule protein 7 (NKG7) and granzymes A, H and K (GZMA, GZMHand GZMK) (Fig. 3i). We then quantified the percentages of T cells that corresponded to highly expanded clones, which showed that 49.13% were CD8+ TEMRA cells (Fig. 3j). Differential expression analysis of clonally expanded CD8+ TEMRA cells also revealed increased expression of cytotoxic effector genes including NKG7and GZMA in MCI and AD (Fig. 3k). Notably, CD8+ Temra cells from patients with MCI or AD also expressed higher levels of the MHC genes human leukocyte antigen C (HLA-C) and beta-2-microglobulin (B2M)-a pro-ageing factor that impairs cognition18−compared with control cells (Fig. 3k). In addition, differential expression of highly expanded clones from patients with MCI or AD showed that these clones were CD8-positive and that they upregulated their expression of cytotoxic granules, proteases and proinflammatory cytokines (Extended Data Fig. 9a), many of which are associated with AD (Supplementary Table 8). Although it is not clear whether cells enter the brain parenchyma via the CSF, we localized GZMA expression to CD8+ T cells (Fig. 3l) and detected higher percentages of GZMA+CD8+ cells in hippocampi from patients with AD than in hippocampi from control individuals (Fig. 3m). Collectively, these results reveal the pro-inflammatory, cytotoxic function of clonal CD8+ TEMRA cells in the CSF of patients with AD, and demonstrate the utility of combining scRNA-seq and scTCR-seq datasets.
We next pooled TCRαβ sequences from plate-seq and drop-seq experiments in cohort 4 to broadly assess clonality in neurodegeneration. We first separately analysed the maximum clones (defined as comprising 3% or more of all TCRαβ sequences) from healthy subjects and patients with MCI, AD and PD, which revealed a highly expanded clone in only one out of ten healthy subjects, compared with four out of six patients with AD, two out of six patients with PD and one out of five patients with MCI (Extended Data Fig. 9b). We next measured overall clonality (defined as the percentage of total TCRαβ sequences that are identical to one or more TCRαβ sequences), which revealed that the levels of clonality were highest in AD and PD (Extended Data Fig. 9c). Notably, when we integrated CSF cells from patients with PD into our analysis (Extended Data Fig. 9d), we observed increased expression of genes analogous to those observed in AD clones (Extended Data Fig. 9e). Together, these results demonstrate the clonal expansion of cytotoxic proinflammatory CD8+ TEMRA cells in the CSF of patients with age-related neurodegeneration.
We next sought to determine the antigens that drive clonal expansion of CD8+ Temra cells in the CSF of patients with MCI or AD. We created unweighted networks of our clonal TCRαβ sequences to detect shared clones within and between groups. Although we did not identify shared TCRαβ sequences in healthy subjects within or between groups, we detected a shared TCRαβ clone between a patient with MCI and a patient with AD (Fig. 4a). Notably, a third patient with AD shared this TCRP sequence (CASSLGQAYEQYF), which has known specificity for the Herpesviridae Epstein-Barr nuclear antigen 3 (EBNA3A)19 (Fig. 4b). We then assessed the gene-expression profile of this Epstein-Barr virus (EBV) EBNA3A-specific clone, and found that the expression of cytotoxic effector genes was increased (Fig. 4c).
Fig. 4 |. Antigen identification of clonally expanded TCRs in the CSF of patients with AD.
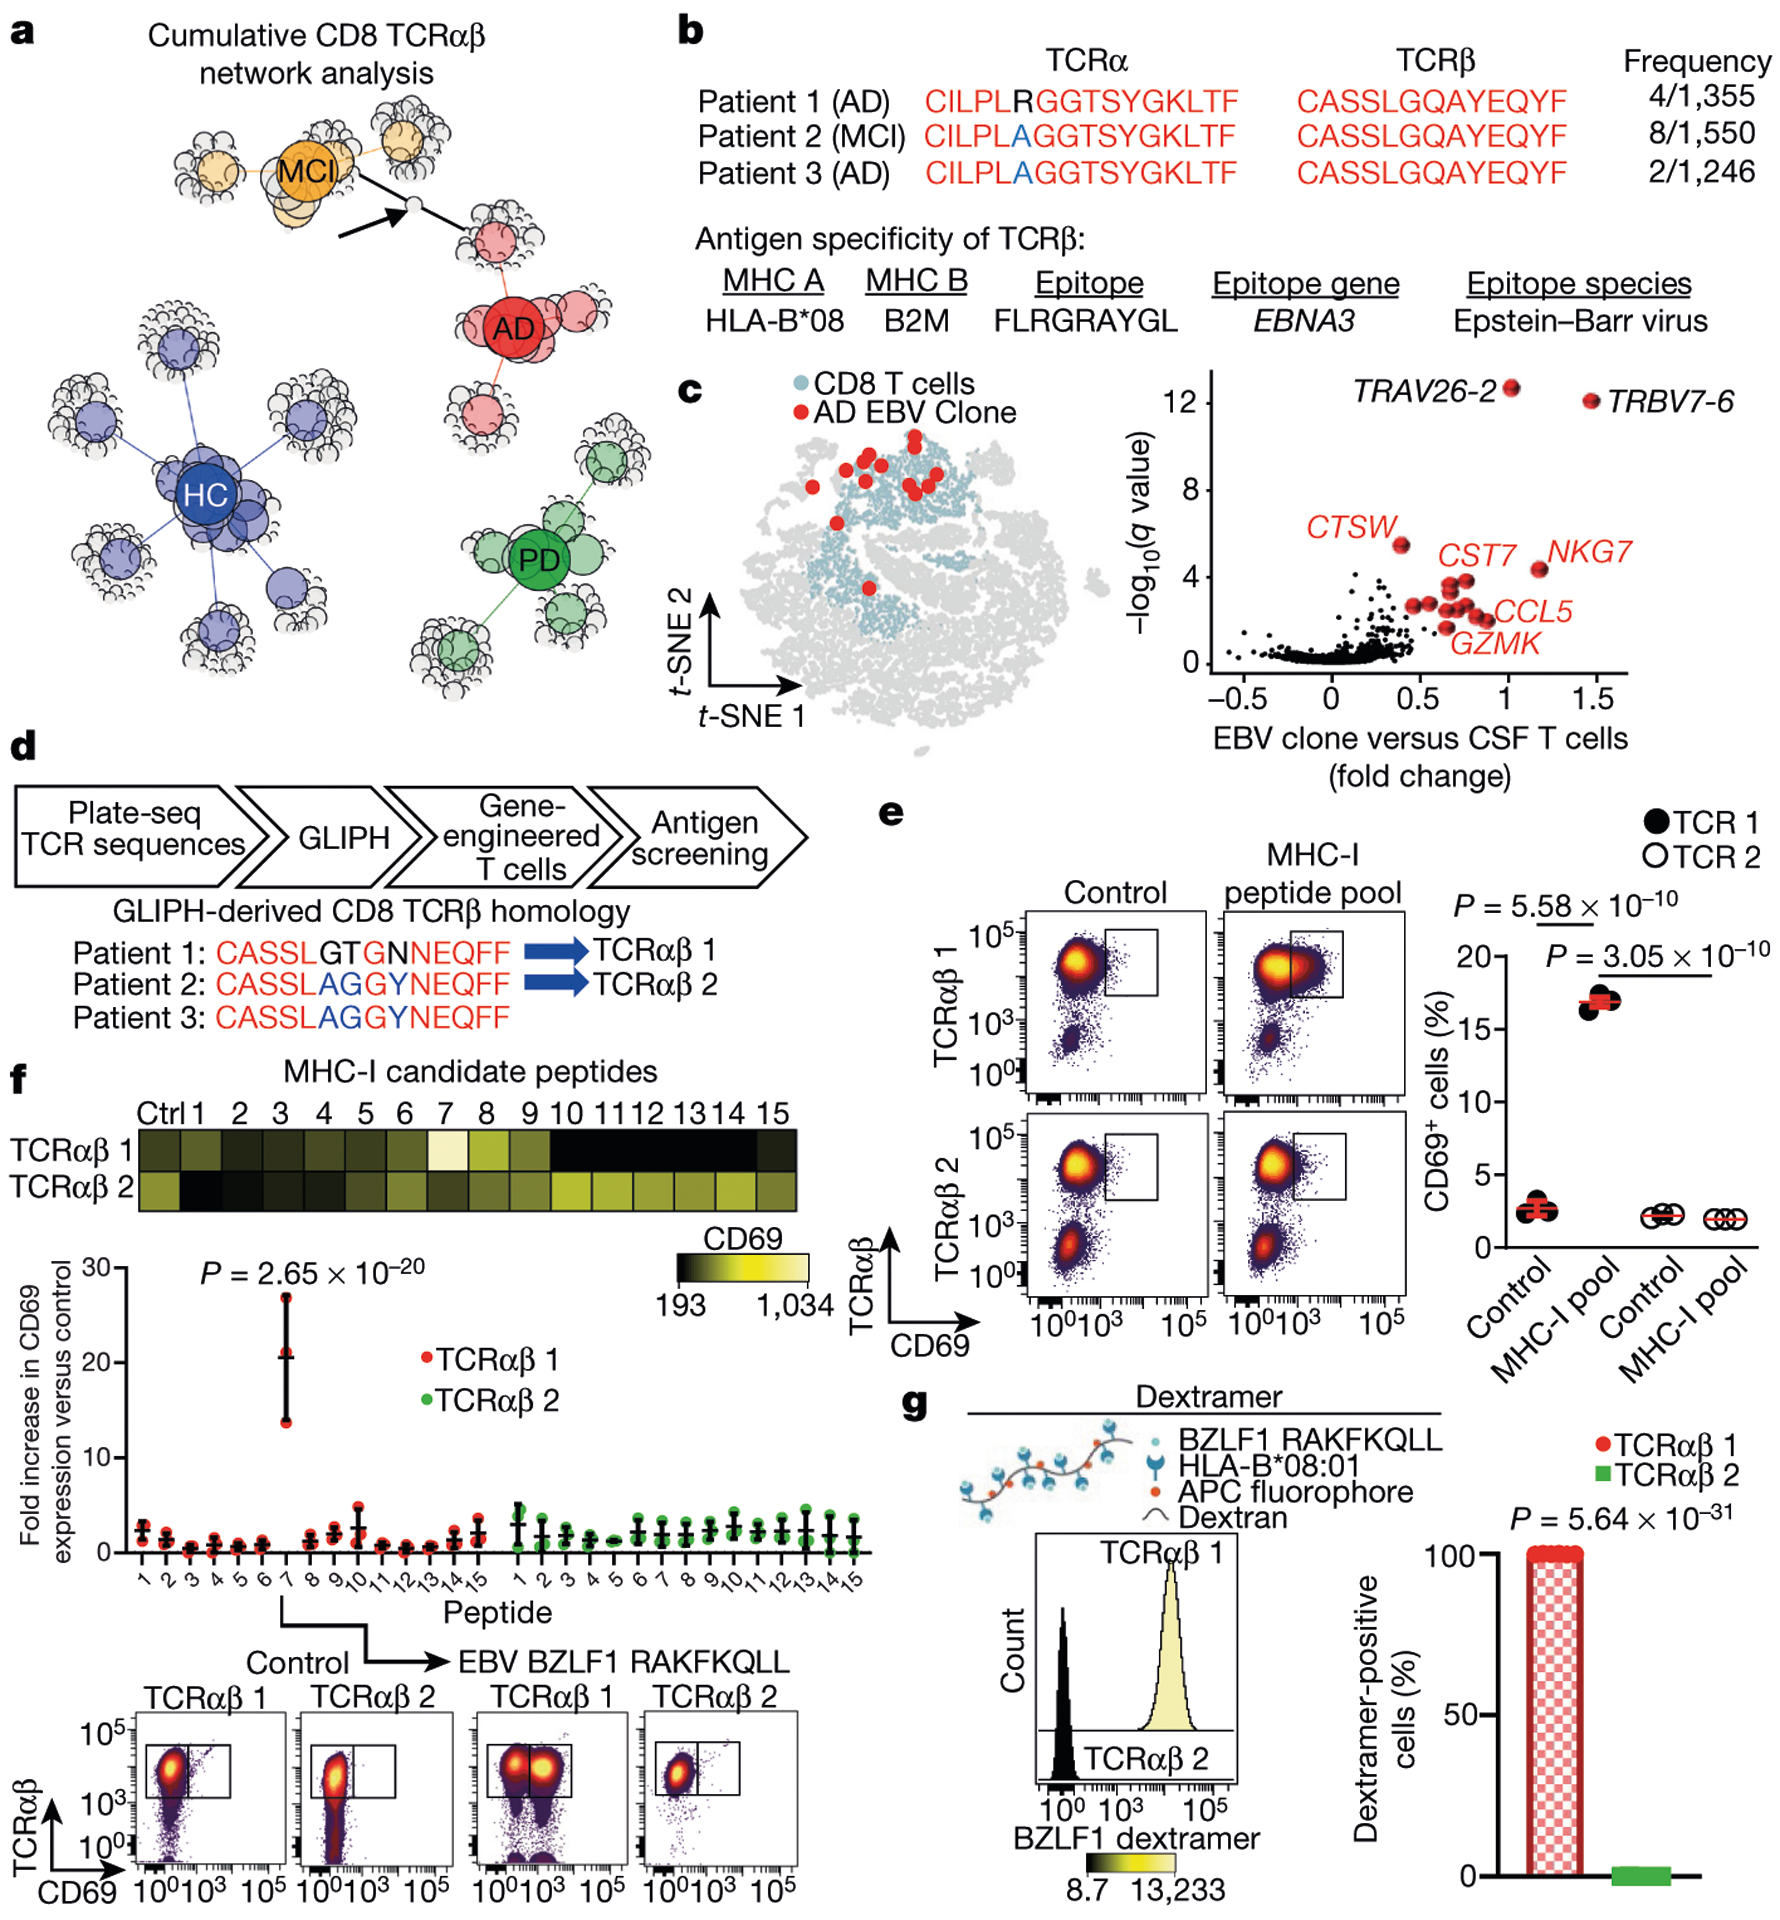
a, Unweighted network analysis of CD8 T CRαβ sequences combined from plate-seq and drop-seq experiments. Group node IDs with individual TCRαβ clones are depicted as circles and sized according to the proportion of total sequences of each clone. Arrow indicates a shared clonal T CRaP sequence with specificity for EBV EBNA3A. Note that several healthy control (HC) subjects have no clones. b, Shared TCRαβ sequences among patients with MCI or AD. Three patients had identical TCRβ chains with specificity for EBV EBNA3A. The antigen specificity of T CRβ is shown below19. c, Differential expression of EBV-specific clones in MCI and AD (from n = 3 subjects) versus all CSF T cells shows enhanced expression of cytotoxic effector genes. MAST differential expression test with Benjamini-Hochberg correction. d, Workflow for antigen identification of CSF TCRs. GLIPH was applied to TCR sequencing to derive homologous TCR sequences between patients. GLIPH identified two patients with AD who had identical TCRβ chains and a third patient with a similar sequence. The T CRαβ sequences derived from GLIPH were introduced into SKW-3 cells. e, Autologous fibroblasts were used to present antigens to TCRαβ 1 and TCRαβ 2 cells. Only TCRαβ 1 cells showed significant upregulation of CD69 following antigen presentation. Data are averages from three separate experiments performed in triplicate.Mean ± s.e.m.; one-way analysis of variance (ANOVA) (F(3, 8) = 1,050,P = 1.01 × 10⁻¹⁰) with Tukey’s multiple comparisons test. f, Peptide 7 (RAKFKQLL) of the EBV trans-activator BZLF1 protein activates TCRαβ 1 but not TCRαβ 2 cells. Two-way ANOVA (F(14, 60) = 14.06, P =4.8 × 10⁻¹⁴) followed by Sidak’s multiple comparisons test. Data were pooled from n = 3 independent experiments. The P value shown is from comparing peptide 7 values for each cell line. Mean ± s.d. g, A fluorescent dextramer composed of H LA-B*08:01 presenting the BZLF1 peptide RAKFKQLL shows nearly 100% positivity with TCRαβ 1 but no positivity with TCRαβ 2 cells. Unpaired two-sided t-test with Welch’s correction (n = 6 per group).
To determine the antigen specificity of unknown TCRs, we applied HLA haplotyping within our GLIPH (grouping of lymphocyte interactions by paratope hotspots) algorithm20 to our plate-seq TCRs. GLIPH can analyse large numbers of TCR sequences and define specificity groups that are shared by TCRs. Notably, GLIPH identified a shared TCRβ chain between patients with AD (CASSLAGGYNEQFF); this chain also shared homology with a TCRβ chain from a third patient (CASSLGTGNNEQFF) (Fig. 4d, Supplementary Table 9). To test for antigen specificity of GLIPH-derived TCRs, we generated two cell lines-termed TCRαβ 1 and TCRαβ 2-that express TCRαβ sequences from these two patients with AD (patients 1 and 2) (Fig. 4d, Extended Data Fig. 10a). Both TCRαβ 1 and TCRαβ 2 cells showed upregulation of the activation marker CD69 when stimulated in a cell-free manner (Extended Data Fig. 10b). We then used dermal fibroblasts from patients 1 and 2 as autologous antigen-presenting cells to screen a pool of 80 known MHC-I restricted epitopes (Supplementary Table 10) for reactivity. Notably, TCRαβ 1 cells responded to the MHC-I peptide pool, whereas TCRαβ 2 cells were non-responsive (Fig. 4e, Extended Data Fig. 10c). TCR activation depended on autologous antigen presentation, as non-autologous presentation did not stimulate TCRαβ 1 cells-demonstrating MHC restriction (Extended Data Fig. 10d).
We then narrowed this MHC-I pool to 15 peptides that could activate TCRαβ 1 cells, by filtering for peptides restricted to an HLA that matched patient 1 (HLA-A*01:01 or HLA-B*08:01) (Supplementary Table 11).
We used TCRαβ 2 as a control, given the sequence similarity of its P chain, separate patient HLA and inability to become activated by the MHC-I peptide pool. Only one peptide activated TCRαβ 1 cells: peptide 7-RAKFKQLL of the EBV trans-activator protein BZLF1 (Fig. 4f, Extended Data Fig. 10e). To verify the antigenicity of BZLF1 to TCRαβ 1 cells, we designed a dextramer to present RAKFKQLL on HLA-B*08:01 (Fig. 4g). Notably, the dextramer bound to TCRαβ 1 cells with 100% positivity, whereas TCRαβ 2 cells did not bind (Fig. 4g, Extended Data Fig. 10f). These results demonstrate BZLF1 peptide RAKFKQLL as a cognate antigen presented by HLA-B*08:01 for a previously undescribed TCR (TCRα: CAASEGGFKTIF; TCRβ: CASSLGTGNNEQFF). In summary, our TCRαβ cloning strategy led to the discovery of a novel TCR in AD, with specificity for the EBV trans-activator protein BZLF1.
Overall, these results demonstrate antigen-specific clonal expansion of CD8+ T cells in AD and signify the need for a greater understanding of the role of adaptive immunity in this disease. Although we detected EBV-specific TCRs in CSF from patients with AD, we caution that these data are not evidence of a causal link between EBV infectivity and AD. In fact, the EBV-specific clones detected in this study were not the most highly expanded and were not enriched among patients. However, it remains tenable that the most highly expanded clones observed in patient CSF are specific for non-self antigens that were not identified in our search. Several different antigens may activate and promote CD8+ T cell trafficking in AD, with a potential effect on neurodegeneration through their cytotoxic effector function. Identifying the self and non-self antigens that clonal TCRs recognize in amyloidogenic brain disorders such as AD and PD will provide a new approach to investigate adaptive immunity in neurodegenerative disease.
Methods
Study participants
Samples were acquired through the Stanford Brain Rejuvenation Program, the NIA funded Stanford Alzheimer’s Disease Research Center (ADRC), the University of California at San Francisco ADRC and the University of California at San Diego ADRC. Collection of brain tissue, plasma, PBMCs and CSF was approved by the Institutional Review Board of each university, and written consent was obtained from all subjects. A total of 164 living subjects from three separate cohorts (cohorts 1, 2 and 4) were used in this study. The 164 subjects included 97 healthy individuals, 31 patients with MCI, 28 patients with AD and 8 patients with PD. The average age of subjects was 72.52 ± 6.96 (mean ± s.d.) for healthy individuals; 70.97 ± 7.82 for patients with MCI; 70.74 ± 7.01 for patients with AD; and 67.25 ± 7.01 for patients with PD. The average cognitive score was 27.17 ± 2.32 for healthy individuals; 23.39 ± 4.31 for patients with MCI; 11.05 ± 7.32 for patients with AD; and 27.29 ± 1.70 for patients with PD. All subjects were free from acute infectious diseases and in good physical condition. Patients were confirmed to have neuro-degeneration by measurement of biomarkers including neurofilament, Aβ and tau (Quanterix). Group characteristics, including demographic, genetic, clinical and biomarker data for each group, are presented in Supplementary Table 12.
Tissue collection
PBMCs were isolated from blood by layering diluted blood (1:1 in PBS) on top of an equal volume of Ficoll, followed by centrifugation and isolation of the buffy coat. CSF was collected by lumbar puncture, then centrifuged at 300g to pellet immune cells. CSF samples were checked for blood contamination by resuspending the pelleted cells in 100 μl CSF and mixing 10 μl (10%) CSF with 10 μl trypan blue to assess red blood cell content and viability. Cells were visualized on a TC20 automated cell counter (BioRad) and cell viability and the presence or absence of red blood cells was recorded. CSF samples that were contaminated with blood were not used in the study. The resuspended cells were then mixed with 900 μl recovery cell culture freezing medium (Thermo Fisher Scientific). All samples were frozen overnight at −80 °C in a Mr. Frosty freezing container (Thermo Fisher Scientific) and transferred the following day to liquid nitrogen for storage. PBMC samples were stored over the course of a three-year period. The average PBMC viability for patient samples following sample thawing was 79%, and that for control samples was 77%. CSF samples were stored less than 6 months before analysis.
Cognitive testing
Study subjects underwent a battery of neuropsychological assessments to determine group status, including cognitive examination, evaluation of cerebellar function, deep tendon reflexes, sensory input and motor function. The Montreal Cognitive Assessment (MoCA)21 examination was used to test study subjects for cognitive impairment. The MoCA assesses several cognitive domains: short-term memory recall (5 points), visuospatial abilities (4), executive functions (4), attention (1), concentration (3), working memory (1), language (6) and orientation to time and space (6). MoCA scores range between 0 and 30.
Structural brain MRI
T1-weighted MRI scans were acquired using an Axial 3D fast spoiled gradient sequence (GE Discovery 750). The imaging parameters were optimized for grey and white matter tissue contrast with a repetition time of 5.9 ms, echo time 2 ms, flip angle 15°, field of view 220 mm, matrix size 256 × 256, slice thickness 1 mm and 2 NEX. Image analysis was conducted using FreeSurfer 6.0. For subcortical segmentation, we used the ‘recon-all’ command. For hippocampal segmentation, we appended the flag ‘-hippocampal-subfields-T1’ to the ‘recon-all’ command for each patient. To correct for sex differences, we normalized all volumetric measurements to the total intracranial volume for each patient.
Flow cytometry
Flow cytometry was conducted using an LSRFortessa (BD Biosciences). A panel consisting of antibodies conjugated to six different fluorophores was used to classify subsets of memory T cells and for drop-seq. Antibodies used were: CD8α-Pacific blue (BioLegend), CD3-BV650 (BD Biosciences), CD45RA-APC-Cy7 (BioLegend), CCR7–488 (Bio-Legend), IL-7Rα-PE (BioLegend) and CD27-PE-Cy7 (BioLegend). For characterization of CSF cells, this same panel was used, but CD19-PE-Cy5 (BioLegend) and CD14-Qdot-705 (Thermo Fisher Scientific) were included. For sorting CSF T cells for TCR plate-seq, the following antibodies were used: CD8α-PE (BioLegend), CD161-PE-Cy7 (BioLegend), CXCR3-APC (BioLegend), CD4-APC-Alexa700 (Thermo Fisher Scientific), CD39-APC-Cy7 (BioLegend), CD38-FITC (BioLegend), PD-1-BV421 (BD Biosciences), CD45RA-BV605 (BD Biosciences), CD3-BV650 (BD Biosciences), CD27-BV786 (BD Biosciences) and CD127-BUV395 (BD Biosciences). For each experiment, a compensation matrix was developed using singly stained and unstained controls or fluorescent beads, and all analysis was conducted in Cytobank.
Cell stimulation
PBMCs were thawed and plated at a density of 1 × 10⁶ cells per well in a 24-well plate. The medium consisted of RPMI with 10% fetal bovine serum and 1× penicillin-streptomycin. After overnight incubation at 37 °C with 20 U ml−1 IL-2, cells were stimulated with a cocktail containing PMA, ionomycin and brefeldin A (BioLegend). Cells were then incubated an additional 5 h before performing intracellular flow cytometry analysis.
Mass cytometry
Mass cytometry was performed as previously described22. In brief, cells were thawed in complete medium containing RPMI with 10% fetal bovine serum (FBS), 1% penicillin-streptomycin and 0.1 mg ml−1 DNase. After washing in Maxpar Cell Staining Buffer (Fluidigm) cells were resus-pended in 50 μl filtered antibody cocktail (Fluidigm) and incubated for 60 min on ice. Cells were again rinsed, then resuspended in 100 μl of 1:3,000-diluted In115-DOTA maleimide in buffer. Following additional rinses, cells were resuspended in 100 μl of 2% paraformaldehyde in buffer and incubated at 4 °C overnight. Cells were then washed twice with permeabilization buffer (eBioscience) and incubated on ice for 45 min. After rinsing, cells were resuspended in Ir-Interchelator in buffer and incubated for 20 min at room temperature. Cells were then washed with buffer, then MilliQ water and finally resuspended in MilliQ water for running on a Helios mass cytometer. To normalize mass cytometry data, the same lot of EQ Four Element Calibration Beads (Fluidigm) was used for all experiments to control for signal variation that may have occurred in the instrument over time. Normalization of mass cytometry data was achieved using the Matlab bead normalization tool.
SPADE and CITRUS analyses
SPADE and CITRUS analyses were conducted using Cytobank. For SPADE conducted on mass cytometry data, we established a target number of nodes of 100 for our immunophenotyping assay. We based this number on empirical evaluation of results from multiple runs on the same dataset, which showed comparable results. The SPADE population for immunophenotyping (live CD45+ cells) was selected on the basis of the gating strategy shown in Extended Data Fig. 3. Cells were clustered on all markers except those used to exclude platelets or endothelial cells. For CITRUS, the same population of cells and same clustering channels were used as in SPADE to quantify the abundance of various populations. Results are from 5 × 10³ events per sample, with a false discovery rate of 2%, minimum cluster size of 1% and cross validation folds set to 10. The predictive nearest shrunken centroid PAMR association model was used. To avoid spurious results, we ran CITRUS with minimum cluster sizes of 1–4%, cross validation folds 5–10 and false discovery rate 1–5% for 1 × 10⁴, 1.5 × 10⁴ and 2 × 10⁵ events, totalling 17 individual runs. For SPADE conducted on flow cytometry data, CD3+CD8+ cells were gated and clustered with a target number of nodes of 30.
Immunohistochemistry
Paraffin-embedded brain tissues were sectioned at 5-μm thickness. Deparaffinization was achieved by washing slides through a series of xylenes and decreasing concentrations of ethanol. Tissue sections were then subjected to antigen retrieval using citrate buffer, pH 6.0 (Sigma-Aldrich) at 95 °C for 30 min. Following rinsing with PBS, sections were incubated in blocking buffer containing PBS with 10% normal donkey serum and 0.03% Triton-X (Sigma-Aldrich) for 2 h at room temperature. Slides were then incubated with primary antibody in blocking buffer overnight at 4°C. The following day, slides were rinsed with PBS then incubated in appropriate Alexa Fluor secondary antibodies (Thermo Fisher Scientific). Sections were then rinsed and stained with Hoechst DNA dye (Thermo Fisher Scientific) before being coverslipped with ProLong mounting medium (Invitrogen). Primary antibodies included rat anti-human CD3 (Abcam), rabbit anti-human CD8α (Cell Signaling), mouse anti-Aβ (Cell Signaling), chicken anti-human MAP2 (Abcam), mouse anti-human granzyme-A (Abcam), rat anti-mouse CD8a (eBioscience) and rabbit anti-mouse NEFH (Abcam). For mouse Aβ plaque staining, ThioflavinS (1 mg ml−1, 1:625, Sigma) was added to the secondary antibody solution.
Confocal microscopy and image processing
For human tissue, the LSM880 confocal laser scanning microscope (Zeiss) was used to acquire images using 40× and 63× objectives. For mouse tissue imaging, the LSM700 and LSM710 confocal laser scanning microscopes (Zeiss) were used, which were provided by the microscopy core facility of the Spinal Cord Injury and Tissue Regeneration Center Salzburg (SCI-TReCS). For all Z-stacks, images were acquired using optical sectioning then combined into maximum intensity projections. 3D reconstructions were performed using Imaris v.9.1.2 (Bitplane).
Quantitative histology
For quantification of human CD3+CD8+ and GZMA+CD8+ T cells, homologous sections of the hippocampal dentate gyrus were cut at 10-μm thickness using a microtome (Leica Biosystems). Plot sampling was conducted by using CA3 as a boundary to draw a rectangular area of approximately 2 mm2 that encompassed the molecular layer, granule cell layer and hilus. Three separate sections were sampled using a 20× objective. CD3+CD8+ T cells were then manually counted by a blinded observer in ZEN 2 Blue Edition (Zeiss).
Mice
APP/PS1 mice23,24 expressing a chimaeric mouse/human mutant amyloid precursor protein (Mo/HuAPP695swe) and a mutant human presenilin 1 (PS1-dE9) directed to CNS neurons under the prion protein promoter were used (TheJackson Laboratory). Mice were housed at the Paracelsus Medical University Salzburg in groups under standard conditions at a temperature of 22 °C and a 12 h light/dark cycle with ad libitum access to standard food and water. Over 10 mice aged 12–13 months comprising both sexes were randomly analysed in an unblinded manner. Animal care, handling, genotyping and experiments were approved by Paracelsus Medical University Salzburg ethical committees.
Electron microscopy
For ultrastructure analysis, 12–13-month-old APP/PS1 mice and wild-type controls were transcardially perfused with 4% PFA and 0.5% glutaraldehyde in 0.1 M phosphate buffer (PB). Brains were removed and 50-μm sagittal sections were cut using a vibratome (Leica) and stored in 0.1 M PB with 0.05% sodium azide. Sections with brain areas of interest were selected and pre-embedding 3,3’-diaminobenzidine (DAB)-immunostaining was performed as described previously25,26. Rat anti-CD8 (eBioscience) primary antibody was used and incubated for 2 days at 4 °C. After several washes in PBS, sections were incubated for 2 days with biotinylated rabbit anti-rat antibody (Vector) at 4°C. To increase staining signal, sections were incubated in the Vectastain ABC Hrp Kit (Vector) for 1 h. After rinsing three times in PBS, sections were transferred to DAB using the Peroxidase Substrate Kit (Vector). Sections were rigorously washed and osmificated by incubating in 1% OsO4 (EMS) in 0.1 M PB for 1 h. Following 3 washes for 10 min in distilled water, sections were incubated in Uranyl Acetate Replacement Stain-UAR (EMS) for 30 min. Sections were dehydrated by incubation in an increasing series of ethanol and transferred to propylenoxide (EMS) before embedding in araldite durcupan (four component resin, Sigma) overnight in aluminium foil cups at room temperature. The following day, slices were transferred to acetate slides (100 micron colour laser printer film, 5 Star Office Supplies), covered with small amounts of araldite, coated with a second acetate slide and hardened in an oven at 60 °C for 3 days. Hippocampal and cortical regions with CD8+ T cells were identified using light microscopy and regions of interest were cut out of embedded sections. One side of the acetate slide was removed and samples were glued onto an araldite durcupan block with cyanoacrylate adhesive (UHU). This protocol was performed with small modifications according to previously reported protocols27,28. After removing the acetate slides and careful trimming of the samples into a trapezial shape, semi-thin sections of 1–1.5 μm were generated using an Ultracut Reichert E (Leica). Semi-thin sections were transferred to object slides and were stained with 1% Toluidine blue for orientation. After identification of stained cells, ultra-thin sections of 70 nm were directly cut using a diamond knife (Diatome). Sections were stretched with chloroform and subsequently collected with 50 or 75 mesh copper grids of 3 mm diameter coated with 0.2% Formvar solution. Grids were dried and analysed with a LEO 912 transmission electron microscope (Zeiss) equipped with an in-column energy filter, at 100 kV by using a Slow Scan Dual Speed CCD camera TRS Sharpeye (Troendle). The imaging software used was Image SP v.1.2.7.31 (SIS, Soft Image System).
TCR amplification by nested PCR plate-seq
TCR sequencing was conducted according to our previously established protocols5,29. In brief, TCR sequences from live CD3+ single cells were obtained by a series of three nested PCR reactions. For all phases of PCR reactions, HotStarTaq DNA polymerase (Qiagen) was used. The phase 1 PCR reaction was a multiplexed PCR with multiple Vα, Vβ, Cα and Cβ region primers in a 16-μl reaction. For the phase 1 PCR reaction, the final concentration of each TCR V-region primer was 0.06 μM and each C-region primer was 0.3 μM. A PCR reaction was done using the following conditions: 95 °C 15 min; 94 °C 30 s, 62 °C 1 min, 72 °C 1 min × 16 cycles; 72 °C 10 min; 4 °C. Thereafter, a 1-μl aliquot of the phase 1 product was used as a template for the 12-μl phase 2 PCR reaction. The following cycling conditions were used for phase 2 PCR: 95 °C 15 min; 94 °C 30 s, 64 °C 1 min, 72°C 1 min × 25 cycles; 72 °C 5 min; 4 °C. For the phase 2 reaction, multiple internally nested TCRVα, TCRVβ, TCRCα and Cβ primers were used (V primers 0.6 μM, C primers 0.3 μM). The phase 2 primers of TCR V-region contained a common 23-base sequence at the 5’ end to enable amplification during the phase 3 reaction with a common 23-base primer. A 1-μl aliquot of the phase 2 PCR product was used as a template for the 14-μl phase 3 PCR reaction, which incorporated barcodes and enabled sequencing on the Illumina MiSeq platform. For the phase 3 PCR reaction, amplification was performed using a 5’ barcoding primer (0.05 μM) containing the common 23-base sequence and a 3’ barcoding primer (0.05 μM) containing the sequence of a third internally nested Cα and/or Cβ primer, and Illumina Paired-End primers (0.5 μM each). The following cycling conditions were used for phase 3 PCR: 95 °C 15 min; 94 °C 30 s, 66 °C 30 s, 72 °C 1 min × 25 cycles; 72 °C 5 min; 4 °C. The final phase 3 bar-coding PCR reactions for TCRα and TCRβ were done separately. For the phase 3 reaction, 0.5 μM of the 3’ Cα barcoding primer and the 3’ Cβ barcoding primer were used. In addition to the common 23-base sequence at the 3’ end (that enables amplification of products from the second reaction) and a common 23-base sequence at the 5’ end (that enables amplification with Illumina Paired-End primers), each 5’ barcoding primer contains a unique 5-base barcode that specifies plate and a unique 5-base barcode that specifies row within the plate. These 5’ barcoding primers were added with a multichannel pipette to each of 12 wells within a row within a plate. In addition to the internally nested TCR C-region sequence and a common 23-base sequence at the 3’ end (that enables amplification with Illumina Paired-End primers), each 3’ barcoding primer contained a unique 5-nucleotide barcode that specified column. These 3’ barcoding primers were added with a multichannel pipette to each of eight wells within a column within all plates. After the phase 3 PCR reaction, each PCR product should have had a unique set of barcodes incorporated that specified plate, row and column and had Illumina Paired-End sequences that enabled sequencing on the Illumina MiSeq platform. The PCR products were combined at equal proportion by volume and run on a 1.2% agarose gel, and a band around 350 to 380 bp was excised and gel purified using a Qiaquick gel extraction kit (Qiagen). This purified product was then sequenced.
TCR plate-seq analysis
TCR sequencing data were analysed as previously described5,29. Raw sequencing data were processed and demultiplexed using a custom software pipeline to separate reads from every well in every plate as per specified barcodes. All paired ends were assembled by finding a consensus of at least 100 bases in the middle of the read. The resulting paired-end reads were then assigned to wells according to barcode. Primer dimers were filtered out by establishing a minimum length of 100 bases for each amplicon. A consensus sequence was obtained for each TCR gene. Because multiple TCR genes might be present in each well, our software establishes a cut-off of >95% sequence identity within a given well. All sequences exceeding 95% sequence identity are assumed to derive from the same TCR gene and a consensus sequence is determined. The 95% cut-off conservatively ensures that all sequences derived from the same transcript are properly assigned.
Drop-seq of peripheral CD8+ TEMRA and CSF cells
For CD8+ TEMRA scRNA-seq, base call files from a HiSeq 4000 Sequencer (Illumina) were generated by the Stanford Genomics Core. For CSF and peripheral CD8+ TEMRA scRNA-seq, FASTQ files from a Novoseq S4 sequencer were generated by Novogene. For CSF scTCR-seq, base call files from a NextSeq550 Sequencer (Illumina) were generated in-house. Single cell V(D)J and 5’ gene-expression analysis (10X Genomics) was used for peripheral CD8+ TEMRA and CSF cells. Cell Ranger v.3.0.2 was used to generate gene-expression matrices for both peripheral TEMRA and CSF cells. The Cell Ranger mkfastq pipeline generated FASTQ files for both the 5’ expression library and the V(D)J libraries. Reads from the 10X v.2 5’ paired library were mapped to the human genome build GRCh38 3.0.0. Reads from the 10X V(D)J kit were mapped to the vdj-GRCh38 alts ensemble 2.0.0 (available from 10X Genomics). The 5’ gene-expression libraries were then analysed with the Cell Ranger count pipeline and the resulting expression matrix was used for further analysis in the Seurat package v.3.0. The V(D)J FASTQ files were analysed with the Cell Ranger vdj pipeline, which produced single cell V(D)J sequences and determined clonotypes. Clonotypes were determined by grouping of cell barcodes that shared the same set of productive CDR3 nucleotide sequences. The sequences of all contigs from all cells within a clonotype were then assembled to produce a clonotype consensus sequence. Clonality was integrated into the Seurat gene-expression analysis by adding clonality information to the metadata.
Clustering of peripheral CD8+ TEMRA and CSF cells
Individual sample expression matrices were loaded into R using the function Read10x under the Matrix package v.1.2–15. The expression matrix for each sample was merged into one Seurat object using the CreateSeuratObject and MergeSeurat functions. The Seurat package v.3.030,31 was used for filtering, variable gene selection, normalization, scaling, dimensionality reduction, clustering and visualization. For CD8+ TEMRA cells, genes were excluded if they were expressed in fewer than 10 cells, and cells were excluded if they expressed fewer than 200 genes. Cells that expressed more than 2,500 genes, more than 10,000 unique molecular identifiers (UMIs) and more than 10% mitochondrial genes were excluded. Regularized negative binomial regression using the sctransform normalization method was used to normalize, scale, select variable genes and regress out experimental batch, mitochondrial mapping percentage and the number of UMIs. After filtering and normalization, there were 15,330 genes across 18,203 cells. Following principal component analysis (PCA), 10 principle components were selected for clustering the cells. A resolution of 0.4 was used with t-SNE visualization. For CSF cells, genes were excluded if they were expressed in fewer than 10 cells and cells were excluded if they expressed fewer than 200 genes. Cells that expressed more than 1,800 genes, more than 7,500 UMIs and more than 10% mitochondrial genes were excluded from the analysis. The sctransform normalization method was used to normalize, scale, select variable genes and regress out sequencing and experimental batch, mitochondrial mapping percentage and the number of UMIs. After filtering and normalization, there were 212,267 samples and 14,734 features. Following PCA, four principle components were selected for clustering. A resolution of 0.3 was used with t-SNE visualization.
Analysis of scRNA-seq data
For differential expression analysis, markers for each cluster were determined by comparing the cells of each cluster to all other cells using the FindMarkers function in Seurat with the MAST algorithm from the R package MAST (v.1.8.2). For all comparisons between groups and clusters, only genes expressed by at least 10% of cells were included. The R package ggplot2 (v.3.1.0) was used to plot the results of differential expression analyses, showing the average log-transformed fold change of each gene and the -log10 of the adjusted P value (Benjamini-Hochberg correction). Seurat was used to produce violin plots of the expression of selected genes. For pathway analysis, Panther was used to perform Reactome pathway analysis with genes that were identified from differential expression analysis (q < 0.05) and with all genes in the dataset as background. Fisher’s exact test was used with Bonferroni correction for multiple testing. Z-scores for each pathway were calculated using the R package GOPlot.
Determination of antigen specificity ofV(D)J sequences
To determine whether TCR sequences identified in our scTCR-seq experiments on peripheral TEMRA and CSF cells had known antigen specificity, the CDR3b region of each β chain was compared to the CDR3b repertoire from the VDJdb at https://vdjdb.cdr3.net/.
TCR clonality analysis
For CSF cells sequenced by plate-seq, analysis of clonality was performed using Excel. TCRs with two or more identical CDR3b regions and CDR3a regions were defined as clonal. R was used to calculate a proportion of the sum of reads of the clonotypes to the overall number of reads in a repertoire (∑ reads of top clonotypes)/(∑ reads for all clonotypes). For TCRs sequenced using single-cell V(D)J technology (10X Genomics), clonality was determined by the Cell Ranger vdj pipeline as previously described. Clonotypes were determined from grouping of cell barcodes that shared the same set of productive CDR3 nucleotide sequences.
The sequences of all contigs from all cells within a clonotype were then assembled to produce a clonotype consensus sequence. Clonality was integrated into the Seurat gene-expression analysis by adding clonality information to the metadata. For TCR network analysis, to depict connections between diagnosis groups, patients and clonotypes, we used the qgraph package for R. Only TCRs with full α and β chain sequences were included in the analysis. Unweighted networks were generated with all subjects and split per diagnosis group.
Gene-engineered T cell lines
The two TCRs identified from patients with AD by GLIPH were cloned into a pHR vector using the signal peptides of the TCR variable genes and full-length, unmodified constant regions from IMGT/V-QUEST. Packaging vectors pMD2G and pPAX were used to allow for human mammalian tropism and viral generation. Lentivirus was generated for each TCRα and TCRβ separately in Lenti-X 293T cells (Takara). Cells were cultured with 10% fetal bovine serum (FBS) in Dulbecco’s modified Eagle’s medium (DMEM) and viruses were collected at 48 h, filtered with 0.45-mM syringe filters (Thermo Fisher Scientific), and frozen at −80 °C or used immediately to infect the TCR-deficient SKW-3 cell line (Creative Bioarray; these cells were verified to lack TCRs using an antibody against TCRαβ and confirmed negative for mycoplasma contamination). TCRαβ 1 expressed TCRα: CAASEGGFKTIF and TCRβ: CASSLGTGNNEQFF. TCRαβ 2 expressed TCRa: CAADRT GGGNKLTF and TCRβ: CASSLAGGYNEQFF. Combined TCRα and TCRβ viruses were used to infect 2 × 10⁶ SKW-3 cells at a multiplicity of infection of five by spinning for 1 h at 2,500 rpm at 32 °C, and cells were then placed back in culture. After 48 h, cells were collected, rinsed with PBS then incubated with live/dead near infrared dead cell dye (Thermo Fisher Scientific), stained for TCRαβ (IP26, BioLegend) and sorted on a FACSAria II cell sorter (BD). TCRαβ+ cells were sorted before each experiment and cultures were maintained in DMEM containing 10% FBS and 1× penicillin−streptomycin supplemented with recombinant human IL-2 (20 IU ml−1; R&D Systems).
TCR stimulation
For αCD2/CD3/CD28 TCR stimulation, anti-biotin particles loaded with the biotinylated antibodies were used to mimic antigen-presenting cells and activate TCRs. Transduced SKW-3 cells were incubated with biotinylated antibodies against human CD2, CD3 and CD28 (Miltenyi) in DMEM containing 10% FBS and 1× penicillin-streptomycin. Data were analysed using Cytobank and samples were gated on SKW-3 cells by forward and side scatter before analysis for TCRαβ and CD69 expression.
Autologous fibroblast antigen presentation
T cell lines were co-cultured with autologous fibroblasts in a 2:1 ratio during antigen presentation. For MCH-I peptide pool stimulation, a mix of 80 known MHC-I antigenic peptides (CEFX Ultra SuperStim Pool MHC-I Subset; JPT Peptides) were used to screen for reactive TCRs. Fibroblasts were plated at 5 × 10⁴ cells per well in 24-well plates. The peptide mix contained 0.3–1.2 μg per peptide per μ1 (dependent on each peptide’s molecular weight) dissolved in DMSO and had a purity of each peptide of greater than 70% as determined by high-performance liquid chromatography (HPLC). Peptide pools were added to fibroblast plates at 1:100 dilution in 250 μl medium. Control wells contained DMSO only. For individual peptide stimulations, peptides were produced at a purity of greater than 90% as determined by HPLC (JPT Peptides). Following 18 h of incubation at 37 °C, fibroblasts were heat-shocked at 41 °C for 30 min to increase antigen presentation. Fibroblasts were then rinsed with PBS and 1 × 10⁵ cells from each T cell line were added in medium containing purified no azide/low endotoxin mouse anti-human CD28 antibody (2 μg ml−1; BD Biosciences) and IL-2 (20 IU ml−1). After 18 h, cells were analysed for activation by flow cytometry for TCRαβ and CD69 expression.
Statistical methods
All statistical analyses were performed using commercially available software (Prism, SPSS or Excel). All values are expressed as the mean ± SEM. Differences in means between two groups were analysed using unpaired two-sided heteroscedastic f-tests with Welch’s correction, unless otherwise noted. For regression analyses, the significance of the difference between two datasets was measured by ANCOVA. Differences in means among multiple datasets were analysed using one- or two-way analysis of variance (ANOVA). When ANOVA showed significant differences, pair-wise comparisons between means were tested by Sidak’s or Tukey’s multiple comparisons test. For scRNA-seq analyses, we corrected for multiple comparisons and report adjusted P values using Benjamini-Hochberg correction. For pathway analyses, Fisher’s exact test was used with Bonferroni correction for multiple testing. No statistical methods were used to predetermine sample size.
Supplementary Material
Extended Data
Extended Data Fig. 1 |. Clinical measures of subjects from mass cytometry experiments.
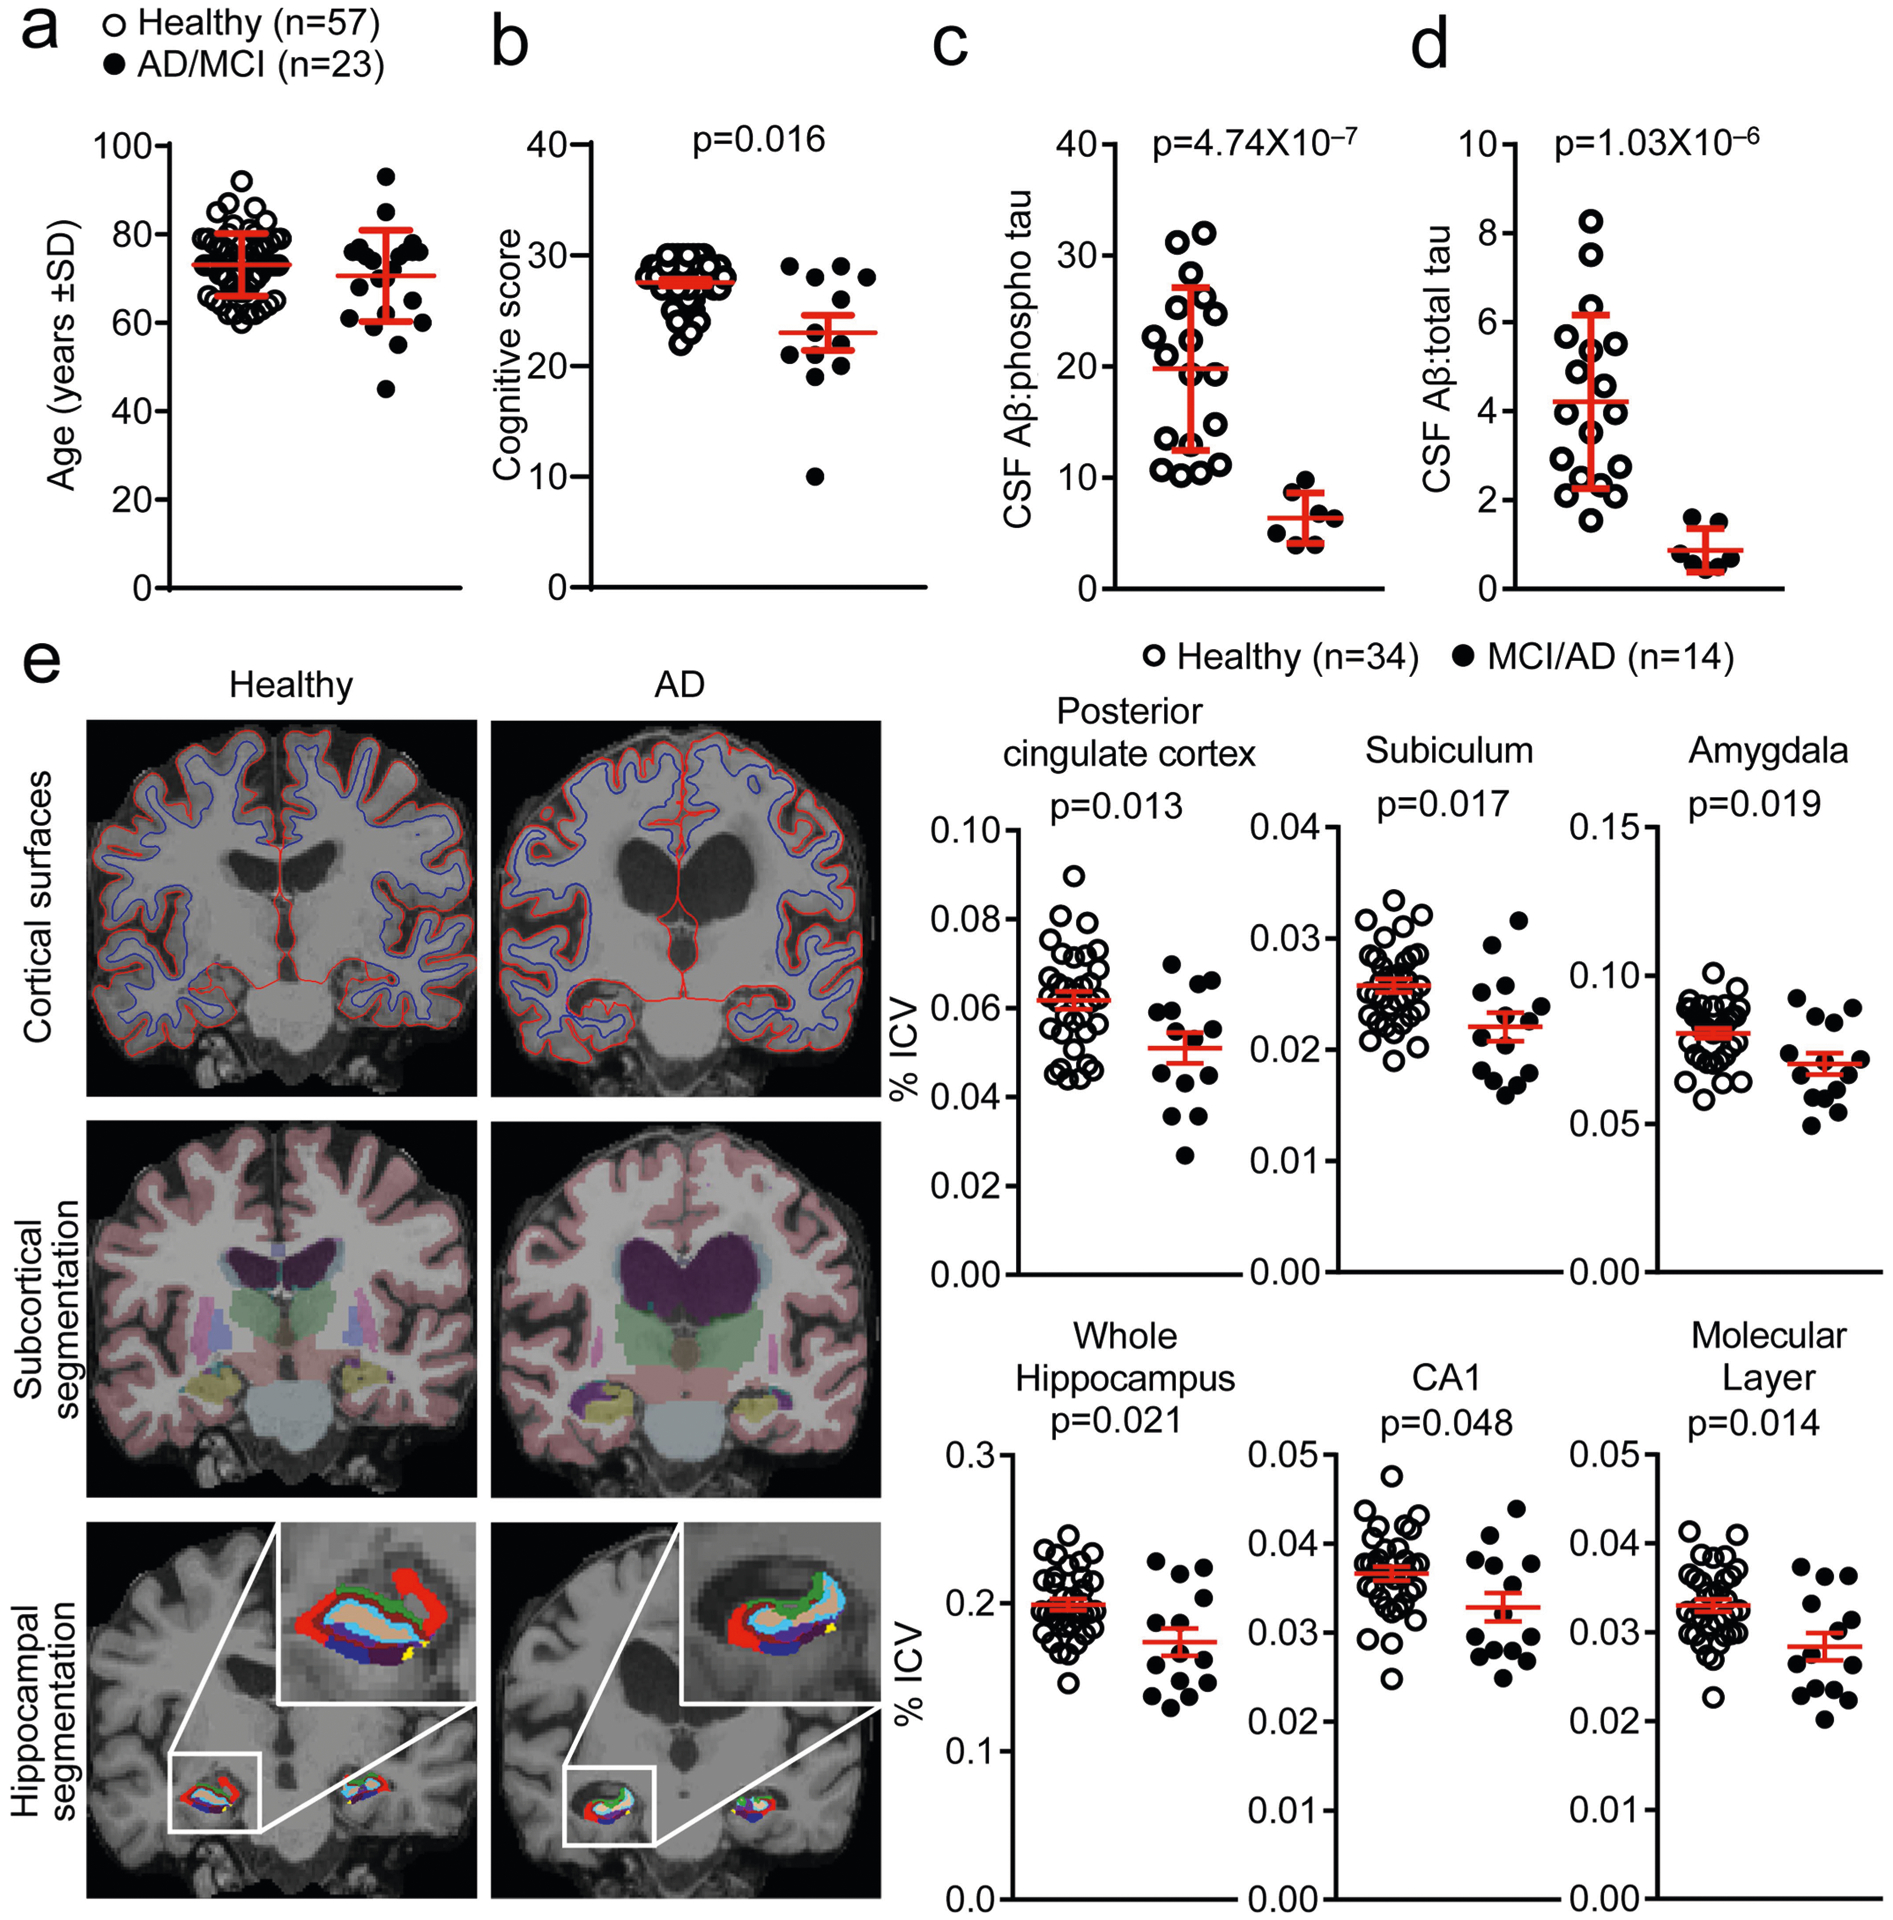
a, Cohort 1 groups were age-matched and included 57 healthy subjects and 23 patients with MCI or AD. b, Cognitive scoring shows significantly decreased cognitive scores in patients with MCI or AD. Note that not all patients with MCI or AD could complete a cognitive exam and these patients are thus not included in this analysis. Unpaired two-sided f-test with Welch’s correction (n = 51 healthy; n = 12 MCI or AD); mean ± s.e.m. c, d, Quantification of CSF AP as a ratio to phosphorylated tau (c) or total tau (d) reveals significantly reduced ratios in patients with MCI or AD. Unpaired two- sided f-test with Welch’s correction (n = 18 healthy, n = 7 MCI or AD); mean ± s.e.m. e, Top, representative MRI images show reduction in cortical grey matter in patients with AD. Middle, bottom, representative MRI images of several brain regions as measured by subcortical segmentation and hippocampal segmentation. Right, quantification of MRI images of patients with MCI or AD compared to control individuals shows significant reductions in the percentage of the intracranial volume (ICV) of brain regions classically associated with AD pathology. CA1, cornu ammonis area 1. Unpaired two-sided t-test; mean ± s.e.m.
Extended Data Fig. 2 |. Gating strategy for identifying immune cell populations from mass cytometry data.
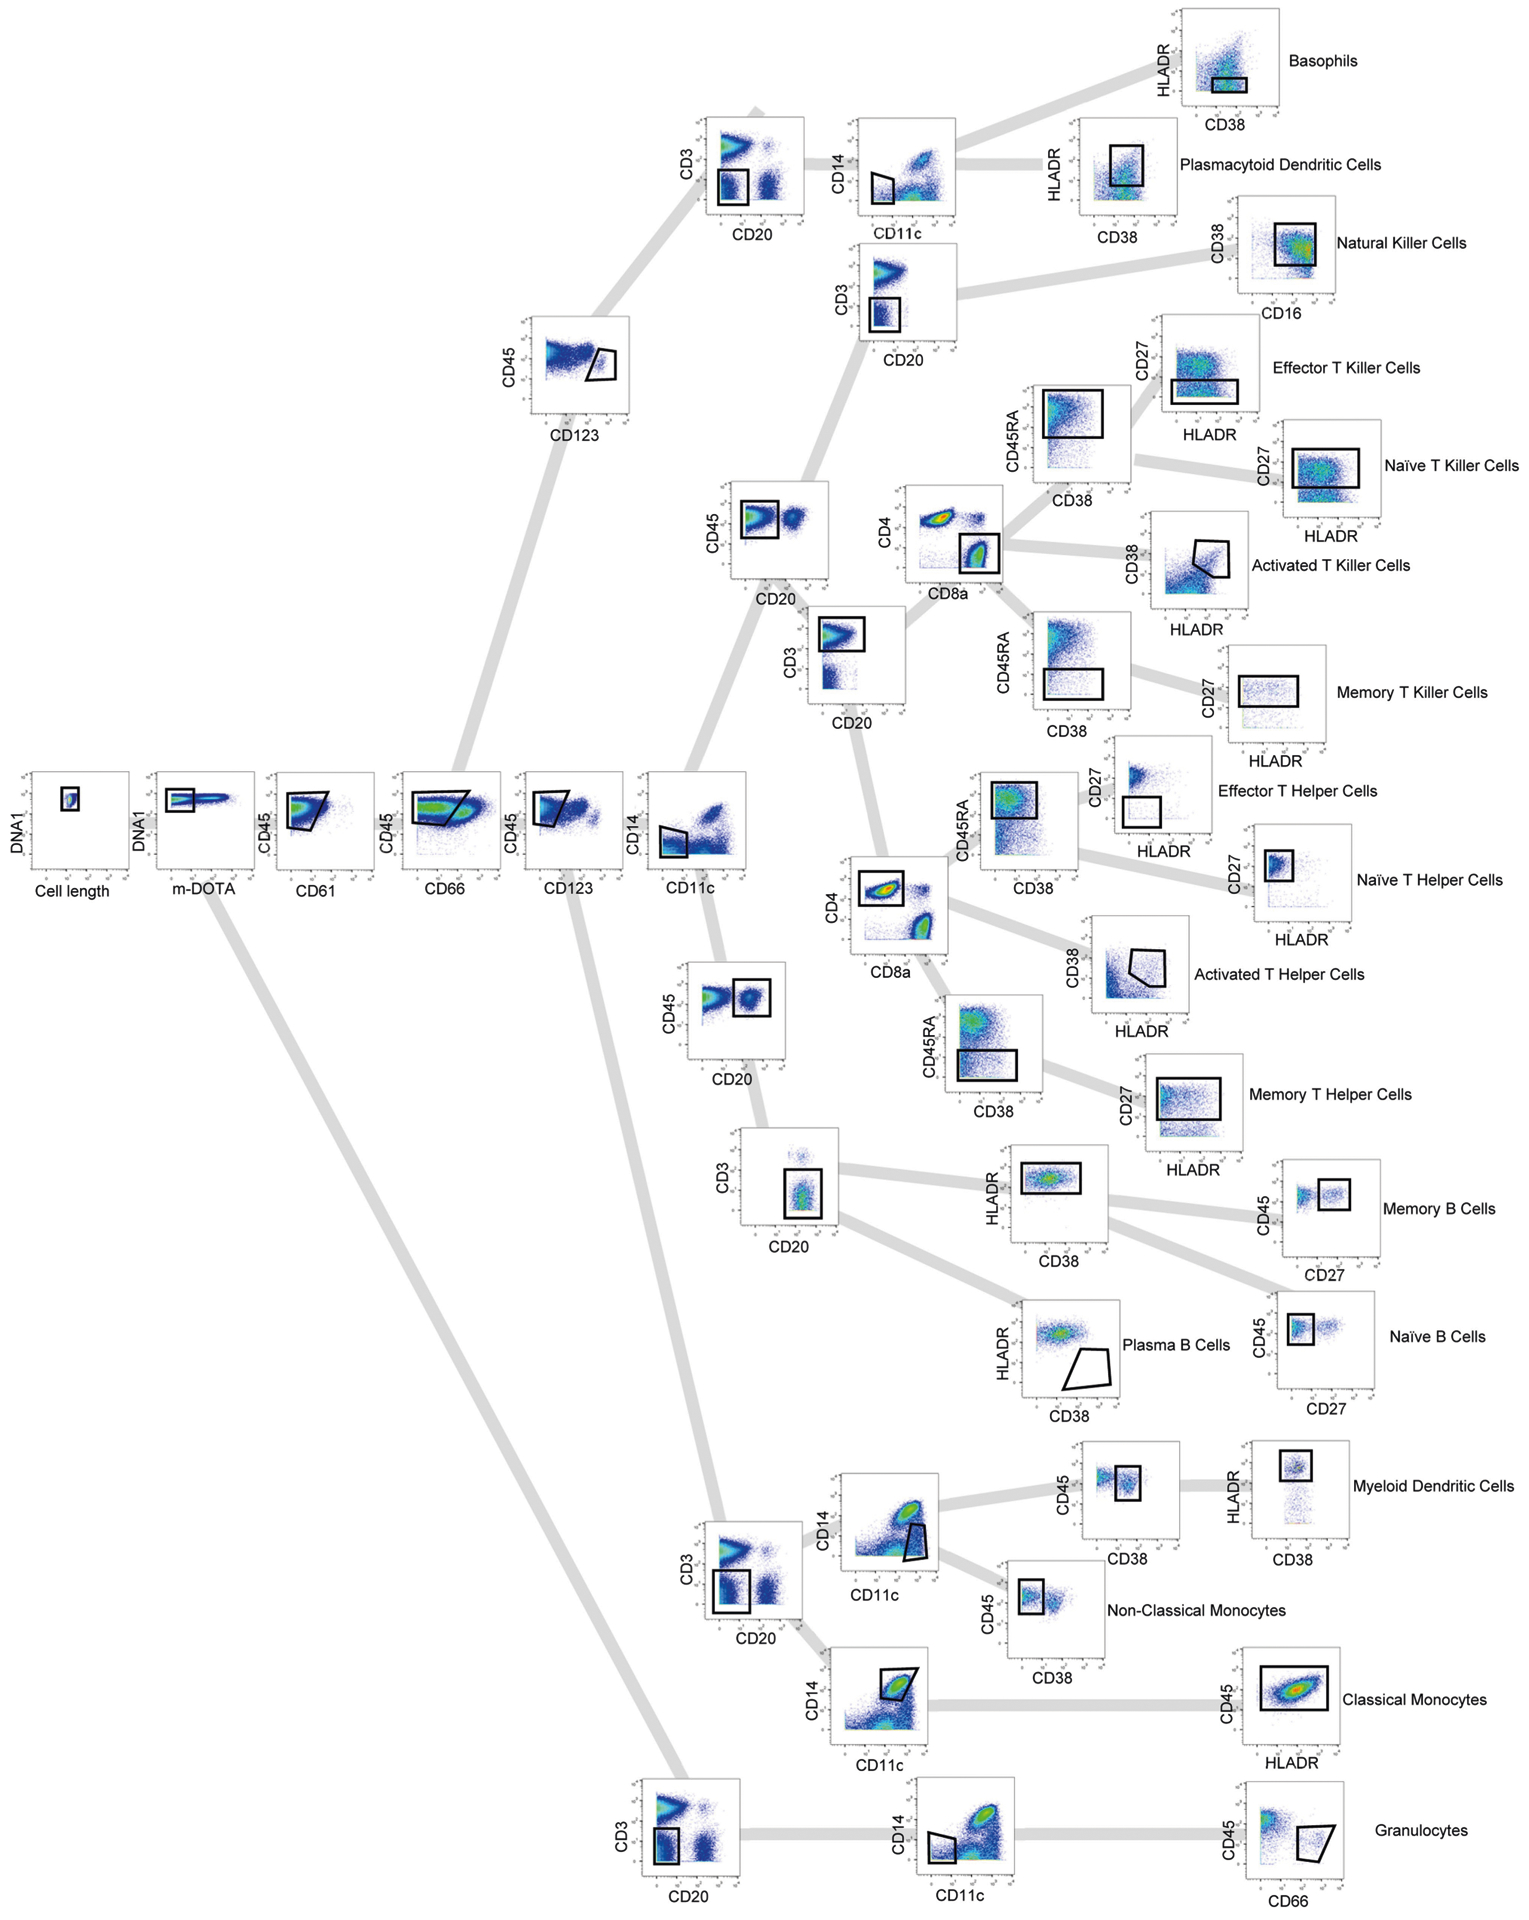
A gating strategy was used to identify populations of immune cells by mass cytometry.
Extended Data Fig. 3 |. Mass cytometry SPADE and CITRUS clustering shows increased numbers of CD8+ TEMRA cells in MCI or AD.
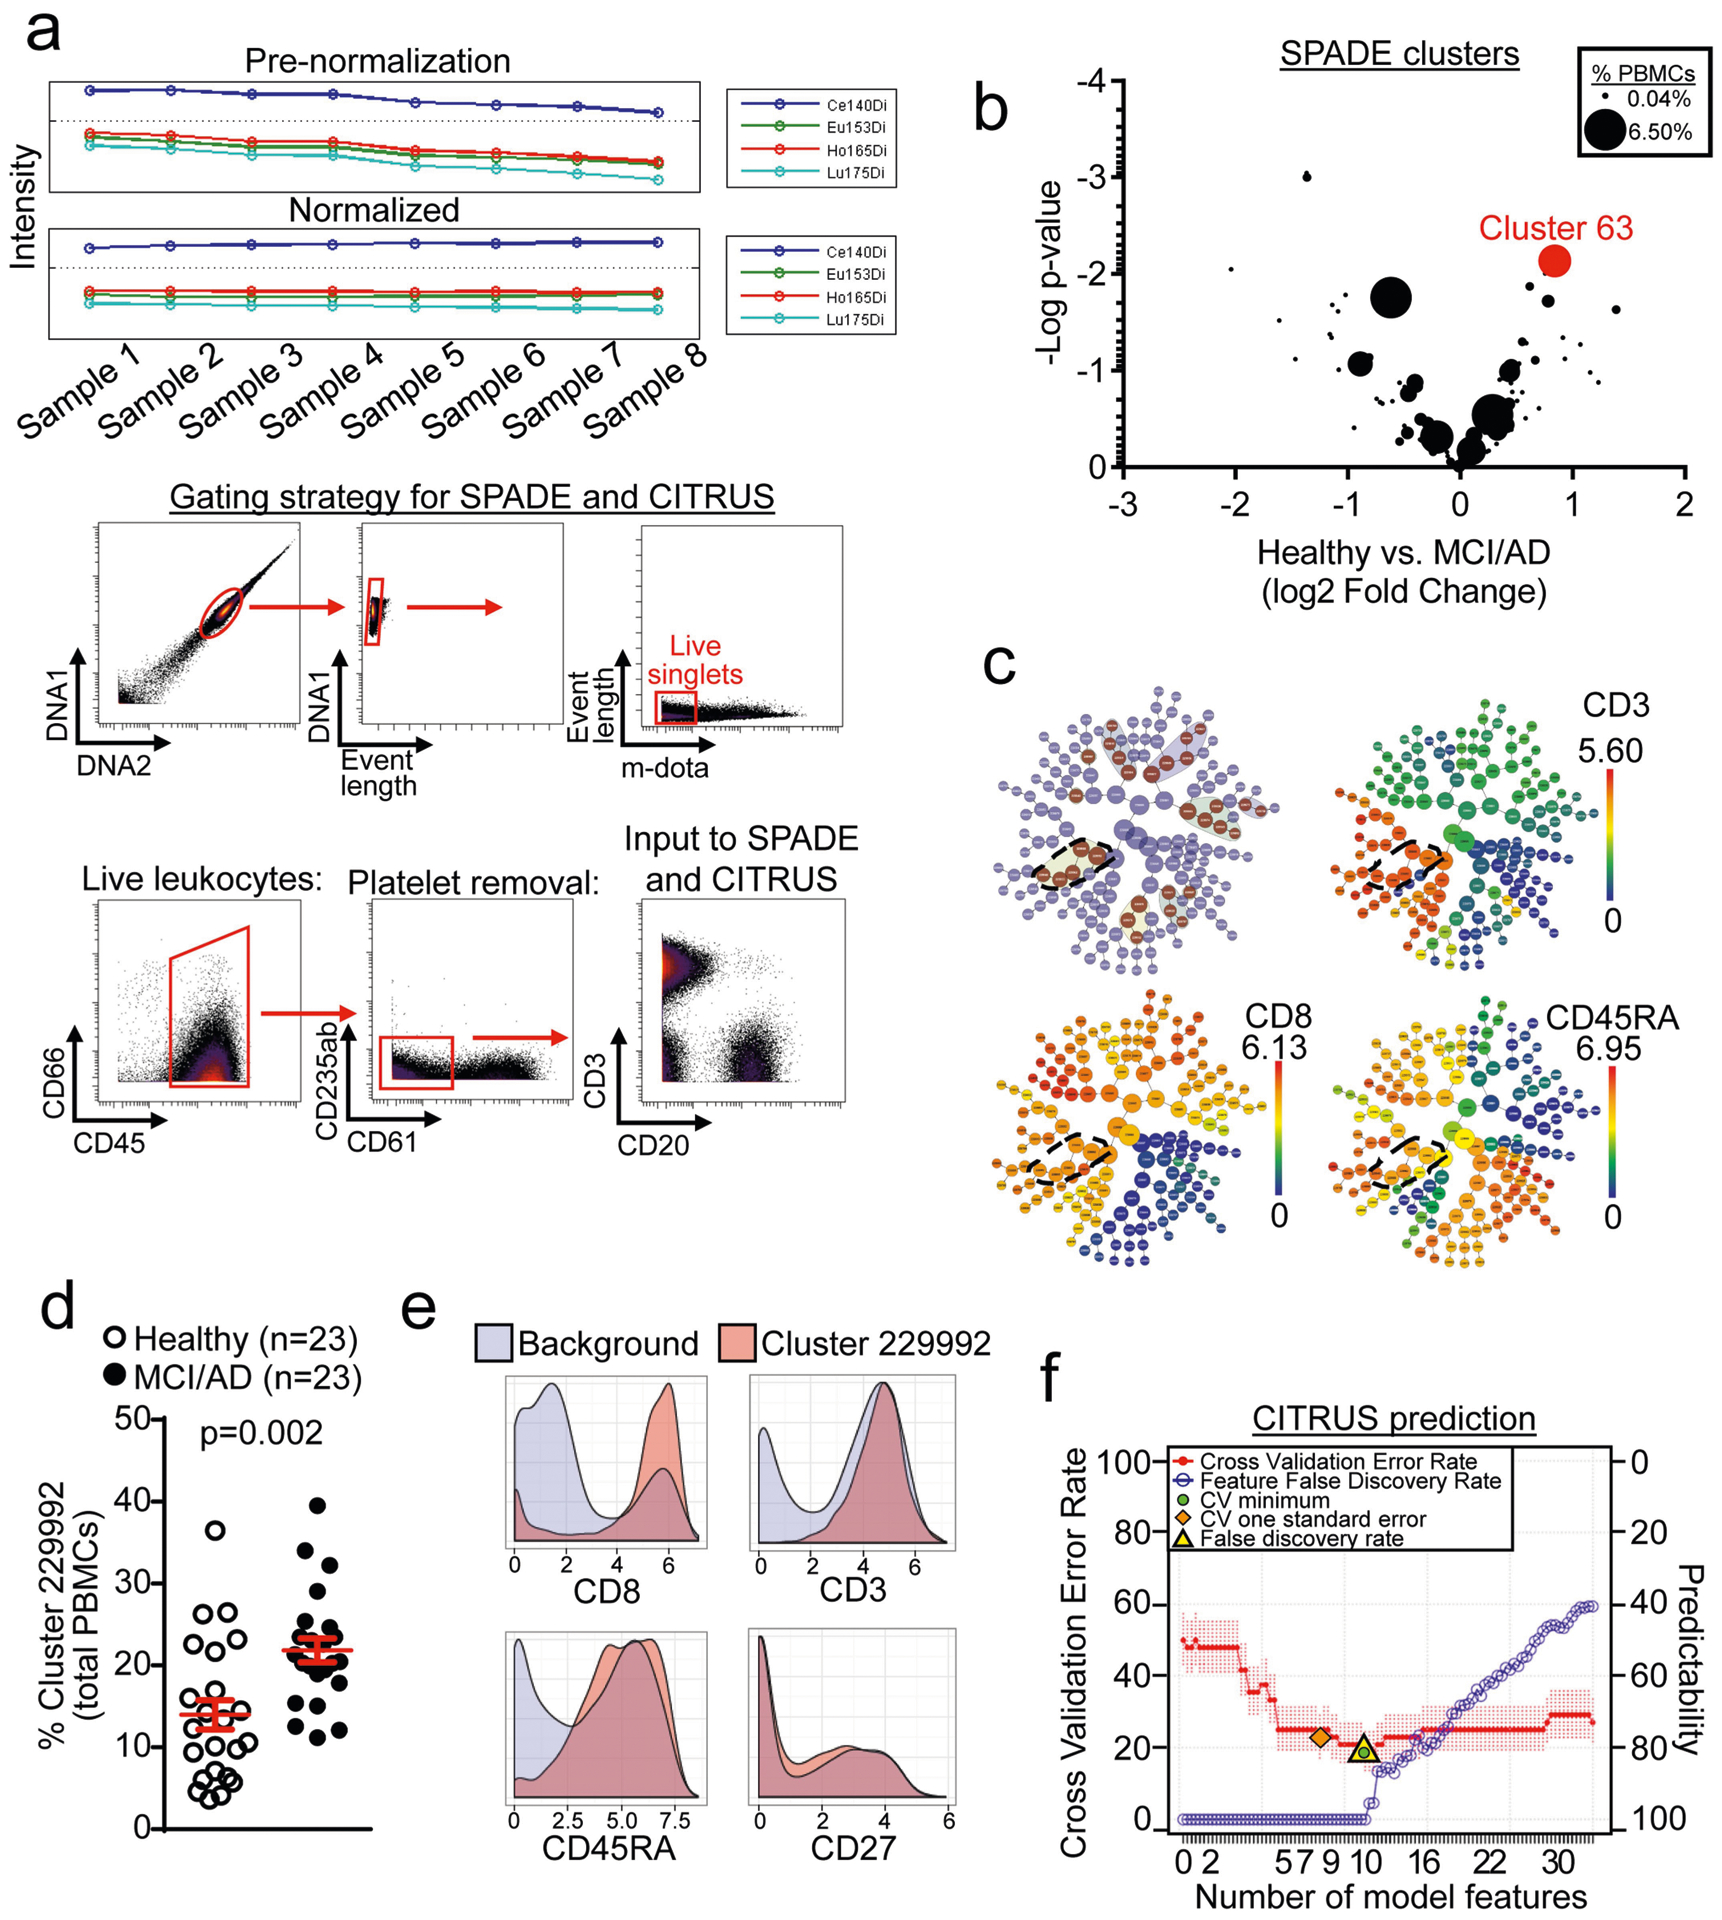
a, Normalization of mass cytometry data was performed before all analyses. A gating strategy for input into downstream analyses is shown. Live, single leukocytes were selected for analysis. b, Plotting of clusters by P value and fold change of each cluster reveals cluster 63 as the most highly increased cluster among patients with MCI or AD. Clusters are sized according to their percentage of total PBMCs. Unpaired two-sided t-test (n = 57 healthy; n = 23 MCI or AD). c, CITRUS clustering showing significant differentiating populations (top left). Cluster 229992 and its significant daughter populations are outlined. Expression of CD3, CD8 and CD45RA shows that cluster 229992 corresponds to CD8+ TEMRA cells. d, Quantification of cluster 229992 cells as a percentage of total PBMCs for individual subjects. Percentages of this cluster are significantly higher in patients with MCI or AD than healthy control individuals. Unpaired two-sided t-test with Welch’s correction; mean ± s.e.m. e, Marker expression of cluster 229992 shows it to be a CD3+CD8+CD45RA+CD27− TEMRA population. f, The regularized supervised learning algorithm from CITRUS predicts disease group with a 20% error rate (80% positive predictability). The number of model features increases from left to right. The most predictive model is shown as the lowest cross validation error rate (red line) constrained by the false discovery rate (yellow triangle).
Extended Data Fig. 4 |. Altered CD8+ T cell subsets in PBMCs from patients with MCI or AD.
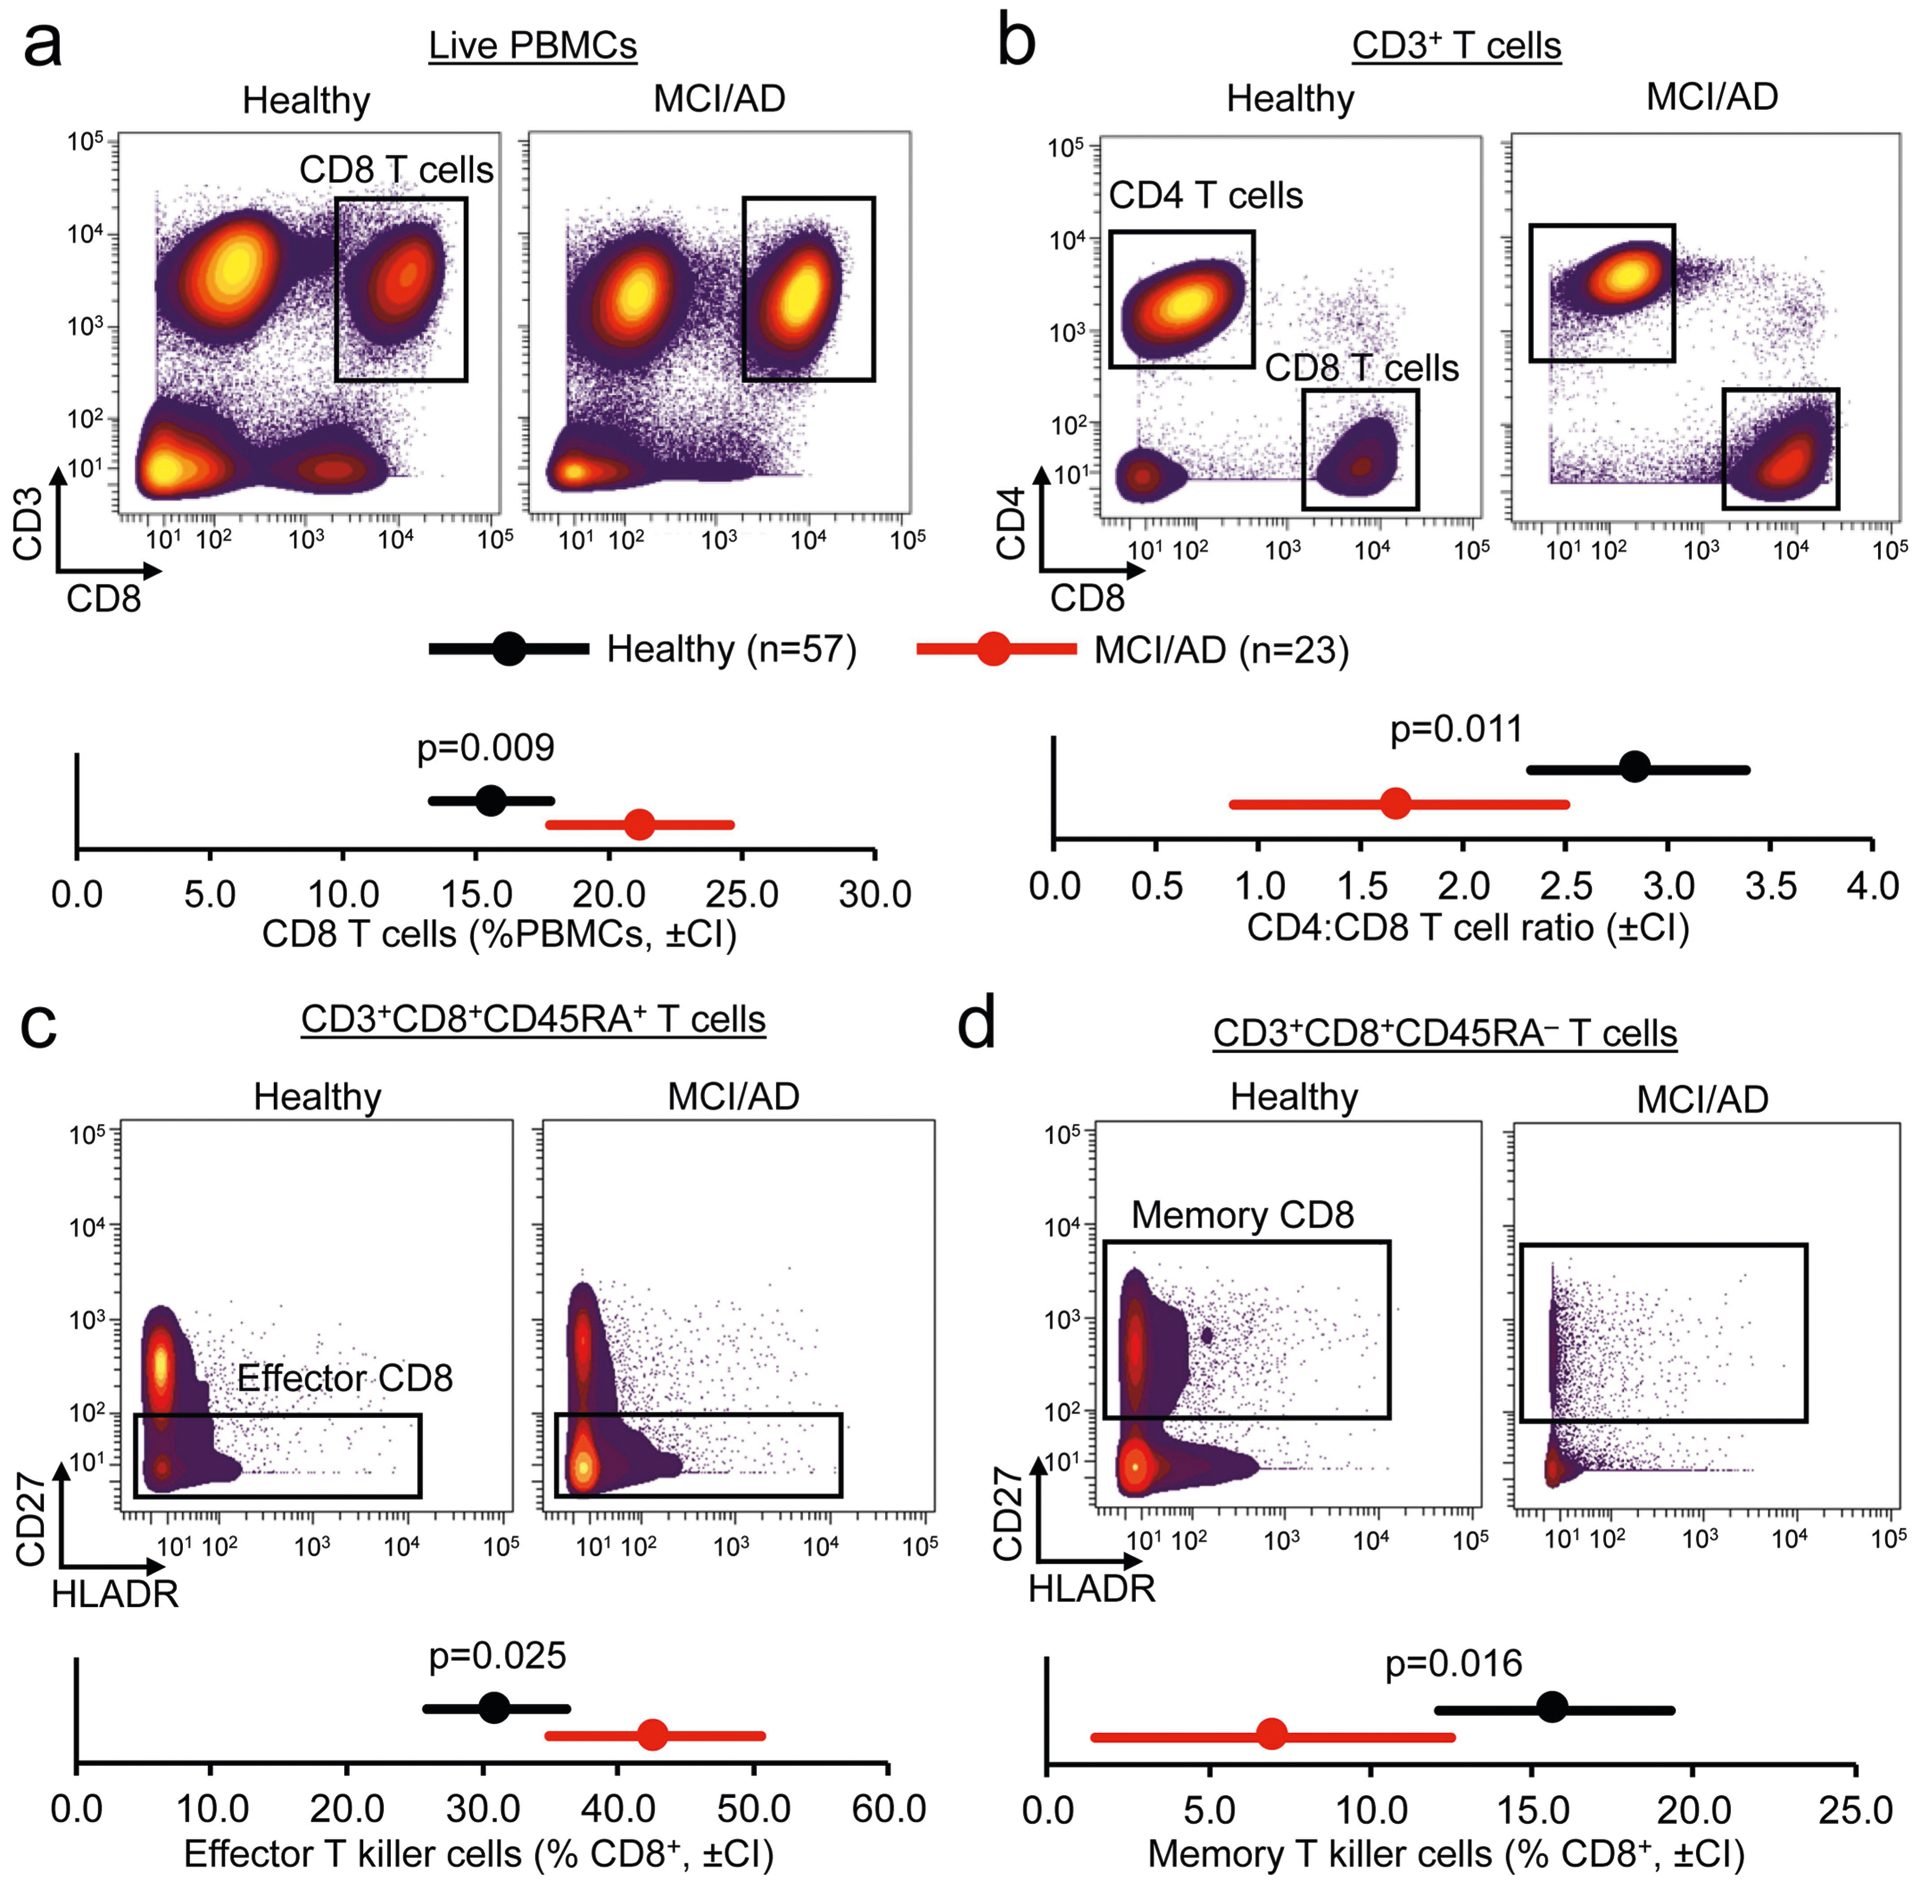
a, Mass cytometry plots of live PBMCs show increased abundance of CD3+CD8+ T cells in patients with MCI or AD. b, Gating of CD3+ T cells into CD4 and CD8 populations shows increased prevalence of CD8+ T cells in patients with MCI or AD. c, d, Significantly increased effector CD8+ T cells (c) and significantly reduced memory CD8+ T cells (d) in patients with MCI or AD. Multivariate analysis of covariance (MANCOVA) using age as a covariate, followed by post-hoc pairwise comparisons of estimated marginal means by unpaired two-sided t-test. Bonferroni correction for multiple comparisons. Confidence intervals (CI) of 95% are shown.
Extended Data Fig. 5 |. Correlations of memory T cell populations with cognitive scores.
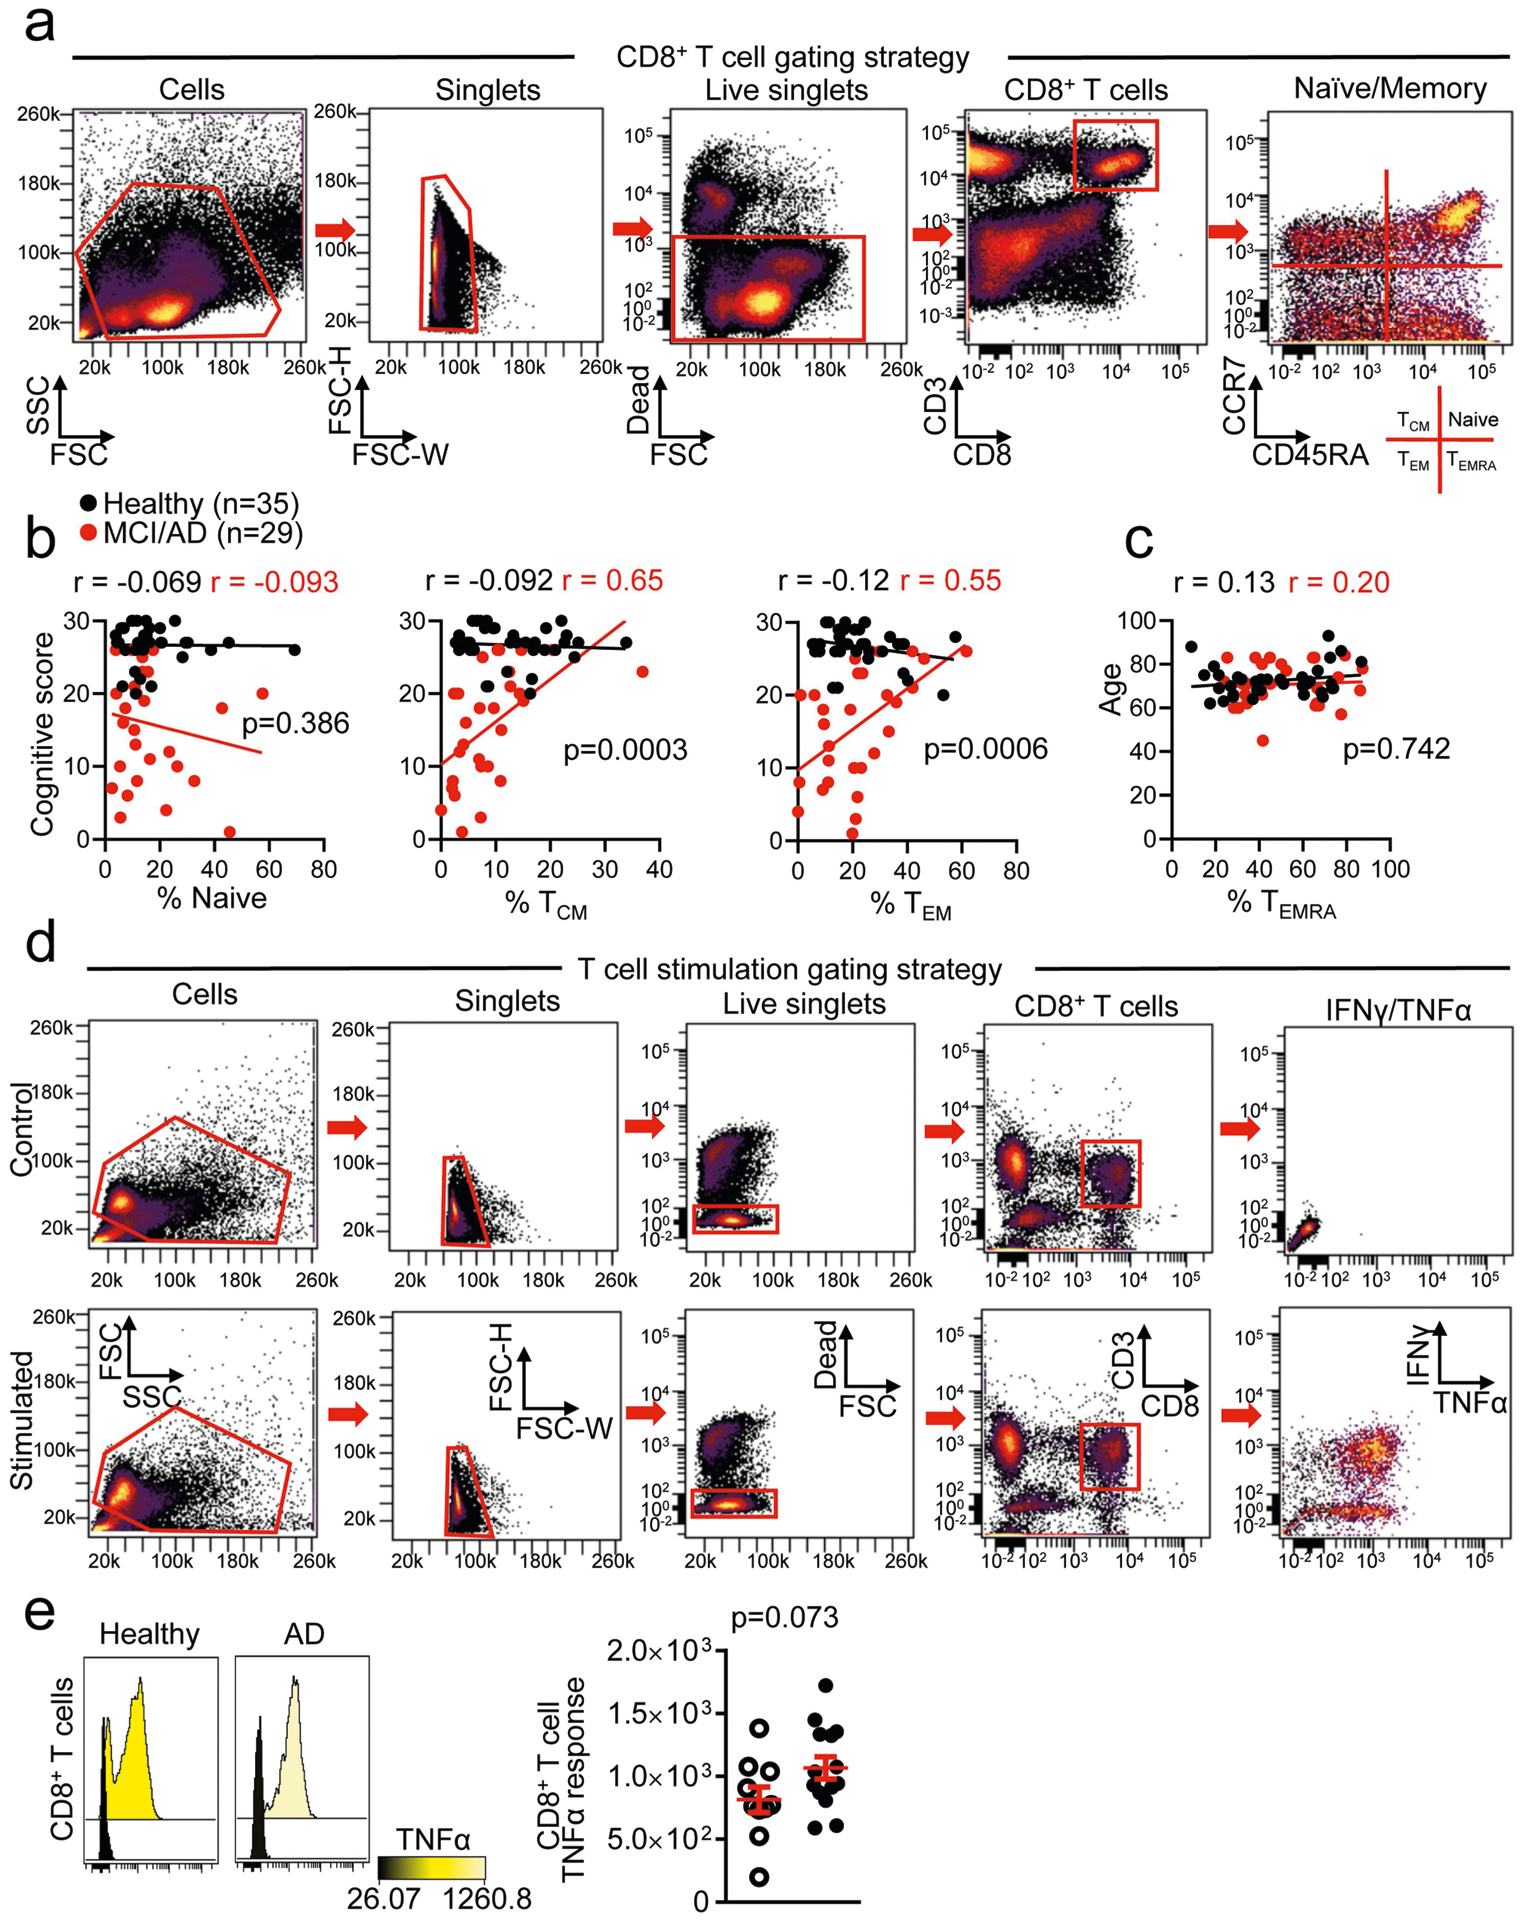
a, Gating strategy for measuring memory T cell populations. b, Linear regression analysis correlating CD8+ T cell populations with cognitive scores indicates a positive relationship between TEM and TCM CD8+ T cells and no relationship with naive cells. The significance of the difference between datasets was measured by ANCOVA. c, The relationship between the percentage of CD8+ TEMRA cells and cognitive score was not influenced by age. The significance of the difference between the two datasets was measured by analysis of covariance (ANCOVA). Pearson’s correlation r values are shown for each group (b, c). d, Gating strategy for T cell stimulation experiments. e, Increased intracellular TNF cytokine response in PMA-ionomycin-stimulated CD8+ T cells from patients with MCI or AD. Unpaired two-sided t-test with Welch’s correction (n = 10 healthy; n = 14 MCI or AD); mean ± s.e.m.
Extended Data Fig. 6 |. Analysis of peripheral CD8+ TEMRA cells by scRNA-seq.
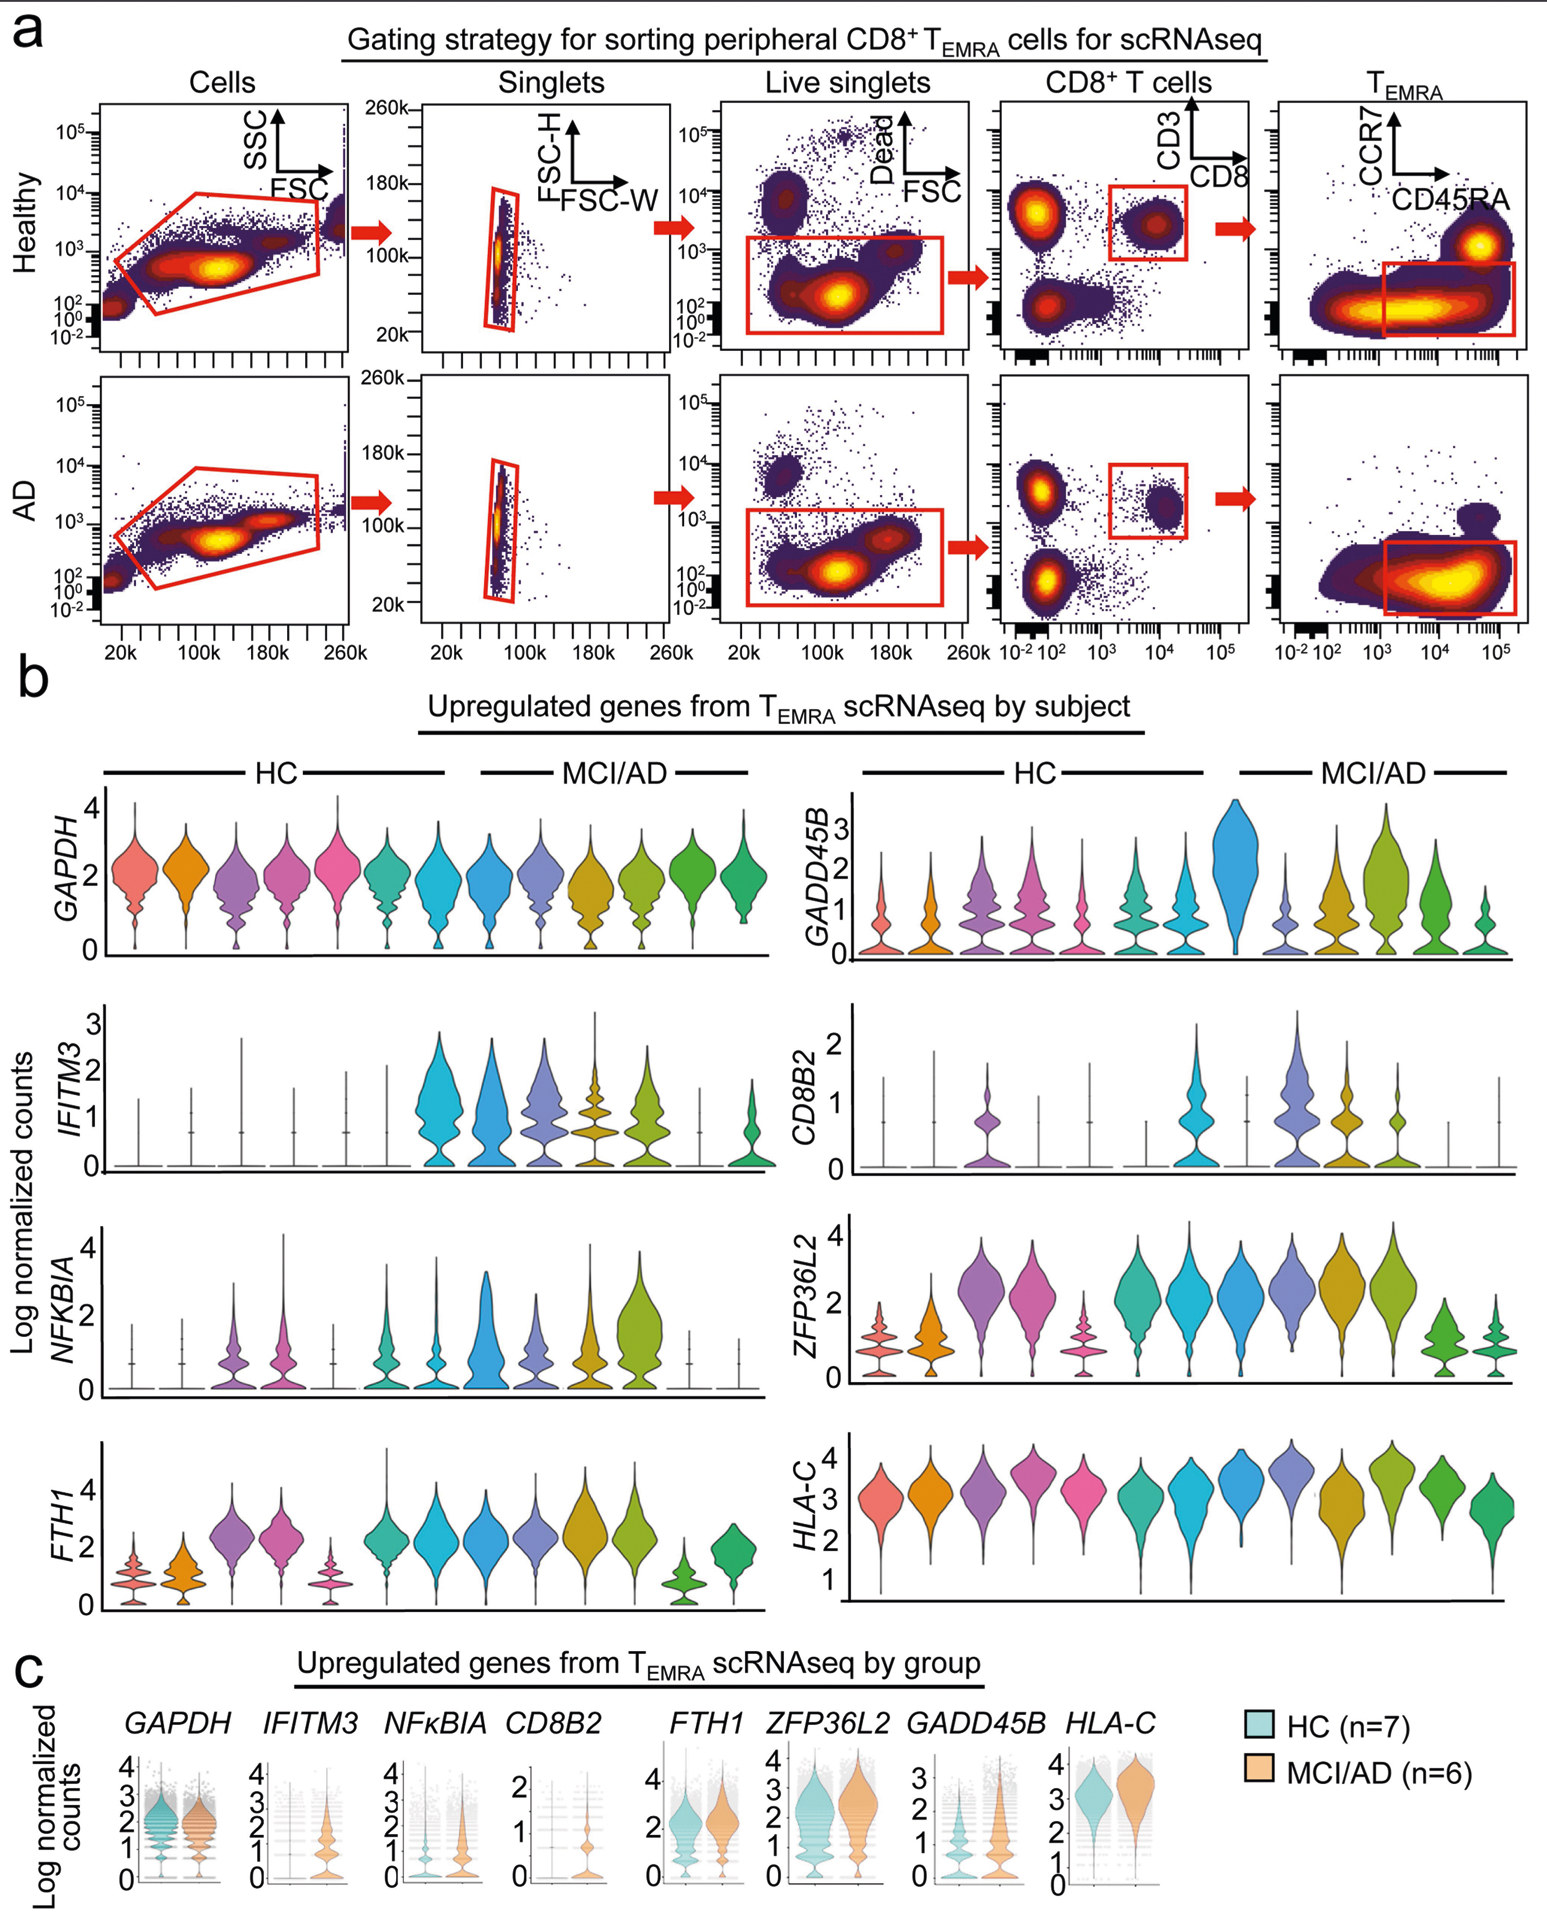
a, Gating strategy for sorting peripheral CD8+ TEMRA cells for scRNA-seq. b, Differential expression analysis by scRNA-seq of CD8+ TEMRA cells from patients with MCI or AD versus CD8+ TEMRA cells from healthy individuals shows significantly increased expression of genes that are involved in T cell signalling, including IFITM3, NFKB/A and CD8B2. Violin plots show average log-normalized counts for significantly upregulated genes in MCI or AD CD8+ TEMRA cells by individual patient (n = 7 healthy; n = 6 MCI or AD). c, Violin plots show average log-normalized counts for significantly upregulated genes in MCI or AD CD8+ Temra cells by group. GAPDH is shown as a control. Each dot represents a single cell.
Extended Data Fig. 7 |. Histological analysis of CD8+ T cells in hippocampi from patients with AD and from APP/PS1 mice.
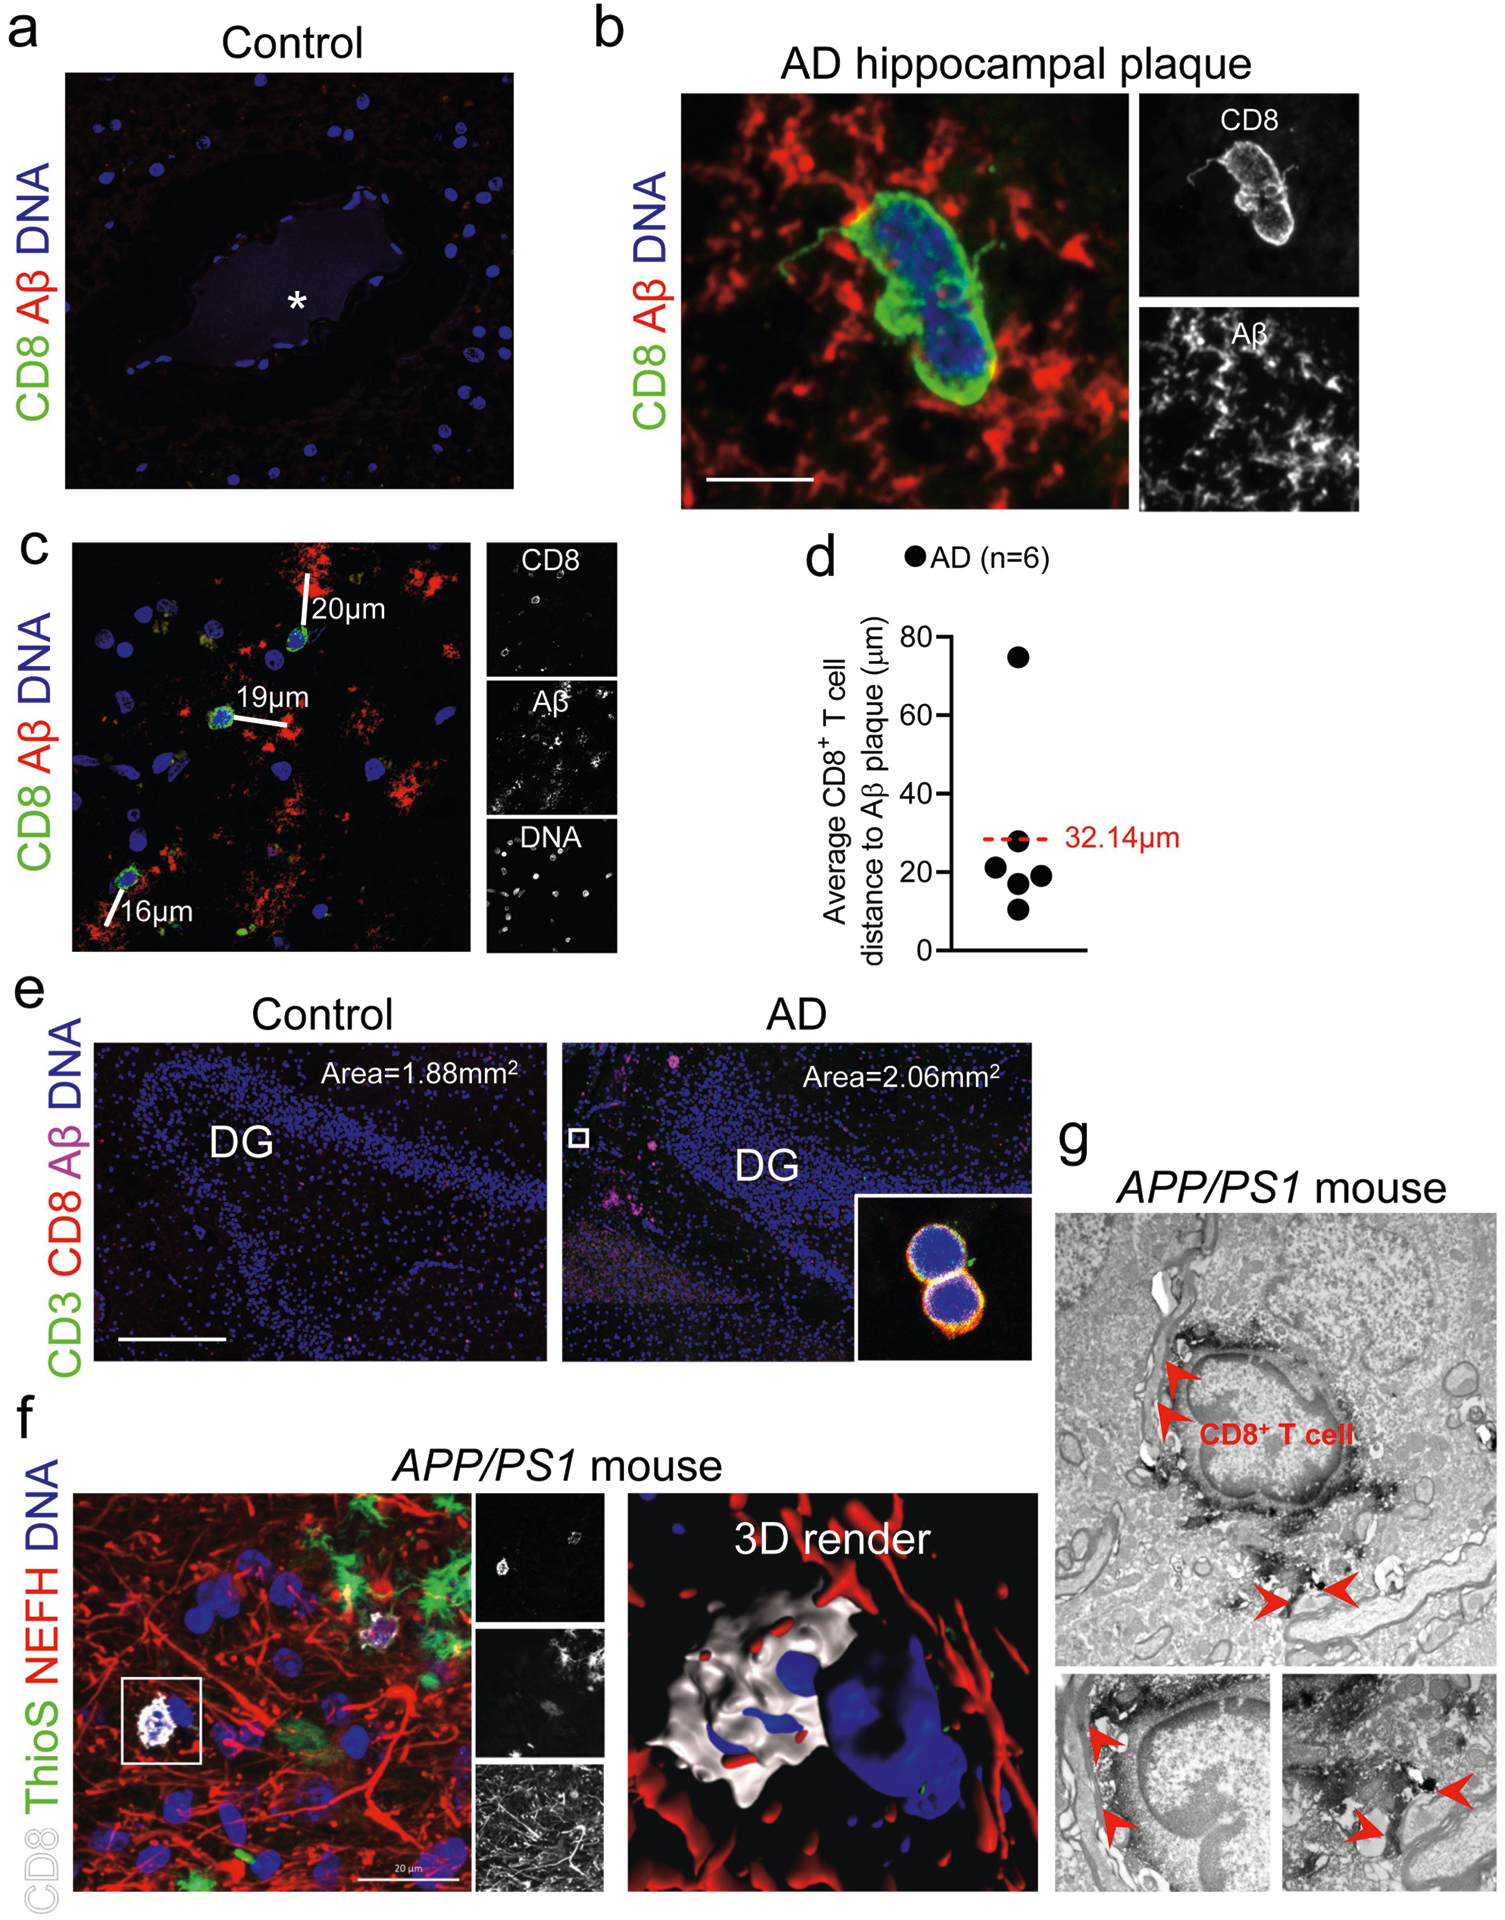
a, A blood vessel in the brain of a control (non-neurological disease) patient shows a lack of extravascular CD8+ T cells. Asterisk indicates the blood vessel lumen. b, A CD8+ T cell within an Aβ plaque. Scale bar, 5 μm. c, CD8+ T cells in the AD-affected hippocampus in close proximity to Aβ plaques. White lines measure the distances from each cell to the nearest plaque centre. Data in a, b were replicated in at least three independent experiments. d, Quantification of the average distance from CD8+ T cells to the nearest Aβ plaque. The dashed red line indicates the average of all cells. e, Representative images of the dentate gyrus that were used to quantify CD3+CD8+ T cells in the hippocampi of control individuals and patients with AD. Inset shows two CD3+CD8+ T cells. Sizes of the area plots used for quantification are shown for each image. Scale bar, 500 μm. f, Association of a CD8+ T cell with NEFH+ neuronal processes by immunohistochemistry and 3D modelling in the APP/PS1 mouse model of cerebral amyloidosis. g, Electron microscopy showing an association of a CD8+ T cell with neuronal processes. Red arrowheads indicate areas in which the CD8+ T cell associates with neuronal processes. Data in e-g were replicated in at least two independent experiments.
Extended Data Fig. 8 |. Clonal expansion of T cells in the CSF.
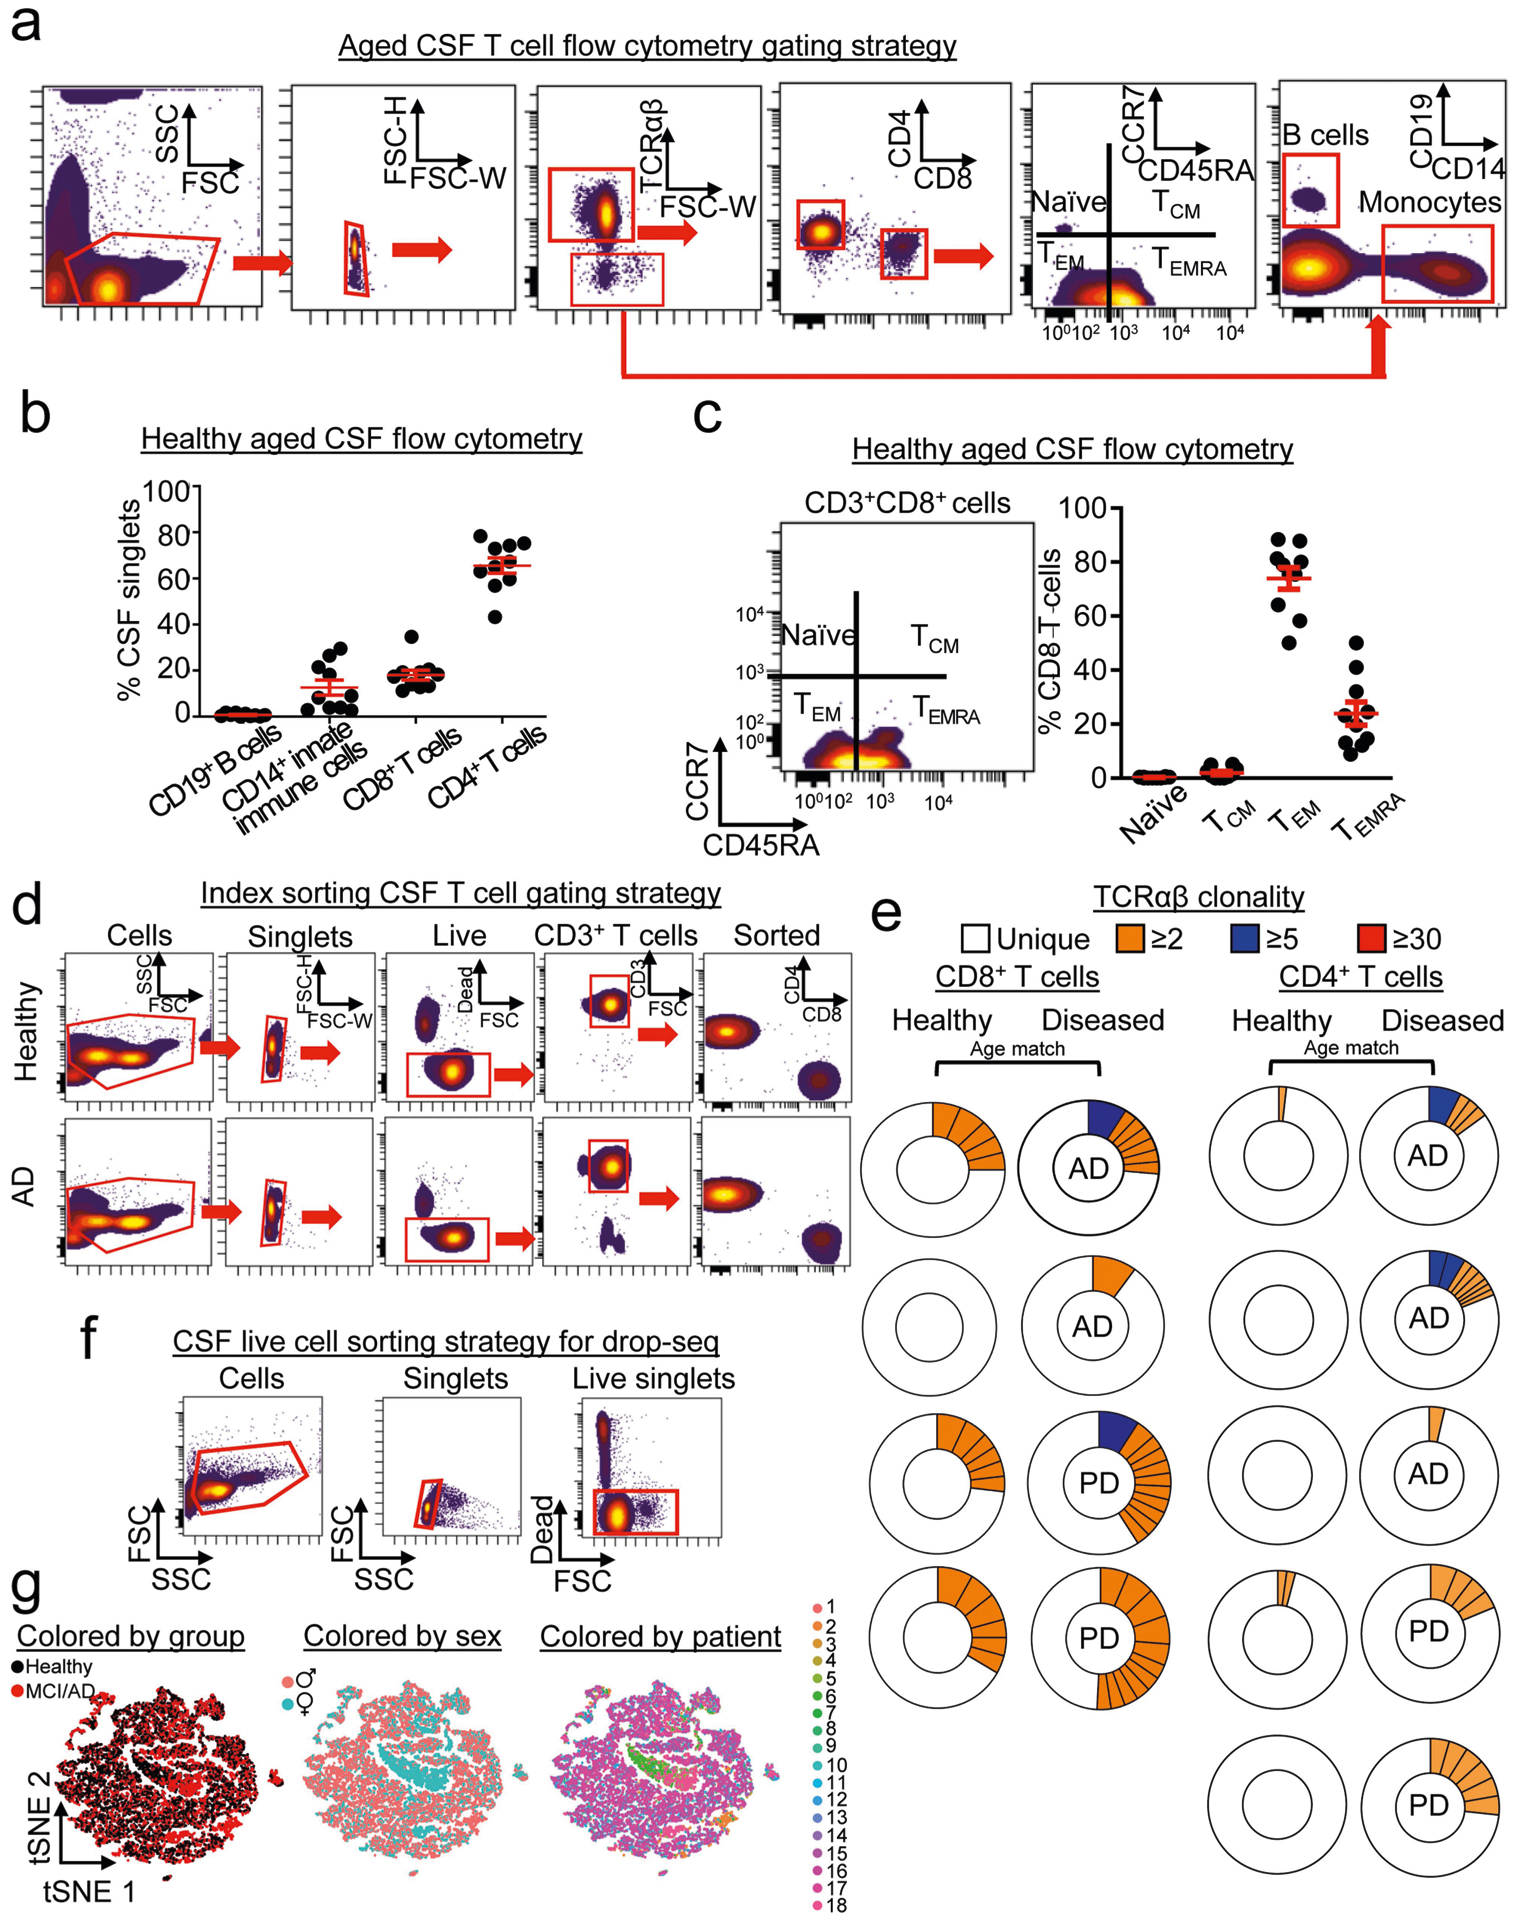
a, Gating strategy for enumerating T cell subtypes in CSF from healthy elderly individuals. b, Quantification of CSF cells shows that the majority of cells are T cells, with a minority population of CD14+ monocytes and a quantifiably minor number of CD19+ B cells (n = 10 healthy subjects); mean ± s.e.m. c, Quantification of CD8+ T cell subsets shows that the majority of cells are TEM or TEMRA cells (n = 10 healthy subjects); mean ± s.e.m. d, Single-cell sorting of CSF cells shows that CD4 and CD8 T cells were sorted from control individuals and patients with AD. Data were replicated in two independent experiments. e, Donut plots depicting CSF clonality in plate-seq samples. Clones are coloured by their proportion of the total TCRαβ sequences for each subject. f, Gating strategy for drop-seq experiments. Live CSF cells were sorted using a live/dead marker. g, Multidimensional reduction and visualization by t-SNE shows distribution of CSF cells by group, sex and patient (n = 9 healthy, n = 9 MCI or AD).
Extended Data Fig. 9 |. Clonally expanded CD8+ T cells in CSF from patients with AD and patients with PD.
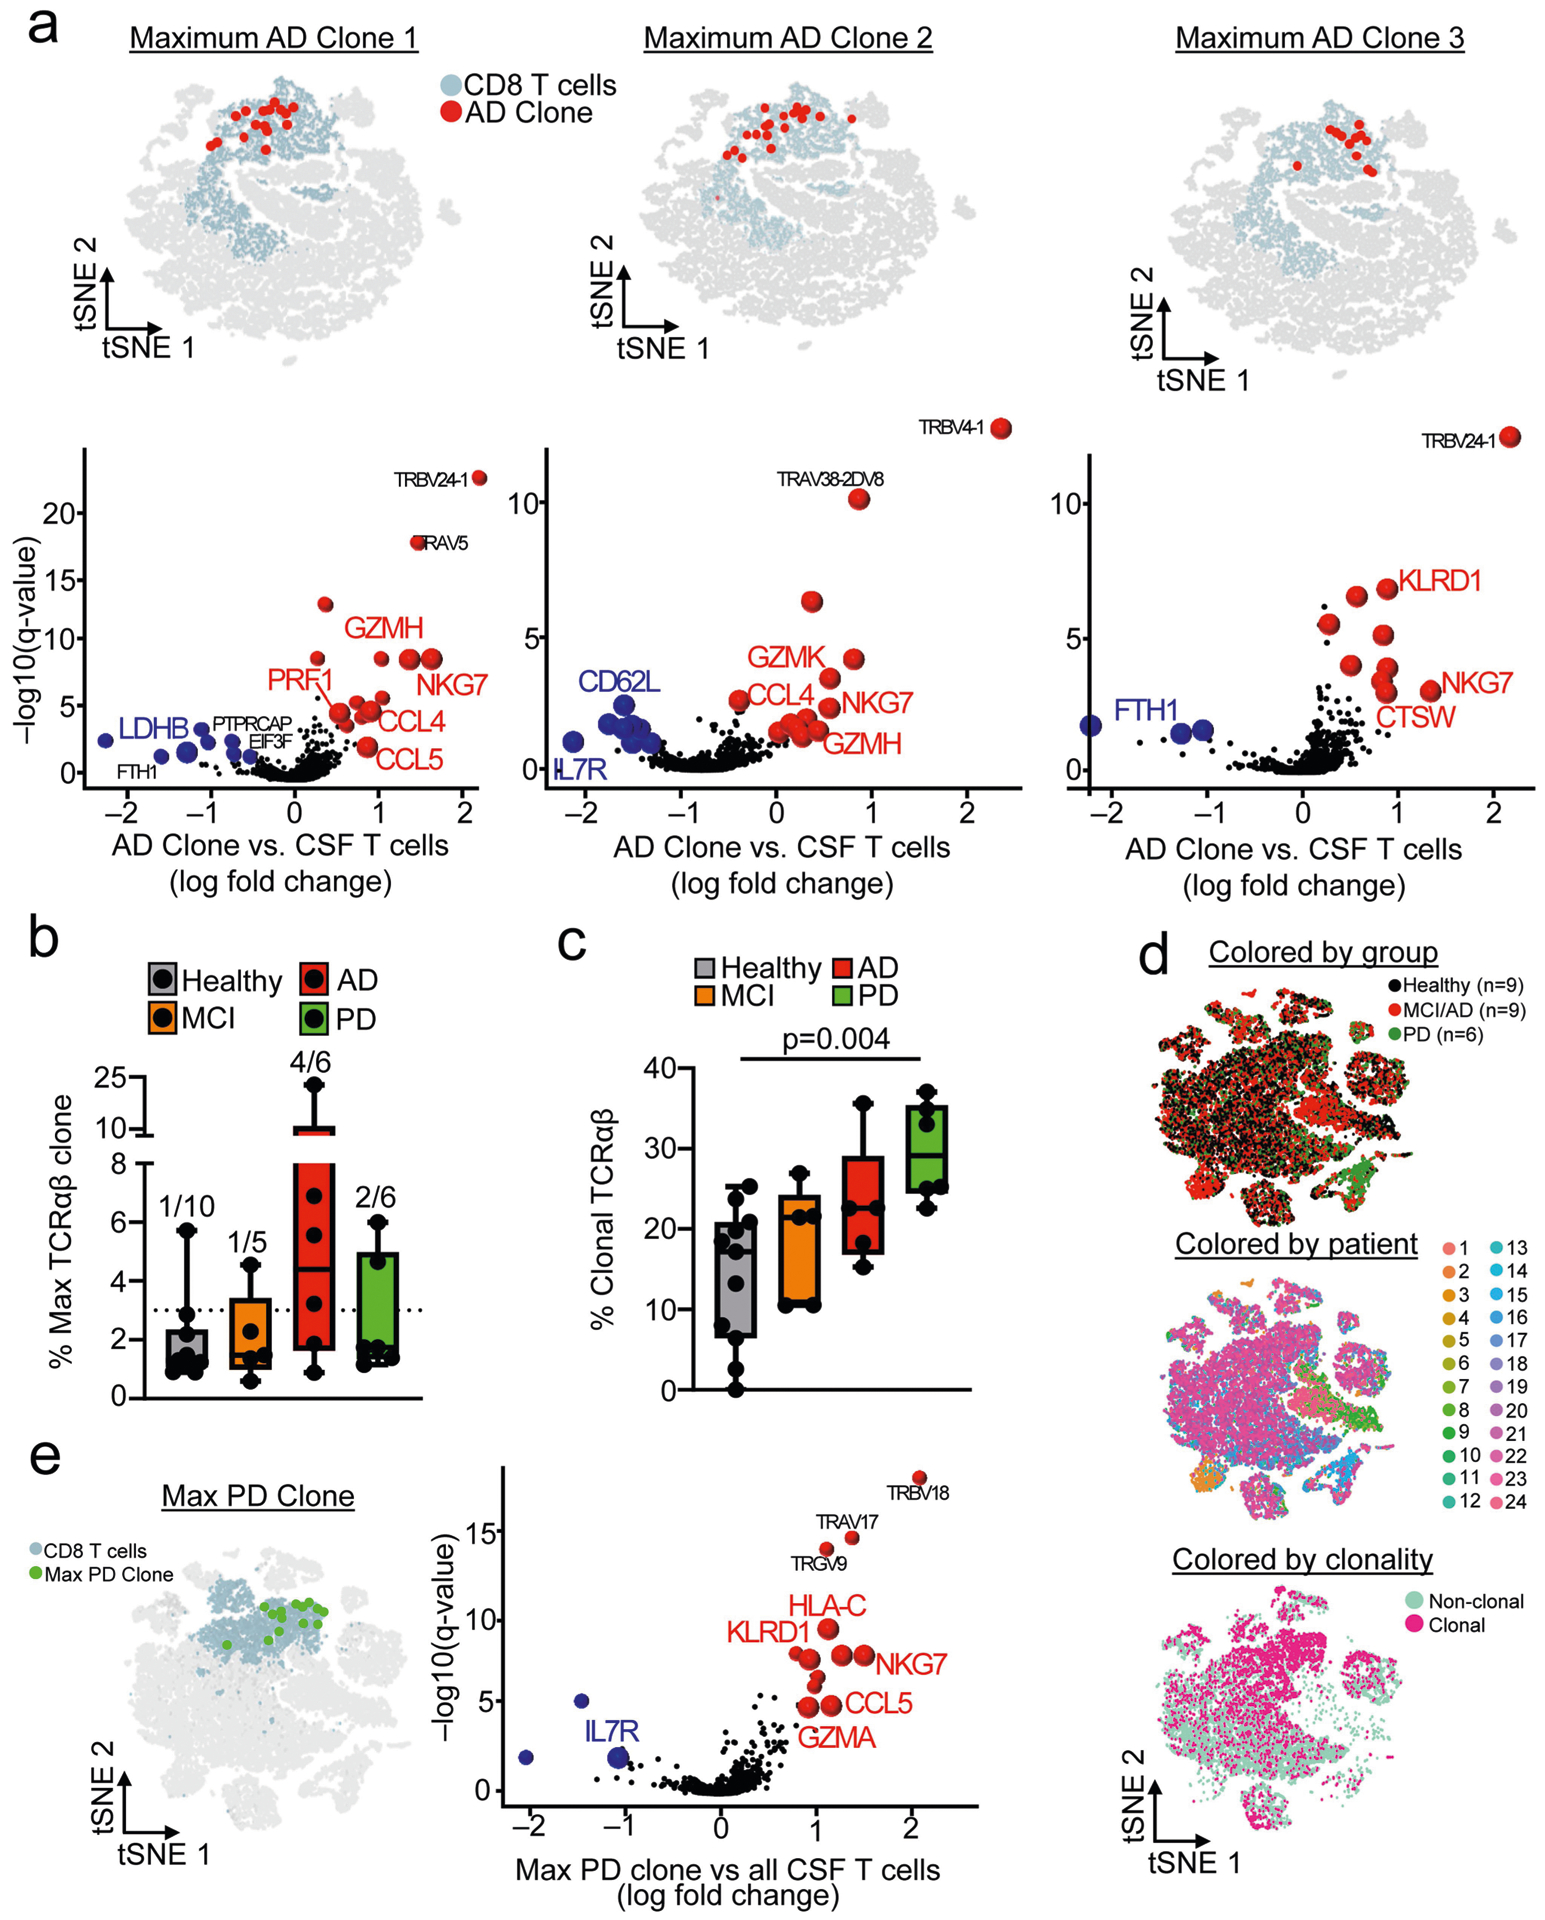
a, The top individual clones in AD were assessed by combining scRNA-seq and scTCR-seq datasets. A MAST differential expression test with Benjamini-Hochberg correction was conducted to compare CD8+ T cell maximum clones (n = 12–18 cells) from patients with MCI or AD against all CSF T cells. Note the colocalization ofAD clones with CD8+ clusters on the t-SNE plots. b, Separate analysis of patients with MCI, AD and PD by percentages of maximum clones revealed an enrichment of highly expanded clones (defined as comprising 3% or more of all TCRαβ sequences; indicated by dotted line) in patients with these diseases. Only one out of ten healthy subjects had a highly expanded clone in their CSF, versus four out of six patients with AD, two out of six patients with PD and one out of five patients with MCI. c, Quantification of overall clonality (defined as the percentage of total TCRαβ sequences that are identical to one or more TCRαβ sequences) in the four groups of cohort 4. Significance was measured by two-way ANOVA followed by Tukey’s multiple comparisons test. Only samples with detectable clones were included in the analysis (n = 11 healthy; n = 5 MCI; n = 5 AD; n = 6 PD). Box plots in b, c Box plots show median and 25th to 75th percentiles, and whiskers indicate the minimum and maximum values. d, Gene-expression analysis was conducted on all 24 samples and clustered by t-SNE. Clusters were composed of a mixture of groups, patients, clonal and non-clonal cells. e, Genes (encoding cytotoxic effector proteins) that showed increased expression in a maximum PD clone (n = 14 cells) were analogous to those observed to be overexpressed in AD clones. MAST differential expression test with Benjamini-Hochberg correction.
Extended Data Fig. 10 |. EBV BZLF1 antigen identification in the CSF of patients with AD.
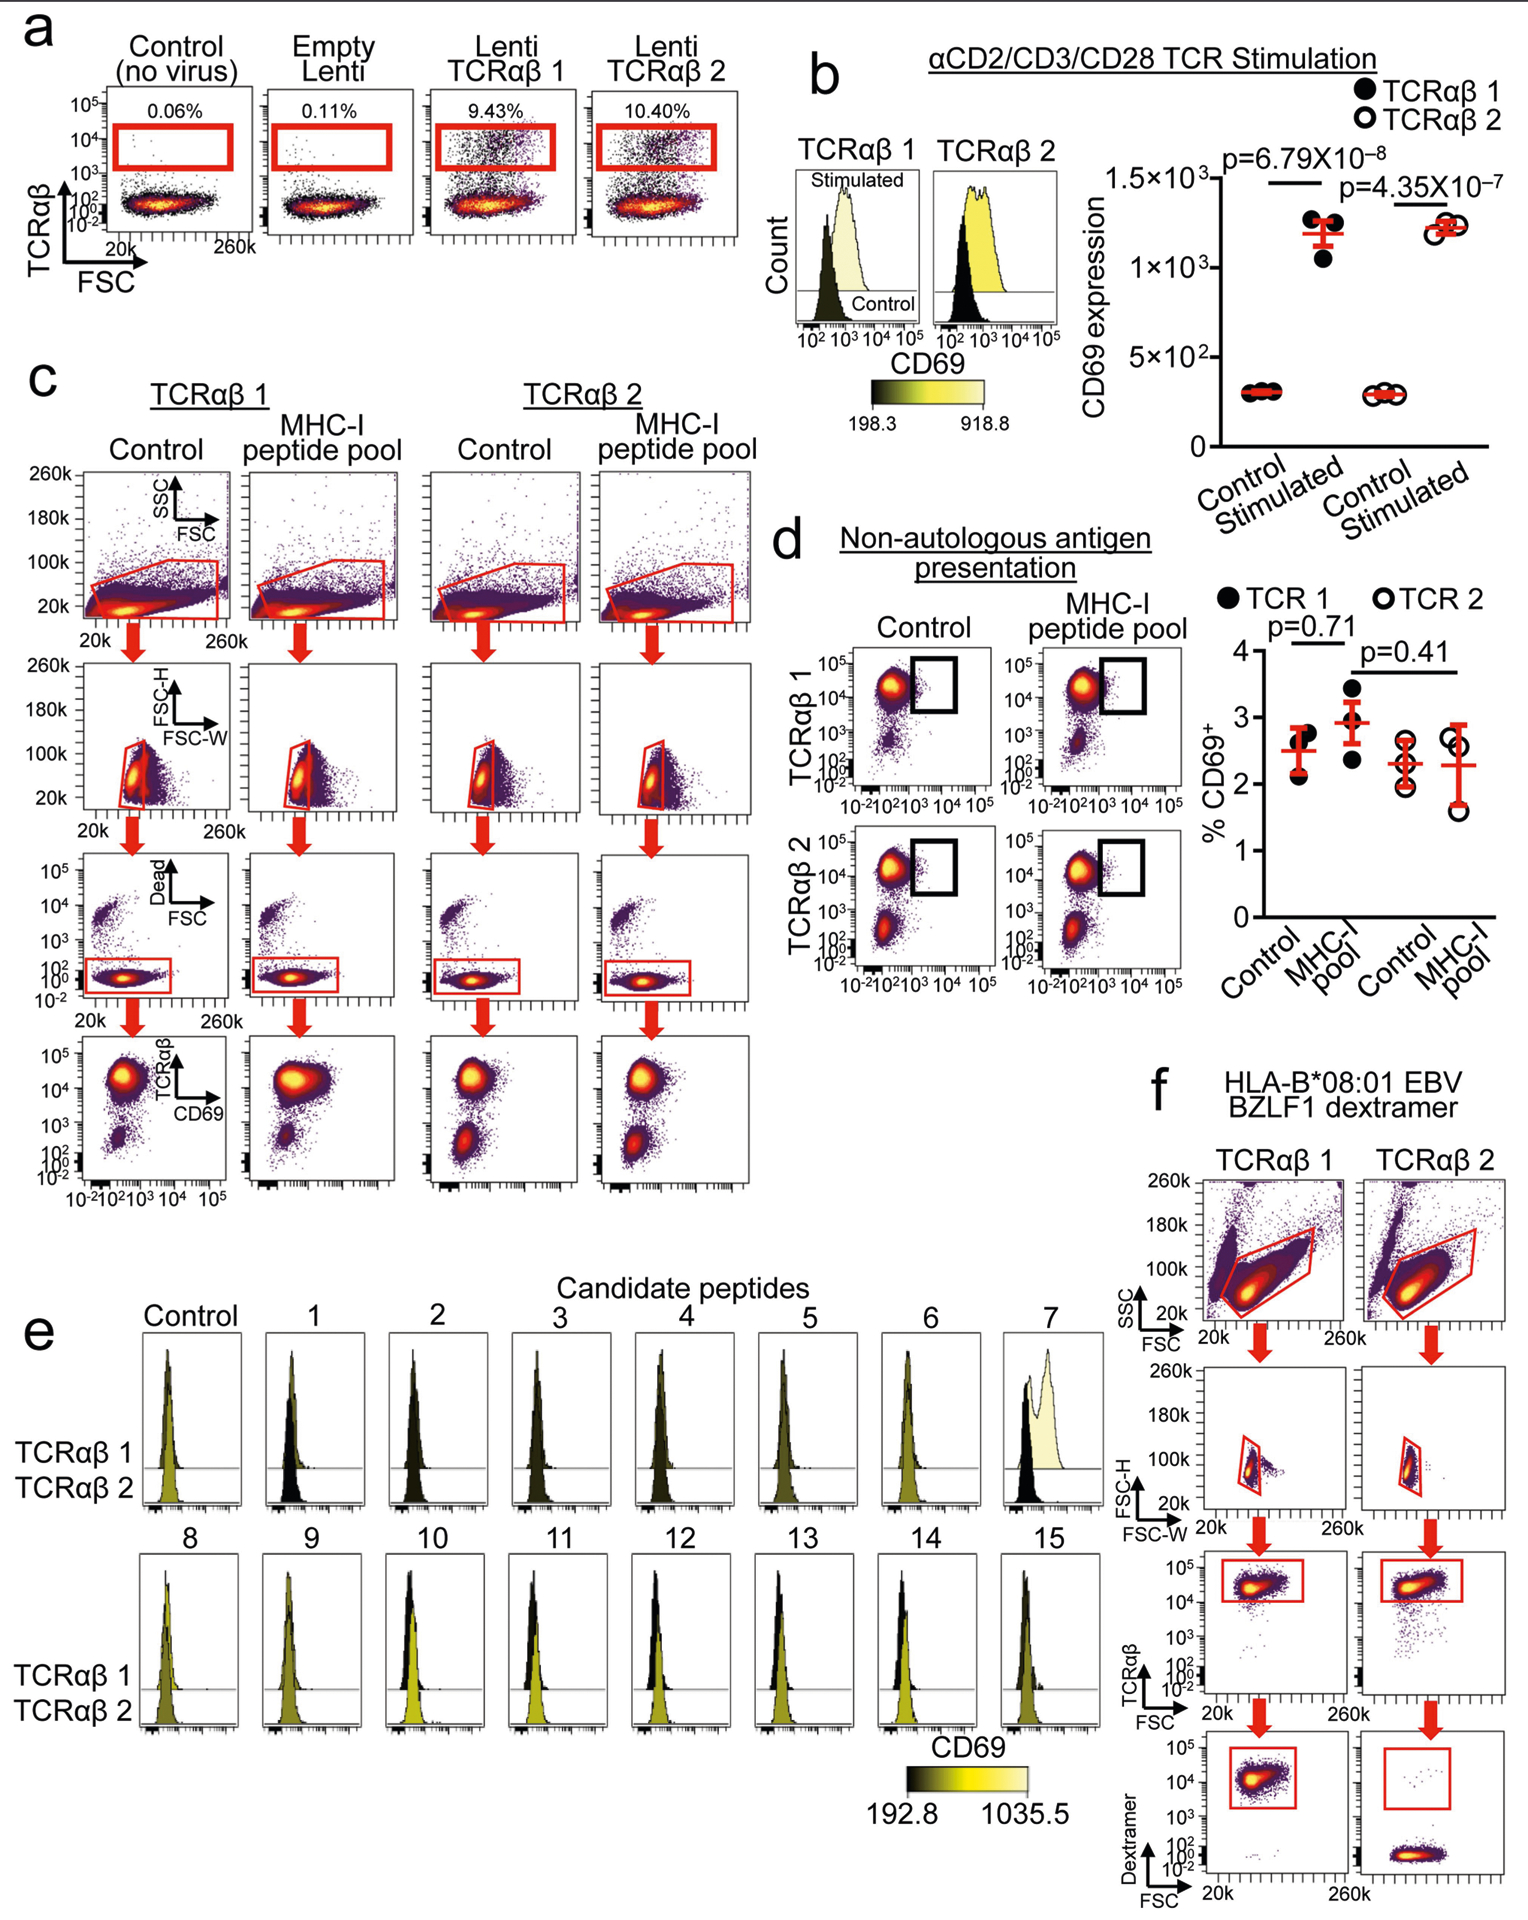
a, TCRβ chains derived from GLIPH were used to clone two full TCRαβ TCRs that were introduced into TCR-deficient SKW-3 cells by lentiviral transduction. TCRαβ 1 and TCRαβ 2 cell lines expressed TCRαβ by flow cytometry but controls (no virus and empty lenti viral vector) did not express TCRαβ. Data were replicated in three independent experiments. b, Both TCRαβ 1 and TCRαβ 2 cells upregulate the activation marker CD69 after stimulation with αCD2/CD3/CD28 beads (n = 3 per group). One-way ANOVA (F(3,8) = 204.02, P = 6.78 × 10⁻⁸) with Tukey’s test for multiple comparisons; mean ± s.e.m. c, Gating strategy for MHC-I peptide pool experiments. d, TCRαβ 1 and TCRαβ 2 were presented with antigens in a non-autologous fashion (mismatch between fibroblast and TCR). No significant differences in reactivity were detected in either cell line. One-way ANOVA (F(3,8) = 1.16,P = 0.38) with Tukey’s test for multiple comparisons; mean ± s.e.m. e, Individual histograms of autologous candidate peptide stimulations. CD69 expression is shown for control DMSO and each peptide for both cell lines. Note the increased expression of CD69 induced by peptide 7 in TCRαβ 1 cells. Data were replicated in three independent experiments. f, Gating strategy for quantifying HLA-B*08:01 EBV BZLF1 dextramer positivity.
Acknowledgements
We thank M. Leipold, S. Douglas and H. Maecker from the Stanford Human Immune Monitoring Core for helpful discussion and assistance with mass cytometry experiments; B. Dulken and A. Brunet of Stanford University for sharing related mouse research; B. Carter of the Palo Alto Veterans Affairs FACS facility; V. Henderson and the entire Stanford Alzheimer’s disease Reserach Center team; G. Kerchner and S. Sha for CSF collection; G. Deutsch, C. Litovsky and M. Thieu for assistance with cognitive assessments; and V. Carr, S. Guerin, A. Trelle and the Stanford Aging and Memory Study (SAMS) team for MRI data collection. This work was supported by a Glenn/American Federation for Aging Research (AFAR) Postdoctoral Fellowship for the Biology of Aging (D.G.), a National Institutes of Health National Institute on Aging (NIA) F32 Fellowship (AG055255-01A1) (D.G.), an Irene Diamond Fund/AFAR Postdoctoral Transition Award in Aging (D.G.), a National Multiple Sclerosis Society Postdoctoral Fellowship (N.S.), the National Institutes of Health Institute for Allergy, Infectious Diseases and Immunology (U19-AI057229), the Howard Hughes Medical Institute (N.S. and M.M.D.), the Austrian Science Funds Special Research Program F44 (F4413-B23) (M.S.U.), NIA R01 AG048076 (A.D.W.), the Dana Foundation (A.D.W.), the Cure Alzheimer’s Fund (T.W.-C.), the NOMIS Foundation (T.W.-C.), the Stanford Brain Rejuvenation Project (an initiative of the Stanford Neurosciences Institute), NIA R01 AG045034 05 (T.W.-C.) and the NIA funded Stanford Alzheimer’s Disease Research Center (P50AG047366).
Footnotes
Data availability
scRNA-seq and scTCR-seq datasets have been deposited online in the Gene Expression Omnibus (GEO) under accession number GSE134578.
Competing interests
D.G., N.S., M.M.D. and T.W.-C. are co-inventors on a patent application related to this work. Patent STDU2–36496/US-1/PRO is for compositions and methods for measuring T cell markers associated with Alzheimer’s disease.
Supplementary information is available for this paper at https://doi.org/10.1038/s41586-019-1895-7.
Peer review information Nature thanks Michael T Heneka, Paul Thomas and the other, anonymous, reviewer(s) for their contribution to the peer review of this work.
Online content
Any methods, additional references, Nature Research reporting summaries, source data, extended data, supplementary information, acknowledgements, peer review information; details of author contributions and competing interests; and statements of data and code availability are available at https://doi.org/10.1038/s41586-019-1895-7.
Publisher’s note Springer Nature remains neutral with regard to jurisdictional claims in published maps and institutional affiliations.
References
- 1.Ransohoff RM How neuroinflammation contributes to neurodegeneration. Science 353, 777–783 (2016). [DOI] [PubMed] [Google Scholar]
- 2.Lindestam Arlehamn CS, Garretti F, Sulzer D & Sette A Roles for the adaptive immune system in Parkinson’s and Alzheimer’s diseases. Curr. Opin. Immunol 59, 115–120 (2019). [DOI] [PMC free article] [PubMed] [Google Scholar]
- 3.Louveau A et al. Structural and functional features of central nervous system lymphatic vessels. Nature 523, 337–341 (2015). [DOI] [PMC free article] [PubMed] [Google Scholar]
- 4.Sallusto F, Lenig D, Förster R, Lipp M & Lanzavecchia A Two subsets of memory T lymphocytes with distinct homing potentials and effector functions. Nature 401, 708–712 (1999). [DOI] [PubMed] [Google Scholar]
- 5.Han A, Glanville J, Hansmann L & Davis MM Linking T-cell receptor sequence to functional phenotype at the single-cell level. Nat. Biotechnol 32, 684–692 (2014). [DOI] [PMC free article] [PubMed] [Google Scholar]
- 6.Schindowski K et al. Increased T-cell reactivity and elevated levels of CD8+ memory T-cells in Alzheimer’s disease-patients and T-cell hyporeactivity in an Alzheimer’s disease-mouse model: implications for immunotherapy. Neuromolecular Med. 9, 340–354 (2007). [DOI] [PubMed] [Google Scholar]
- 7.Tan J et al. CD45 isoform alteration in CD4+ T cells as a potential diagnostic marker of Alzheimer’s disease. J. Neuroimmunol 132, 164–172 (2002). [DOI] [PubMed] [Google Scholar]
- 8.Togo T et al. Occurrence of T cells in the brain of Alzheimer’s disease and other neurological diseases. J. Neuroimmunol 124, 83–92 (2002). [DOI] [PubMed] [Google Scholar]
- 9.Lombardi VR, Garcia M, Rey L & Cacabelos R Characterization of cytokine production, screening of lymphocyte subset patterns and in vitro apoptosis in healthy and Alzheimer’s Disease (AD) individuals. J. Neuroimmunol 97, 163–171 (1999). [DOI] [PubMed] [Google Scholar]
- 10.Bongioanni P, Boccardi B, Borgna M, Castagna M & Mondino C T-cell interferon gamma binding in patients with dementia of the Alzheimer type. Arch. Neurol 54, 457–462 (1997). [DOI] [PubMed] [Google Scholar]
- 11.Monsonego A et al. Increased T cell reactivity to amyloid β protein in older humans and patients with Alzheimer disease. J. Clin. Invest 112, 415–422 (2003). [DOI] [PMC free article] [PubMed] [Google Scholar]
- 12.Monsonego A, Imitola J, Zota V, Oida T & Weiner HL Microglia-mediated nitric oxide cytotoxicity of T cells following amyloid β-peptide presentation to Th1 cells. J. Immunol 171, 2216–2224 (2003). [DOI] [PubMed] [Google Scholar]
- 13.Sallusto F, Geginat J & Lanzavecchia A Central memory and effector memory T cell subsets: function, generation, and maintenance. Annu. Rev. Immunol 22, 745–763 (2004). [DOI] [PubMed] [Google Scholar]
- 14.Bruggner RV, Bodenmiller B, Dill DL, Tibshirani RJ & Nolan GP Automated identification of stratifying signatures in cellular subpopulations. Proc. Natl Acad. Sci. USA 111, E2770–E2777 (2014). [DOI] [PMC free article] [PubMed] [Google Scholar]
- 15.Kivisakk P et al. Human cerebrospinal fluid central memory CD4+ T cells: evidence for trafficking through choroid plexus and meninges via P-selectin. Proc. Natl Acad. Sci. USA 100, 8389–8394 (2003). [DOI] [PMC free article] [PubMed] [Google Scholar]
- 16.Giunti D et al. Phenotypic and functional analysis of T cells homing into the CSF of subjects with inflammatory diseases of the CNS. J. Leukoc. Biol 73, 584–590 (2003). [DOI] [PubMed] [Google Scholar]
- 17.Sulzer D et al. T cells from patients with Parkinson’s disease recognize a-synuclein peptides. Nature 546, 656–661 (2017). [DOI] [PMC free article] [PubMed] [Google Scholar]
- 18.Smith LK et al. P2-microglobulin is a systemic pro-aging factor that impairs cognitive function and neurogenesis. Nat. Med 21, 932–937 (2015). [DOI] [PMC free article] [PubMed] [Google Scholar]
- 19.Argaet VP et al. Dominant selection of an invariant T cell antigen receptor in response to persistent infection by Epstein-Barr virus. J. Exp. Med 180, 2335–2340 (1994). [DOI] [PMC free article] [PubMed] [Google Scholar]
- 20.Glanville J et al. Identifying specificity groups in the T cell receptor repertoire. Nature 547, 94–98 (2017). [DOI] [PMC free article] [PubMed] [Google Scholar]
- 21.Nasreddine ZS et al. The Montreal Cognitive Assessment, MoCA: a brief screening tool for mild cognitive impairment. J. Am. Geriatr. Soc 53, 695–699 (2005). [DOI] [PubMed] [Google Scholar]
- 22.Leipold MD, Newell EW & Maecker HT Multiparameter phenotyping of human PBMCs using mass cytometry. Methods Mol. Biol 1343, 81–95 (2015). [DOI] [PMC free article] [PubMed] [Google Scholar]
- 23.Jankowsky JL et at. Co-expression of multiple transgenes in mouse CNS: a comparison of strategies. Biomol. Eng 17, 157–165 (2001). [DOI] [PubMed] [Google Scholar]
- 24.Jankowsky JL et al. Mutant presenilins specifically elevate the levels of the 42 residue β-amyloid peptide in vivo: evidence for augmentation of a 42-specific y secretase. Hum. Mol. Genet 13, 159–170 (2004). [DOI] [PubMed] [Google Scholar]
- 25.Marschallinger J et al. The L-type calcium channel Cav1.3 is required for proper hippocampal neurogenesis and cognitive functions. Cell Calcium 58, 606–616 (2015). [DOI] [PubMed] [Google Scholar]
- 26.Unger MS et al. Doublecortin expression in CD8+ T-cells and microglia at sites of amyloid-β plaques: a potential role in shaping plaque pathology? Alzheimers Dement. 14, 1022–1037 (2018). [DOI] [PubMed] [Google Scholar]
- 27.Gil-Perotin S, Alvarez-Buylla A & Garcia-Verdugo JM Identification and Characterization of Neural Progenitor Cells in the Adult Mammalian Brain. Advances in Anatomy, Embryology and Cell Biology Vol. 203 (Springer, 2009). [PubMed] [Google Scholar]
- 28.Sirerol-Piquer MS et al. GFP immunogold staining, from light to electron microscopy, in mammalian cells. Micron 43, 589–599 (2012). [DOI] [PubMed] [Google Scholar]
- 29.Han A et al. Dietary gluten triggers concomitant activation of CD4+ and CD8+ αβ T cells and yδ T cells in celiac disease. Proc. Natl Acad. Sci. USA 110, 13073–13078 (2013). [DOI] [PMC free article] [PubMed] [Google Scholar]
- 30.Butler A, Hoffman P, Smibert P, Papalexi E & Satija R Integrating single-cell transcriptomic data across different conditions, technologies, and species. Nat. Biotechnol 36, 411–420 (2018). [DOI] [PMC free article] [PubMed] [Google Scholar]
- 31.Stuart T et al. Comprehensive integration of single-cell data. Cell 177, 1888–1902 (2019). [DOI] [PMC free article] [PubMed] [Google Scholar]
Associated Data
This section collects any data citations, data availability statements, or supplementary materials included in this article.


