Abstract
PURPOSE
Pediatric adrenocortical carcinomas (ACCs) are aggressive; the overall survival of patients with ACCs is 40%-50%. Appropriate staging and histologic classification are crucial because children with incomplete resections, metastases, or relapsed disease have a dismal prognosis. The clinical course of pediatric adrenocortical tumors (ACTs) is difficult to predict using the current classification schemas, which rely on subjective microscopic and gross macroscopic variables. Recent advances in adult ACT studies have revealed distinct DNA methylation patterns with prognostic significance that have not been systematically interrogated in the pediatric population.
PATIENTS AND METHODS
We performed DNA methylation analyses on 48 newly diagnosed ACTs from the International Pediatric Adrenocortical Tumor Registry and 12 pediatric adrenal controls to evaluate for distinct methylation groups. Pediatric methylation data were also compared systematically with the adult ACC cohort from The Cancer Genome Atlas (TCGA).
RESULTS
Two pediatric ACT methylation groups were identified and showed differences in selected clinicopathologic and outcome characteristics. The A1 group was enriched for CTNNB1 variants and unfavorable outcome. The A2 group was enriched for TP53 germline variants, younger age at onset, and favorable outcome. Pediatric ACT methylation groups were maintained when International Pediatric Adrenocortical Tumor Registry cohort data were combined with TCGA cohort data. The CpG-island hypermethylator phenotype characterizing the TCGA cohort was not identified in the pediatric patients. When methylome findings were combined with independent histopathologic review using the Wieneke criteria, a high-risk population was identified with uniform fatal outcome.
CONCLUSION
Our results indicate DNA methylation analysis can enhance current diagnostic algorithms. A combination of methylation and histologic classification produced the strongest prediction model and may prove useful in future risk-adapted therapeutic trials.
INTRODUCTION
Adrenocortical tumors (ACTs) are rare in children (0.2-0.3individuals younger than 14 years of age per million per year) and are distinct from tumors arising in the adult setting. Clinically silent adrenocortical adenomas (ACAs) comprise the majority of adult tumors,1 whereas in the pediatric population, adrenocortical carcinomas (ACCs) predominate.1-3 Pediatric ACCs are aggressive, and the probability of long-term overall survival of patients with ACCs is only 40%-50%.4 Appropriate staging and histologic classification are crucial because children with incomplete resections, metastases, or relapsed disease have a dismal prognosis.2 Risk stratification in pediatric ACTs is based on the Wieneke classification system,5 which assesses nine macroscopic and microscopic variables to predict behavior.
ACTs have one of the most complex genomic landscapes in pediatric cancer.6 More than 50% of pediatric ACTs are driven by constitutional abnormalities,6-8 with the most common being TP53 mutations (Li-Fraumeni syndrome) and structural or epigenetic alterations affecting chromosome 11p15 (Beckwith-Wiedemann syndrome).7 In addition, common mechanisms implicated in pediatric and adult tumorigenesis include IGF-2 overexpression, damaging alterations in genes involved in Rb signaling (CDKN2A, RB1), Wnt/β-catenin pathway dysregulation (APC, CTNNB1), and errors in telomere maintenance (TERT amplification, ATRX mutations).9,10 Although discrete genomic changes are not independently associated with prognosis, patients with complex genomic alterations tend to portend an unfavorable outcome.11 These observations suggest that the malignant potential of ACTs depends on the interplay of multiple genetic lesions that accumulate during tumorigenesis.7
CONTEXT
Key Objective
Risk stratification in pediatric adrenocortical tumors (ACTs) is challenging, because individual gene mutations and histomorphology do not reliably predict clinical risk. This study examined whether molecular subtypes of ACT could be detected using DNA methylation profiling and whether common ACT mutations differentially segregate into molecular groups. Furthermore, we evaluated the prognostic significance of molecular groups alone and in combination with histomorphologic risk models.
Knowledge Generated
Two methylation groups were detected, distinct from adult ACT and enriched for specific mutations. Survival analysis demonstrated significant differences, with nearly all deaths coming from a single methylation group. A combination of histopathologic classification and DNA methylation group provided the strongest predictor of overall survival.
Relevance
DNA methylation profiling can augment existing classification paradigms in pediatric ACTs. Methylation group may serve to highlight a high-risk treatment population in future risk-adaptive clinical trial designs.
Recent advances in adult adrenocortical neoplasia studies have revealed distinct methylation patterns in non-neoplastic, benign, and malignant ACT samples.12 Aggressive behavior has been associated with both global hypomethylation13 and CpG-island methylator phenotype (CIMP).9 This was expanded on by Zheng et al14 in a comprehensive analysis of adult ACCs as part of The Cancer Genome Atlas (TCGA), where levels of CpG-island methylation (designated CIMP-low, -intermediate, or -high) were associated with an increasingly poor outcome. Studies on methylation patterns in the pediatric population are lacking.
We performed DNA methylation analyses on 48 newly diagnosed ACTs from the International Pediatric Adrenocortical Tumor Registry (IPACTR) to evaluate for distinct groups with prognostic significance. Findings were correlated with molecular and clinical variables, including long-term clinical follow-up. Methylation data were further compared with data derived from the adult TCGA cohort,14 which to our knowledge, is the first such analysis between these two patient populations.
PATIENTS AND METHODS
Patients and Data Collection
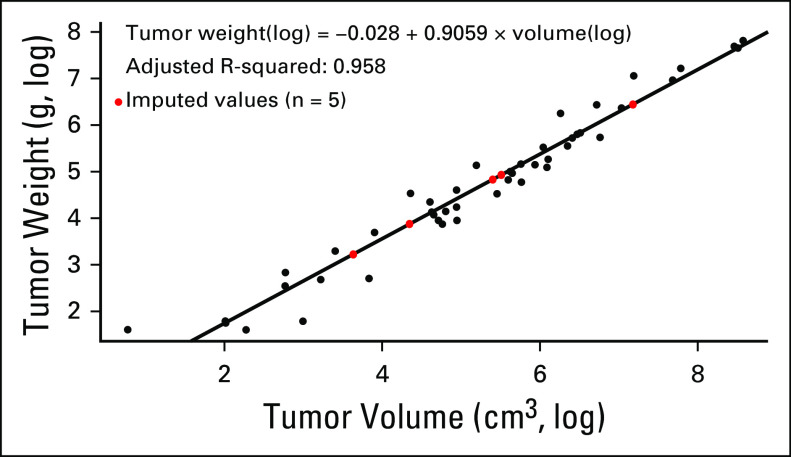
Patients were selected from the IPACTR cohort on the basis of sample availability for histopathologic review and methylome analysis (for additional details, see the Appendix). Methods of registry accrual and the sampling process have been described previously.4 Histopathologic and clinical data were tabulated from existing databases. The outside diagnosis was recorded as “initial clinical diagnosis” for the purposes of this study. These diagnoses were rendered over the course of 10 years and were not based on a unified methodology. Pathology central review was performed blinded to analysis data and included evaluation of Wieneke criteria5 in all patients, with a subsequently assigned Wieneke tumor classification (scores: 0-2, ACA; 3, ACT with uncertain malignant potential [ACT-UMP]; 4-9, ACC). In addition, tumor volume was recorded. If tumor weight was not available, it was estimated using the tumor measurements obtained from pathology reports (n = 5) and the following regression formula estimated using data from the remaining samples in this study (Appendix Fig A1): weight(log) = –0.028 + 0.9059 × volume(log). Tumors were classified as functional (virilization, feminization, Cushing syndrome, aldosterone producing) or clinically nonfunctional. Classification of the extent of disease was based on published criteria used by the IPACTR (Appendix Table A1). Clinical data also provided the overall treatment strategy, which was categorized as either surgery alone or surgery with adjuvant chemotherapy. A summary of all clinical data can be seen in the Data Supplement. Normal adrenal samples were obtained from non-neoplastic surgical specimens and autopsy tissues.
Immunohistochemical and Molecular Analysis
Immunohistochemical staining was performed for p53 (diluted 1:200; #Z2029M; Zeta Corp, Sierra Madre, CA), β-catenin (undiluted; #760-4242; Ventana, Tucson, AZ), and ATRX (1:200; #HPA001906; Sigma, St Louis, MO) and scored as either wild-type pattern (ie, scattered nuclear positivity for p53, membranous or cytoplasmic staining for β-catenin, and intact nuclear staining for ATRX) or mutant pattern (ie, absent or diffuse nuclear positivity for p53, nuclear positivity for β-catenin, and loss of nuclear stain for ATRX). Ki-67 staining (1:200; #m7240; Dako, Santa Clara, CA) was scored manually as the raw percentage of Ki-67–positive tumor cells and as an estimate rounded to the nearest 10th percentile. Mutational status of TP53, CTNNB1, and ATRX was determined using a combination of whole-genome sequencing (WGS), whole-exome sequencing (WES), Sanger sequencing, and multiplex ligation–dependent probe amplification (MLPA). In some instances, multimodality testing was performed, and overall mutational testing included the following genes: TP53 (Sanger, n = 48; WES, n = 9; WGS, n = 1), CTNNB1 (Sanger, n = 48; WES, n = 9; WGS, n = 1), and ATRX (MLPA, n = 28; WES, n = 1; WGS, n = 1).
Methylation Profiling and Copy Number Analysis
Methylome analysis was performed using the human Infinium MethylationEPIC BeadChip array (Illumina, San Diego, CA) on 250-500 ng of DNA extracted from formalin-fixed paraffin-embedded (FFPE) tissues. Samples were handled in accordance with the Illumina Infinium HD Methylation Assay Protocol, as published.15 A detailed description of data processing and methylation analysis is presented in the Appendix. DNA copy number variation (CNV) was inferred from the methylation data by using the conumee Bioconductor package in R.16 Copy number calls were confirmed with fluorescence in situ hybridization (FISH) testing, when FFPE materials were available (n = 9; Appendix).
TCGA Comparison Studies
Raw IDAT files from the TCGA ACC cohort were downloaded from the Broad Institute GDAC FireBrowse portal (http://firebrowse.org/?cohort=ACC). The cohort contained 79 ACCs with DNA methylation data generated using the Illumina Infinium HumanMethylation450 BeadChip platform. Data from the IPACTR and TCGA DNA methylation samples were combined using the “combine arrays” function in the minfi package and output as a 450K virtual array containing a subset of probes common to both the 450K and 850K platforms (575,130 probes, representing 452,567 methylation loci). The group-wise methylation states of CpG-island sites were analyzed by mapping the top 20,000 most variably methylated probes from the combined TCGA and IPACTR datasets.
Gene Set Enrichment Analysis
Gene set enrichment analysis (GSEA) was performed using the top 20,000 most variably methylated probes between the two pediatric ACT groups. Differential methylation patterns were mapped to specific gene loci, which were then secondarily cross-referenced to published gene sets by using established protocols.17,18 For a detailed description, see the Appendix.
Clinicopathologic Correlation
Summary statistics were calculated for values by the methylation group. The differences in methylation distribution between the groups were examined using the Wilcoxon rank-sum test. Survival analysis was performed to investigate the association of overall survival with histologic diagnosis, Wieneke classification, and ACT methylation group using the log-rank test and Cox regression models (Appendix). All P values reported were 2-tailed and considered significant if P ≤ .05.
RESULTS
Demographics
The demographic and clinical characteristics of the 48 pediatric ACT samples are presented in Table 1. Patient ages ranged from 3 months to 17 years and adopted a bimodal distribution centered around 5 and 13 years of age (Appendix Fig A2). The cohort contained a sex difference ratio of 2.7:1 female-to-male patients, with a trend for female enrichment at younger age. The entire histologic spectrum of pediatric ACTs was present as classified by the Wieneke criteria: ACA (n = 23), ACT-UMP (n = 5), and ACC (n = 19), with 18 (38%) stage I tumors, 10 (21%) stage II tumors, 15 (31%) stage III tumors, and five (10%) stage IV tumors.
TABLE 1.
IPACTR Cohort Characteristics

Methylation and Chromosomal Copy Number Analysis
We performed methylation profiling on 48 ACTs and 12 normal control pediatric adrenal samples. By both unsupervised t-distributed stochastic neighbor embedding (t-SNE) analysis (Fig 1A) and hierarchical clustering (Fig 1B), we identified three distinct clusters of samples. Normal adrenal samples cluster together. The remaining samples segregated into two groups designated A1 (n = 15) and A2 (n = 33). These two tumor groups were 94.26% reproducible in a thorough bootstrap evaluation19,20 (Appendix).
FIG 1.
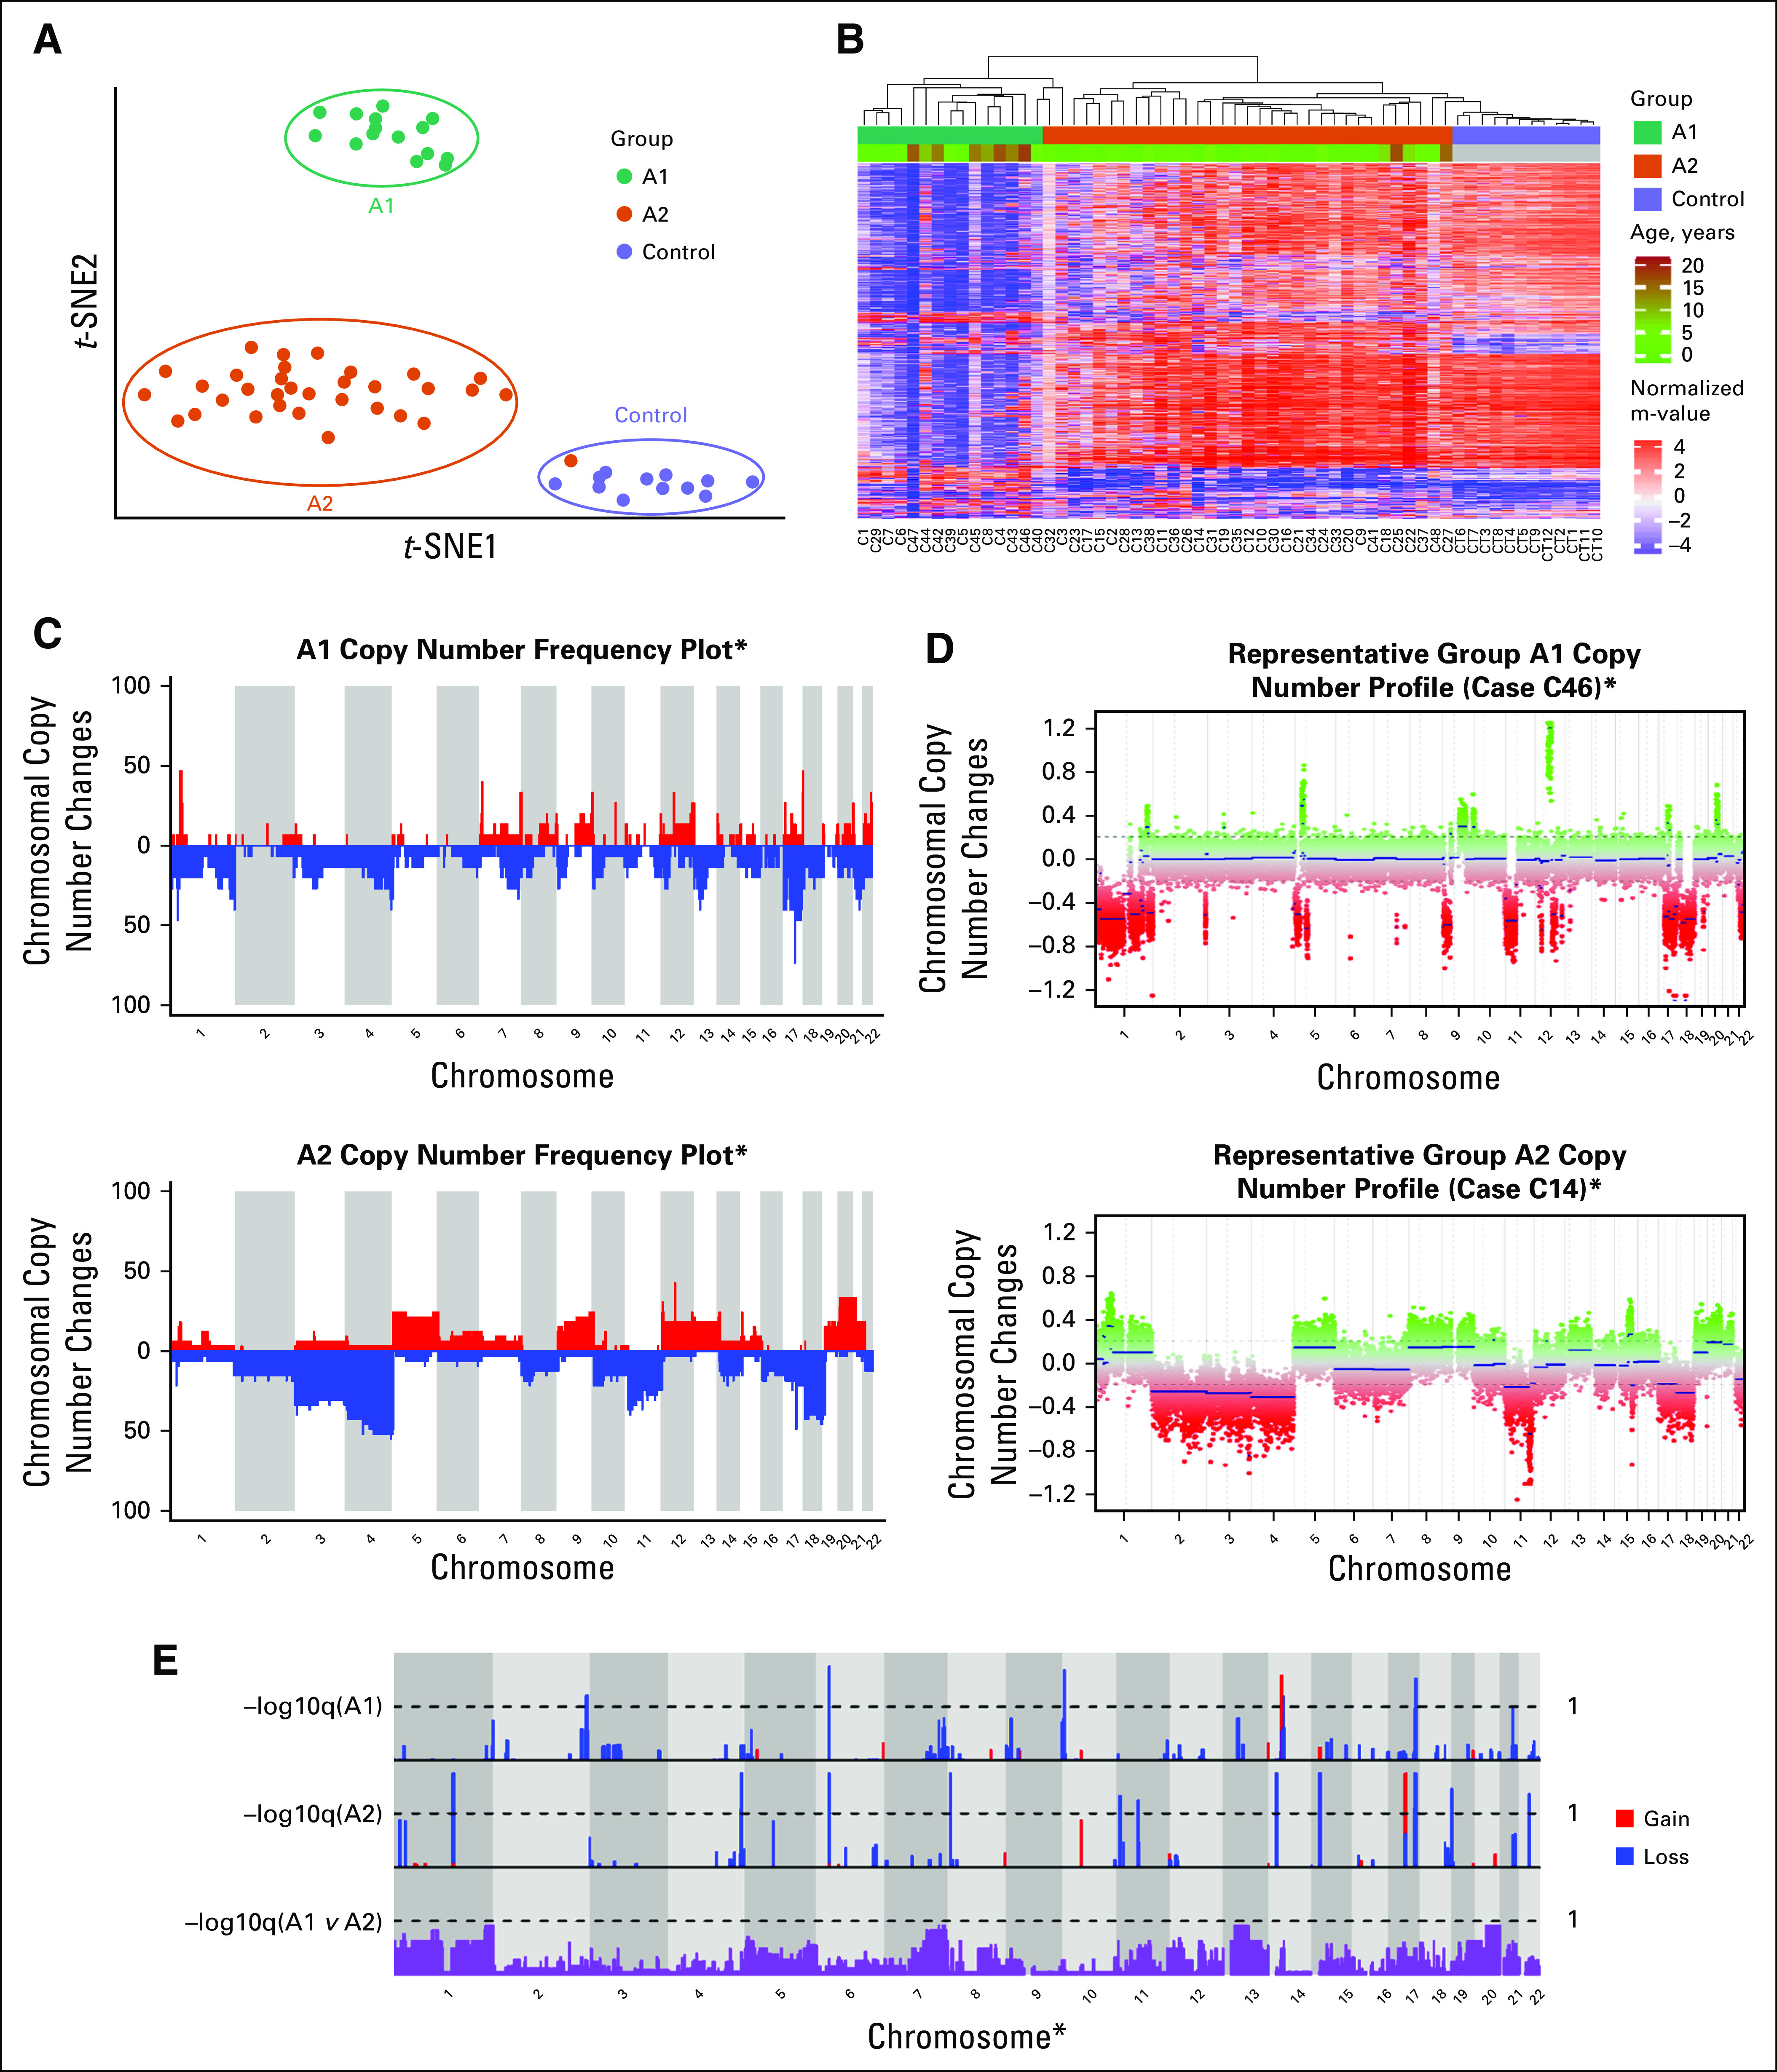
Unsupervised analysis and copy number profiling of DNA methylation data from pediatric adrenocortical tumors. (A) Unsupervised analysis of DNA methylation data visualized by t-distributed stochastic neighbor embedding (t-SNE) plot identified 2 methylation groups, A1 and A2. (B) Heat map showing the methylation profiles in each group (A1 and A2) identified by hierarchical clustering along with age distribution. (C) Copy number variation (CNV) frequency plots by DNA methylation group. (D) Examples of CNV profiles of individual patients from each methylation group. (E) Significant CNVs within and between methylation groups. (*) Excluding sex chromosomes.
We observed several recurrent segmental chromosomal CNVs in both groups, including −4q and +9q as previously reported (Figs 1C and 1D).7 We also identified distinct differences among groups (Fig 1E), with fewer recurrent chromosomal-level gains in the A1 group (Appendix Fig A3). When tissue was available (n = 9), orthogonal FISH testing confirmed copy number findings (Appendix Fig A3).
Mutational Assessment and GSEA
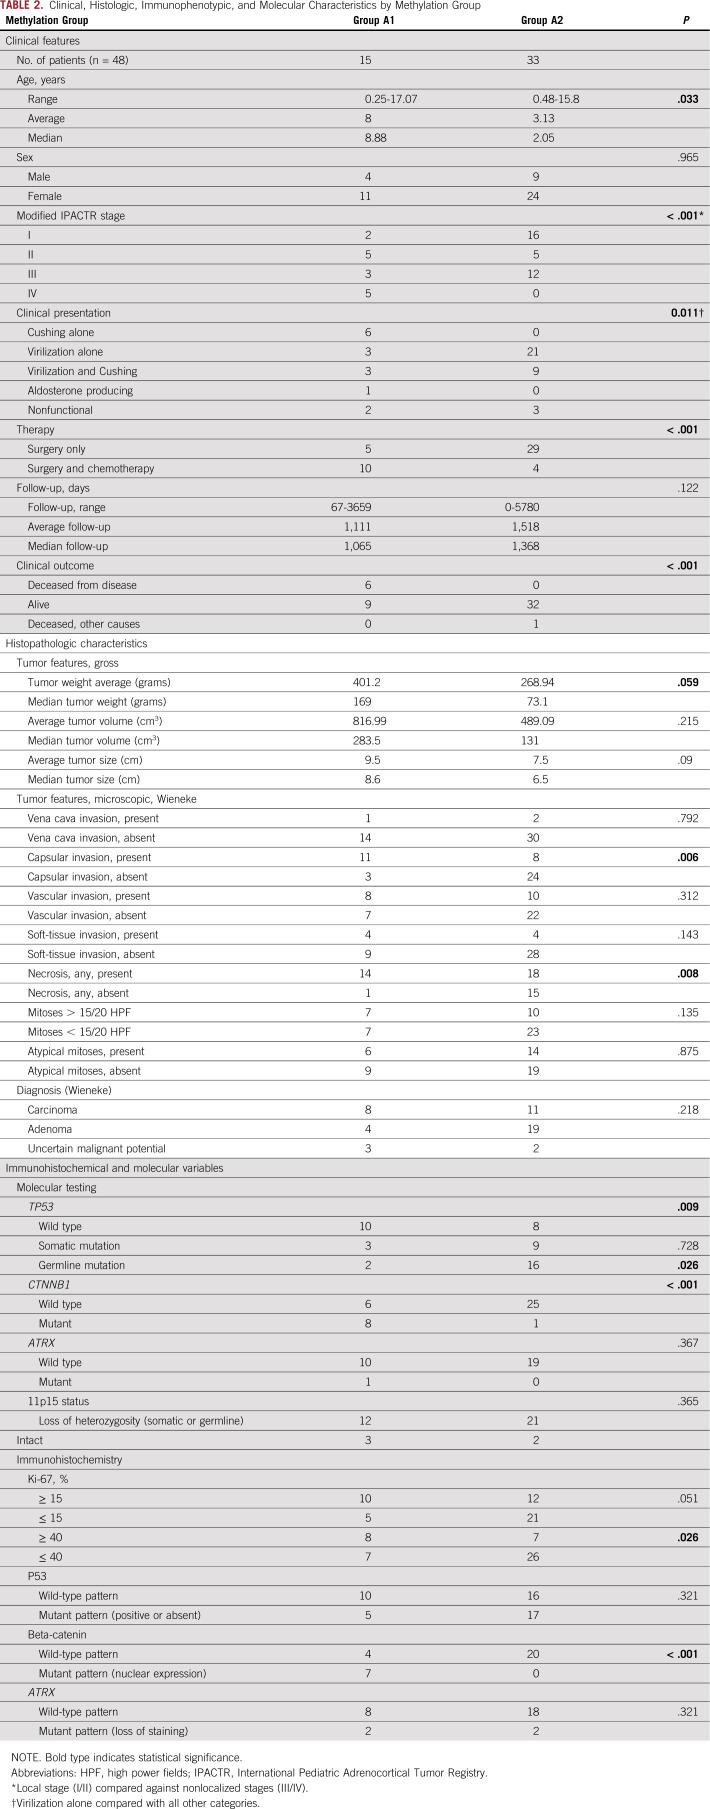
We evaluated the relationship of selected mutations previously reported in pediatric ACT to the methylation groups (Fig 2). The A1 group was enriched for both CTNNB1 mutations (P < .001) and nuclear β-catenin immunostaining (P < .001). Of note, the only tumor from the A2 group with a CTNNB1 variant (case C19, c.112G>A, p.G38S) was also the only tumor in the overall cohort with co-occurrence of CTNNB1 and TP53 variants. Although we found no significant difference between groups, in terms of p53 (as measured by immunohistochemistry), mutations in TP53 were more common in the A2 group (P = .009). The association remained significant when evaluating germline variants only (P = .026), but not when evaluating somatic variants only (P = .728).
FIG 2.
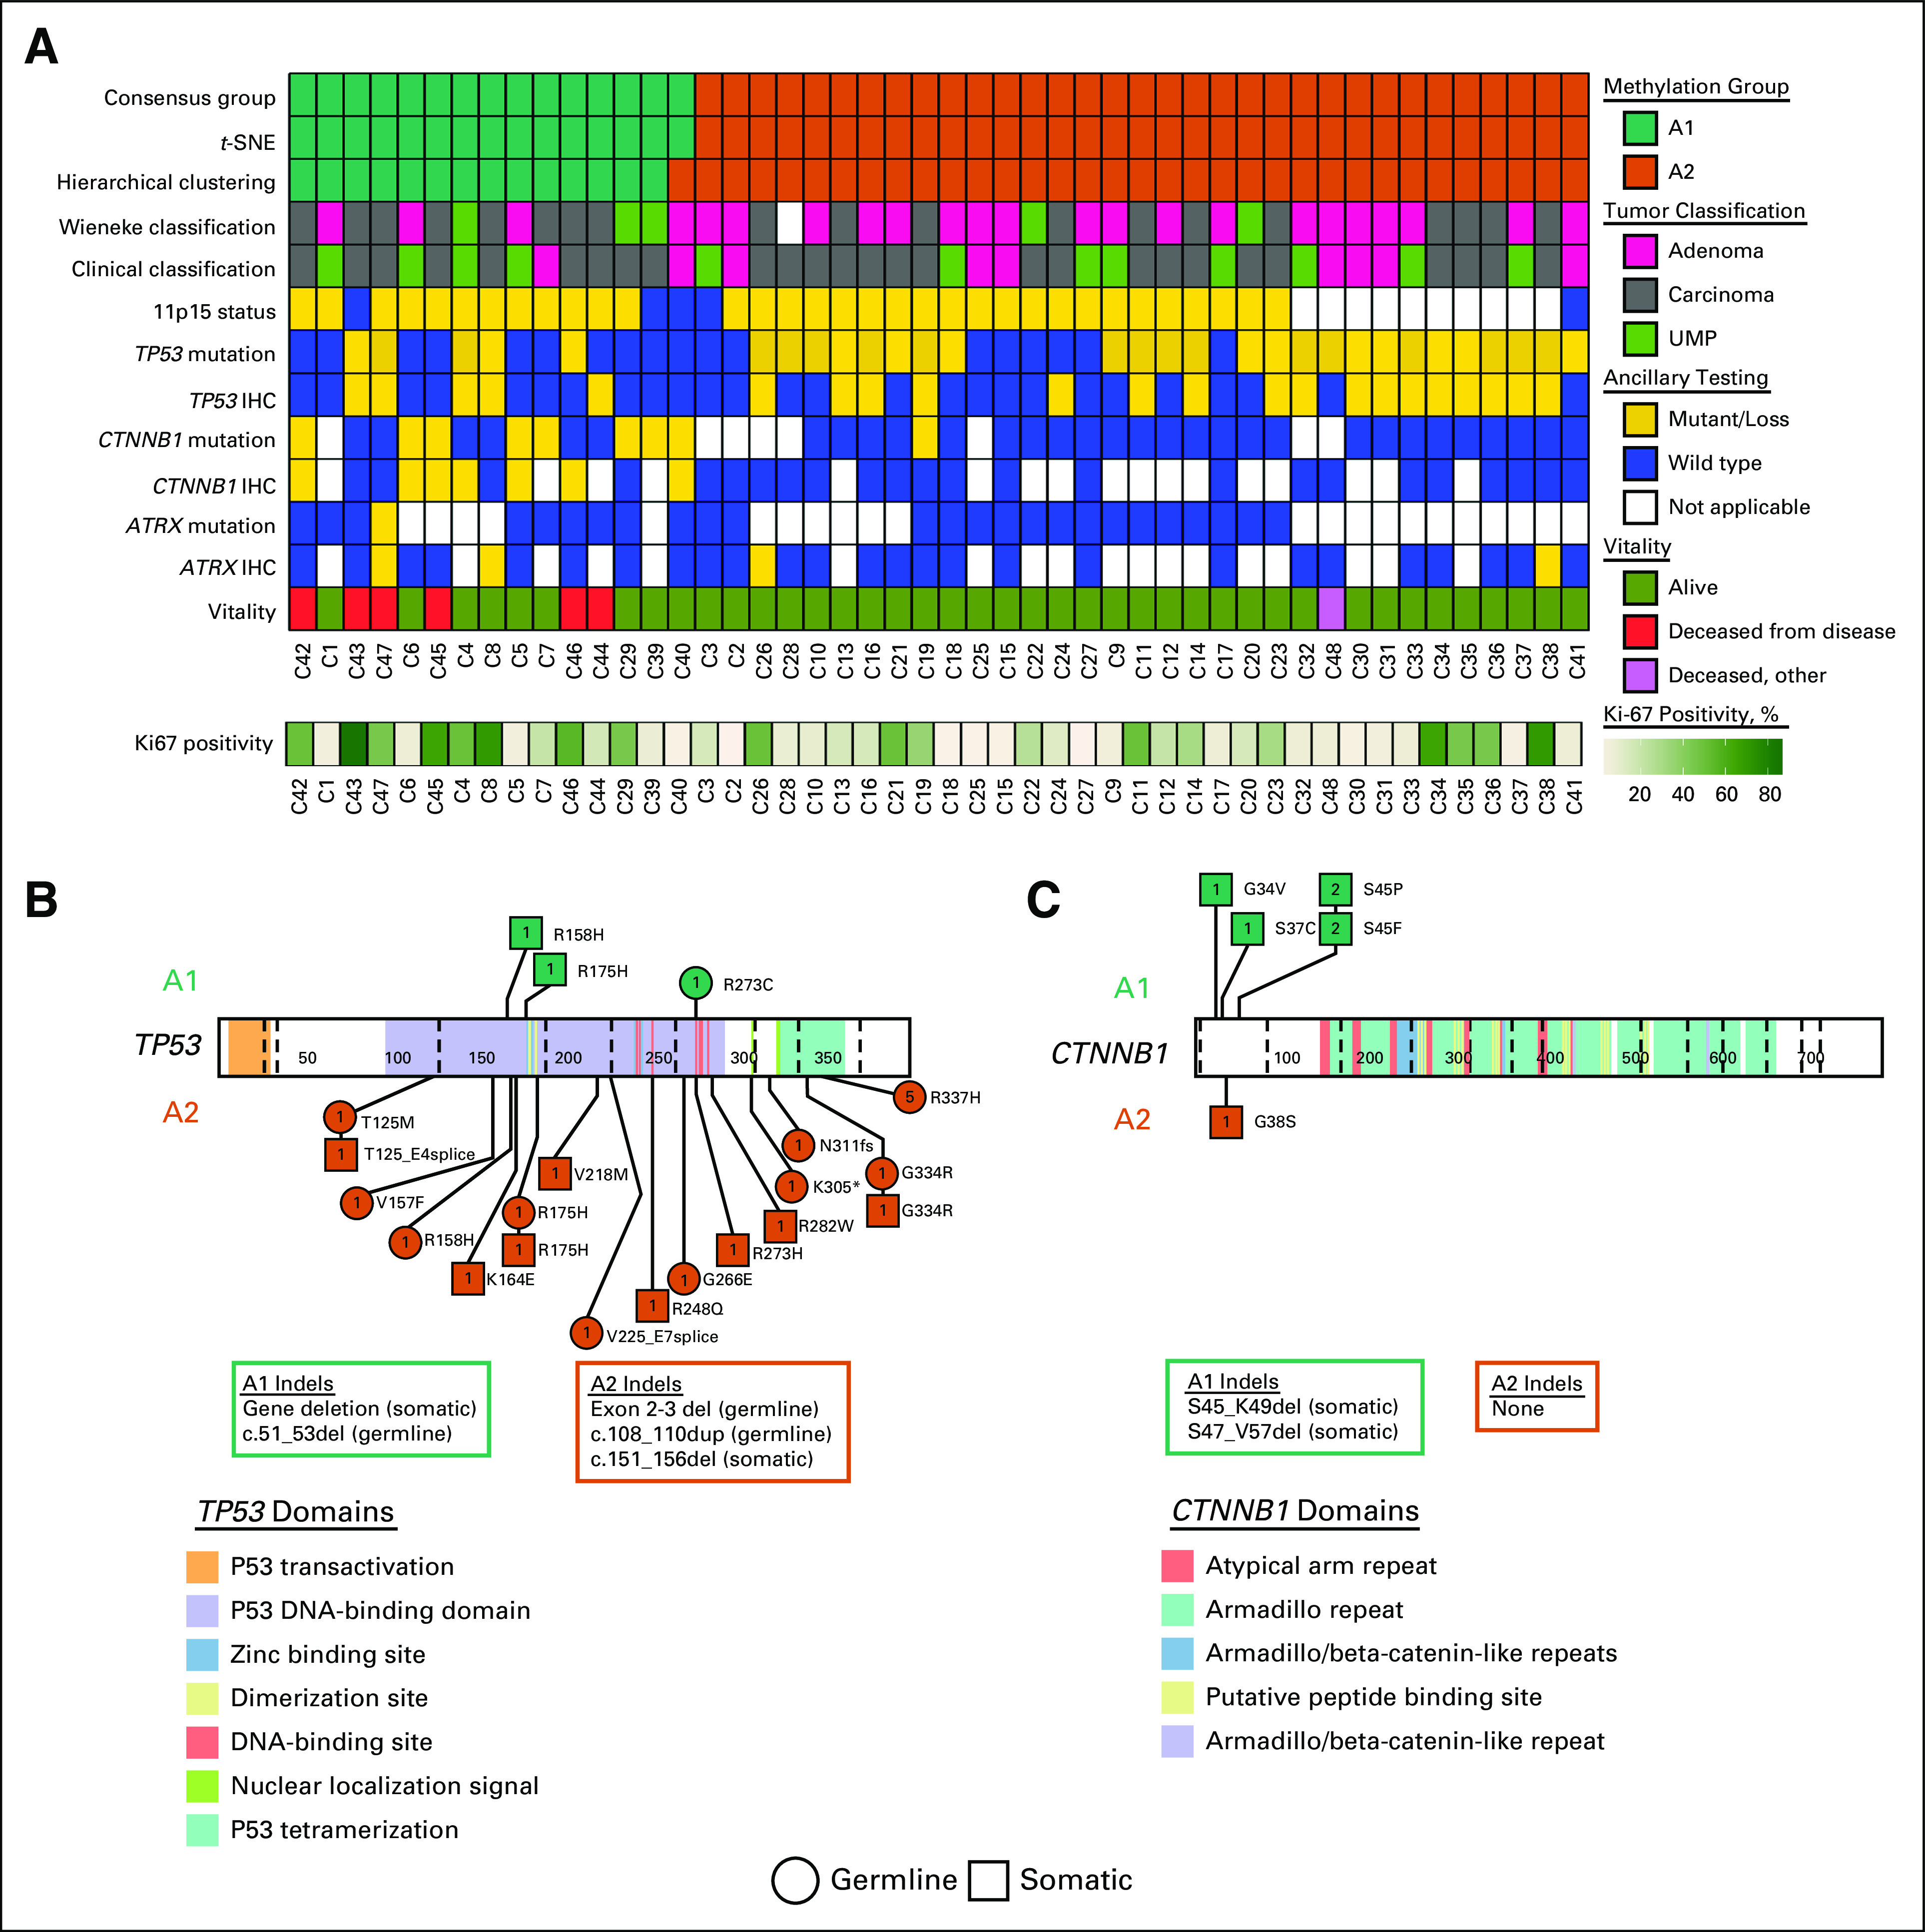
Mutational and immunohistochemical profiles of methylation groups. (A) Oncoprint of diagnostic, immunophenotypic, and mutational profiles by DNA methylation group. (B) TP53-domain plot with methylation group (A1 and A2)–specific distribution of variants. (C) CTNNB1-domain plot with methylation group–specific distribution of variants. IHC, immunohistochemistry; UMP, uncertain malignant potential.
GSEA identified significant variation between the A1 and A2 groups, with the greatest variability seen in gene sets vital to biologic processes (n = 20) and molecular functions (n = 17; q < .05; Appendix Fig A3). Among the enriched gene sets in the biologic process ontology were multiple hits for pathways involved in embryonic development and regulation of metabolic processes. The oncogenic gene sets showed significant variation in methylation patterns in PRC2-, Cyclin D1-, and KRAS-associated pathways. In addition, several ontologies included significant gene sets associated with olfactory signaling.
A signature of 286 genes (Appendix Table A2) with the greatest value of Hartigan’s dip test21 for bimodality assigned the tumors into group A1 or A2 with 96.4% reproducibility. Included were several differentially methylated genes involved in adrenocortical biology, including ADM, CACNA1H, CDKN1B, CLDN1, GNAS, IGF2, and PRKCA.22-30 Fifteen genes with the lowest false discovery rate and a significantly different mean beta-value (|mbv| > 0.4 between groups) have been highlighted and represent targets for additional investigation.
Comparison Between Pediatric and Adult ACTs
Combining the TCGA and IPACTR cohorts yielded 127 patients for evaluation (48 IPACTR; 79 TCGA). All tumors in the TCGA cohort were carcinomas, and median age at diagnosis was 49 years.14 Visualization with t-SNE highlighted the previously appreciated A1, A2, and pediatric control groups. TCGA samples roughly clustered into groups that correlated with the published CIMP-L, CIMP-I, and CIMP-H groups, although these designations are somewhat ambiguous, and several overlapping patients can be seen in the t-SNE plot (Fig 3A). Hierarchical clustering into six groups had an overall bootstrap reproducibility of 74.33%. Copy number analysis highlighted distinct copy number profiles in the CIMP groups (Appendix Fig A4).
FIG 3.
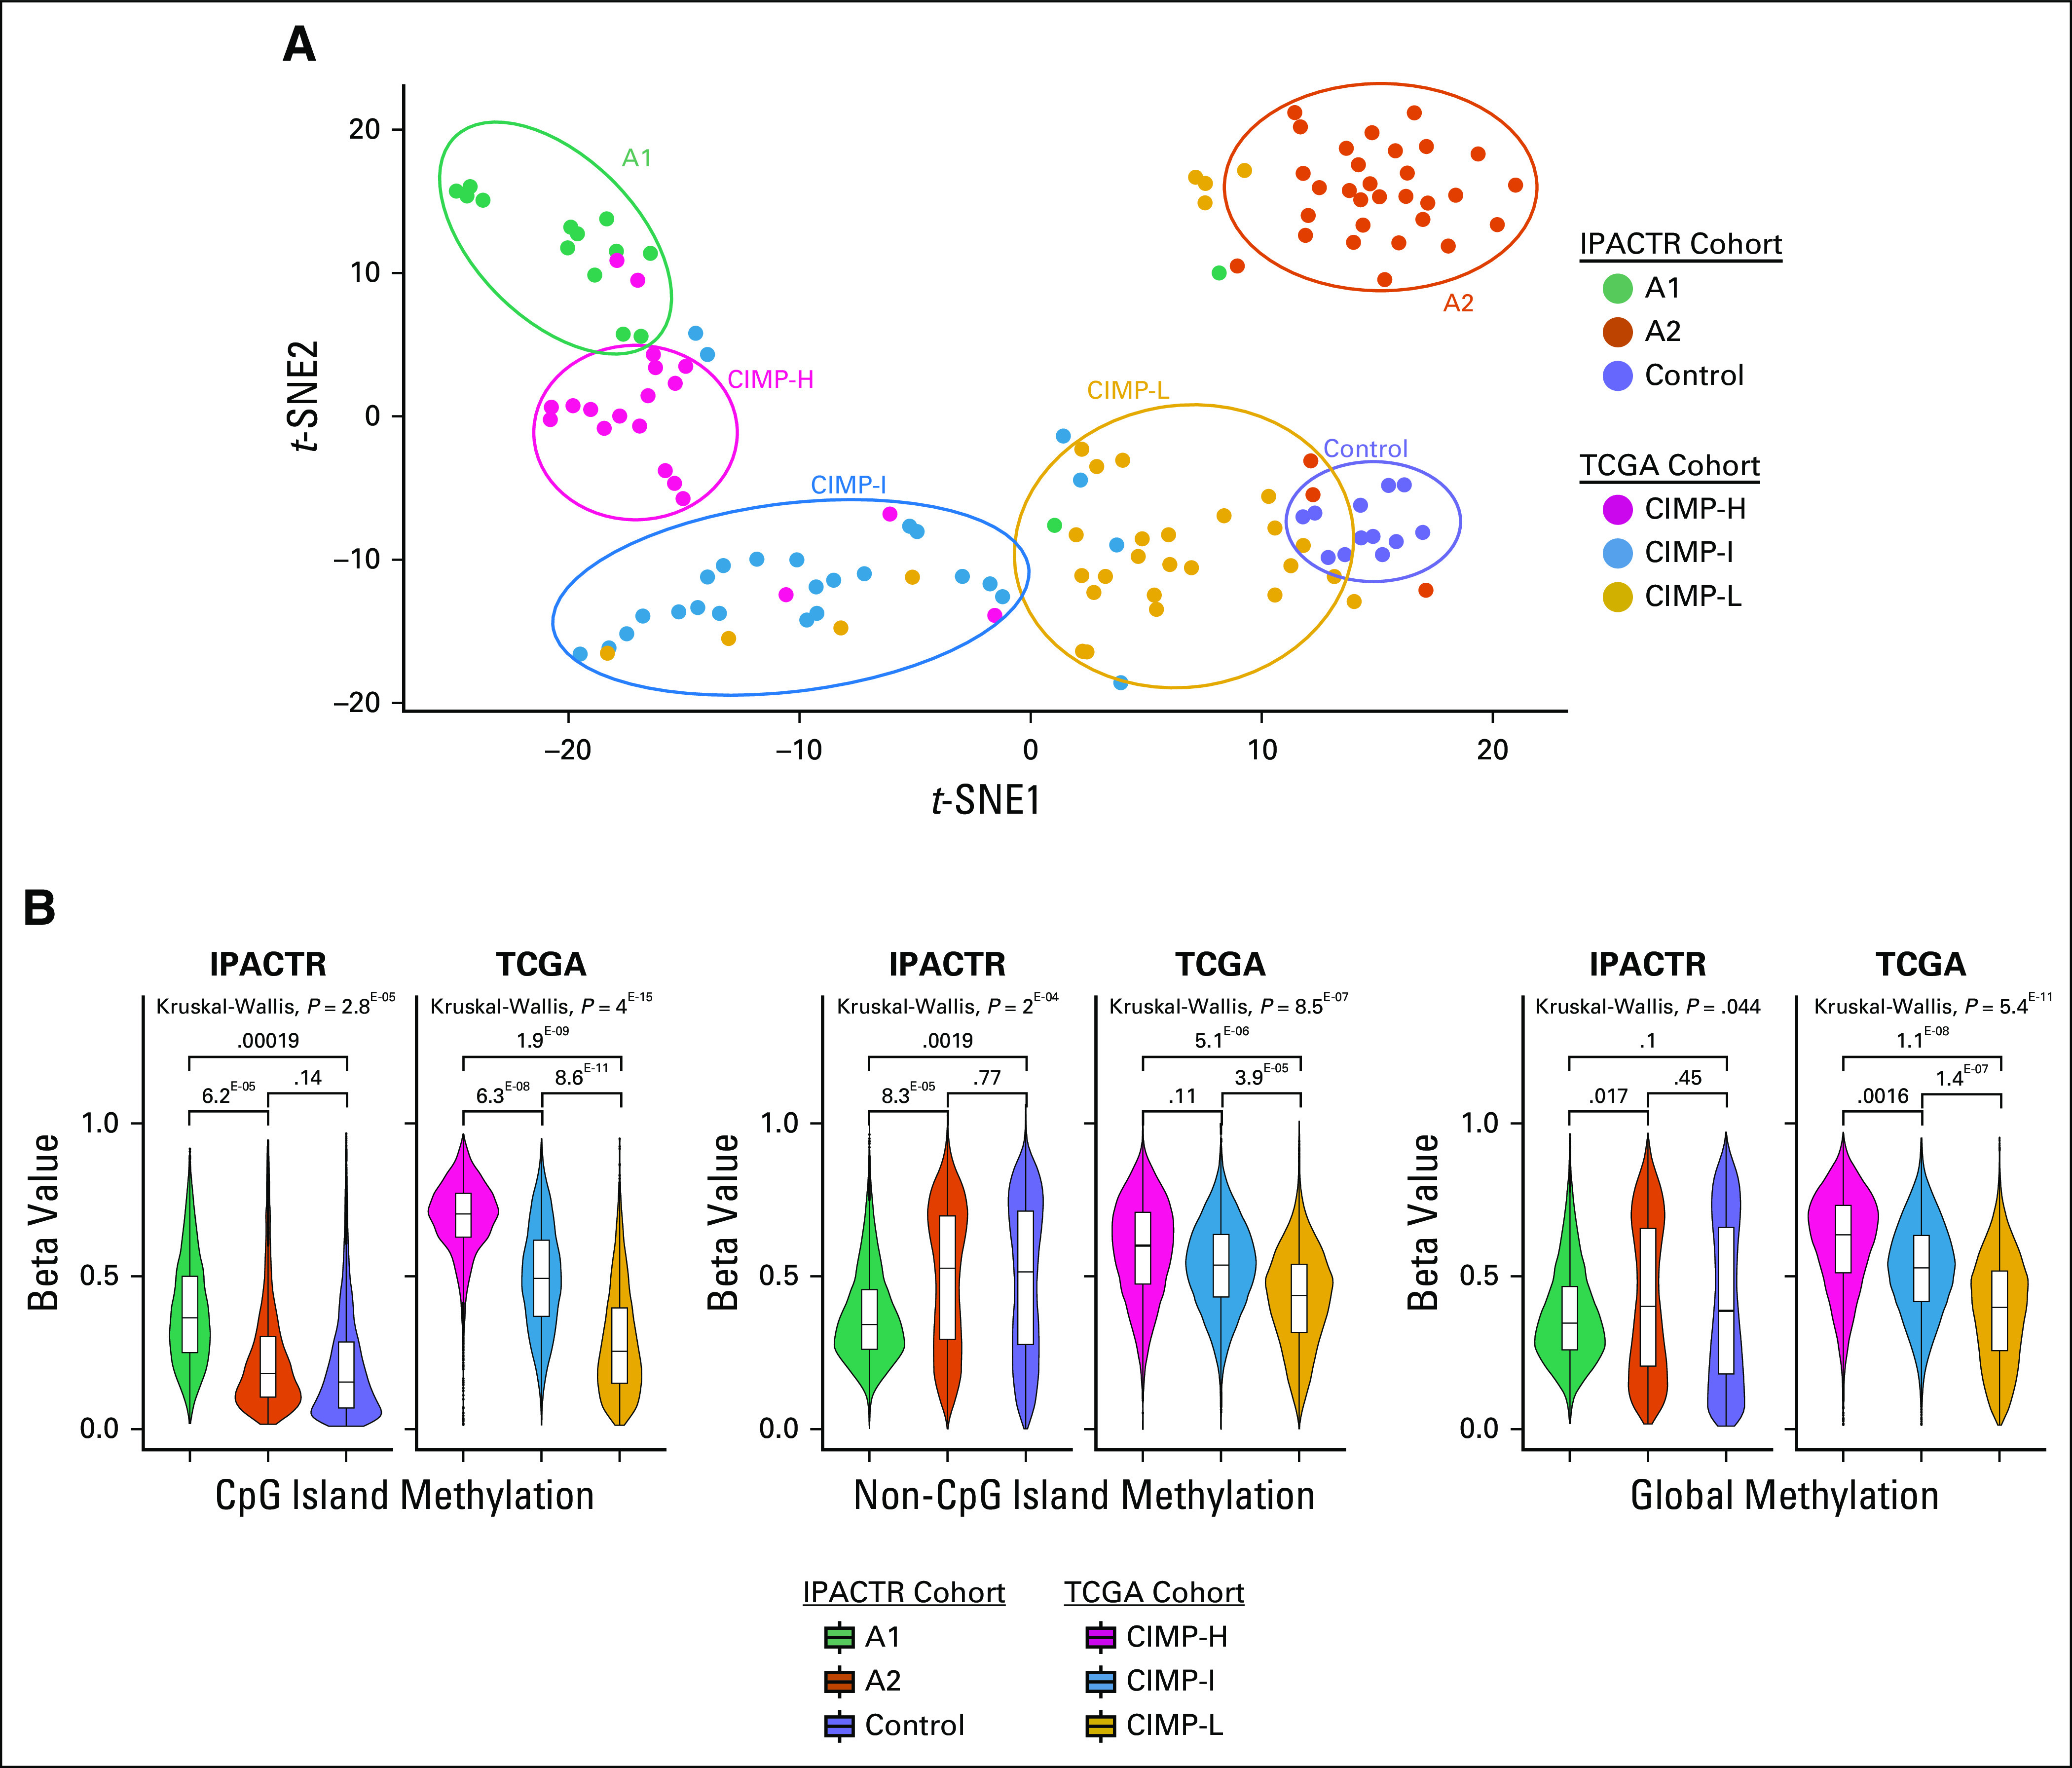
Comparison of DNA methylation data between the International Pediatric Adrenocortical Tumor Registry (IPACTR) and The Cancer Genome Atlas (TCGA) cohorts. (A) Unsupervised analysis of IPACTR and TCGA cohorts combined and visualized by t-distributed stochastic neighbor embedding (t-SNE) plot. (B) Methylation level of IPACTR and TCGA cohorts by methylation of CpG islands, non-CpG islands, and global methylation using 20,000 probes. CpG-island hypermethylator phenotypes (CIMPs) are noted as high (CIMP-H), intermediate (CIMP-I), or low (CIMP-L). P values are based on computed means for each patient.
To further evaluate the relationship between pediatric ACTs and adult ACTs, we evaluated the methylation state at CpG islands across the tumor groups. In the TCGA cohort, we reaffirmed the presence of the CIMP groups with the following mean beta values (listed as %-methylated probes [CIMP-H, 69%; CIMP-I, 50%; CIMP-L, 29%]). This pattern was maintained when we evaluated differentially methylated CpGs from a subset of probes representing non-islands and in a combined global methylation profile. In the IPACTR cohort, the A1 group showed greater CpG-island methylation when compared with the A2 group and the control samples (Fig 3B) but not to the level of the CIMP-H phenotypic patients (A1, 38%; A2, 23%; control, 21%). Unlike the adult tumors, non–CpG-island methylation did not follow the same pattern as CpG islands, and overall, the A1 group was globally hypomethylated.
Clinicopathologic Correlation
The two methylation groups showed differences in selected clinicopathologic characteristics (Table 2). The A2 group occurred primarily in children younger than 4 years of age, whereas the A1 group showed an even age distribution (Fig 1B; Appendix Fig A2B). The A1 group included tumors with a significantly more advanced stage at presentation (stage I/II v III/IV; P = .011), were more likely to be treated with a combination of surgery and adjuvant chemotherapy (P < .001) and were less likely to present with virilization alone (P = .011). No association was seen for sex, gross features (ie, the size and weight of the tumor), or histologic diagnosis.
TABLE 2.
Clinical, Histologic, Immunophenotypic, and Molecular Characteristics by Methylation Group
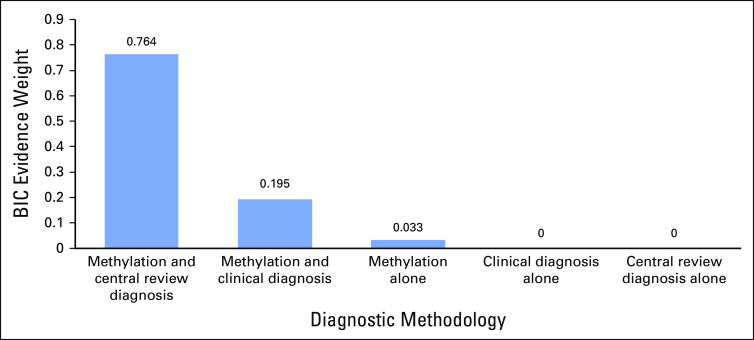
Overall survival from disease did not differ significantly according to the original pathologic diagnosis (P = .12; Fig 4). However, after strictly applying the Wieneke criteria at central pathology review, we found that overall survival differed significantly according to diagnosis (P = .013; Fig 4). Methylation grouping strongly correlated with overall survival (P < .0001), and except for one child in the A2 group who died of a separate primary brain tumor, all deaths directly attributable to ACTs occurred in the A1 group (Fig 4). All deaths also occurred in children older than the age of 8 years (average, 13.1 years). A combination of histopathologic diagnosis and methylation group defined a high-risk population with 100% mortality (Fig 4D). Bayesian information criteria evidence weight (BIC EW) analysis strongly supported this model as the best overall predictor of survival (BIC EW = 0.764) by indicating that there is a 76.4% probability that this model is best among a set of six considered models (Appendix; Fig A4). Overall, BIC indicates there is a 99.2% probability that the best predictive model for survival includes methylation class as one of its predictor variables.
FIG 4.
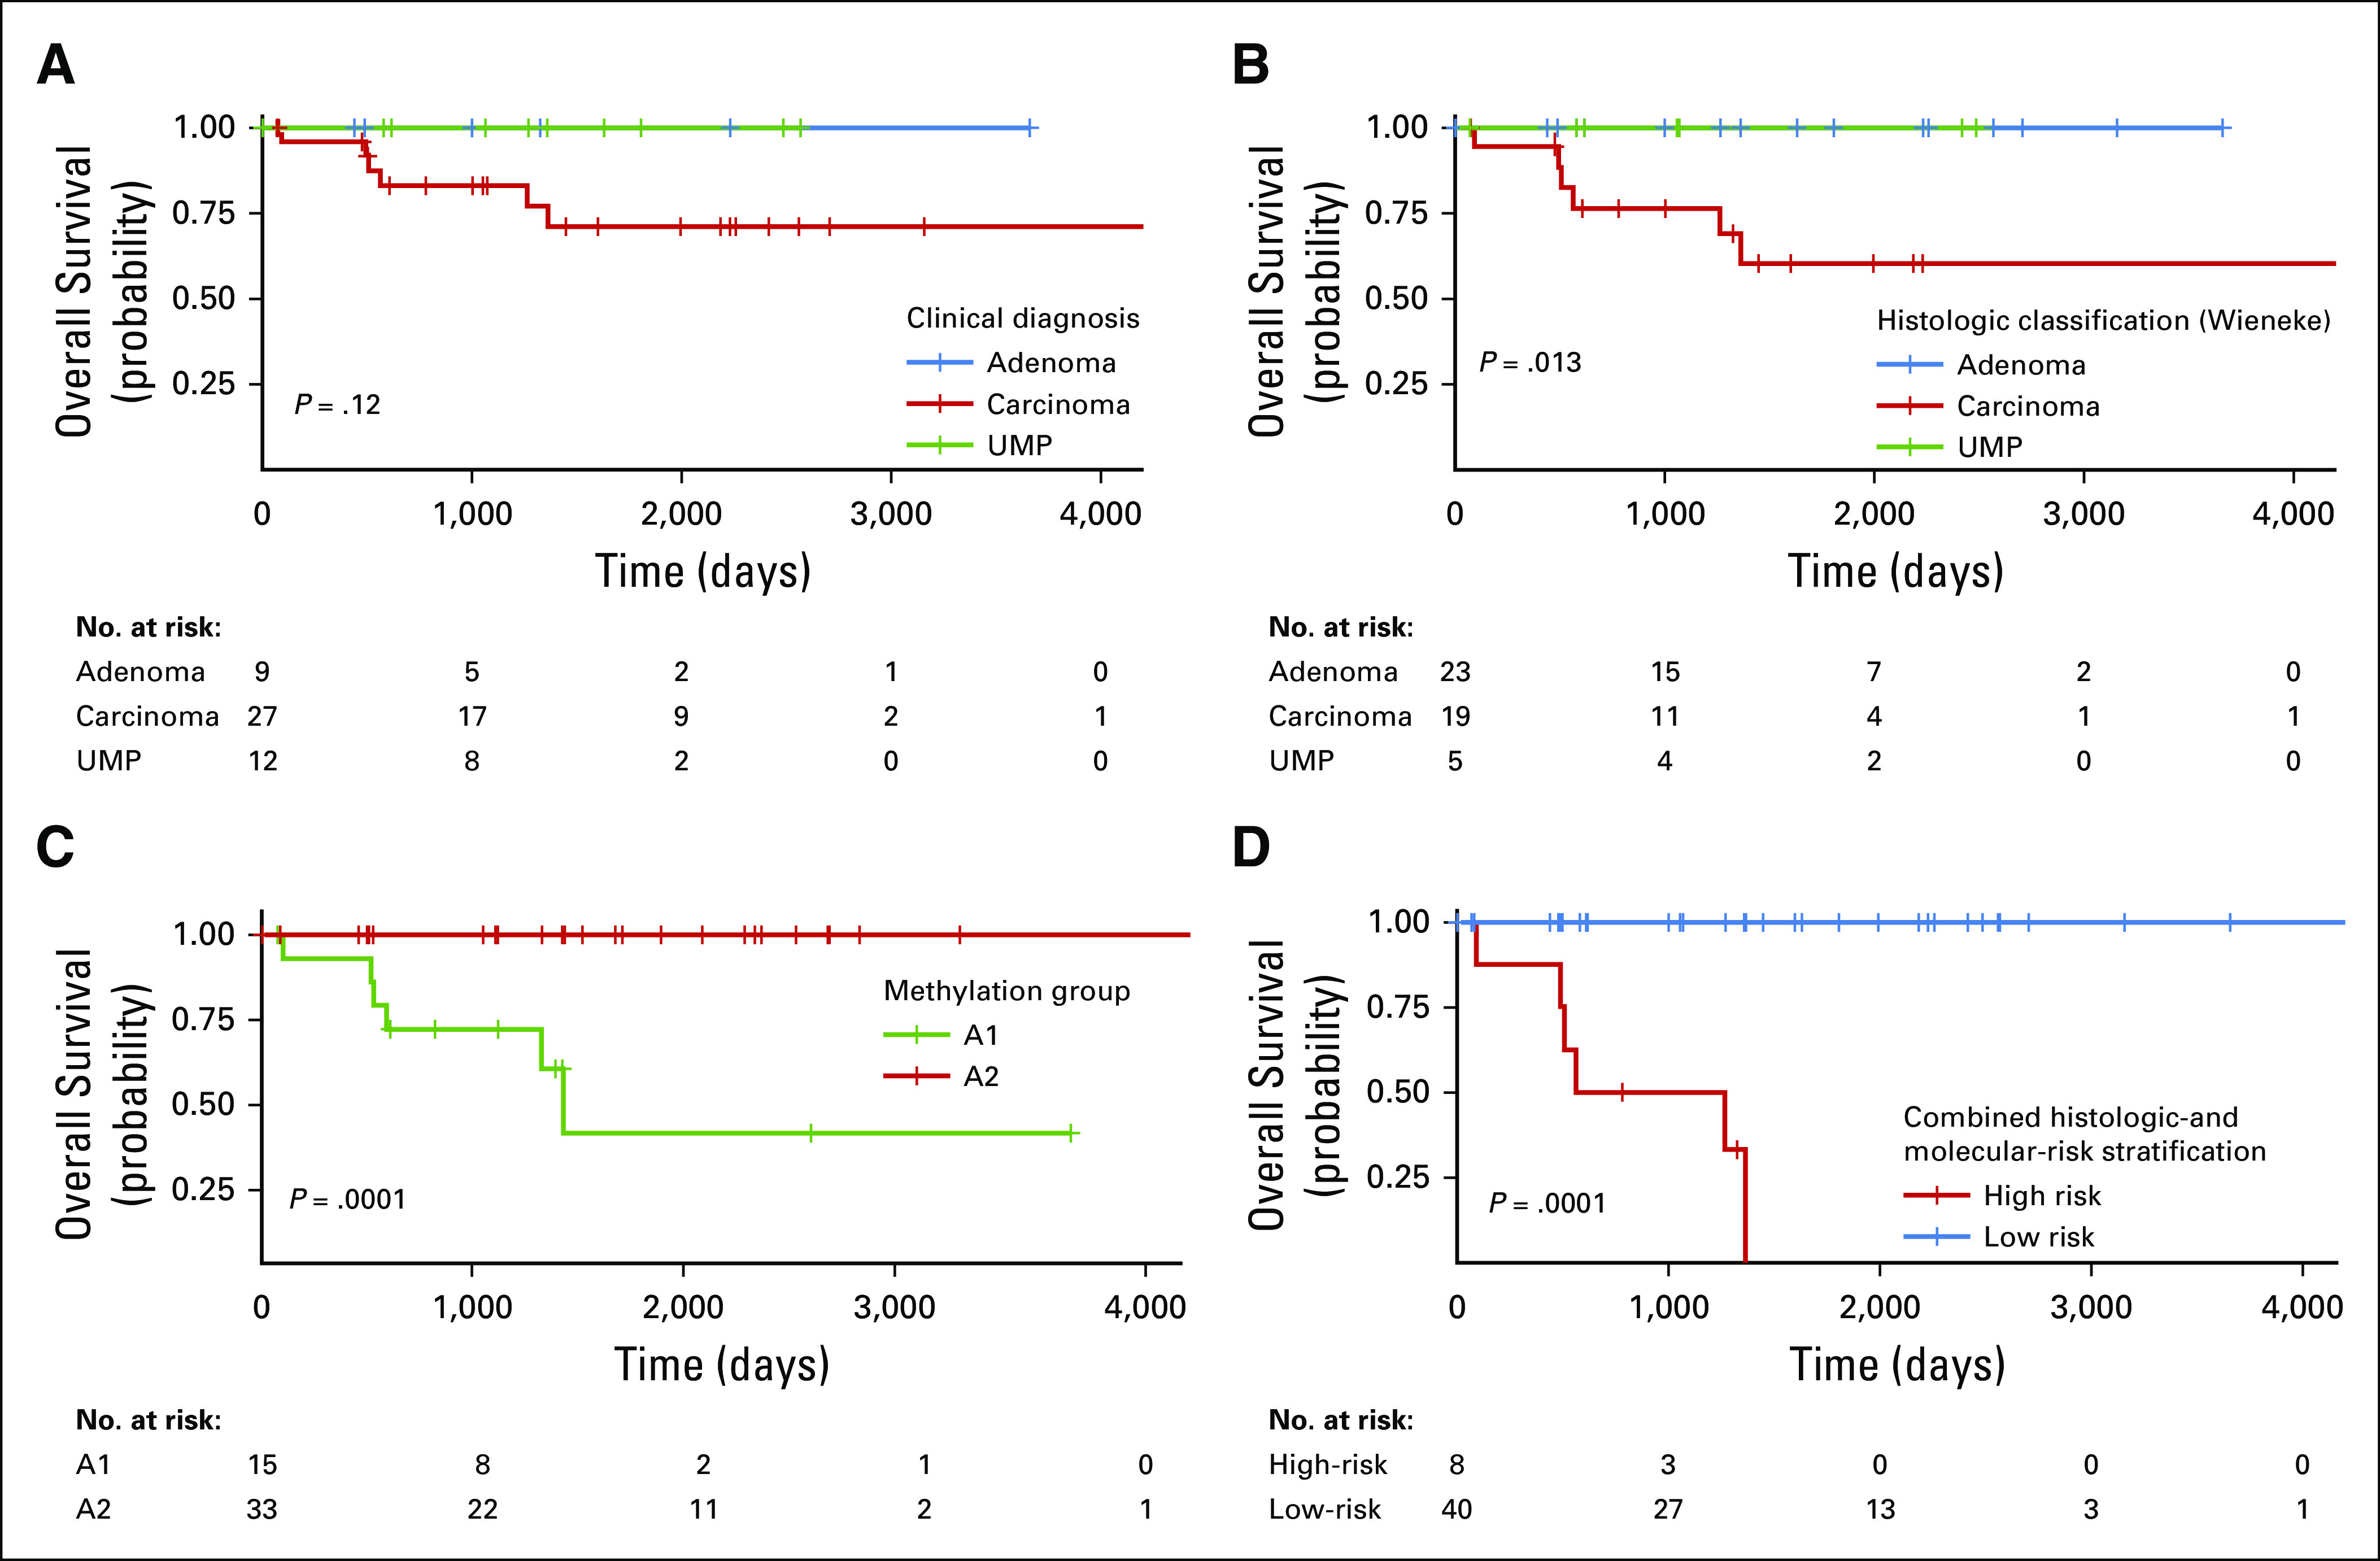
Kaplan-Meier plots of overall survival from disease based on (A) initial clinical diagnosis, (B) diagnosis rendered at the time of central review, (C) DNA methylation group, and (D) combined risk stratification using central review and methylation-classification group. UMP, uncertain malignant potential.
DISCUSSION
Our study demonstrates the potential of DNA methylation profiling to enhance current classification schemas by identifying prognostically relevant molecular groups in the pediatric population. The Wieneke classification improves on previous stratification systems, but overall remains a subjective tool. This subjectivity is clinically problematic because a proportion of tumors yield an intermediate score (Wieneke score = 3), and the criteria can be difficult to apply outside of specialized centers. These limitations make the search for alternative predictive biomarkers a priority, because this ambiguity represents a major hurdle to the implementation of risk-adapted therapies.
There are several advantages DNA methylation profiling offers as a clinical assay. The protocol can be completed within a 1-week turnaround time, which is sufficient for clinical decision-making purposes. The assay also performs well with poor-quality DNA derived from FFPE materials, which are widely available in most centers. Methylation class can also act as a molecular biomarker, even in the absence of well-defined driver alterations. In particular, it may be well suited for molecularly complex diseases. For example, relevant prognostic groups have been extracted from DNA methylation data in osteosarcoma, a tumor type characterized by heterogeneous driver mutations and genomic instability.31 Because DNA methylation marks are inherently linked to cell of origin, methylation class may represent a more biologically relevant and stable biomarker of disease than DNA-sequence variation alone.
Between our two methylation groups, A1 tumors were associated with a worse prognosis. In fact, in our cohort, except for one child who died of a primary brain tumor, all deaths were in the A1 group. The aggressive nature of A1 tumors was also evident in other clinical variables, with patients from this group having a more advanced clinical stage, greater age, and a tendency to be treated with adjuvant chemotherapy. The A1 group was significantly enriched for CTNNB1 mutations. Although there is a reported link between Wnt/β-catenin pathway mutations and aggressive disease in adult tumors,32 this has not been completely substantiated in the pediatric setting.11,33
TP53 mutations were enriched in the low-risk A2 group. The significance of any single TP53 alteration depends on several variables, and in isolation is not solely indicative of malignancy in an adrenocortical neoplasm.7 In this cohort, CTNNB1 and TP53 variations were identified in both methylation groups, and on their own, did not correlate with overall survival (P = 1.000 and P = .515, respectively). The discrepancy between p53 staining and TP53 mutational status is curious but represents a known shortcoming of interrogating the TP53 locus by immunohistochemical means34; additional factors, such as tissue fixation, likely affected this analysis.
Our study identified several genes and key pathways involved in biologic processes and molecular functions. Significant genes included IGF2, GNAS, and CLDN1, supporting a role of regulatory pathways such as signal transduction, cell growth, and cell signaling. This supports results from previous studies suggesting a role for these pathways in pediatric ACTs.26-29,35 GSEA also identified differential methylation of genes involved in the PRC2 pathway. This is particularly interesting, given the distribution of CTNNB1 alterations in this cohort, as the PRC2 complex is involved in epigenetic regulation and is a known modulator of the Wnt-signaling pathway.36
One limitation of the current study is our inability to validate our findings in an independent pediatric clinical cohort. This is mostly due to the rarity of appropriate pediatric ACT cohorts with clinical follow-up data. Review of the TCGA cohort highlighted several differences between adult and pediatric ACTs and provides additional evidence supporting them as separate disease entities. In addition to the unsupervised clustering features, analysis of CpG-island methylation highlighted distinct distributions of methylation marks, with an absence of the hypermethylator phenotype in the pediatric samples. Adult and pediatric ACTs also had unique copy number profiles, with pediatric samples tending to show greater evidence of chromosomal losses. The pediatric tumors retained their methylation groups when combined with the adult patients, providing evidence for the stability of group assignments and suggesting that adult trial cohorts are not appropriate comparisons for their pediatric counterparts. Validation of our molecular grouping in independent pediatric clinical cohorts will be a central focus of future studies, and international collaboration with carefully annotated data will be necessary to advance our knowledge of these rare tumors.
In addition to methylation-based classification representing a significant predictor of risk in our cohort, we also validated the effectiveness of the Wieneke classification schema. Importantly, the addition of methylation data to the histologic classification produced the best predictor of risk. These findings suggest that the optimal approach for risk stratification is to use a combinatorial system of risk assessment followed by risk-adapted or targeted therapy. This approach may optimize the exposure to therapy for patients with standard-risk disease, while maximizing the effectiveness of intervention in patients with high-risk disease.
ACKNOWLEDGMENT
The authors thank David W. Ellison, MD, PhD, and Angela McArthur, PhD, for their assistance in the preparation of this article.
APPENDIX
Processing of Samples and Methylation Data
The study cohort was derived from the International Pediatric Adrenocortical Tumor Registry database (n = 110 total entries) to include samples that satisfied two requirements, including those that contained sufficient DNA for methylation analysis and those that had tumor sections for histologic review (initial cohort, n = 73). No patients were excluded based on any patient-derived or clinicopathologic characteristics. Of these 73, 18 yielded insufficient DNA for analysis, and seven additional patients failed to pass quality and/or purity metrics. The resultant 48 patients were included in the study.
All DNA samples were quantified by the fluorometric method (Qbit dsDNA BR Assay, Thermo Fisher Scientific, Waltham, MA). DNA quality was assessed using the Infinium HD FFPE QC Assay (Illumina, San Diego, CA) and by electrophoresis in a 2% E-gel agarose gel (Thermo Fisher Scientific).
Methylation data were preprocessed using the minfi package (v.1.28.3; Aryee, et al: Bioinformatics 30:1363-1369, 2014) in R (http://www.r-project.org, version 3.5.1). The detection P value for each sample was computed, and only samples with a mean detection P value less than .05 were carried forward for subsequent analysis. Additional quality control was performed by calculating the median log (base 2) intensities for methylated and unmethylated signals for each array and excluding samples with unmethylated and methylated median intensity values below a cutoff of 9.5.
Functional normalization (Fortin JP, et al: Genome Biol 15:503, 2014) with noob background correction and dye-bias normalization (Troche TJ, et al: Nucleic Acids Res 41:e90, 2013) was performed. Probe filtering was performed after normalization. Specifically, probes located on sex chromosomes, probes containing a nucleotide polymorphism (dbSNP132 common) within five base pairs of and including the targeted CpG-site, probes mapping to multiple sites on hg19 (allowing for one mismatch), and any cross-reactive probes were removed from the analysis (Pidsley R, et al: Genome Biol 17:208, 2016). M values were also calculated and represent the log2 ratios of the intensities of methylated versus unmethylated probes. These values were used in the heatmap, differentially methylated probes analysis, and GSEA.
Unsupervised analysis of methylation data was performed using hierarchical clustering and t-distributed stochastic neighbor embedding (t-SNE) using Rtsne (v.0.15). In brief, the 20,000 most variably methylated CpG probes, as measured by the standard deviation of the probe-level beta values across samples, were selected. The Pearson correlation was calculated as the distance measured between samples, and the clustering was performed using the complete-linkage agglomerative method (Clifford H, et al: Front Genet 2:88, 2011).
The result of the hierarchical clustering analysis previously mentioned was also recapitulated in a complementary analysis that exhaustively evaluated 16,000 Euclidean-distance hierarchical clustering procedures (HCPs) that used four different probe-selection methods (choosing probes with the greatest standard deviation, median absolute deviation, most informative spacing statistic [Pawlikowska I, et al: Bioinformatics 30:1400-1408, 2014], and the dip statistic21 modified to measure both evidence bimodality and distance between modes), selection of 1-1,000 probes, and defining two to five groups with a post hoc evaluation of reproducibility of subgroup group assignments by exact k = 5 nearest neighbor exact bootstrap procedure (Steele BM, et al: Mach Learn 74:235-255, 2009; four probe-selection methods × selection of up to 1,000 probes × definition of two to five groups = 4 × 1,000 × 4 = 16,000 HCPs). The modified dip statistic was defined as 4 times the product of the Hartigan and Hartigan dip statistic and the difference between the data value defining the dip and the quantile of the unimodal distribution function corresponding to the value of the empirical distribution function of that value. In this way, the modified dip statistic considered both the strength of statistical evidence in favor of multimodality and the size of the gap between the two primary modes in the data. HCP 1141 selected the 286 probes with the greatest value of this modified dip statistic and defined two subgroups with 96.4% exact k = 5 nearest neighbor bootstrap assignment reproducibility. The two subgroups defined by HCP 1141 strongly associated with two subgroups defined by t-SNE and complete-linkage agglomeration (P = 1.5 × 10⁻⁸; Table A3). The Wilcoxon rank-sum test was used to perform a post hoc comparison of the methylation values of all probe sets across the two subgroups defined by HCP 1141. To adjust for multiplicity, we computed Storey’s q value (Storey JD, et al: Proc Natl Acad Sci USA) using the Pounds-Cheng estimator of the proportion of tests with a true null hypothesis (Pounds S, et al: Comput Biol 12:482-495, 2005). The Data Supplement provides the modified dip statistic and Wilcoxon results for the 286 probes selected by HCP 1141.
Copy Number Analysis
DNA copy number variation (CNV) was inferred from the methylation data by using the conumee Bioconductor package in R with the default settings.16 The combined intensities of all available CpG probes were normalized against that of pediatric non-neoplastic adrenal gland controls (n = 12) and using a linear-regression approach. Copy number gains and losses were designated using a mean segment value threshold of −0.20 and 0.20 for copy number loss and gain, respectively.
CNVs were confirmed by fluorescence in situ hybridization (FISH) when tissue was available (n = 9; Appendix Fig A5). Enumeration FISH was performed on formalin-fixed paraffin-embedded materials from patients with evidence of whole-chromosome gain or loss. For FISH testing, target probes included the following: chromosome 1 (1p36-red and 1q44-green), chromosome 3 (3p24-red and 3q29-green), chromosome 5 (5p15.3-red and 5q33.1-green), chromosome 9 (9p21.3-red and 9q34-green), and chromosome 17 (17p13.1-red and 17q25.3-green). Probes were combined with sheared human cot DNA and hybridized to the treated slides in a solution containing 50% formamide, 10% dextran sulfate, and 2× SSC. The cells were then stained with 4,6-diamidino-2-phenylindole and analyzed. Two hundred cells from each sample were analyzed for the number of red and green signals.
Pathway and Gene Set Enrichment Analysis
For the gene set enrichment analysis (GSEA), log fold changes of each pairwise comparison were computed for the top 20,000 most variably methylated probes and used as the ranking metric for GSEA Preranked (v3.0).17,18 Probes were mapped to gene symbols using the Illumina annotation for EPIC arrays (ilm10b3.hg19). For probes that mapped to the same gene, only one probe with maximum (up) or minimum (down) log fold change was kept for GSEA. GSEA was performed to determine if the members of a given gene set were enriched among the most methylated genes for each pairwise comparison. The ranked gene lists were tested against KEGG, Gene Ontology Biologic Process, Gene Ontology Molecular Function, Reactome, Positional, Immunologic, and Oncogenic gene sets (v6.2). Significance was defined by the false discovery–adjusted P value of q < .05.
Statistical Methods and Cox Bayesian Information Criteria Analysis
Statistical methods.
Fisher’s exact test was used to compare the prevalence of copy number gains and losses across the two methylation groups. To address multiple testing, a robust false-discovery-rate estimator (Pounds S, et al: Comput Biol 12:482-495, 2005) was used to compute q values (Storey JD: J R Stat Soc B 64:479-498, 2002)
Overall survival was defined as the time elapsed from diagnosis to death from disease, with living patients censored at the most recent follow-up. Bayesian information criteria (BIC; Schwarz G: Ann Stat 6:461-464, 1978) evidence weights (EWs; Akaike H: Ann Inst Stat Math 30:9-14, 1978) were used to quantify statistical support for each of a series of proportional hazard regression models (Cox DR: J R Stat Soc B 34:187-220, 1972) of the association of survival with the Wieneke criterion, clinical diagnosis, and methylation group.
Results of Cox BIC analysis.
We used BIC EWs to evaluate the following six models of the association of survival with the Wieneke criterion, the clinical diagnosis, and/or methylation group: (1) the null model, (2) the Wieneke criterion as the sole predictor of survival, (3) the clinical diagnosis as the sole predictor of survival, (4) the methylation group as the sole predictor of survival, (5) the Wieneke criterion and methylation group as predictors of survival, and (6) the clinical diagnosis and methylation group as predictors of survival. The BIC EWs for a specific statistical model range from 0 (the data do not support the specific model) to 1 (the data overwhelmingly support the specific model), and the BIC EWs for a set of candidate models sum to 1. The BIC EW may be interpreted as the probability that the indicated model is best among the set of considered models. The data strongly support the model with the Wieneke criterion and methylation group as predictors of survival (BIC EW = 0.764), indicate that the model with the clinical diagnosis and methylation group as predictors of survival is also reasonable (BIC EW = 0.195), suggests that the methylation group as the sole predictor of survival may be plausible (BIC EW = 0.033), and indicates that the data are not supportive of the other three models (BIC EW < 0.005 for each of those models; Appendix Fig A6).
Additional 2-Predictor Cox Models
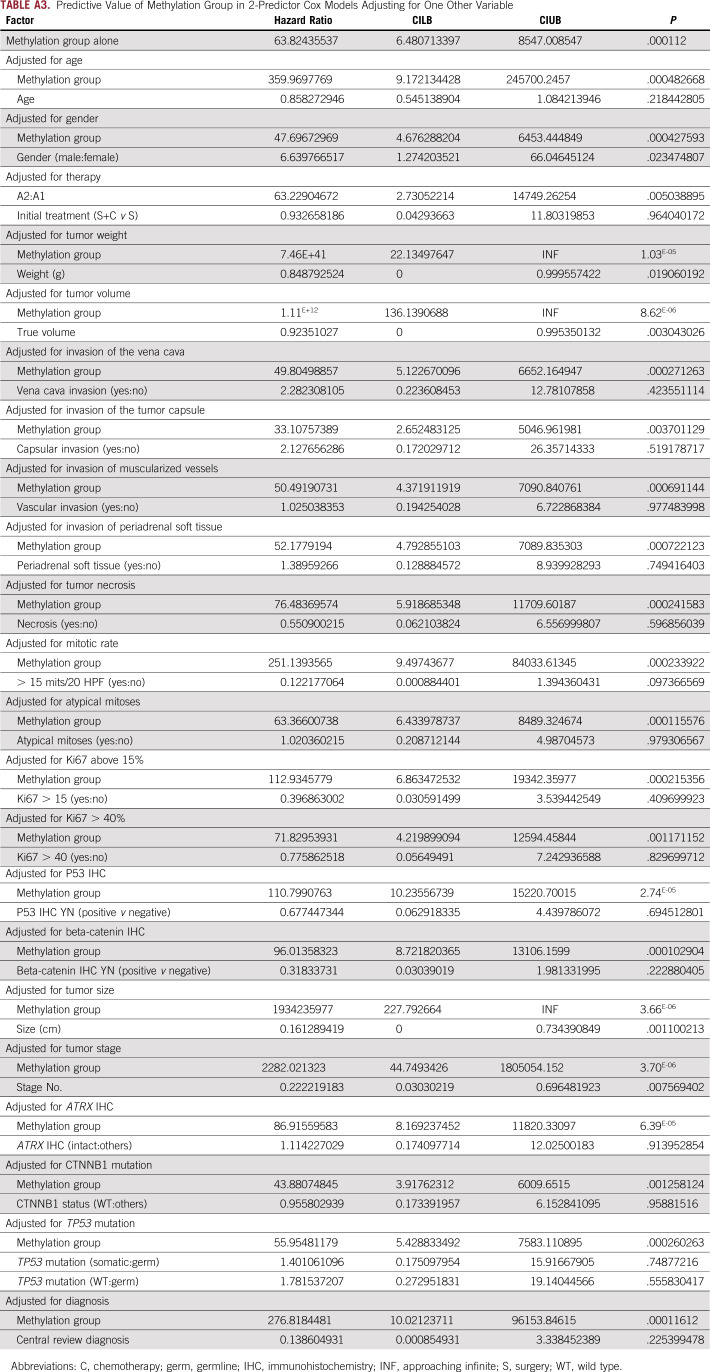
Separate from the Cox BIC analysis described previously, we also considered a series of 2-predictor Cox models. In these models, we evaluate methylation group as an outcome predictor after adjustment for other variables (Data Supplement). These analyses used the Firth penalized Cox regression to ensure statistical stability of results with small sample sizes.
FIG A1.
The relationship between tumor volume and tumor weight.
FIG A2.

Age distribution of the International Pediatric Adrenocortical Tumor Registry (IPACTR) cohort. (A) Bimodal age distribution of the IPACTR cohort. (B) Age distribution by methylation group.
FIG A3.
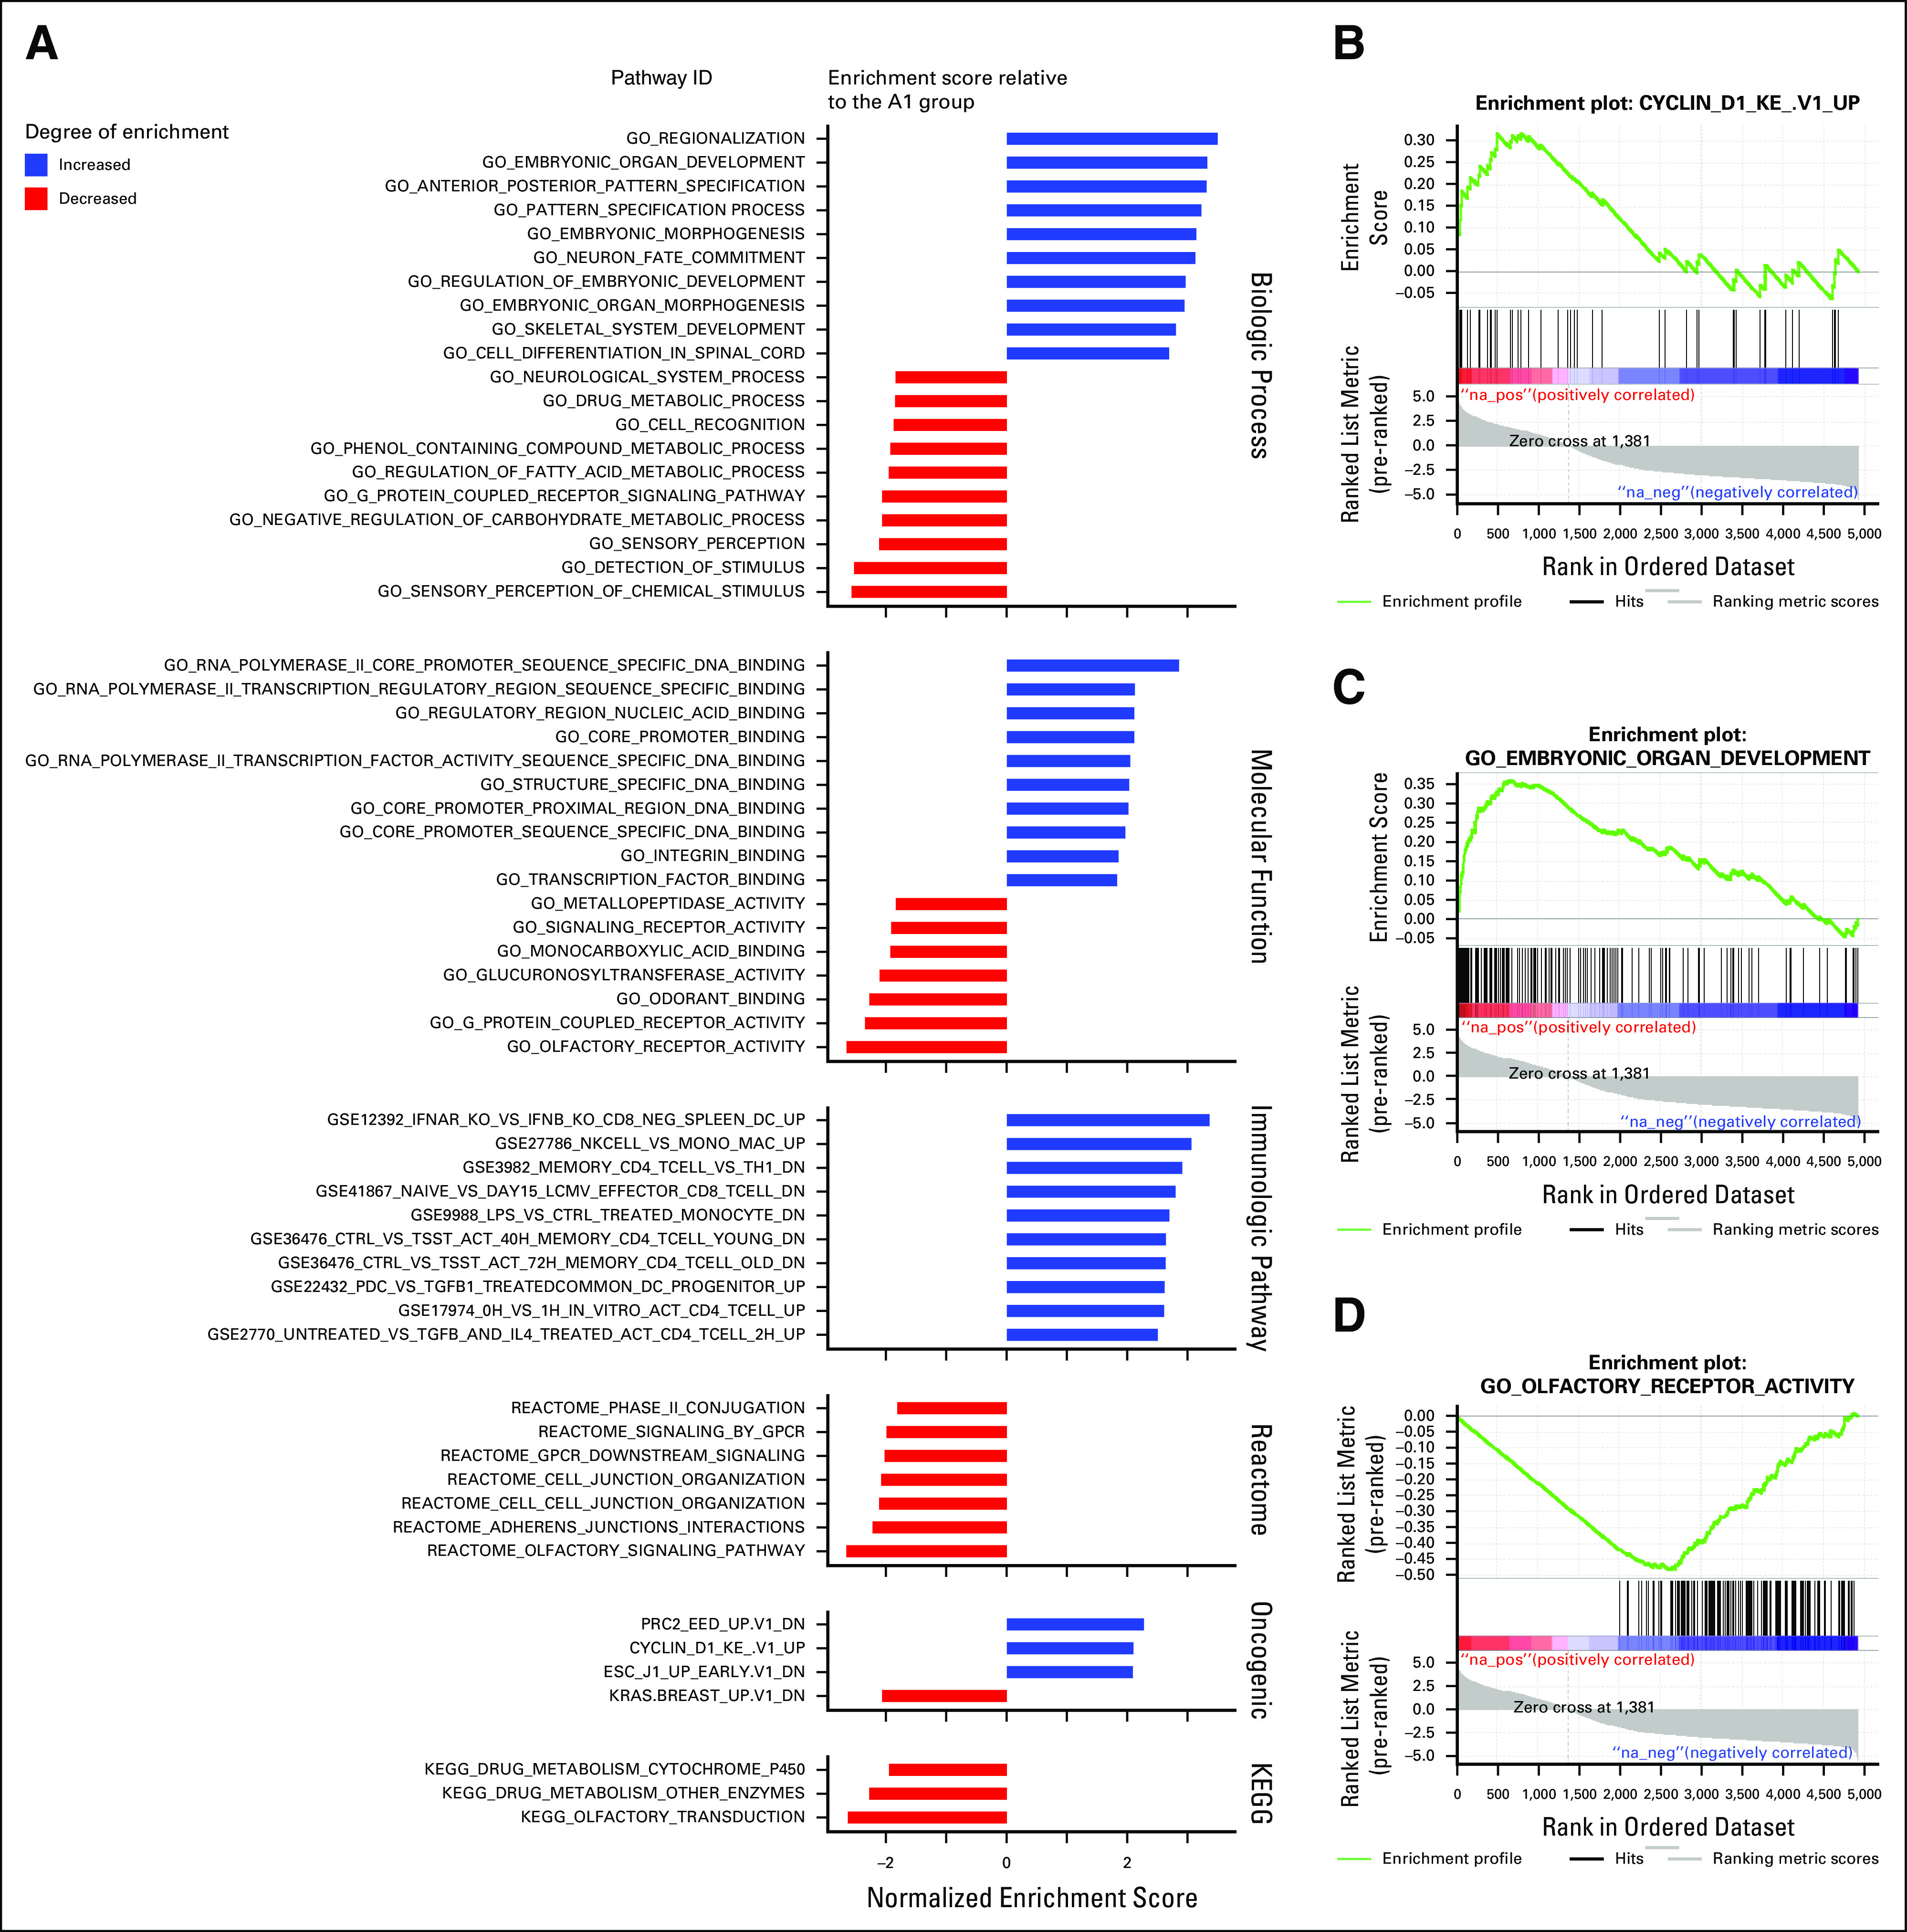
Gene set enrichment analysis results. (A) Gene set enrichment analysis of the A1 vs. A2 methylation groups. (B) Positive enrichment plot for cyclin D1 gene set in the A1 group. (C) Positive enrichment plot for embryonic organ developmental gene set in the A1 group. (D) Negative enrichment plot for the olfactory receptor gene set in the A1 group. ID, identification.
FIG A4.
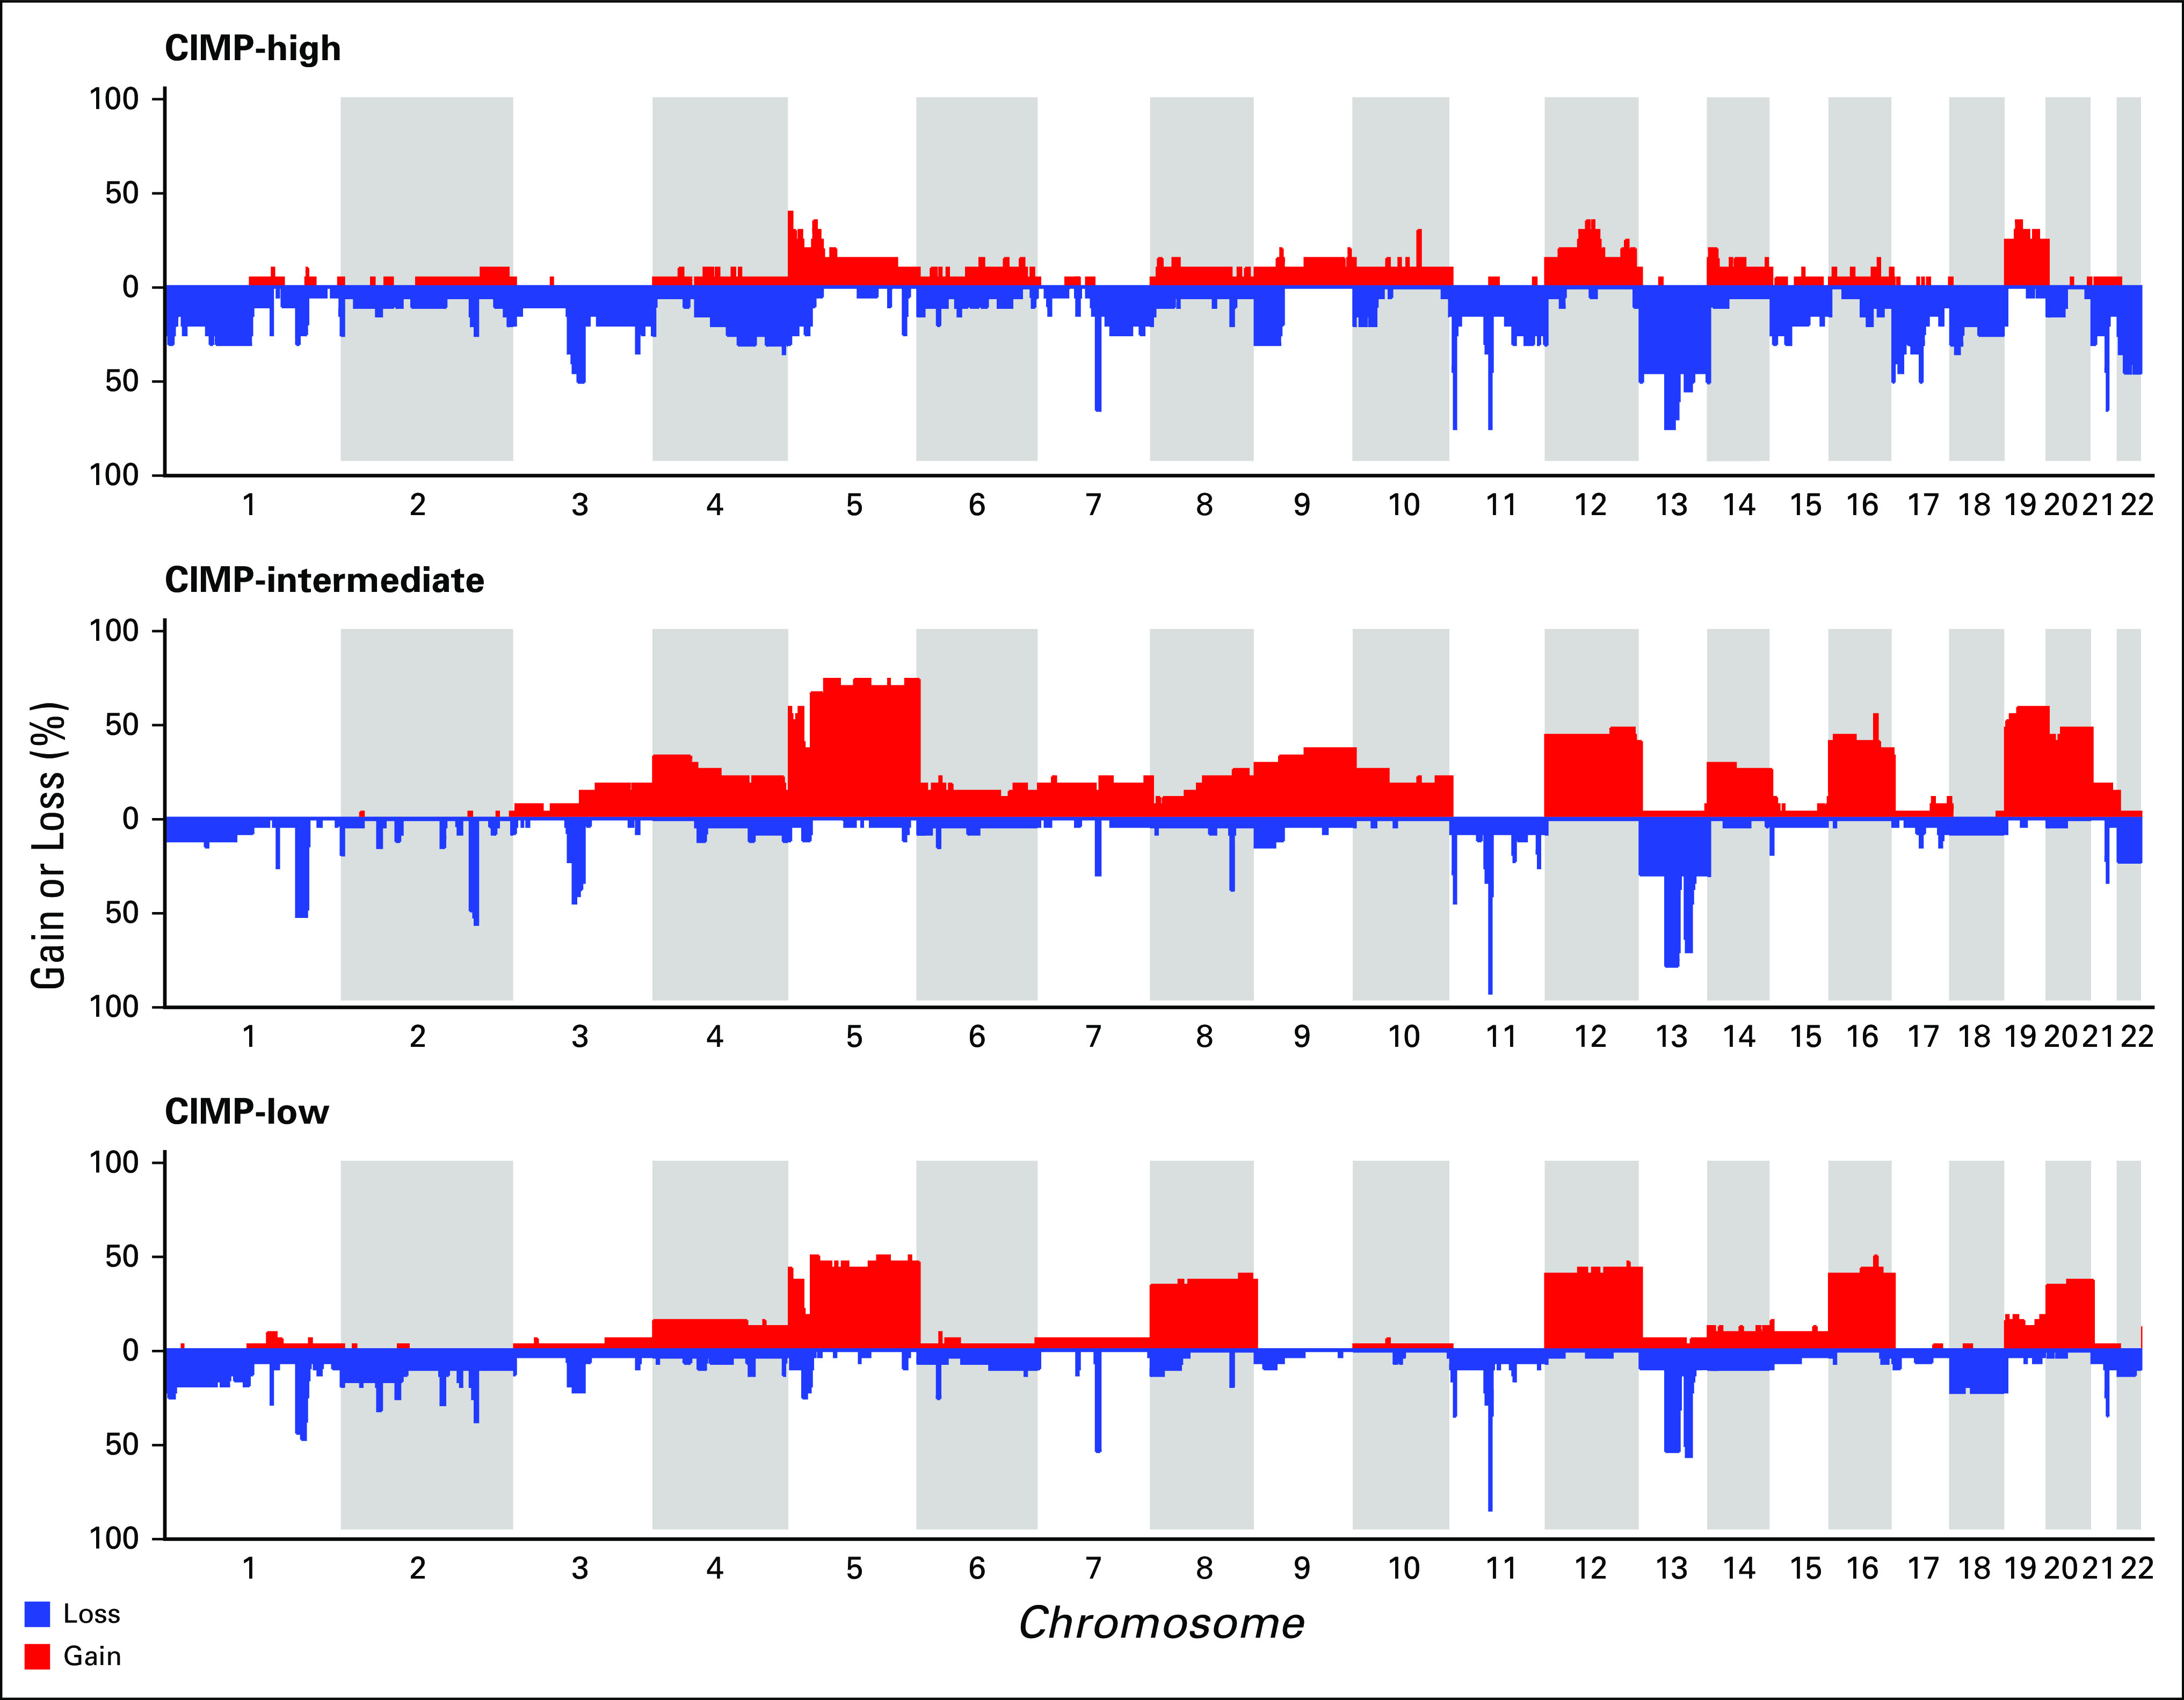
Copy number frequency plots for The Cancer Genome Atlas cohort by CpG-island methylator phenotype (CIMP) classification.
FIG A5.
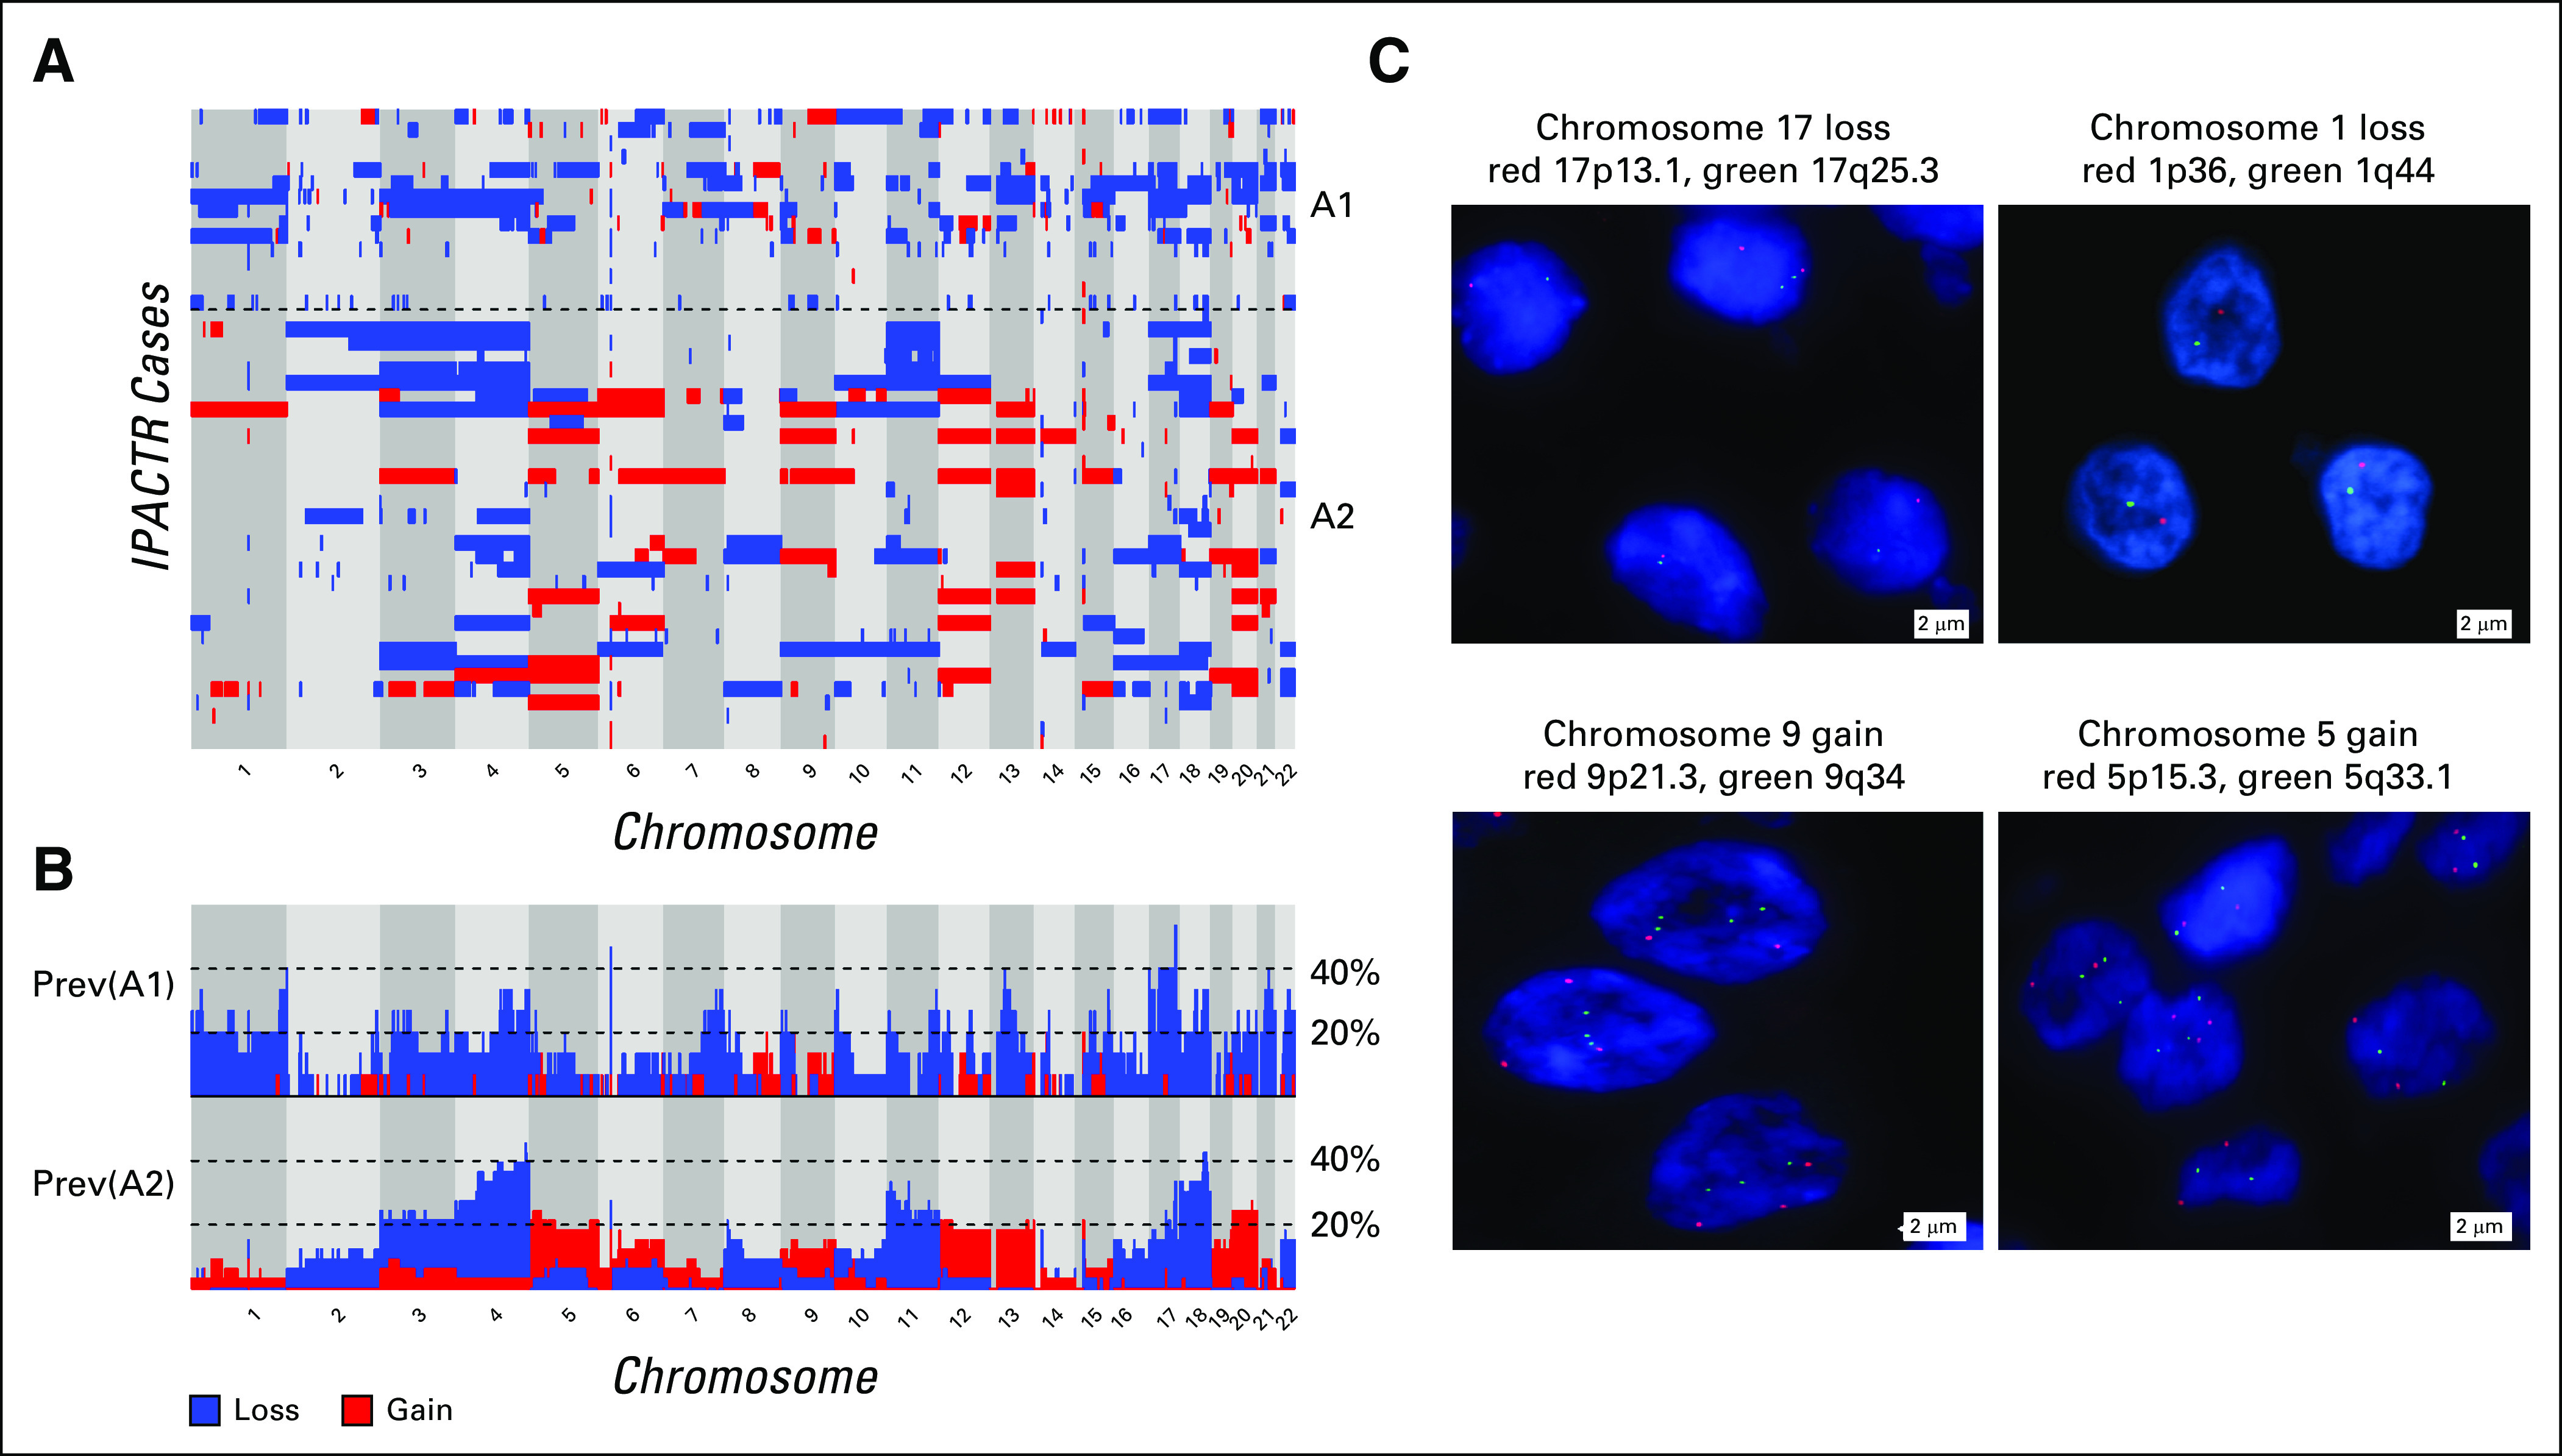
Expanded copy number and Manhattan plots of IPACTR cohort by methylation group. (A) Expanded copy number plot ordered by methylation group. (B) Manhattan plot showing prevalence of gains and losses by methylation group. (C) Confirmatory fluorescence in situ hybridization highlighting selected examples of copy number changes. Prev, prevalence.
FIG A6.
Relapse-free survival models by Bayesian information criterion (BIC) evidence weights.
TABLE A1.
Modified Disease Staging System Used by IPACTR
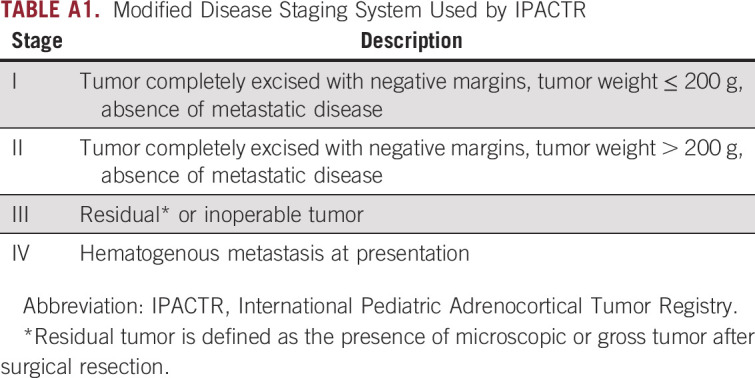
TABLE A2.
Correlation Between Methylation Group by t-SNE and the Best Fit Hierarchical Clustering Procedure

TABLE A3.
Predictive Value of Methylation Group in 2-Predictor Cox Models Adjusting for One Other Variable
Footnotes
Supported by the National Institutes of Health Grant No. P30 CA21765, in the form of developmental funds from the St Jude Comprehensive Cancer Center, and the American Lebanese Syrian Associated Charities.
B.A.O. and R.C.R. are co-senior authors.
AUTHOR CONTRIBUTIONS
Conception and design: Michael R. Clay, Emilia M. Pinto, Brent A. Orr
Provision of study materials or patients: Emilia M. Pinto, Michael A. Dyer, Gerard P. Zambetti, Raul C. Ribeiro
Collection and assembly of data: Michael R. Clay, Emilia M. Pinto, Cynthia Cline, Quynh T. Tran, Michael A. Dyer, Brent A. Orr
Data analysis and interpretation: Michael R. Clay, Emilia M. Pinto, Cynthia Cline, Brent A. Orr, Quynh T. Tran, Tong Lin, Lei Shi, Huiyun Wu, Stanley B. Pounds, Gerard P. Zambetti, Raul C. Ribeiro
Manuscript writing: All authors
Final approval of manuscript: All authors
AUTHORS' DISCLOSURES OF POTENTIAL CONFLICTS OF INTEREST
The following represents disclosure information provided by authors of this manuscript. All relationships are considered compensated unless otherwise noted. Relationships are self-held unless noted. I = Immediate Family Member, Inst = My Institution. Relationships may not relate to the subject matter of this manuscript. For more information about ASCO's conflict of interest policy, please refer to www.asco.org/rwc or ascopubs.org/po/author-center.
Open Payments is a public database containing information reported by companies about payments made to US-licensed physicians (Open Payments).
Emilia M. Pinto
Patents, Royalties, Other Intellectual Property: Genotyping assays to identify mutations in xaf1 pending to St Jude Children's Research Hospital
Gerard P. Zambetti
Research Funding: Johnson & Johnson
Patents, Royalties, Other Intellectual Property: Mcl1 antibody license (Rockland Labs) to St Jude Children's Research Hospital. I receive small royalty on an annual basis patent pending for genotyping assays to identify mutations in XAF1 Provisional application #62/659,427; foreign filing April 18, 2019
No other potential conflicts of interest were reported.
REFERENCES
- 1.Mansmann G, Lau J, Balk E, et al. The clinically inapparent adrenal mass: Update in diagnosis and management. Endocr Rev. 2004;25:309–340. doi: 10.1210/er.2002-0031. [DOI] [PubMed] [Google Scholar]
- 2.Gulack BC, Rialon KL, Englum BR, et al. Factors associated with survival in pediatric adrenocortical carcinoma: An analysis of the National Cancer Data Base (NCDB) J Pediatr Surg. 2016;51:172–177. doi: 10.1016/j.jpedsurg.2015.10.039. [DOI] [PMC free article] [PubMed] [Google Scholar]
- 3.Else T, Kim AC, Sabolch A, et al. Adrenocortical carcinoma. Endocr Rev. 2014;35:282–326. doi: 10.1210/er.2013-1029. [DOI] [PMC free article] [PubMed] [Google Scholar]
- 4.Michalkiewicz E, Sandrini R, Figueiredo B, et al. Clinical and outcome characteristics of children with adrenocortical tumors: A report from the International Pediatric Adrenocortical Tumor Registry. J Clin Oncol. 2004;22:838–845. doi: 10.1200/JCO.2004.08.085. [DOI] [PubMed] [Google Scholar]
- 5.Wieneke JA, Thompson LD, Heffess CS. Adrenal cortical neoplasms in the pediatric population: A clinicopathologic and immunophenotypic analysis of 83 patients. Am J Surg Pathol. 2003;27:867–881. doi: 10.1097/00000478-200307000-00001. [DOI] [PubMed] [Google Scholar]
- 6. doi: 10.1038/nature25480. Gröbner SN, Worst BC, Weischenfeldt J, et al: The landscape of genomic alterations across childhood cancers. Nature 555:321-327, 2018 [Erratum: Nature 559:E10, 2018] [DOI] [PubMed] [Google Scholar]
- 7.Pinto EM, Chen X, Easton J, et al. Genomic landscape of paediatric adrenocortical tumours. Nat Commun. 2015;6:6302. doi: 10.1038/ncomms7302. [DOI] [PMC free article] [PubMed] [Google Scholar]
- 8.Kebebew E, Reiff E, Duh QY, et al. Extent of disease at presentation and outcome for adrenocortical carcinoma: Have we made progress? World J Surg. 2006;30:872–878. doi: 10.1007/s00268-005-0329-x. [DOI] [PubMed] [Google Scholar]
- 9.Barreau O, Assié G, Wilmot-Roussel H, et al. Identification of a CpG island methylator phenotype in adrenocortical carcinomas. J Clin Endocrinol Metab. 2013;98:E174–E184. doi: 10.1210/jc.2012-2993. [DOI] [PubMed] [Google Scholar]
- 10.Assié G, Letouzé E, Fassnacht M, et al. Integrated genomic characterization of adrenocortical carcinoma. Nat Genet. 2014;46:607–612. doi: 10.1038/ng.2953. [DOI] [PubMed] [Google Scholar]
- 11.Pinto EM, Rodriguez-Galindo C, Pounds SB, et al. Identification of clinical and biologic correlates associated with outcome in children with adrenocortical tumors without germline TP53 mutations: A St Jude Adrenocortical Tumor Registry and Children’s Oncology Group study. J Clin Oncol. 2017;35:3956–3963. doi: 10.1200/JCO.2017.74.2460. [DOI] [PMC free article] [PubMed] [Google Scholar]
- 12.Fonseca AL, Kugelberg J, Starker LF, et al. Comprehensive DNA methylation analysis of benign and malignant adrenocortical tumors. Genes Chromosomes Cancer. 2012;51:949–960. doi: 10.1002/gcc.21978. [DOI] [PubMed] [Google Scholar]
- 13.Rechache NS, Wang Y, Stevenson HS, et al. DNA methylation profiling identifies global methylation differences and markers of adrenocortical tumors. J Clin Endocrinol Metab. 2012;97:E1004–E1013. doi: 10.1210/jc.2011-3298. [DOI] [PMC free article] [PubMed] [Google Scholar]
- 14. doi: 10.1016/j.ccell.2016.07.013. Zheng S, Cherniack AD, Dewal N, et al: Cancer Genome Atlas Research Network: Comprehensive pan-genomic characterization of adrenocortical carcinoma. Cancer Cell 30:363, 2016 [Erratum: Cancer Cell 30:363, 2016] [DOI] [PubMed] [Google Scholar]
- 15.Moran S, Arribas C, Esteller M. Validation of a DNA methylation microarray for 850,000 CpG sites of the human genome enriched in enhancer sequences. Epigenomics. 2016;8:389–399. doi: 10.2217/epi.15.114. [DOI] [PMC free article] [PubMed] [Google Scholar]
- 16. Hovestadt V, Zapatka M: conumee: Enhanced copy-number variation analysis using Illumina DNA methylation arrays. R package version 1.9.0. http://bioconductor.org/packages/conumee/ [DOI] [PMC free article] [PubMed]
- 17.Subramanian A, Tamayo P, Mootha VK, et al. Gene set enrichment analysis: A knowledge-based approach for interpreting genome-wide expression profiles. Proc Natl Acad Sci USA. 2005;102:15545–15550. doi: 10.1073/pnas.0506580102. [DOI] [PMC free article] [PubMed] [Google Scholar]
- 18.Mootha VK, Lindgren CM, Eriksson KF, et al. PGC-1alpha-responsive genes involved in oxidative phosphorylation are coordinately downregulated in human diabetes. Nat Genet. 2003;34:267–273. doi: 10.1038/ng1180. [DOI] [PubMed] [Google Scholar]
- 19.Kerr MK, Churchill GA. Bootstrapping cluster analysis: Assessing the reliability of conclusions from microarray experiments. Proc Natl Acad Sci USA. 2001;98:8961–8965. doi: 10.1073/pnas.161273698. [DOI] [PMC free article] [PubMed] [Google Scholar]
- 20. Dudoit S, Fridlyand J: A prediction-based resampling method for estimating the number of clusters in a dataset. Genome Biol 3(7):research0036.1–research0036.21, 2002. [DOI] [PMC free article] [PubMed]
- 21.Hartigan JA, Hartigan PM: The dip test of unimodality. Ann Stat. 1985;13:70–84. [Google Scholar]
- 22.Albertin G, Carraro G, Petrelli L, et al. Endothelin-1 and adrenomedullin enhance the growth of human adrenocortical carcinoma-derived SW-13 cell line by stimulating proliferation and inhibiting apoptosis. Int J Mol Med. 2005;15:469–474. [PubMed] [Google Scholar]
- 23.Scholl UI, Stölting G, Nelson-Williams C, et al. Recurrent gain of function mutation in calcium channel CACNA1H causes early-onset hypertension with primary aldosteronism. eLife. 2015;4:e06315. doi: 10.7554/eLife.06315. [DOI] [PMC free article] [PubMed] [Google Scholar]
- 24.Alrezk R, Hannah-Shmouni F, Stratakis CA. MEN4 and CDKN1B mutations: The latest of the MEN syndromes. Endocr Relat Cancer. 2017;24:T195–T208. doi: 10.1530/ERC-17-0243. [DOI] [PMC free article] [PubMed] [Google Scholar]
- 25.Swisshelm K, Machl A, Planitzer S, et al. SEMP1, a senescence-associated cDNA isolated from human mammary epithelial cells, is a member of an epithelial membrane protein superfamily. Gene. 1999;226:285–295. doi: 10.1016/s0378-1119(98)00553-8. [DOI] [PubMed] [Google Scholar]
- 26.Diaz A, Danon M, Crawford J. McCune-Albright syndrome and disorders due to activating mutations of GNAS1. J Pediatr Endocrinol Metab. 2007;20:853–880. doi: 10.1515/jpem.2007.20.8.853. [DOI] [PubMed] [Google Scholar]
- 27.Almeida MQ, Azevedo MF, Xekouki P, et al. Activation of cyclic AMP signaling leads to different pathway alterations in lesions of the adrenal cortex caused by germline PRKAR1A defects versus those due to somatic GNAS mutations. J Clin Endocrinol Metab. 2012;97:E687–E693. doi: 10.1210/jc.2011-3000. [DOI] [PMC free article] [PubMed] [Google Scholar]
- 28.Gao ZH, Suppola S, Liu J, et al. Association of H19 promoter methylation with the expression of H19 and IGF-II genes in adrenocortical tumors. J Clin Endocrinol Metab. 2002;87:1170–1176. doi: 10.1210/jcem.87.3.8331. [DOI] [PubMed] [Google Scholar]
- 29.Kjellin H, Johansson H, Höög A, et al. Differentially expressed proteins in malignant and benign adrenocortical tumors. PLoS One. 2014;9:e87951. doi: 10.1371/journal.pone.0087951. [DOI] [PMC free article] [PubMed] [Google Scholar]
- 30.Mikosha AS, Tron’ko ND, Staren’kii DV, et al. Isoforms of protein kinase C and their distribution in human adrenal cortex and tumors. Bull Exp Biol Med. 2001;132:841–843. doi: 10.1023/a:1013110516048. [DOI] [PubMed] [Google Scholar]
- 31.Tian W, Li Y, Zhang J, et al. Combined analysis of DNA methylation and gene expression profiles of osteosarcoma identified several prognosis signatures. Gene. 2018;650:7–14. doi: 10.1016/j.gene.2018.01.093. [DOI] [PubMed] [Google Scholar]
- 32.Maharjan R, Backman S, Åkerström T, et al. Comprehensive analysis of CTNNB1 in adrenocortical carcinomas: Identification of novel mutations and correlation to survival. Sci Rep. 2018;8:8610. doi: 10.1038/s41598-018-26799-2. [DOI] [PMC free article] [PubMed] [Google Scholar]
- 33.Leal LF, Mermejo LM, Ramalho LZ, et al. Wnt/beta-catenin pathway deregulation in childhood adrenocortical tumors. J Clin Endocrinol Metab. 2011;96:3106–3114. doi: 10.1210/jc.2011-0363. [DOI] [PubMed] [Google Scholar]
- 34.Murnyák B, Hortobágyi T. Immunohistochemical correlates of TP53 somatic mutations in cancer. Oncotarget. 2016;7:64910–64920. doi: 10.18632/oncotarget.11912. [DOI] [PMC free article] [PubMed] [Google Scholar]
- 35.Bonnet-Serrano F, Bertherat J. Genetics of tumors of the adrenal cortex. Endocr Relat Cancer. 2018;25:R131–R152. doi: 10.1530/ERC-17-0361. [DOI] [PubMed] [Google Scholar]
- 36.Adhikari A, Davie J. JARID2 and the PRC2 complex regulate skeletal muscle differentiation through regulation of canonical Wnt signaling. Epigenetics Chromatin. 2018;11:46. doi: 10.1186/s13072-018-0217-x. [DOI] [PMC free article] [PubMed] [Google Scholar]


