Abstract
Introduction
High-fat diet (HFD)-induced obesity is accompanied by compromised nitric oxide (NO) signaling and gut microbiome dysregulation. Inorganic dietary nitrate, which acts as a NO donor, exerts beneficial effects on metabolic disorders. Here, we evaluated the effects of dietary nitrate on HFD-induced obesity and provided insights into the underlying mechanism.
Research design and methods
To investigate the preventive effect of dietary nitrate on HFD-induced obesity, C57BL/6 mice were randomly assigned into four groups (n=10/group), including normal control diet group (normal water and chow diet), HFD group (normal water and HFD), HFD+NaNO3 group (water containing 2 mM NaNO3 and HFD), and HFD+NaCl group (water containing 2 mM NaCl and HFD). During the experiment, body weight was monitored and glucolipid metabolism was evaluated. The mechanism underlying the effects of nitrate on HFD-induced obesity was investigated by the following: the NO3--NO2--NO pathway; endothelial NO synthase (eNOS) and cyclic guanosine monophosphate (cGMP) levels; gut microbiota via 16SRNA analysis.
Results
Dietary nitrate reduced the body weight gain and lipid accumulation in adipose and liver tissues in HFD-fed mice. Hyperlipidemia and insulin resistance caused by HFD were improved in mice supplemented with nitrate. The level of eNOS was upregulated by nitrate in the serum, liver, and inguinal adipose tissue. Nitrate, nitrite, and cGMP levels were decreased in mice fed on HFD but reversed in the HFD+NaNO3 group. Nitrate also rebalanced the colon microbiota and promoted a normal gut microbiome profile by partially attenuating the impacts of HFD. Bacteroidales S24-7, Alistipes, Lactobacillus, and Ruminococcaceae abundances were altered, and Bacteroidales S24-7 and Alistipes abundances were higher in the HFD+NaNO3 group than that in the HFD group.
Conclusions
Inorganic dietary nitrate alleviated HFD-induced obesity and ameliorated disrupted glucolipid metabolism via NO3--NO2--NO pathway activation and gut microbiome modulation.
Keywords: nitrate, obesity, microbiology, metabolic disorders
Significance of this study.
What is already known about this subject?
Inorganic nitrate is indispensable for preventing metabolic disorders and performs an essential role in reducing lipid accumulation and activating brown adipose tissue.
What are the new findings?
Dietary nitrate alleviates high-fat diet-induced obesity and ameliorates adipose deposition and hyperlipidemia, as well as glucose tolerance and insulin resistance via NO3--NO2--NO pathway and cyclic guanosine monophosphate activation in the viscera and gut microbiota dysbiosis rebalance.
How might these results change the focus of research or clinical practice?
The results indicate the physiological benefits of inorganic nitrate with respect to obesity prevention and a novel mechanism of gut microbiota modulation by inorganic nitrate, implying a salutary effect on body health.
Introduction
Obesity is a major epidemic worldwide, and its prevalence is increasing.1 2 The number of overweight (body mass index (BMI)≥25 kg/m2) and obese (BMI≥30 kg/m2) individuals is approximately 2.1 billion based on a comprehensive review in children and adults during 1980–2013.3 Obesity is associated with a high risk of metabolic diseases, including cardiovascular diseases and diabetes, and overcoming obesity is expected to be quite challenging.4
Obesity originates from multiple factors including behavioral, environmental, and genetic factors.5 Consequently, the occurrence of metabolic disorders leads to systemic inflammation, causing multiphysiological function imbalances including those in the intestinal microecology.6 Nevertheless, we still have limited knowledge regarding the cause and pathogenesis of obesity. Unhealthy lifestyle also plays key role in the development of obesity, owing to excessive energy intake and insufficient exercise. Additionally, the gut microbiota has been shown to modulate obesity, although the causal relationship is unclear.7
Current studies on strategies to prevent obesity are multifaceted including dietary management: increasing vegetable intake and supplementation with prebiotics, which target the gut microbiology.8 Notably, green leafy vegetables are rich in inorganic nitrate.9 Dietary nitrate serves as a non-classical source of nitric oxide under conditions of hypoxia and ischemia. The nitrate-nitrite-nitric oxide pathway plays a vital role in maintaining the physiology, such as protecting the gastrointestinal tract and the cardiovascular system, regulating glucose/lipid metabolism, maintaining gut microbiome hemostasis, and alleviating senility. Additionally, nitrate has been shown to have important functional effects in metabolic syndrome. For example, previous studies have demonstrated more beneficial role of nitrate-rich beetroot juice rich in blood pressure reduction and endothelial function in young as well as older individuals and in cognitive improvement in type 2 diabetes relative to that of the nitrate-depleted juice.10 Nitric oxide (NO)/cyclic adenosine monophosphate (cAMP) signaling has also been shown to have potential applications in obesity prevention and treatment.11
Considering the versatile functions of nitrate in aging-related diseases and metabolic disorders, our group has evaluated the effects and beneficial effects of inorganic nitrate, including stomach mucosa protection in a stress-associated state and suppressing oxidative stress in response to total body irradiation.12 13 Moreover, nitrate has been shown to promote the transformation of white adipose tissue to brown adipose tissue via cyclic guanosine monophosphate (cGMP) signaling and mobilizing the mitochondria.14 However, the complicated relationships between nitrate and obesity and the roles of the microbiota in nitrate-dependent rebalancing of metabolism in mice are still unclear.
Accordingly, in this study, we aimed to investigate the effects of dietary nitrate on obesity and the gut microbiota in high-fat diet (HFD)-induced obesity in mice.
Research design and methods
Experimental animals and design
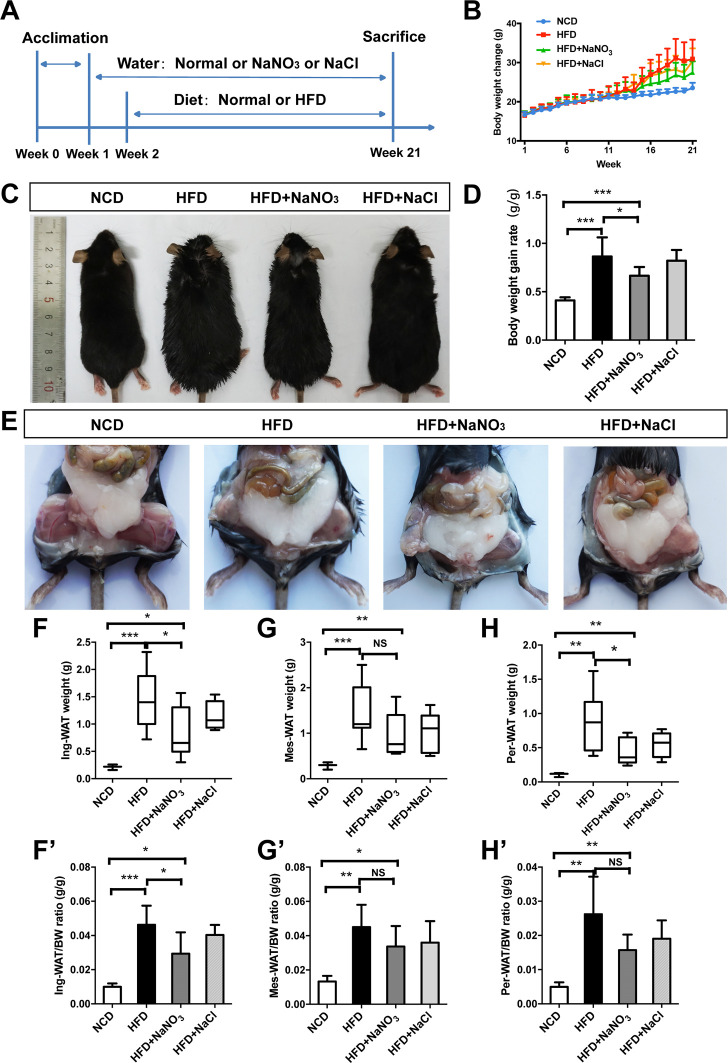
Female C57BL/6 mice (5 weeks of age), obtained from Beijing Vital River Laboratory Animal Technology (Beijing, China), were randomly divided into four groups (n=10/group), including the normal control diet (NCD) group (given normal water and a normal chow diet), the HFD group (given normal water and an HFD), the HFD+NaNO3 group (given water containing 2 mM NaNO3 and an HFD), the HFD+NaCl group (given water containing 2 mM NaCl and an HFD). In addition, administration of HFD+NaCl (isotonic saline) as an alternative control group. Inorganic nitrate or sodium chloride (Sigma, St. Louis, Missouri, USA) was dissolved in drinking water for administration. After acclimatization for 1 week, 2 mM NaNO3 water and 2 mM NaCl water were given to the appropriate groups. One week after water treatment, the other three groups (except for the NCD group) were converted to an HFD containing 45 kcal% fat (Research Diets) along with the appropriate drinking water for an additional 20 weeks. During the experiment, body weight (BW) was recorded weekly. At the end of the experiment, mice were euthanized, and samples were collected for subsequent tests. Photographs of the animals’ general appearances and abdominal adipose tissue were acquired at a vertical angle immediately after the animals were sacrificed. To avoid coprophagy, each animal was housed in one cage. The experiment schedule is detailed in figure 1A. The current study was approved by the Animal Care and Use Committee of Capital Medical University (approval no. AEEI-2016–064).
Figure 1.
Inorganic nitrate reduced body weight gain and adipose tissue weight. (A) The experimental process. After acclimation of mice to the new living environment for 1 week, drinking water was supplemented with 2 mM NaNO3 or 2 mM NaCl. One week after treatment via drinking water, mice were changed to a HFD (45 kcal%). Mice were then divided into four groups according to drinking and feeding treatments, which were administered for the next 20 weeks, as follows: the NCD group (given normal water and diet), the HFD group (given normal water and a HFD), the HFD+NaNO3 group (given water containing 2 mM NaNO3 and an HFD), and the HFD+NaCl group (given water containing 2 mM NaCl and an HFD). (B) The body weight was recorded every week and presented in the graph. (C) The general appearance of experimental mice at the end of the study. (D) The body weight gain rate was calculated after the experiment. (E) Photographs of abdominal adipose tissue taken after dissection. (F–H, F’–H’) Subcutaneous inguinal adipose tissue and visceral adipose tissue, including mesentery adipose and perirenal adipose tissue, were weighed, and the ratio of adipose weight to body weight was calculated. Values are presented as mean±SEM (n=10), *<0.05, **<0.01, ***p<0.001. BW, body weight; HFD, high-fat diet; NCD, normal control diet; NS, not significant.
Biochemical analysis
At end of the experiment, mice were fasting for 12 hours before blood sample collection. Blood from orbital venous stored in procoagulation tube was centrifuged at 3000 g for 15 min to obtain serum. The contents of serum total cholesterol (TC), triacylglycerol (TG), high-density lipoprotein (HDL), low-density lipoprotein (LDL), and blood glucose were quantified by automatic biochemical analyzer (AU5400TM, Olympus Optical, Japan). And insulin was measured by commercially ELISA kit (Invitrogen, USA).
Glucose tolerance and insulin resistance analysis
After HFD administration for 18 weeks, the intraperitoneal glucose tolerance test (IPGTT) was conducted. After 12 hours fast, mice were intraperitoneally injected D-glucose (1.5 g/kg), and then blood samples were obtained from tail vein and glucose contents were measured by a glucometer (Roche, Germany) at specified time points. After HFD administration for 19 weeks, the insulin tolerance test (ITT) was conducted. After 6 hour fast, mice were intraperitoneally injected insulin (0.75 UI/kg, Novo Nordisk), and blood glucose was measured as above at different time points. The homeostasis model index of insulin resistance (HOMA-IR) was calculated with serum fast blood glucose and insulin concentration as literature described.15
Histological analysis, immunohistochemistry, and immunofluorescence tests
After mice were sacrificed, histological anatomy was operated and subcutaneous adipose tissue (inguinal) as well as visceral adipose tissue (mesenteric and perirenal) were obtained for weighing. Both weight of adipose tissue (g) and normalized weight to BW (g/g) were shown. For histological analysis, inguinal adipose tissue and liver obtained were fixed in 4% paraformaldehyde. Paraffin embedded specimens were sectioned at 5 µm. H&E staining was performed under standard protocol.16 The size of adipocytes was measured by using Image-Pro Plus 6.0 program (Media Cybernetics, Rockville, Maryland, USA). The hepatic steatosis was analyzed using point-counting method. A test system of 36 points was used to calculate ration of the fat vesicles hitting points compared with total points. The immunohistochemistry tests were done using paraffin sections under standard procedure; first antibody was incubated as antiendogenous nitric oxide synthase (eNOS, 1:1000, ab76198, Abcam, USA) overnight, and the second anti-body (1:1000, ab97035, Abcam, USA) was incubated for 1 hour. At least five fields in three different sections were calculated to summarize the eNOS positive area, which was analyzed by Image-Pro Plus 6.0 program. Immunofluorescence tests were done after colon samples fixed in 4% neutral-buffered formalin and blocked with 5% bovine serum albumin for 20 min. The primary anti-eNOS antibody (as listed above) was incubated for 1 hour at room temperature. Then samples were incubated with secondary antibody (1:500, Alexa Fluor 488, 150073, Abcam) and nuclei were counterstained with DAPI (1002339028, Sigma-Aldrich). At least three sections from six different animals and five different fields in each section were calculated using confocal system and a digital camera (SP8, Leica).
Nitrate, nitrite, and cGMP level determination
At end of the experiment, serum, liver, inguinal adipose, and colon epithelium as well as feces from lower colon were obtained and homogenized to collect supernatant. Before assay, samples were 10 000 MW filtered and diluted. Total Nitric Oxide and Nitrate/Nitrite Parameter Assay Kit (KGE001, R&D, USA) was used to determine the concentration of nitrate and nitrite in colon epithelia and feces respectively as directed procedure. The cGMP level was detected under standard procedure (ab133052, Abcam, USA). Samples and standards were added to 96-wells plates. Then, prepared labeled AP-conjugate and Cyclic GMP Complete antibody were added. Thereafter, pNpp substrate was added and incubated. The level of cGMP was detected.
Western blot test
The protein was extracted using a protein extraction kit (Thermo Fisher Scientific, China) and was quantified using BCA Protein Assay Kit (Applygen, Beijing, China). Proteins were separated during sodium dodecyl sulfate-polyacrylamide gel electrophoresis and then transferred to a polyvinylidene fluoride membrane. First antibodies as eNOS (1:500, ab76198, Abcam, USA) were incubated overnight, and then second antibody (1:1000, ab97035, Abcam, USA) was incubated for 1 hour at room temperature. Three times of replicated tests were done to ensure the expression of protein.
Quantitative real-time PCR
To assess the inflammatory markers, the gene expression of inducible nitric oxide synthase (iNOS) in intestinal epithelial and gene expression in adipose tissue including TNF-α, interleukin 6, adiponectin were evaluated. Total RNA was extracted and cDNA was synthesized by the kit (Tiangen biotech, China). The specific primers and SYBR green reagent were used to conduct real-time PCR on the Applied Biosystems. The gene expression of actin was used to normalize the raw quantifications and analyzed by method of 2-△△CT. The fold changes of each gene were shown as mean±SD.
Gut microbiota analysis
To analyze gut microbiota, feces from lower colon were obtained through anatomic dissection and stored in −80 °C for further assay. Twenty-two samples of feces were analyzed, including six samples from normal mice (NCD group), eight from HFD mice (HFD group) and eight from mice fed HFD with nitrate supplementation (HFD+NaNO3 group).
The genomic DNA of feces samples was extracted and determined qualified. 16SRNA gene of bacterial was amplified through PCR followed by specific primer with barcode synthesized according to sequence area. The extracted genomic DNA was detected in 1% agarose gel electrophoresis and amplified using TransGen AP221-02. The V3-V4 region of the bacterial 16S rRNA gene was amplified by PCR. The primers were listed as 341F (5’-CCTAYGGGRBGCASCAG-3’) and 806R (5’-GGACTACNNGGGTATCTAAT-3’) with Primer amplification length of 465 bp. The PCR procedure was presented as (1) denaturation at 94°C for 4 min; (2) 25 cycles of denaturation at 94°C for 45 s; (3) annealing at 55°C for 50 s; (4) extension at 72°C for 45 s; (5) extension at 72°C for 10 min. All experimental samples were triplicated and 50 000 sequences were in one sample. After PCR products were tested by electrophoresis and quantified by QuantiFluor-ST system, an Illumina PE250 library was constructed. 16SRNA detection was performed on Illumina PE250 platform at Biozeron (Shanghai, China). Operational taxonomic units (OTUs) were the base units in the analyses of 16SRNA and generated by UPARSE using the GOLD database. The alpha test was also known as the within-habitat diversity test, used to calculate the community richness or diversity. The relative abundance of dominant bacteria was made among all three groups using R language and Barplot function.
The Illumina sequencing procedure was first fixed one side of the DNA fragment, which is complementary with the primer to the gene chip. Second, fix the other side of DNA fragment which is complementary with another primer. Then, after amplification, the DNA amplifiers are linearized into single strands. Add the DNA polymerase and dNTP with four fluorescent markers and read the type of nucleotides that are added to each template sequence using laser scanning. The fluorescent group and the terminating group are chemically cut. Finally, the sequence of template DNA fragments was obtained by counting the fluorescence signal.
Principal co-ordinates analysis was a visualization method for studying similarities or differences among different groups. LDA effect size (LEfSe) analysis was based on nonparametric factorial Kruskal-Wallis (KW) sum-rank test to find specific bacteria. Statistical analysis of metagenomic profile (STAMP) analyses were using Fisher’s exact test, Welch’s t-test or ANOVA to compare the differential bacteria among multiple groups. To analyze the changes in specific bacterial groups, Benjamini-Hochberg method was done. The threshold abundance for significant presence of microbiota was above 1.
Statistical analysis
The sample collection and data analysis were done by different members according to double blind principle. Results was presented as mean±SE of the mean (SEM),<0.05(*),<0.01(**) and p<0.001(***) were considered significant, and NS for not significant. Statistical analysis was performed using SPSS 19.0. Two-way ANOVA was used to compare the difference between groups with normal distribution and equal variances data (Shapiro-Wilk test was performed); then, Bonferroni post-tests were used to compare replicate means by row. Nonparametric test (KW test and Mann-Whitney U test) were used for non-normal distribution data or unequal variance data.
Results
Inorganic nitrate reduced BW gain and adipose tissue weight
Photographs of animals captured at the end of the experiment showed that the mice in the HFD and HFD+NaCl groups were clearly larger than those in the NCD and HFD+NaNO3 groups (figure 1C). BW was recorded every week (figure 1B), and the rate of weight gain was calculated after the experiment. HFD induced obesity in mice, as characterized by a higher rate of BW gain compared with that in mice fed a normal chow diet. However, supplementation with NaNO3 reduced BW gain in HFD mice (figure 1D). Subcutaneous inguinal and visceral adipose tissues, including mesentery and perirenal adipose tissues, were collected and weighed after dissection (figure 1E); tissue weight was significantly decreased in the HFD+NaNO3 group relative to that in the HFD group (figure 1F–H). Similar results were observed with respect to the ratio of white adipose tissue to BW (figure 1F–H). Supplementation with NaCl did not affect BW gain or adipose weight. Water consumption was not significantly different among the groups (online supplementary figure 1).
bmjdrc-2020-001255supp001.pdf (1.2MB, pdf)
Amelioration of glucose tolerance and insulin resistance by nitrate
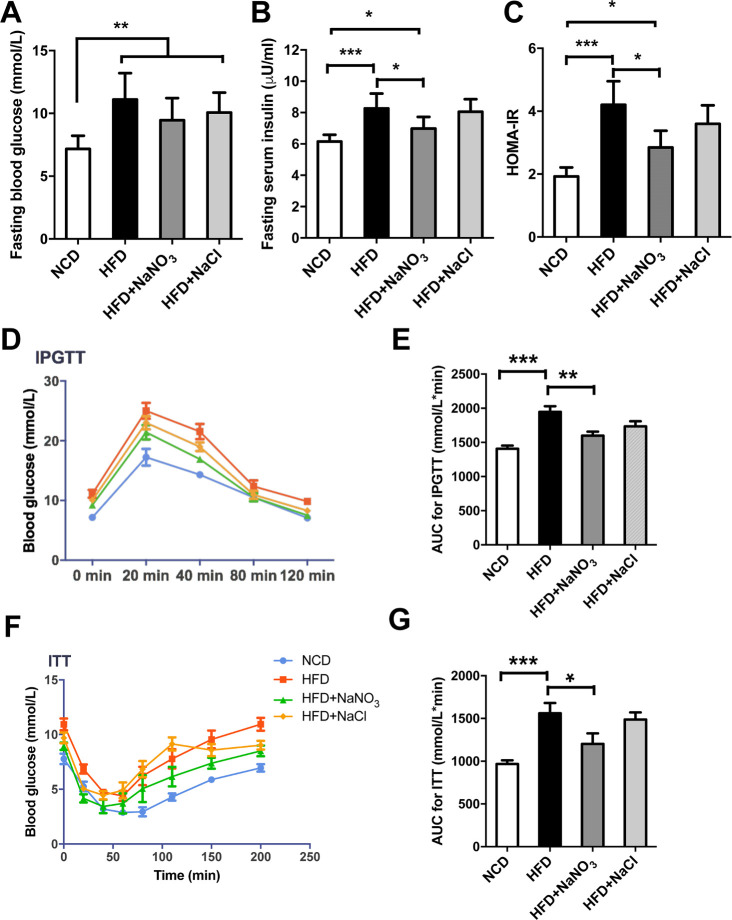
Fasting blood glucose and insulin were measured at the end of the experiment. Mice in the HFD group were hyperglycemic and hyperinsulinemia. Supplementation with NaNO3 reduced HFD-induced hyperglycemia, as expected, although the difference was not statistically significant (figure 2A). However, hyperinsulinemia was significantly reversed by supplementation of drinking water with NaNO3 (figure 2B). Based on the HOMA-IR, nitrate ameliorated the insulin resistance caused by HFD-induced metabolic disorder (figure 2C). Furthermore, the results of IPGTTs and ITTs showed the ability of nitrate to improve glucose tolerance and insulin sensitivity (figure 2D–G).
Figure 2.
Inorganic nitrate ameliorated glucose tolerance and insulin resistance. (A) Fasting blood glucose at the end of the experiment. (B) Fasting serum insulin at the end of the experiment. (C) HOMA-IR indexes were calculated according to fasting blood glucose and insulin levels. (D) IPGTTs were conducted after HFD feeding for 18 weeks. Blood glucose levels were tested at the specified time points. (E) Curve areas for IPGTTs are presented in the column graph. (F) ITTs were conducted after HFD feeding for 19 weeks. Blood glucose levels were tested at specified time points. (G) Curve areas for ITTs are presented in the column graph. Values are presented as mean±SEM (n=10), *<0.05, **<0.01, ***p<0.001. AUC, area under the curve; HFD, high-fat diet; HOMA-IR, homeostasis model index of insulin resistance; IPGTT, intraperitoneal glucose tolerance test; ITT, insulin tolerance test; NCD, normal control diet.
Nitrate-mediated alleviation of dyslipidemia and lipid accumulation
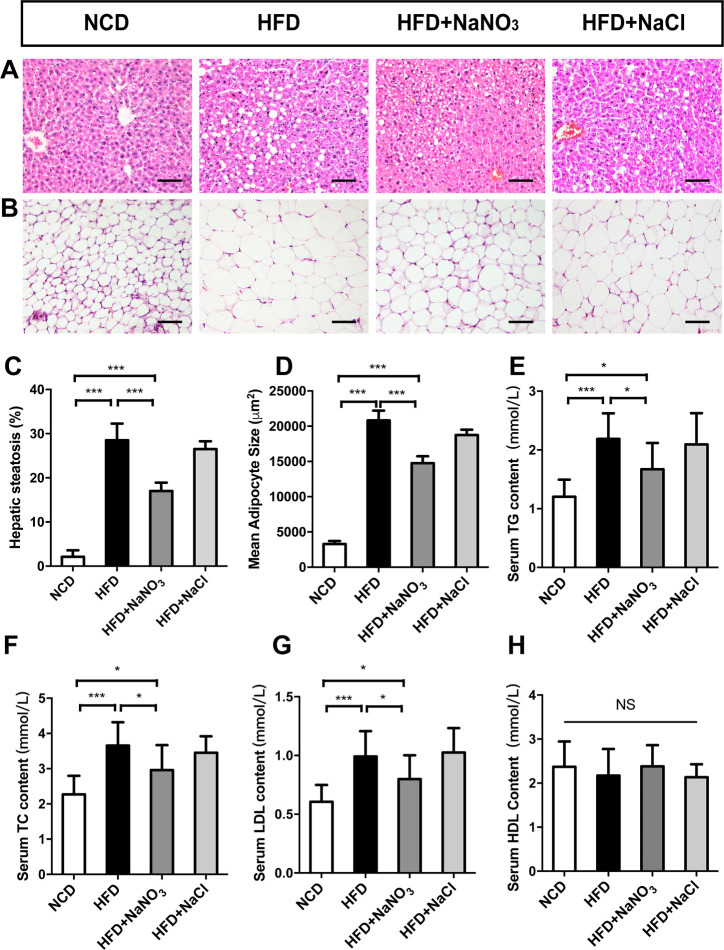
Serum biochemistry tests showed that TG, TC, and LDL levels were increased in the HFD group (figure 3E–H) and decreased in the HFD+NaNO3 group. No difference in HDL levels was found among the groups. After dissection of the mice at end of the experiment, liver tissue and inguinal fat tissue were collected for H&E staining and histological observation (figure 3A, B). Liver tissue in the HFD group contained more and larger vacuoles than that in the HFD+NaNO3 group. Point-counting results showed severe hepatic steatosis in the HFD group; however, hepatic steatosis was less severe in the HFD+NaNO3 mice (figure 3C). The mean adipocyte size was much greater in the HFD group than that in the NCD group. Nitrate supplementation significantly decreased the mean adipocyte size (figure 3D). The histological and biochemical phenotypes in mice in the HFD+NaCl group were similar to those in mice in the HFD group.
Figure 3.
Inorganic nitrate alleviated dyslipidemia and lipid accumulation. (A) Liver slices with H&E staining were prepared for histological observation. (B) Sizes of adipocytes from inguinal adipose tissue. (C) Point-counting for hepatic steatosis. (D) The mean sizes of adipocytes were analyzed using Image-Pro Plus 6.0. (E–H) Blood biochemical analysis at the end of the experiment. Values are presented as mean±SEM (n=7), *<0.05, **<0.01, ***p<0.001. Scale bar: 100 µm. HDL, high-density lipoprotein; HFD, high-fat diet; LDL, low-density lipoprotein; NCD, normal control diet; TC, total cholesterol; TG, triacylglycerol; NS, not significant.
Inorganic nitrate upregulated the NO3--NO2--NO pathway in the liver, inguinal adipose tissue, and gut epithelium
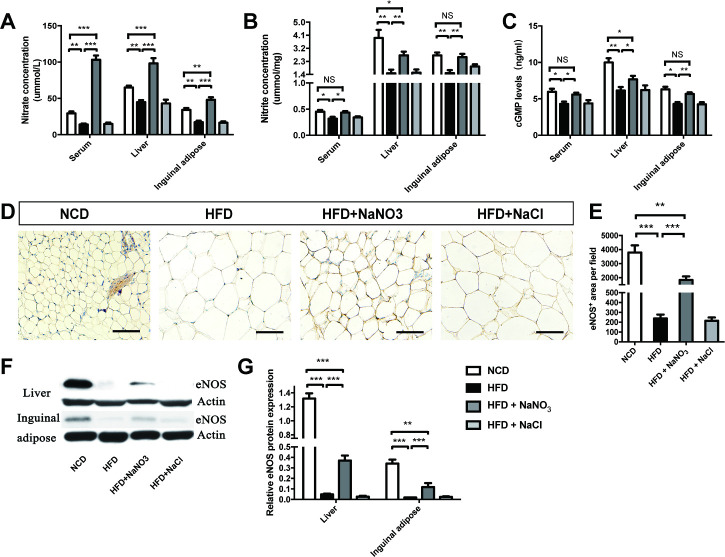
The concentrations of nitrate and nitrite in the serum, liver, and inguinal adipose tissue were assayed and found to be lower in the HFD group than that in the NCD group. The HFD+NaNO3 group had the highest nitrate concentration, and the nitrite concentrations in this group were lower than those in the NCD group but higher than those in the HFD group (figure 4A, B). The serum, liver, and inguinal adipose tissue levels of cGMP, which increases the activity of the NO pathway, were higher per unit protein in the HFD+NaNO3 group than that in the HFD group (figure 4C). Furthermore, quantitative immunohistochemical analysis of inguinal tissue revealed that inorganic nitrate reversed the HFD-induced decrease in eNOS expression. Western blot analysis of eNOS in the liver and inguinal adipose tissue showed similar results (figure 4D–G).
Figure 4.
Inorganic nitrate activated the NO3--NO2--NO pathway in liver and inguinal adipose tissues. (A, B) Nitrate and nitrite contents in the serum, liver, and inguinal adipose tissues were detected. (C) cGMP levels in the serum, liver, and inguinal adipose tissues were tested. (D) The expression of eNOS was determined by immunohistochemistry of inguinal adipose tissues. (E) The eNOS-positive area on inguinal adipose tissue slices was analyzed using Image-Pro Plus 6.0. (F) eNOS expression in the liver and inguinal tissues was evaluated by western blotting. (G) Relative eNOS expression, as determined by western blotting, was analyzed using Image-Pro Plus 6.0. Values are presented as mean±SEM (n=7), *<0.05, **<0.01, ***p<0.001. Scale bar: 100 µm. cGMP, cyclic guanosine monophosphate; eNOS, endothelial NO synthase; HFD, high-fat diet; NCD, normal control diet; NS, not significant.
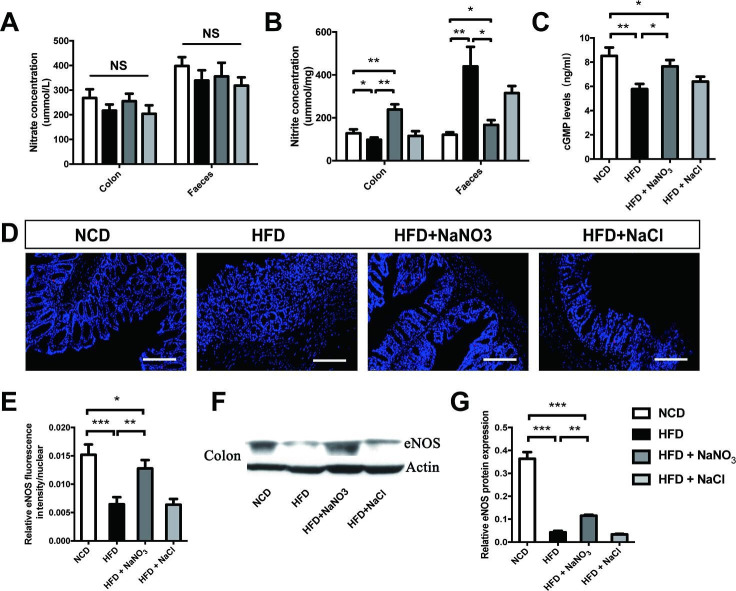
To explore the effects of nitrate on gut ecology, colon tissue and fecal samples were collected. There were no differences in nitrate levels in the colon epithelium or feces among groups, and nitrite levels were highest in the epithelium in the HFD+NaNO3 group and in the feces in the HFD group (figure 5A, B). iNOS is one of the inflammatory markers and it is overexpressed in HFD induced obesity. Therefore, presumably, the high levels of nitrite in the feces of animals in HFD group were the results of endogenous nitrite generated from the oxidation of iNOS-derived NO (online supplementary figure 1D). In addition, cGMP levels in the colon epithelium were higher in HFD + NaNO3 mice than those in HFD mice (figure 5C). Colon tissue immunofluorescence and western blotting revealed that the decreased eNOS expression observed in the colon epithelium in response to the HFD was partially reversed by nitrate supplementation (figure 5D–G).
Figure 5.
Inorganic nitrate activated the NO3--NO2--NO pathway in the gut epithelium. (A) Nitrate levels in the colon epithelium and feces. (B) Nitrite levels in the colon and feces. (C) cGMP levels in the colon epithelium. (D) Expression of eNOS in the colon epithelium, as determined by immunofluorescence. (E) Relative fluorescence intensity of eNOS. (F) Western blotting was used to evaluate eNOS expression in the colon epithelium. (G) Relative eNOS protein expression according to fluorescence analysis. Values are presented as mean±SEM (n=7), *<0.05, **<0.01, ***p<0.001. Scale bar: 100 µm. cGMP, cyclic guanosine monophosphate; eNOS, endothelial NO synthase; HFD, high-fat diet; NCD, normal control diet; NS, not significant.
Inorganic nitrate altered the relative abundance of specific gut bacterial genera
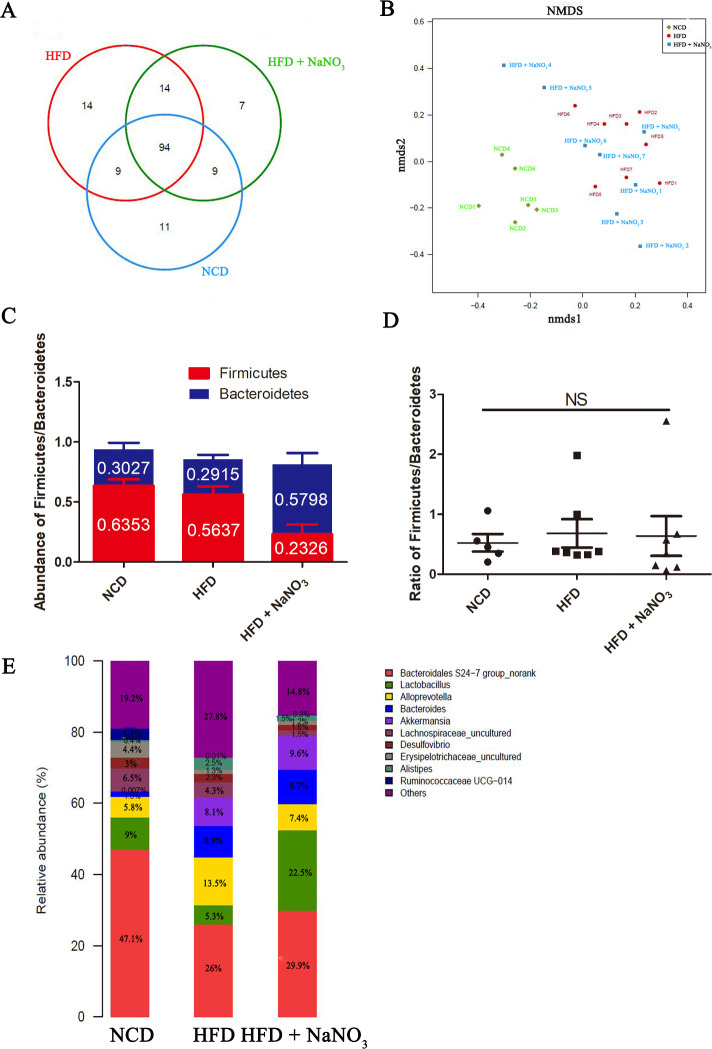
Gut microbiome samples were analyzed using rarefaction and rank-abundance curves (online supplementary figure 2D, E). Unique and common OTUs were detected at the genus level and listed in figure 6A. Fourteen unique bacteria were noted in the HFD group, whereas 7 were noted in the HFD+NaNO3 group and 11 were found in the NCD group, indicating that HFD and nitrate altered the gut microbiome. However, no significant differences in alpha-diversity were noted among the three experimental groups (online supplementary figure 2A–C). Nonmetric multidimensional scaling indicated that the gut microbiomes in both the HFD and HFD+NaNO3 groups differed from those in the NCD group. The bacterial community in the HFD+NaNO3 group appeared to be closer to that in the NCD group (figure 6B), as also indicated by three-dimensional principal component analysis (online supplementary figure 3).
Figure 6.
Inorganic nitrate altered the relative abundances of the specific gut bacterial genus. (A) Numbers of unique and shared bacteria at the genus level. (B) NMDS analysis of the distribution of the gut microbiome among the three groups. (C) The average abundance of Firmicutes and Bacteroidetes at the phylum level in each group. (D) The ratio of Firmicutes to Bacteroidetes in different groups. (E) Top 10 abundant bacteria at the genus level in each group. HFD, high-fat diet; NCD, normal control diet; NMDS, nonmetric multidimensional scaling; NS, not significant.
The ratio of Firmicutes to Bacteroidetes related to metabolic disorder is used to assess the intestinal and systemic health. However, in our study, there was no significant variation among groups (figure 6C, D). Bacteria with the highest abundances at the genus level were Bacteroidales S24-7 group, Lactobacillus, Alloprevotella, Bacteroides, Akkermansia, Lachnospiraceae, Desulfovibrio, Erysipelotrichaceae, Alistipes, and Ruminococcaceae Ugg-014 (figure 6E). Based on our results, Bacteroidales S24-7 group, Lactobacillus, Lachnospiraceae, Desulfovibrio, Erysipelotrichaceae, and Ruminococcaceae Ugg-014 were decreased in the HFD group compared with those in the NCD group, the exception being Alloprevotella, Bacteroides, and Alistipes, which were increased in the HFD group. Nitrate partially rebalanced the HFD-induced alterations in the gut microbiome. Specifically, the abundances of Bacteroidales S24-7 group and Alloprevotella were decreased in the HFD group and increased in the HFD+NaNO3 group. Moreover, the abundances of Alistipes and Lactobacillus were increased after nitrate supplementation (figure 6E).
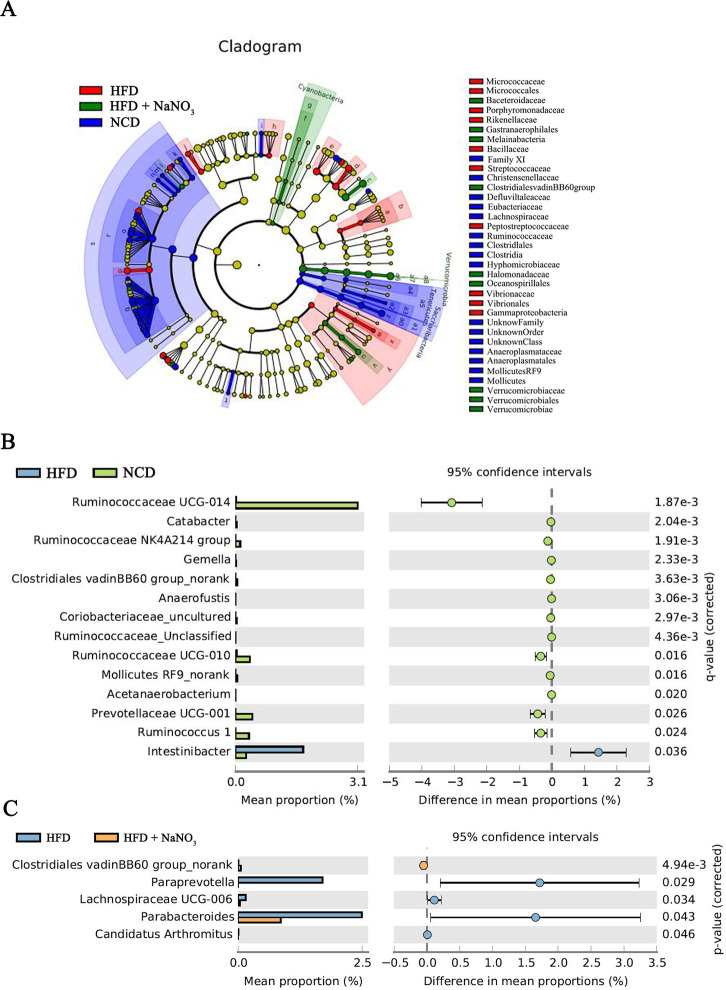
The cladograms for the differential colon bacteria in the NCD, HFD, and HFD+NaNO3 groups were prepared using nonparametric factorial KW sum-rank tests to detect significant microbiota influencing variation among the groups. Verrucomicrobiaceae, Oceanospirillales, and Halomonadaceae were specifically identified in the HFD+NaNO3 group (figure 7A).
Figure 7.
Differential bacteria among groups. (A) Cladograms for differential colon bacteria in three groups were determined using nonparametric factorial KW sum-rank tests. (B, C) Differential bacteria between the HFD and NCD groups and between the HFD and HFD+NaNO3 groups using STAMP analyses at the genus level. HFD, high-fat diet; KW, Kruskal-Wallis; NCD, normal control diet; STAMP, statistical analysis of metagenomic profiles.
Differential bacteria between the NCD and HFD groups or HFD and HFD+NaNO3 groups are presented in figure 7B, C using STAMP analyses at the genus level. The abundance of Clostridiales_vadinBB60_group was increased in both the NCD and HFD+NaNO3 groups compared with that in the HFD group. Relative to their abundances in the HFD group, Ruminococcaceae UCG-014, Catabacter, Ruminococcaceae NK4A214, Gemella, Anaerofustis, Coriobacteriaceae_uncultured, Ruminococcaceae unclassified, Ruminococcaceae UCG-010, Mollicutes RF9_norank, Acetanaerobacterium, Prevotellaceae UCG-001, and Ruminococcus 1 were present at increased abundance in the NCD group, whereas Intestinibacter was present at decreased abundance (figure 7B). Further, relative to their abundances in the HFD+NaNO3 group, Paraprevotella, Lachnospiraceae UCD-006, Parabacteroides, and Candidatus arthromitus were present at increased abundance in the HFD group, whereas Clostridiales vadinBB60 was present at decreased abundance (figure 7C). Additionally, LEfSe analysis based on nonparametric factorial KW sum-rank tests showed specific differential bacteria (online supplementary figure 4), similar to the results of STAMP analyses.
Discussion
In this study, we confirmed the effects of inorganic nitrate at reducing BW gain and regulating glycolipid metabolism. Moreover, dysbiosis of the gut microbiome induced by HFD was ameliorated to some extent by inorganic nitrate supplementation. Our results highlighted the potential mechanisms through which dietary nitrate prevented obesity, that is, through activating the NO signaling pathway and rebalancing the gut microbiota.
Obesity, characterized by impaired gut microbiome and inhibition of the NO3--NO2--NO pathway,17 18 influences glucose tolerance and insulin resistance but also exerts effects on other systemic disorders, such as cardiovascular disease; thus, although challenging, research into the underlying mechanisms of obesity is essential.19 Decreased nitric oxide bioactivity and impaired nitrate-nitrite-NO signaling could contribute to obesity and diabetes.20–22 Current research has demonstrated that nitrate exerts antiobesity and antidiabetic effects in metabolic syndrome.22 The expression of thermogenic genes in brown adipose tissue and of brown adipocyte-specific genes in white adipose tissue was increased by inorganic nitrate.14 Activation of the nitrate-nitrite-NO pathway and increased cGMP levels could subsequently upregulate the expression of cGMP-dependent protein kinase G type 1 and brown adipocyte-specific genes, leading to the browning of white adipose tissue.14 23 Our results verified the antiobesity effects of dietary nitrate in the context of HFD-induced obesity. In addition, administration of HFD+NaCl group as an isotonic saline (an alternative control) caused moderate variations in some parameters such as adipose tissue weight. However, most of these variations were minor, and thus we primarily focused on the effect of nitrate administration. Nevertheless, the effects of NaCl, which may be ascribed to the changes in microecology in response to the osmotic pressure of the solution, require further exploration.
Obesity is a complex disease associated with chronic inflammation, oxidative stress, and deregulated glucose and lipid metabolism.24 Furthermore, it has been widely reported that obesity accompanied by a state of systemic low-grade inflammation and local cytokine infiltration induces abnormal glucose tolerance and insulin resistance. Our results verified that inflammatory cytokines were downregulated in the adipose tissue and that glucose intolerance and insulin resistance were partially reversed by nitrate administration (online supplementary figure 1A–C). Additionally, our group had previously reported that dietary nitrate decreased oxidative stress in irradiation-induced systemic (total body) injury.12 Dietary nitrate activated the nitrate-nitrite-NO pathway and subsequently upregulated AMP-activated protein kinase signaling and reduced NOX-derived oxidative stress.11 The antioxidative effect of dietary nitrate also implies a promising treatment for obesity. Moreover, our previous study showed that dietary nitrate could increase the microvascular density in dextran sulfate sodium salt (DSS)-induced colonic injury. Therefore, improving intestinal blood flow by dietary nitrate could be one of the alternative mechanisms underlying the changes in the colonic microenvironment.25 However, in this study, we primarily focused on the potential effects of dietary nitrate on modulating the gut microbiome.
The gut microbiota can modulate host signaling pathways to regulate energy storage and thus may have vital roles in the development of obesity,26 diabetes, and cardiovascular disease.27 28 The gut microbiome is also essential for processing dietary polysaccharides.29 In our study, the gut microbiome was influenced by both HFD and nitrate, which altered the gut flora significantly, with nitrate supplementation having beneficial regulatory effects on microbial metabolism.
Our bar graphs of the bacterial communities at the genus level showed the beneficial effects of nitrate supplementation on the gut microbiome. Nitrate significantly increased the abundances of Bacteroidales S24-7, Alistipes, and Lactobacillus compared with those in the HFD group. Hugan Qingzhi tablet, a traditional Chinese medicine, has been reported to protect against HFD-induced nonalcoholic fatty liver disease by increasing Ruminococcaceae, Bacteroidales S24-7, and Alistipes abundances,30 similar to our current results. The abundance of Alloprevotella, which is involved in dietary-derived and saliva-derived nitrate production, was increased in our HFD group, but was decreased by nitrate supplementation.31 32 Lactobacilli, a probiotic bacterium whose abundances were markedly increased in our HFD+NaNO3 group, reportedly exerts health benefits for treating HFD-induced obesity in mice (by combining ultrasound and lactobacilli treatment for HFD-induced obesity in mice).
Notably, a high-starch diet, together with high-dose acarbose, results in increased abundances of Bacteroidaceae and Bifidobacteriaceae.33 Butyrate, which promotes short-chain fatty acid production and overall health, is associated with Firmicutes, specifically Clostridium leptum.34
In this study, we detected differences in bacteria between the NCD and HFD groups or between HFD and HFD+NaNO3 groups using STAMP analyses. The abundance of Clostridiales_vadinBB60_group, which was positively related to the BW of newborn piglets,35 was also increased in low-fat diet-fed mice compared with that in HFD-fed mice36 and in both NCD and HFD+NaNO3 groups in our study. Ruminococcaceae, which have strong fiber-degradation capability,37 were enriched in the NCD group, but decreased in the HFD group, indicating decreased fiber degrading activity. Patients with type 2 diabetes treated with metformin showed decreased abundance of Intestinibacter by shotgun sequencing-based metagenomic analysis,38 39 verifying the dysregulation of the gut microbiome in the HFD group.
In a mouse model of β-lactoglobulin-induced allergy, the abundance of Lachnospiraceae UCG-006 was found to be reduced after Lactobacillus treatment, indicating its harmful role in allergies.40 The duodenal endoluminal sleeve could reduce BW partially by altering the gut microbiota; this also included decreasing the abundance of Paraprevotella family members.41 However, the abundance of Parabacteroides was decreased in the HFD+NaNO3 group compared with that in the HFD group and was reported to be increased in mice treated with resveratrol.37 The beneficial effects of nitrate are complex, and treatment with nitrate could alter the composition of the gut microbiome.
In conclusion, in this study, dietary nitrate efficiently reduced HFD-induced obesity in mice and exerted regulatory effects on the gut microbiome. However, the salutary biological effects of inorganic nitrate are complex. The relationships between the gut microbiota and glucolipid metabolism demonstrated herein implied that inorganic nitrate plays a vital role in alleviating HFD-induced obesity.
Acknowledgments
Data on the animal experiments have been contributed by researchers who were listed as authors in this manuscript. Data on the gut microbiota 16SRNA detection and analysis have been contributed by Shanghai Biozeron Biotechnology Co., Ltd.
Footnotes
Contributors: SW designed the experiment. LM performed most of the experiment. LH, LJ, JiaW, XL, WW, and SC contributed to the samples and data collection. Data were analyzed by LM, LH, and SW. LM and SW wrote this manuscript.
Funding: This study was supported by grants from the National Natural Science Foundation of China (91649124; 81400527 to SW); the 2016 QNRC001 Young Elite Scientist Sponsorship Program by CAST (2016 QNRC001); Chinese Academy of Medical Sciences (CAMS Innovation Fund for Medical Sciences 2019-12M-5-031); Beijing Municipal Science & Technology Commission No. Z181100001718208; Beijing Municipal Education Commission No. 119207020201; Beijing Municipality Government grants (Beijing Scholar Program- PXM2018_014226_000021; PXM2018_193312_000006_0028S643_FCG; PXM2017_014226_000023; SML20151401).
Competing interests: None declared.
Patient consent for publication: Not required.
Ethics approval: The current study was approved by the Animal Care and Use Committee of Capital Medical University (approval no. AEEI-2016-064). There was no human experiment in the study and patient informed consent was not required.
Provenance and peer review: Not commissioned; externally peer reviewed.
Data availability statement: Data are available in a public, open access repository. All data relevant to the study are included in the article or uploaded as supplementary information.
References
- 1.Lavie CJ, Deedwania P, Ortega FB. Obesity is rarely healthy. Lancet Diabetes Endocrinol 2018;6:678–9. 10.1016/S2213-8587(18)30143-8 [DOI] [PubMed] [Google Scholar]
- 2.Jaacks LM, Vandevijvere S, Pan A, et al. The obesity transition: stages of the global epidemic. Lancet Diabetes Endocrinol 2019;7:231–40. 10.1016/S2213-8587(19)30026-9 [DOI] [PMC free article] [PubMed] [Google Scholar]
- 3.Ng M, Fleming T, Robinson M, et al. Global, regional, and national prevalence of overweight and obesity in children and adults during 1980-2013: a systematic analysis for the global burden of disease study 2013. Lancet 2014;384:766–81. 10.1016/S0140-6736(14)60460-8 [DOI] [PMC free article] [PubMed] [Google Scholar]
- 4.Boateng D, Galbete C, Nicolaou M, et al. Dietary patterns are associated with predicted 10-year risk of cardiovascular disease among Ghanaian populations: the research on obesity and diabetes in African migrants (RODAM) study. J Nutr 2019;149:755–69. 10.1093/jn/nxz002 [DOI] [PMC free article] [PubMed] [Google Scholar]
- 5.Franks PW, Atabaki-Pasdar N. Causal inference in obesity research. J Intern Med 2017;281:222–32. 10.1111/joim.12577 [DOI] [PubMed] [Google Scholar]
- 6.Hills AP, Okely AD, Baur LA. Addressing childhood obesity through increased physical activity. Nat Rev Endocrinol 2010;6:543–9. 10.1038/nrendo.2010.133 [DOI] [PubMed] [Google Scholar]
- 7.Lone JB, Koh WY, Parray HA, et al. Gut microbiome: microflora association with obesity and obesity-related comorbidities. Microb Pathog 2018;124:266–71. 10.1016/j.micpath.2018.08.036 [DOI] [PubMed] [Google Scholar]
- 8.Fock KM, Khoo J. Diet and exercise in management of obesity and overweight. J Gastroenterol Hepatol 2013;28 Suppl 4:59–63. 10.1111/jgh.12407 [DOI] [PubMed] [Google Scholar]
- 9.Ma L, Hu L, Feng X, et al. Nitrate and nitrite in health and disease. Aging Dis 2018;9:938–45. 10.14336/AD.2017.1207 [DOI] [PMC free article] [PubMed] [Google Scholar]
- 10.Gilchrist M, Winyard PG, Fulford J, et al. Dietary nitrate supplementation improves reaction time in type 2 diabetes: development and application of a novel nitrate-depleted beetroot juice placebo. Nitric Oxide 2014;40:67–74. 10.1016/j.niox.2014.05.003 [DOI] [PubMed] [Google Scholar]
- 11.Cordero-Herrera I, Kozyra M, Zhuge Z, et al. Amp-Activated protein kinase activation and NADPH oxidase inhibition by inorganic nitrate and nitrite prevent liver steatosis. Proc Natl Acad Sci U S A 2019;116:217–26. 10.1073/pnas.1809406115 [DOI] [PMC free article] [PubMed] [Google Scholar]
- 12.Chang S, Hu L, Xu Y, et al. Inorganic nitrate alleviates total body irradiation-induced systemic damage by decreasing reactive oxygen species levels. Int J Radiat Oncol Biol Phys 2019;103:945–57. 10.1016/j.ijrobp.2018.11.021 [DOI] [PubMed] [Google Scholar]
- 13.Jin L, Qin L, Xia D, et al. Active secretion and protective effect of salivary nitrate against stress in human volunteers and rats. Free Radic Biol Med 2013;57:61–7. 10.1016/j.freeradbiomed.2012.12.015 [DOI] [PMC free article] [PubMed] [Google Scholar]
- 14.Roberts LD, Ashmore T, Kotwica AO, et al. Inorganic nitrate promotes the browning of white adipose tissue through the nitrate-nitrite-nitric oxide pathway. Diabetes 2015;64:471–84. 10.2337/db14-0496 [DOI] [PMC free article] [PubMed] [Google Scholar]
- 15.Xu P, Wang J, Hong F, et al. Melatonin prevents obesity through modulation of gut microbiota in mice. J Pineal Res 2017;62. 10.1111/jpi.12399. [Epub ahead of print: 10 Mar 2017]. [DOI] [PubMed] [Google Scholar]
- 16.Cardiff RD, Miller CH, Munn RJ. Manual hematoxylin and eosin staining of mouse tissue sections. Cold Spring Harb Protoc 2014;2014:pdb.prot073411–8. 10.1101/pdb.prot073411 [DOI] [PubMed] [Google Scholar]
- 17.Sharma V, Smolin J, Nayak J, et al. Mannose alters gut microbiome, prevents diet-induced obesity, and improves host metabolism. Cell Rep 2018;24:3087–98. 10.1016/j.celrep.2018.08.064 [DOI] [PMC free article] [PubMed] [Google Scholar]
- 18.Petrov VA, Saltykova IV, Zhukova IA, Alifirova VM, et al. Analysis of gut microbiota in patients with Parkinson's disease. Bull Exp Biol Med 2017;162:734–7. 10.1007/s10517-017-3700-7 [DOI] [PubMed] [Google Scholar]
- 19.Turtle JR. The economic burden of insulin resistance. Int J Clin Pract Suppl 2000;113:23–8. [PubMed] [Google Scholar]
- 20.Ohtake K, Nakano G, Ehara N, et al. Dietary nitrite supplementation improves insulin resistance in type 2 diabetic KKA(y) mice. Nitric Oxide 2015;44:31–8. 10.1016/j.niox.2014.11.009 [DOI] [PubMed] [Google Scholar]
- 21.Shimabukuro M, Higa N, Tagawa T, et al. Defects of vascular nitric oxide bioavailability in subjects with impaired glucose tolerance: a potential link to insulin resistance. Int J Cardiol 2013;167:298–300. 10.1016/j.ijcard.2012.09.194 [DOI] [PubMed] [Google Scholar]
- 22.Ghasemi A, Jeddi S. Anti-Obesity and anti-diabetic effects of nitrate and nitrite. Nitric Oxide 2017;70:9–24. 10.1016/j.niox.2017.08.003 [DOI] [PubMed] [Google Scholar]
- 23.Mitschke MM, Hoffmann LS, Gnad T, et al. Increased cGMP promotes healthy expansion and browning of white adipose tissue. Faseb J 2013;27:1621–30. 10.1096/fj.12-221580 [DOI] [PubMed] [Google Scholar]
- 24.Di Domenico M, Pinto F, Quagliuolo L, et al. The role of oxidative stress and hormones in controlling obesity. Front Endocrinol 2019;10:540. 10.3389/fendo.2019.00540 [DOI] [PMC free article] [PubMed] [Google Scholar]
- 25.Hu L, Jin L, Xia D, et al. Nitrate ameliorates dextran sodium sulfate-induced colitis by regulating the homeostasis of the intestinal microbiota. Free Radic Biol Med 2020;152:609-621. 10.1016/j.freeradbiomed.2019.12.002 [DOI] [PubMed] [Google Scholar]
- 26.Bäckhed F, Ding H, Wang T, et al. The gut microbiota as an environmental factor that regulates fat storage. Proc Natl Acad Sci U S A 2004;101:15718–23. 10.1073/pnas.0407076101 [DOI] [PMC free article] [PubMed] [Google Scholar]
- 27.Tang WHW, Hazen SL. The gut microbiome and its role in cardiovascular diseases. Circulation 2017;135:1008–10. 10.1161/CIRCULATIONAHA.116.024251 [DOI] [PMC free article] [PubMed] [Google Scholar]
- 28.John GK, Mullin GE. The gut microbiome and obesity. Curr Oncol Rep 2016;18:45. 10.1007/s11912-016-0528-7 [DOI] [PubMed] [Google Scholar]
- 29.Chen L-C, Fan Z-Y, Wang H-Y, et al. Effect of polysaccharides from adlay seed on anti-diabetic and gut microbiota. Food Funct 2019;10:4372–80. 10.1039/C9FO00406H [DOI] [PubMed] [Google Scholar]
- 30.Tang W, Yao X, Xia F, et al. Modulation of the gut microbiota in rats by Hugan Qingzhi tablets during the treatment of high-fat-diet-induced nonalcoholic fatty liver disease. Oxid Med Cell Longev 2018;2018:7261619 10.1155/2018/7261619 [DOI] [PMC free article] [PubMed] [Google Scholar]
- 31.Espinoza JL, Harkins DM, Torralba M, et al. Supragingival plaque microbiome ecology and functional potential in the context of health and disease. mBio 2018;9. 10.1128/mBio.01631-18. [Epub ahead of print: 27 Nov 2018]. [DOI] [PMC free article] [PubMed] [Google Scholar]
- 32.Lundberg JO, Gladwin MT, Ahluwalia A, et al. Nitrate and nitrite in biology, nutrition and therapeutics. Nat Chem Biol 2009;5:865–9. 10.1038/nchembio.260 [DOI] [PMC free article] [PubMed] [Google Scholar]
- 33.Baxter NT, Lesniak NA, Sinani H, et al. The glucoamylase inhibitor acarbose has a diet-dependent and reversible effect on the murine gut microbiome. mSphere 2019;4:e00528–18. 10.1128/mSphere.00528-18 [DOI] [PMC free article] [PubMed] [Google Scholar]
- 34.Koh A, De Vadder F, Kovatcheva-Datchary P, et al. From dietary fiber to host physiology: short-chain fatty acids as key bacterial metabolites. Cell 2016;165:1332–45. 10.1016/j.cell.2016.05.041 [DOI] [PubMed] [Google Scholar]
- 35.Zhang W, Ma C, Xie P, et al. Gut microbiota of newborn piglets with intrauterine growth restriction have lower diversity and different taxonomic abundances. J Appl Microbiol 2019;127:354–69. 10.1111/jam.14304 [DOI] [PMC free article] [PubMed] [Google Scholar]
- 36.Las Heras V, Clooney AG, Ryan FJ, et al. Short-Term consumption of a high-fat diet increases host susceptibility to Listeria monocytogenes infection. Microbiome 2019;7:7. 10.1186/s40168-019-0621-x [DOI] [PMC free article] [PubMed] [Google Scholar]
- 37.Wang P, Li D, Ke W, et al. Resveratrol-Induced gut microbiota reduces obesity in high-fat diet-fed mice. Int J Obes 2020;44:213–25. 10.1038/s41366-019-0332-1 [DOI] [PubMed] [Google Scholar]
- 38.Bryrup T, Thomsen CW, Kern T, et al. Metformin-Induced changes of the gut microbiota in healthy young men: results of a non-blinded, one-armed intervention study. Diabetologia 2019;62:1024–35. 10.1007/s00125-019-4848-7 [DOI] [PMC free article] [PubMed] [Google Scholar]
- 39.Forslund K, Hildebrand F, Nielsen T, et al. Disentangling type 2 diabetes and metformin treatment signatures in the human gut microbiota. Nature 2015;528:262–6. 10.1038/nature15766 [DOI] [PMC free article] [PubMed] [Google Scholar]
- 40.Fu G, Zhao K, Chen H, et al. Effect of 3 lactobacilli on immunoregulation and intestinal microbiota in a β-lactoglobulin-induced allergic mouse model. J Dairy Sci 2019;102:1943–58. 10.3168/jds.2018-15683 [DOI] [PubMed] [Google Scholar]
- 41.Kim T, Holleman CL, Ptacek T, et al. Duodenal endoluminal barrier sleeve alters gut microbiota of ZDF rats. Int J Obes 2017;41:381–9. 10.1038/ijo.2016.224 [DOI] [PMC free article] [PubMed] [Google Scholar]
Associated Data
This section collects any data citations, data availability statements, or supplementary materials included in this article.
Supplementary Materials
bmjdrc-2020-001255supp001.pdf (1.2MB, pdf)


