Abstract
Objective
To compare the sensitivity of structural MRI and 18F-fludeoxyglucose PET (18FDG-PET) to detect longitudinal changes in frontotemporal dementia (FTD).
Methods
Thirty patients with behavioral variant FTD (bvFTD), 7 with nonfluent/agrammatic variant primary progressive aphasia (nfvPPA), 16 with semantic variant primary progressive aphasia (svPPA), and 43 cognitively normal controls underwent 2–4 MRI and 18FDG-PET scans (total scans/visit = 270) as part of the Frontotemporal Lobar Degeneration Neuroimaging Initiative study. Linear mixed-effects models were carried out voxel-wise and in regions of interest to identify areas showing decreased volume or metabolism over time in patients as compared to controls.
Results
At baseline, patients with bvFTD showed bilateral temporal, dorsolateral, and medial prefrontal atrophy/hypometabolism that extended with time into adjacent structures and parietal lobe. In nfvPPA, baseline atrophy/hypometabolism in supplementary motor cortex extended with time into left greater than right precentral, dorsolateral, and dorsomedial prefrontal cortex. In svPPA, baseline atrophy/hypometabolism encompassed the anterior temporal and medial prefrontal cortex and longitudinal changes were found in temporal, orbitofrontal, and lateral parietal cortex. Across syndromes, there was substantial overlap in the brain regions showing volume and metabolism loss. Even though the pattern of metabolic decline was more extensive, metabolic changes were also more variable and sample size estimates were similar or higher for 18FDG-PET compared to MRI.
Conclusion
Our findings demonstrated the sensitivity of 18FDG-PET and structural MRI for tracking disease progression in FTD. Both modalities showed highly overlapping patterns of longitudinal change and comparable sample size estimates to detect longitudinal changes in future clinical trials.
Frontotemporal dementia (FTD) is an umbrella clinical term that encompasses a group of neurodegenerative diseases characterized by progressive deficits in behavior, executive function, or language.1 FTD is classified into 3 prototypic clinical syndromes: behavioral variant frontotemporal dementia (bvFTD), nonfluent variant primary progressive aphasia (nfvPPA), and semantic variant primary progressive aphasia (svPPA). These syndromes are characterized by distinct patterns of early neurodegeneration: structural and functional abnormalities predominate in frontal structures in bvFTD, in the frontoinsular language network in nfvPPA, and in the left anterior temporal lobe in svPPA.2
Over the last decade, brain imaging has become an attractive surrogate outcome in clinical trials in neurodegenerative disorders, as imaging provides an objective biological measure of disease progression, correlates with clinical measures, and may be sensitive to preclinical disease stage.3 To date, most longitudinal studies in FTD focused on structural MRI changes, with fewer studies evaluating the potential added value of 18F-fludeoxyglucose PET (18FDG-PET) to monitor disease progression. 18FDG-PET is valuable for diagnosis and is highly associated with clinical measurements in FTD.4–6 The aim of the present exploratory study was to compare the sensitivity of structural MRI and 18FDG-PET to detect longitudinal changes in the 3 core FTD syndromes. Specifically, we characterized the patterns of volume and metabolic loss associated with each syndrome and computed percentages of annual change both voxel-wise and in regions of interest (ROIs). We also provided sample size estimates for hypothetical clinical trials.
Methods
Participants
All participants were enrolled in the Frontotemporal Lobar Degeneration Neuroimaging Initiative (4rtni-ftldni.ini.usc.edu), a multisite observational frontotemporal lobar degeneration (FTLD) biomarker study involving 18 months of longitudinal follow-up with neuropsychological, neuroimaging, blood, and CSF examinations. Participants were recruited at the University of California San Francisco (UCSF) Memory and Aging Center or at Mayo Clinic (Rochester, MN). Patients were referred by outside physicians or self-referred, and controls were recruited through advertisements and community events. All participants received a standard clinical evaluation that included a comprehensive neurologic history, physical and neurologic examinations, structured caregiver interviews, neuroimaging, and neuropsychological testing. Patient diagnoses were established by consensus by a multidisciplinary team applying consensus diagnostic criteria for bvFTD7 and nonfluent/agrammatic and semantic variants of primary progressive aphasia.8
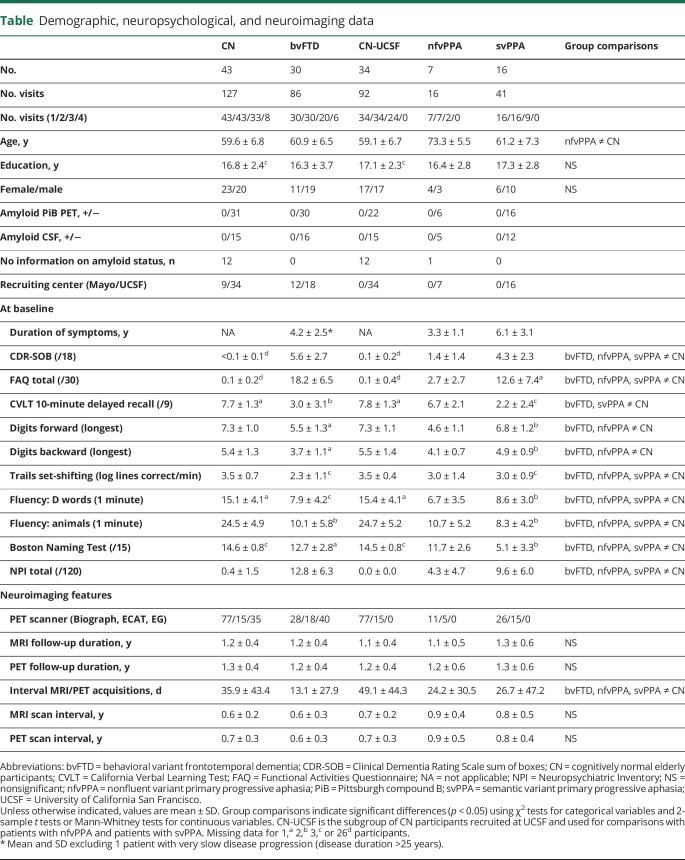
Individuals with at least 2 MRI and 18FDG-PET scans were included in the study. Participants with biomarker evidence of β-amyloid (Aβ) deposition (as assessed by Pittsburgh compound B PET scan or CSF-Aβ42) were excluded (n = 9). Our final sample included a total of 30 patients with bvFTD, 7 with nfvPPA, 16 with svPPA, and 43 cognitively normal (CN) older participants (table). All patients with nfvPPA and svPPA were enrolled at UCSF and were therefore compared to the subgroup of CN participants recruited at UCSF.
Table.
Demographic, neuropsychological, and neuroimaging data
Neuroimaging data acquisition
All participants underwent 2 to 4 structural MRI and 18FDG-PET scans (mean interval delay between both acquisitions: 27 ± 40 days; table) and had a mean follow-up of 15 ± 6 months. In total, 270 structural MRI and 18FDG-PET scans were acquired and 64 participants had more than 2 visits. For the purpose of this study, we used only the visits where both imaging modalities were available.
MRI data
At UCSF, whole-brain structural MRIs were acquired on a 3T Siemens [Munich, Germany] Tim Trio using volumetric magnetization-prepared rapid gradient echo sequence (coronal slice orientation; slice thickness 1.0 mm; in-plane resolution 1.0 × 1.0 mm; matrix 240 × 256; repetition time [TR] 2.3 ms; echo time [TE] 3 ms; inversion time [TI] 900 ms; flip angle 9°). At Mayo Clinic, structural MRI was acquired on a 3T General Electric (Boston, MA) MRI (model DISCOVERY MR750) with the following parameters: coronal slice orientation; slice thickness 1.2 mm; in-plane resolution 1.0156 × 1.0156 mm; matrix 256 × 256; TR 7.3 ms; TE 3 ms; TI 900 ms; flip angle = 8°.
PET data
UCSF participants underwent an 18FDG-PET scan at Lawrence Berkeley National Laboratory (LBNL) on a Siemens ECAT EXACT HR or a Siemens Biograph Truepoint 6 scanner in 3D acquisition mode. Six emission frames of 5 minutes each were acquired starting 30 minutes after injection of approximately 5 mCi of the tracer, with the patient resting quietly in a well-lighted room with minimum ambient noise, and eyes and ears open during tracer uptake. Ten-minute transmission scans for attenuation correction or X-ray CT were obtained either immediately before or after each 18FDG-PET scan. PET data were reconstructed using an ordered subset expectation maximization algorithm with weighted attenuation. Mayo participants underwent an 18FDG-PET scan on a GE Discovery RX PET/CT scanner. Participants were injected with 5 mCi of FDG and imaged after 30 minutes, for a 30-minute image acquisition consisting of six 5-minute dynamic frames. During the 30-minute uptake period, participants were left undisturbed in a darkened room and instructed to rest quietly without activity with their eyes open. A helical CT image, obtained prior to injection of FDG, was obtained for attenuation correction and PET data were reconstructed using 3D reprojection reconstruction.
Neuroimaging preprocessing
Neuroimaging data processing was performed using Statistical Parametric Mapping version 12 (SPM12) software (Wellcome Department of Imaging Neuroscience, Institute of Neurology, London, UK) implemented in MATLAB 8.3 (The MathWorks, Sherborn, MA). Prior to preprocessing, all raw images were inspected visually for potential artifacts. Image processing was performed using the unified segmentation procedure, Diffeomorphic Anatomical Registration Through Exponentiated Lie Algebra (DARTEL),9 and longitudinal registration toolbox implemented in SPM12.10 Specifically, we used the serial longitudinal registration to compute both an average T1-weighted scan and the deformation fields to match each visit scan to the average image. DARTEL was then used to compute the deformation fields to match the average T1-weighted scan to the population template, and the population template to Montreal Neurologic Institute (MNI) space. These deformation fields were then applied to each time point segmented and bias-corrected T1-weighted scan using the SPM Deformations tool. This approach led to the acquisition of one modulated gray matter map per subject-visit in MNI space. 18FDG-PET frames were first realigned, summed, and smoothed using a scanner-specific Gaussian kernel to obtain an equivalent effective smoothness across scanners. PET images were then coregistered onto their corresponding MRI, and normalized using the deformation parameters defined from the MRI procedure. To control for interindividual and intraindividual global variations in the 18FDG-PET signal, resultant maps were quantitatively normalized using preserved areas of the cerebellar gray matter as reference regions. To identify these regions, we extracted for each participant the mean volume (adjusted by the total intracranial volume) and 18FDG-PET signal (adjusted by the whole gray matter 18FDG-PET signal) at baseline in each brain region of the Suit Atlas.11 Two-sample t tests were then performed to compare each patient group to CN and identify cerebellar areas showing no decrease in volume and metabolism in patients. Based on these analyses, the reference region used to scale PET images included the cerebellar lobules I–IV, V, IX, the crus II, and the vermis VI, VIIIb, IX, X. Finally, to account for different original spatial resolution between MRI and 18FDG-PET acquisitions, a differential Gaussian kernel smoothing was applied to obtain an equivalent data effective smoothing of 10 mm full width at half maximum.12 18FDG-PET data were intentionally not corrected for partial volume effect using the MRI as our main goal was to compare estimates for longitudinal structural MRI vs 18FDG-PET.
Statistical analyses
First, 2-sample t tests were performed voxel-wise in SPM to compare each patient group to CN for baseline volume and metabolism. Measures of effect size were computed using the Computational Anatomy Toolbox. Second, to test the effect of time on brain volume and metabolism in patients, voxel-wise linear mixed-effects models were carried out in R using the oro.nifti13 and nlme14 packages. Linear mixed-effects models provide a flexible and powerful statistical framework for the analysis of longitudinal data. Notably, these models offer flexibility in handling unbalanced repeated measurements with missing data and allow the estimation of the fixed effects of measured variables on volume and metabolism change, while incorporating the longitudinal nature of the data by including within-person variation as random effects. For each patient group, we performed statistical models with volume or metabolism as the dependent variable and subject as random effect. These models included the interaction between time and clinical diagnosis (patients vs CN) as fixed effects and identified brain regions showing greater decreased volume/metabolism over time in patients than controls. We first fit models that included both random intercepts and slopes. However, these models did not converge, likely because the between- and within-subject variation was not easily separable, which in turn may be related to the limited number of participants who have more than 2 time points. We therefore subsequently fit models that only included random intercepts and fixed slope effects. To further estimate regional volume and metabolism changes in patients compared to CN, we used the robustlmm package15 to have a robust estimation of linear mixed-effects models for each ROI defined in the Harvard-Oxford atlas.16 This method reduces the weight of outliers and provides more accurate estimates. Similar to voxel-wise analyses, we included random intercepts and the interaction between time and clinical diagnosis as fixed effects in these models.
Finally, we performed complementary ROI analyses in the 2 groups of patients with the largest sample size (i.e., bvFTD and svPPA). Specifically, we repeated the robust linear mixed-effects models separately in patients at mild (Clinical Dementia Rating [CDR] 0.5) and moderate (CDR 1–2) stages of the disease to assess the effect of disease severity on our results. To estimate the ability of each modality to detect a drug effect in the context of a therapeutic trial, we further computed bootstrapped sample size estimates for each imaging modality and each ROI. We first performed within-group, rather than between-group, linear mixed effect models as sample size estimates are likely to be used in the context of a clinical trial with 2 arms of patients (i.e., with no healthy control group). We then used the estimate and sigma from these models to compute the estimated sample size for both arms of a randomized control trial powered at 0.8, α = 0.05, with a treatment effect of 40% reduction in the rate of decline and an expected attrition of 20% (for similar method, see reference 3). The sample size estimates and the confidence intervals (CIs) (99% percentile) were then generated using a 10,000-fold bootstrapping procedure using the bootMer function implemented in the lme4 package.17
All statistical models were corrected for age at baseline, sex, total intracranial volume (for models including volume), and MRI or PET scanner. By controlling for the scanner, we also controlled for the site as all data from Mayo Clinic were acquired on a single MRI and PET scanner (i.e., the covariate for either Mayo MRI or PET scanner is equal to a site covariate). Voxel-wise analyses were performed within a mask excluding both non–gray matter and cerebellar voxels. To correct for multiple comparisons, we used thresholds of false discovery rate (FDR)–corrected p < 0.001 and cluster extent k > 500 mm3 for voxel-wise analyses (using the fdr function implemented in FSL-5.0.9), and Bonferroni-corrected p < 0.05 for ROI analyses. To detect more subtle effects, voxel-wise results were additionally presented at an uncorrected threshold of p < 0.001 (k > 500 mm3). Finally, volume and metabolism were log-transformed in all longitudinal analyses (apart from the sample size calculation) so that estimated change could be interpreted on an annual percentage scale.
Standard protocol approvals, registrations, and patient consents
The UCSF, University of California Berkeley, LBNL, and Mayo Clinic institutional review boards for human research approved the study. Informed consent was obtained from all participants or their assigned surrogate decision-makers.
Data availability
The data that support the findings of this study are openly available in the Laboratory of Neuroimaging Image Data Archive at ida.loni.usc.edu.
Results
Population
Patient and CN groups were matched for age, sex, and years of education, except for the nfvPPA group, which was older than CN. As expected, comparisons to CN showed impaired scores at baseline in all patient groups for the CDR sum of boxes, Functional Activities Questionnaire, Neuropsychiatric Inventory, and most cognitive measurements (table).
Genetic testing in patients revealed FTLD mutations in 9 patients with bvFTD—2 microtubule-associated protein tau (MAPT), 3 progranulin (GRN), and 4 expansions in chromosome 9 open reading frame 72 (C9orf72)—and none in the nfvPPA and svPPA groups. Ten patients underwent a postmortem pathologic examination that confirmed the presence of FTLD pathology. Specifically, FTLD-tau pathology was found in 5 patients (3 bvFTD and 2 nfvPPA) and TAR DNA-binding protein 43 (FTLD-TDP) in 5 other patients (2 bvFTD and 3 svPPA).
Baseline alterations and longitudinal changes in bvFTD
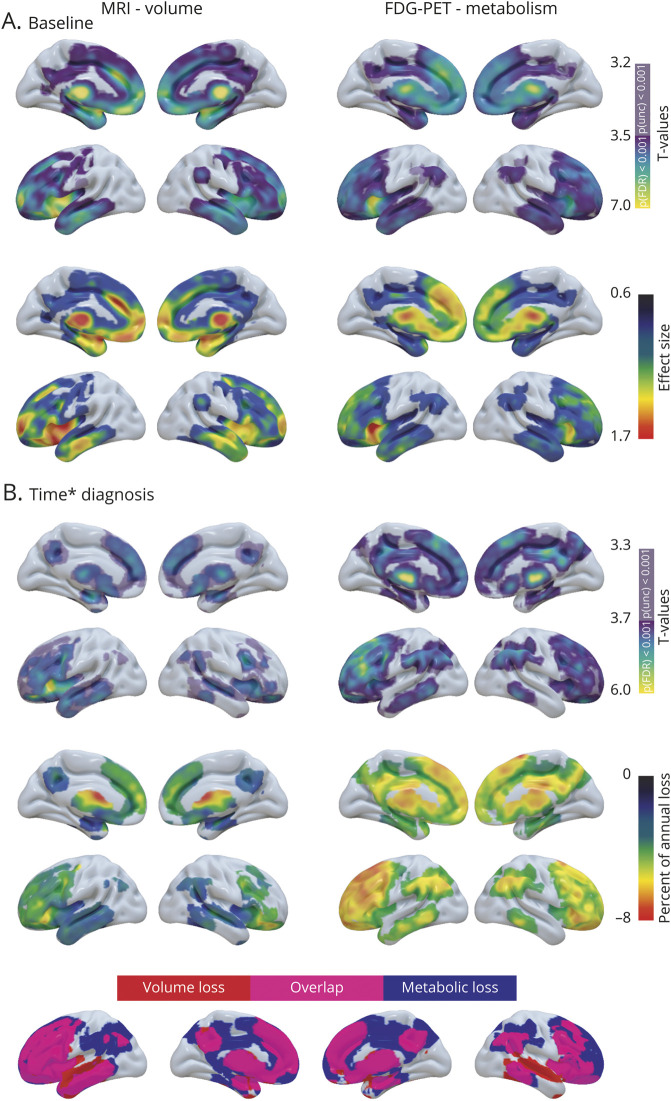
At baseline, patients with bvFTD showed lower gray matter volume and metabolism than CN in the lateral and medial prefrontal cortex, insula, anterior, middle and posterior cingulate cortex, anterior temporal regions, amygdala, hippocampus, thalamus, and caudate nucleus (figure 1A). Decreased gray matter volume was additionally found in the supplementary motor area (SMA) and putamen, and decreased metabolism was seen in the left superior frontal gyrus, inferior parietal, and angular gyrus. Over time, patients with bvFTD showed greater volume loss than CN in left greater than right insula, orbital frontal cortex, frontal pole, inferior frontal gyrus, and anterior caudate (figure 1B). Greater volume loss was also observed in the middle and superior frontal gyri, precentral and paracingulate gyri, anterior and posterior cingulate, inferior and middle temporal gyri, temporal pole, amygdala, anterior hippocampus, and thalamus. A similar set of brain regions showed decreased metabolism over time in bvFTD compared to CN. However, the pattern of metabolic decline was more extended in the medial and lateral parietal cortex and the dorsolateral prefrontal cortex. Furthermore, decreased metabolism predominated in distinct brain regions, namely the left middle and medial superior frontal regions.
Figure 1. Baseline and longitudinal changes in volume and metabolism in patients with behavioral variant frontotemporal dementia (bvFTD).
(A) Results of voxel-wise 2-sample t tests showing brain regions with less volume (left panel) and metabolism (right panel) at baseline in patients with bvFTD vs cognitively normal (CN) participants. The upper panel shows the significance of the results (T values), and the lower panel shows the effect size. (B) Results of voxel-wise linear mixed effect models showing brain region with greater decreased volume (left panel) and metabolism (right panel) over time in bvFTD vs CN. The upper panel shows the significance of the results (T values), the middle panel shows the percentage of annual volume/metabolic loss in patients compared to CN, and the lower panel shows the overlap in the patterns of volume and metabolic decline.
Baseline alterations and longitudinal changes in nfvPPA
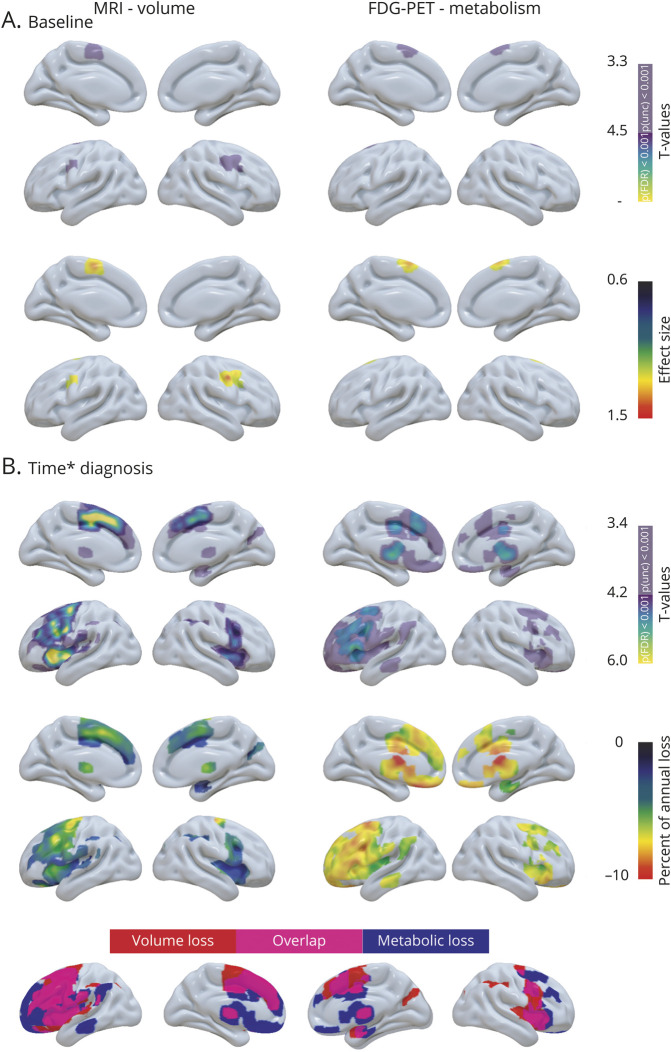
At an FDR-corrected threshold, the 2-sample t test at baseline did not reveal any brain region showing significantly less volume or metabolism in nfvPPA compared to CN. However, when the statistical threshold was lowered (p < 0.001 uncorrected), patients with nfvPPA showed lower gray matter volume than CN in bilateral precentral gyri, putamen, and left SMA, and lower metabolism in the SMA (figure 2A). With time, nfvPPA showed left-predominant gray matter volume and metabolic decline in frontal regions. The volume loss was greater in patients than CN in the SMA, precentral, inferior (pars triangularis and opercularis), middle, and superior frontal gyri, frontal operculum, and anterior insula (figure 2B). The supramarginal gyrus, Heschl gyrus, thalamus, putamen, and caudate nuclei and right amygdala also showed decreased volume over time in nfvPPA. The pattern of decreased metabolism largely overlapped with the volume loss but was less widespread within the SMA, insula, right precentral, and supramarginal gyri. In contrast, metabolic but not volume loss was detected in the ventromedial prefrontal cortex, right middle frontal, and left middle temporal gyri. The changes in metabolism in right frontal regions did not survive FDR correction.
Figure 2. Baseline and longitudinal changes in volume and metabolism in patients with nonfluent variant primary progressive aphasia (nfvPPA).
(A) Results of voxel-wise 2-sample t tests showing brain regions with less volume (left panel) and metabolism (right panel) at baseline in patients with nfvPPA vs cognitively normal (CN) participants. The upper panel shows the significance of the results (T values), and the lower panel shows the effect size. (B) Results of voxel-wise linear mixed effect models showing brain region with greater decreased volume (left panel) and metabolism (right panel) over time in nfvPPA vs CN. The upper panel shows the significance of the results (T values), the middle panel shows the percentage of annual volume/metabolic loss in patients compared to CN, and the lower panel shows the overlap in the patterns of volume and metabolic decline.
Baseline alterations and longitudinal changes in svPPA
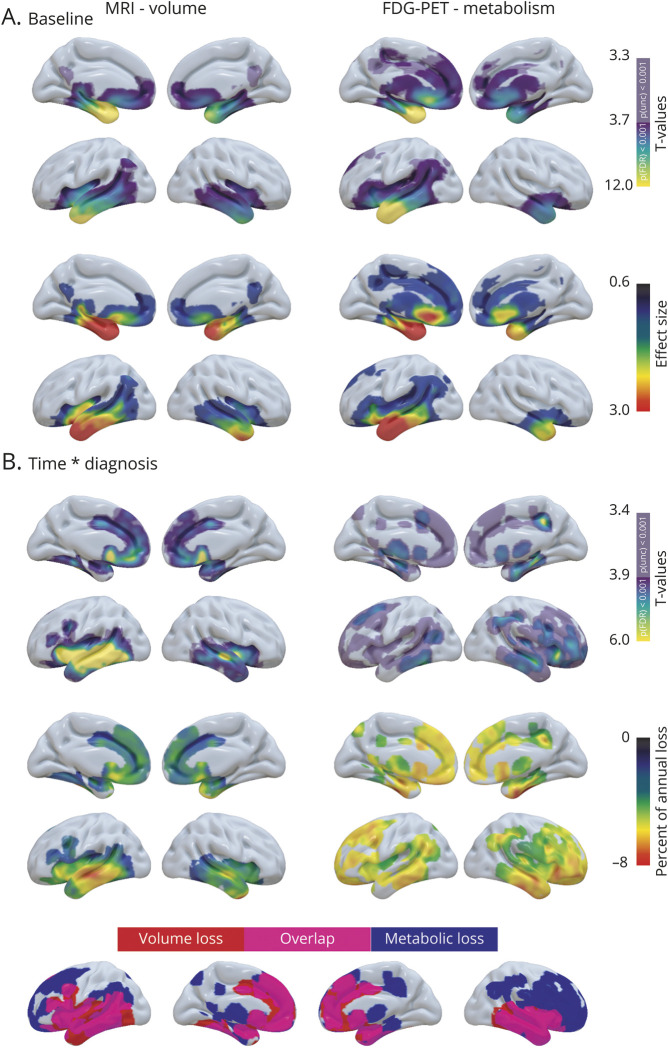
At baseline, patients with svPPA displayed left greater than right gray matter volume and metabolic loss in medial and lateral temporal regions, insula, ventromedial prefrontal cortex, posterior cingulate, and caudate nucleus (figure 3A). Decreased volume was also found in the putamen and decreased metabolism was observed in the dorsomedial prefrontal, middle cingulate, and lateral parietal cortices. Over time, patients with svPPA showed greater gray matter volume loss than CN in left greater than right inferior, middle, and superior temporal gyri, posterior fusiform gyrus, anterior hippocampus, amygdala, insula, orbitofrontal cortex, paracingulate, anterior cingulate, anterior putamen, and caudate nuclei (figure 3B). These regions also demonstrated decreased metabolism over time in svPPA, even though the involvement of lateral temporal regions was less marked. Metabolic but not volume decline was found in dorsolateral prefrontal regions, posterior cingulate, lateral parietal cortex, and thalamus. Note that some of the metabolic changes were only significant at an uncorrected statistical threshold.
Figure 3. Baseline and longitudinal changes in volume and metabolism in patients with semantic variant primary progressive aphasia (svPPA).
(A) Results of voxel-wise two-sample t tests showing brain regions with less volume (left panel) and metabolism (right panel) at baseline in patients with svPPA vs cognitively normal (CN) participants. The upper panel shows the significance of the results (T values), and the lower panel shows the effect size. (B) Results of voxel-wise linear mixed effect models showing brain region with greater decreased volume (left panel) and metabolism (right panel) over time in svPPA vs CN. The upper panel shows the significance of the results (T values), the middle panel shows the percentage of annual volume/metabolic loss in patients compared to CN, and the lower panel shows the overlap in the patterns of volume and metabolic decline.
Region of interest analyses
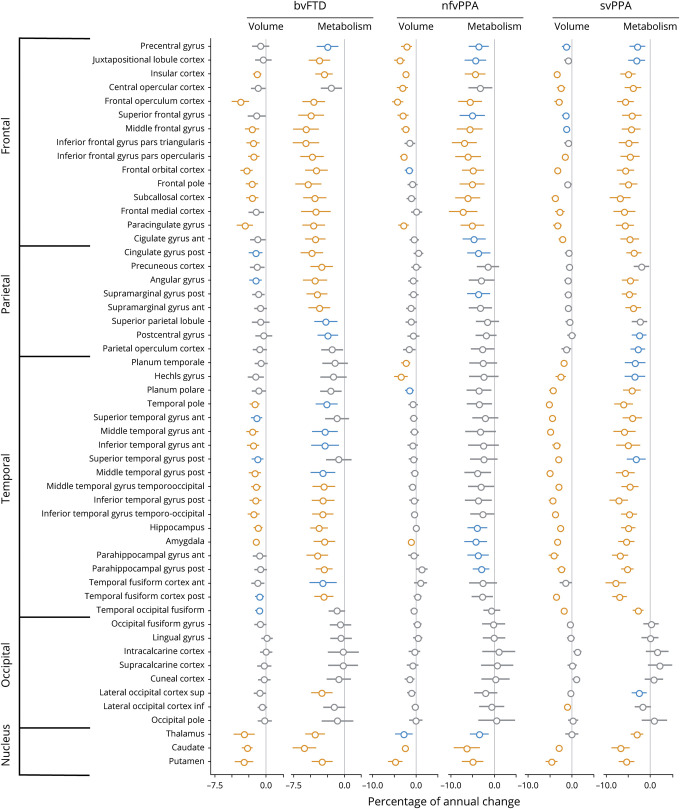
Results of robust linear mixed-effects models in each brain region of the Harvard-Oxford atlas are shown in figure 4. Overall, percentages of annual changes in patients were larger for metabolism than volume across all FTD syndromes. Despite a greater variance in metabolic changes, as indicated by larger CIs, both low and high CIs tended to be higher for 18FDG-PET than for MRI.
Figure 4. Percentage of annual volume and metabolic loss in patients with behavioral variant frontotemporal dementia (bvFTD), nonfluent variant primary progressive aphasia (nfvPPA), and semantic variant primary progressive aphasia (svPPA) compared to cognitively normal (CN) participants.
Results of robust linear mixed effect models comparing patients to CN participants for their changes in volume and metabolism in each brain region of the Harvard-Oxford atlas. Values represent the percentage of annual changes, with 95% Wald confidence intervals, in volume and metabolism in patients compared to CN. Colors represent the significance of the results: orange = surviving Bonferroni correction for multiple comparisons (α = 0.05, p < 0.0009, 53 models considered); blue = p < 0.01; gray = p > 0.01.
In bvFTD, several frontotemporal and subcortical structures showed greater volume and metabolic loss compared to CN. The highest percentages of annual change were found in the frontal operculum (−3.9%, 95% CI [−5.1 to −2.6]), putamen (−3.4% [−4.7 to −2]), and thalamus (−3.3% [−4.9 to −1.7]) for volume and in the caudate (−5.9% [−7.6 to −4.1]), pars triangularis (−5.6% [−7.5 to −3.7]), and middle frontal gyrus (−5.6% [−7.5 to −3.7]) for metabolism. Longitudinal changes in medial and lateral parietal regions were only statistically significant for metabolism, and anterior temporal regions showed statistically significant volume, but not metabolism, loss compared with CN.
In patients with nfvPPA, longitudinal changes compared to CN were mainly found in frontal and subcortical structures. Volume loss predominated in the putamen (−4.9% [−6.7 to −3]), frontal operculum (−4.8% [−6.1 to −3.5]), and SMA (i.e., juxtapositional lobule cortex, −4.4% [−5.7 to −3]), while metabolic decline was greatest in the pars triangularis (−7.3% [−10.4 to −4.2]), caudate (−6.9% [−10 to −3.6]), and pars opercularis (−6.8% [−9.8 to −3.6]).
Compared with CN, patients with svPPA showed longitudinal changes in volume and metabolism predominating in temporal regions. The highest percentages of annual change were found in the temporal pole (−5.2% [−6 to −4.5]), posterior (−5.1% [−5.8 to −4.4]), and anterior (−5.0% [−5.7 to −4.2]) middle temporal gyri for volume, and anterior (−7.9% [−10.2 to −5.5]) and posterior (−7.0% [−8.7 to −5.3]) fusiform gyri and posterior inferior temporal gyrus (−7.2% [−9.3 to −5.1]) for metabolism. Longitudinal changes in medial and lateral parietal regions and superior and middle frontal gyri were only significant for metabolism.
Effect of disease stage
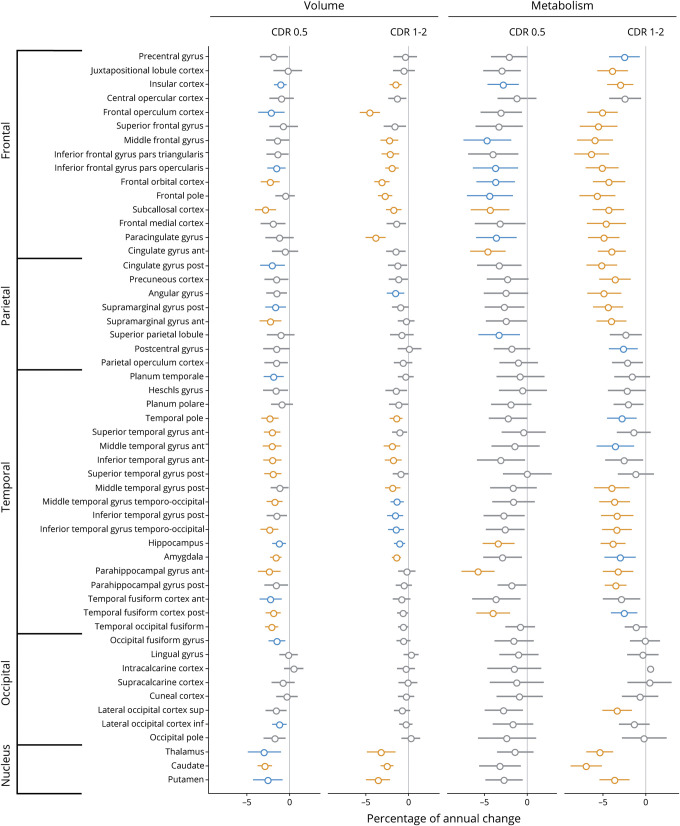
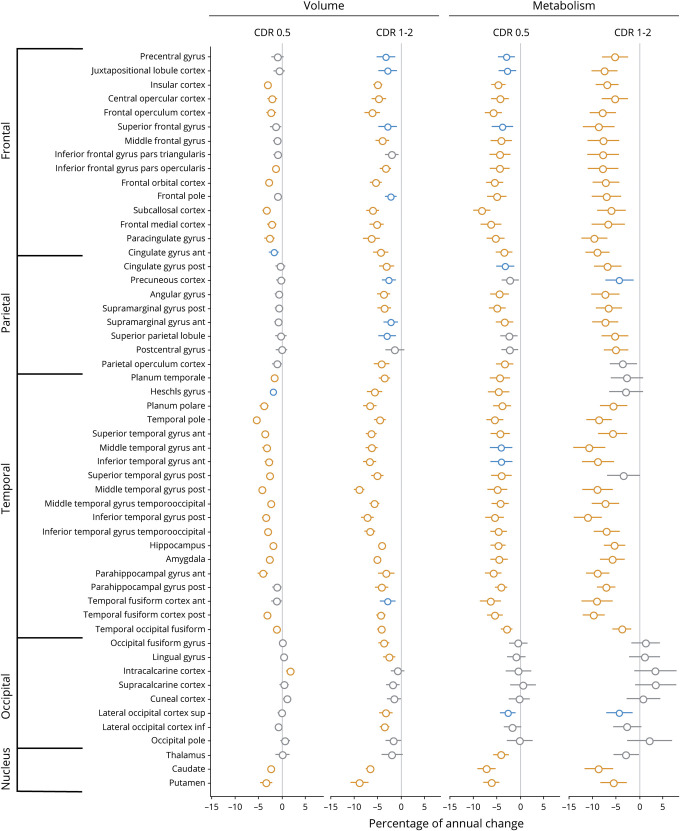
Robust linear mixed-effects models were repeated separately in patients at mild and moderate stages in the bvFTD and svPPA groups (figures 5 and 6). Overall, similar brain regions showed decreased volume/metabolism over time in patients at mild and moderate stages of the disease. As could be expected, patients at a more advanced stage showed stronger (i.e., more significant and higher percentage of annual changes) and more widespread volume/metabolic loss. For example, the loss of metabolism in medial and lateral parietal regions was primarily observed at the moderate stage in bvFTD (figure 5). When comparing MRI and 18FDG-PET at both disease stages, the pattern of metabolic decline was overall more diffuse and the percentage of annual changes tended to be higher for metabolism than volume. Yet changes in temporal regions were found with structural MRI but not with 18FDG-PET in bvFTD at the mild stage. No similar effects were observed in svPPA.
Figure 5. Percentage of annual volume and metabolic loss in patients with behavioral variant frontotemporal dementia (bvFTD) at mild (Clinical Dementia Rating [CDR] 0.5) and moderate (CDR 1–2) stages of the disease.
Results of robust linear mixed effect models comparing patients with bvFTD to cognitively normal (CN) participants for their changes in volume and metabolism in each brain region of the Harvard-Oxford atlas. Values represent the percentage of annual volume changes, with 95% Wald confidence intervals, in patients at mild (n = 10 and n visit = 22) and moderate (n = 20 and n visit = 58) stages of the disease compared to CN. Colors represent the significance of the results: orange: surviving Bonferroni correction for multiple comparisons (α = 0.05, p < 0.0009, 53 models considered); blue: p < 0.01 uncorrected; gray: p > 0.01.
Figure 6. Percentage of annual volume and metabolic loss in patients with semantic variant primary progressive aphasia (svPPA) at mild (Clinical Dementia Rating [CDR] 0.5) and moderate (CDR 1–2) stages of the disease.
Results of robust linear mixed effect models comparing patients with svPPA to cognitively normal (CN) participants for their changes in volume and metabolism in each brain region of the Harvard-Oxford atlas. Values represent the percentage of annual volume changes, with 95% Wald confidence intervals, in patients at mild (n = 10 and n visit = 28) and moderate (n = 6 and n visit = 20) stages of the disease compared to CN. Colors represent the significance of the results: orange: surviving Bonferroni correction for multiple comparisons (α = 0.05, p < 0.0009, 53 models considered); blue: p < 0.01 uncorrected; gray: p > 0.01.
Sample size estimates
In bvFTD, a limited number of ROIs showed reasonable sample sizes for clinical trials (upper limit of the CI <1,000 individuals) either for MRI or 18FDG-PET (figure e-1, doi.org/10.5061/dryad.dz08kprsw). Specifically, ROIs with the smallest upper limit of the CI included the frontal operculum (n = 178 [65, 531]), paracingulate gyrus (n = 218 [74, 734]), and amygdala (n = 238 [79, 798]) for MRI, and the caudate (n = 156 [60, 421]), thalamus (n = 155 [59, 436]), and posterior cingulate (n = 201 [69, 627]) for 18FDG-PET. In svPPA, many ROIs showed small sample size estimates with structural MRI including the posterior (n = 49 [16, 119]) and anterior (n = 93 [29, 293]) middle temporal gyrus and the middle temporooccipital gyrus (n = 111 [33, 340]). Estimated sample size and upper limit of the CI tended to be higher for 18FDG-PET, and the smallest estimated sample sizes were found in the caudate (n = 78 [25, 212]), central opercular cortex (n = 157 [41, 569]), thalamus (159 [41, 615]), and angular gyrus (n = 162 [43, 616]).
Discussion
In the present study, we used linear mixed effect models to assess the longitudinal trajectory of gray matter volume and glucose metabolism in the 3 clinical variants of FTD. Our results showed syndrome-specific changes in volume and metabolism over a mean follow-up of 15 months. In each clinical syndrome, there was substantial overlap in the brain regions showing volume and metabolism loss compared to CN. The pattern of metabolic decline was more diffuse and the percentage of annual changes tended to be higher for metabolism than volume. Yet metabolic changes were also associated with more variability and bootstrapped sample size estimates were similar or higher for 18FDG-PET compared with MRI. Collectively, these findings demonstrate that 18FDG-PET and MRI showed comparable patterns and extent of longitudinal change across FTD syndromes, and would likely perform comparably as outcome measures in clinical trials.
To date, only a few studies explored changes in metabolism over time in FTD.18–21 We build on and overcome some limitations of these studies by (1) including a larger patient group with more imaging visits, (2) using a sensitive method to detect longitudinal changes (i.e., linear mixed effect models), (3) comparing patients' changes in glucose metabolism to those observed in CN, (4) providing percentage of annual loss voxel-wise and in ROIs, and (5) comparing gray matter metabolic decline to volume loss. Our analyses showed a greater decrease in glucose metabolism over time in bvFTD compared to CN across most frontal regions, but also in medial and lateral parietal and temporal cortices, and in subcortical structures. These results are consistent with previous studies showing that hypometabolism extends beyond the frontal lobe and spreads into parietal and temporal cortices with time.18,20 We found involvement of similar regions over time with MRI, consistent with previous cross-sectional22,23 and longitudinal24,25 studies. This pattern of neurodegeneration is also in line with FTLD pathologic staging showing progressive regional atrophy in temporal and parietal lobes with advancing disease.26,27
In nfvPPA, we found that the baseline hypometabolism in the SMA increased over time and expanded into left greater than right precentral, inferior and middle frontal gyri, anterior insula, inferior parietal, and subcortical structures. This FDG pattern mirrored and extended beyond the structural changes, especially in medial prefrontal cortices. These results are consistent with cross-sectional evidence showing asymmetric hypometabolism in the left frontal lobe in nfvPPA.28,29 They also corroborate longitudinal findings showing left- and frontal-predominant metabolic changes in nfvPPA.21 However, unlike Tetzloff et al.,21 we found a limited effect of time on metabolism in the left temporal lobe. Longitudinal structural MRI studies also reported conflicting results regarding the progressive involvement of the temporal lobe in nfvPPA.21,30,31 This discrepancy may result from sample characteristics (e.g., disease severity, distinction between progressive apraxia of speech and nfvPPA) and the pathologic heterogeneity of nfvPPA. This clinical syndrome is associated with distinct neuropathologies such as corticobasal degeneration, progressive supranuclear palsy, Pick disease, or FTLD-TDP32–34 that can influence the pattern of neurodegeneration. A previous study reported distinct patterns of cross-sectional and longitudinal MRI abnormalities in nfvPPA with progressive supranuclear palsy vs corticobasal degeneration, with greater change in the white matter and brainstem in progressive supranuclear palsy.35 This pathologic heterogeneity might also explain the relatively modest differences observed at baseline compared to CN.
In contrast with a previous longitudinal FDG study in svPPA that reported stable metabolism over time,19 we detected a diffuse metabolic decline in patients with svPPA compared to CN. These changes predominated in the temporal lobe with an asymmetric anteroposterior gradient in lateral temporal regions. Specifically, the metabolic loss was more marked in posterior than anterior temporal regions in the right hemisphere and a reverse pattern was observed in the left hemisphere. The metabolic decline was additionally observed in bilateral anterior medial temporal, orbitofrontal, medial prefrontal, medial, and inferolateral parietal cortices, and subcortical structures. This pattern highly overlapped with structural changes and further encompassed right frontoparietal regions. Altogether, these findings fit with previous 18FDG-PET studies showing an asymmetric hypometabolism in temporal structures extending to orbitofrontal and medial prefrontal structures.36–38 Our results are also consistent with a cross-sectional study that compared 18FDG-PET across disease stages and observed the progressive involvement of posterior temporal and frontoparietal regions with language deterioration.39 The degeneration of these regions was further demonstrated by the structural changes found here and in other longitudinal MRI studies.30,31,40
Interestingly, we found in each FTD syndrome that metabolism decreased significantly over time in medial or inferolateral parietal regions. While hypometabolism in these regions is generally considered a characteristic feature of Alzheimer disease,41 our results challenge the specificity of these metabolic changes for distinguishing Alzheimer disease from FTD at later disease stages. This is in line with evidence showing that temporoparietal hypometabolism is common in FTD42,43 and may cause inaccurate interpretation of 18FDG-PET scans for the differential diagnosis of Alzheimer disease vs FTD.42
Although between-modality statistical comparisons were not performed, 2 observations can be made regarding the topographic pattern and the intensity of longitudinal changes in volume vs metabolism. First, despite substantial overlap, we found some brain regions showing significant metabolic loss but no significant structural changes, and vice versa (to a lesser extent). The most significant results and the highest percentage of annual changes also involved different brain areas for each imaging modality. These modality-specific changes tended to include brain regions involved early in the disease process for MRI (e.g., the left anterior temporal pole in svPPA) vs brain regions associated with later disease stage for 18FDG-PET (e.g., the right lateral parietal regions in svPPA). These results suggest that 18FDG-PET and MRI capture partially distinct, and possibly complementary, information about neurodegenerative processes in FTD. Second, the percentages of annual changes tended to be higher for metabolism than volume. Yet structural changes were associated with lower variability (as reflected by the smaller CIs) and greater significance (higher T values), especially in svPPA. Hence, it is not surprising that sample size estimates were in the same range for both modalities in bvFTD, but lower for structural MRI than for 18FDG-PET in svPPA. Overall, both modalities produced reasonable sample size estimates to detect longitudinal changes and could therefore be attractive outcome measures for clinical trials assessing new disease-modifying therapies.
This study has limitations. First, our sample sizes in each subgroup were relatively modest and estimated sample size should be interpreted cautiously. Second, we did not statistically compare the structural and metabolic changes or test for associations with regional pathologic burden. Additional studies with pathologic examination are therefore needed to compare the different sensitivity of each imaging modality with the underlying pathology/neurodegeneration. Third, while we only focused on the linear effect of time due to our limited sample size, future studies could assess the sensitivity of different ways to model time (e.g., sigmoid models) to detect longitudinal changes in FTD.
Our study demonstrated the sensitivity of MRI and 18FDG-PET for monitoring disease progression in FTD. We found structural and metabolic decline within but also beyond the specific brain network targeted by each syndrome. Sample size computation revealed comparable estimates to detect longitudinal changes for each imaging modality, suggesting that 18FDG-PET and MRI would likely perform similarly as outcome measurements for future studies investigating the effect of disease-modifying drugs.
Glossary
- Aβ
β-amyloid
- bvFTD
behavioral variant frontotemporal dementia
- CDR
Clinical Dementia Rating
- CI
confidence interval
- CN
cognitively normal
- DARTEL
diffeomorphic anatomical registration through exponentiated lie algebra
- 18FDGPET
18F-fludeoxyglucose PET
- FDR
false discovery rate
- FTD
frontotemporal dementia
- FTLD
frontotemporal lobar degeneration
- LBNL
Lawrence Berkeley National Laboratory
- MNI
Montreal Neurologic Institute
- nfvPPA
nonfluent variant primary progressive aphasia
- ROI
region of interest
- SMA
supplementary motor area
- SPM12
Statistical Parametric Mapping version 12
- svPPA
semantic variant primary progressive aphasia
- TDP
TAR DNA-binding protein
- TE
echo time
- TI
inversion time
- TR
repetition time
- UCSF
University of California San Francisco
Appendix. Authors

Study funding
This research was funded by National Institute on Aging grants (P01 AG019724 to B.L.M. and H.J.R., P50-AG023501 to B.L.M., H.J.R., and G.D.R., P01-AG019724 to M.G., U01-AG052943 to M.G.-T.; R01-AG034570 to W.J.J.); National Institute of Neurologic Disorders and Stroke (R01-NS050915 to M.G.-T.; K24-DC015544 to M.G.-T.); and Fondation pour la Recherche Medicale (to A.B.).
Disclosure
A. Bejanin, G. Tammewar, G.A. Marx, Y. Cobigo, L. Iaccarino, J. Kornak, A.M. Staffaroni, and B.C. Dickerson report no disclosures relevant to the manuscript. B.F. Boeve reports grants from GE Healthcare, NIH, Mangurian Foundation, FORUM Pharmaceuticals, C2N Diagnostics, Axovant, and personal fees from Scientific Advisory Board–Tau Consortium. D.S. Knopman reports grants from Biogen and Lilly A4 study and personal fees from Lundbeck Pharma and the DIAN study. B.L.M. receives grant support from the NIH/NIA and the Centers for Medicare & Medicaid Services (CMS) as grants for the Memory and Aging Center. M.L.G. Tempini reports no disclosures relevant to the manuscript. B.L. Miller serves as Medical Director for the John Douglas French Foundation; Scientific Director for the Tau Consortium; Director/Medical Advisory Board of the Larry L. Hillblom Foundation; Scientific Advisory Board Member for the National Institute for Health Research Cambridge Biomedical Research Centre and its subunit, the Biomedical Research Unit in Dementia (UK); and Board Member for the American Brain Foundation (ABF). W.J. Jagust is a consultant for Genentech, Novartis, and Bioclinica. A.L. Boxer reports grants from BMS, Biogen, C2N, Tau Consortium, Bluefield Project to Cure FTD, CBD Solutions, Genentech, TauRx, Forum, and NIH; personal fees from AbbVie, Asceneuron, Celgene, Roche, Novartis, and Merck; and nonfinancial support from Quanterix. H.J. Rosen reports grants from Quest Diagnostics and Biogen Pharmaceuticals, outside the submitted work. G.D. Rabinovici receives research support from Avid Radiopharmaceuticals, Eli Lilly, GE Healthcare, and Life Molecular Imaging; has received consulting fees from Eisai, Genentech, Merck, and Roche; speaking honorarium from GE Healthcare; and an honorarium as Associate Editor for JAMA Neurology. Go to Neurology.org/N for full disclosures.
References
- 1.Bang J, Spina S, Miller BL. Frontotemporal dementia. Lancet 2015;386:1672–1682. [DOI] [PMC free article] [PubMed] [Google Scholar]
- 2.Agosta F, Canu E, Sarro L, Comi G, Filippi M. Neuroimaging findings in frontotemporal lobar degeneration spectrum of disorders. Cortex 2012;48:389–413. [DOI] [PubMed] [Google Scholar]
- 3.Staffaroni AM, Ljubenkov PA, Kornak J, et al. Longitudinal multimodal imaging and clinical endpoints for frontotemporal dementia clinical trials. Brain 2019;142:443–459. [DOI] [PMC free article] [PubMed] [Google Scholar]
- 4.Bouwman F, Orini S, Gandolfo F, et al. Diagnostic utility of FDG-PET in the differential diagnosis between different forms of primary progressive aphasia. Eur J Nucl Med Mol Imaging 2018;45:1526–1533. [DOI] [PMC free article] [PubMed] [Google Scholar]
- 5.Mosconi L, Tsui WH, Herholz K, et al. Multicenter standardized 18F-FDG PET diagnosis of mild cognitive impairment, Alzheimer's disease, and other dementias. J Nucl Med 2008;49:390–398. [DOI] [PMC free article] [PubMed] [Google Scholar]
- 6.Franceschi M, Anchisi D, Pelati O, et al. Glucose metabolism and serotonin receptors in the frontotemporal lobe degeneration. Ann Neurol 2005;57:216–225. [DOI] [PubMed] [Google Scholar]
- 7.Rascovsky K, Hodges JR, Knopman D, et al. Sensitivity of revised diagnostic criteria for the behavioural variant of frontotemporal dementia. Brain 2011;134:2456–2477. [DOI] [PMC free article] [PubMed] [Google Scholar]
- 8.Gorno-Tempini ML, Hillis AE, Weintraub S, et al. Classification of primary progressive aphasia and its variants. Neurology 2011;76:1006–1014. [DOI] [PMC free article] [PubMed] [Google Scholar]
- 9.Ashburner J. A fast diffeomorphic image registration algorithm. Neuroimage 2007;38:95–113. [DOI] [PubMed] [Google Scholar]
- 10.Ashburner J, Ridgway GR. Symmetric diffeomorphic modeling of longitudinal structural MRI. Front Neurosci 2012;6:197. [DOI] [PMC free article] [PubMed] [Google Scholar]
- 11.Diedrichsen J, Balsters JH, Flavell J, Cussans E, Ramnani N. A probabilistic MR atlas of the human cerebellum. Neuroimage 2009;46:39–46. [DOI] [PubMed] [Google Scholar]
- 12.Chételat G, Desgranges B, Landeau B, et al. Direct voxel-based comparison between grey matter hypometabolism and atrophy in Alzheimer's disease. Brain 2008;131:60–71. [DOI] [PubMed] [Google Scholar]
- 13.Whitcher V, Schmid VJ, Thorton A. Working with the DICOM and NIfTI data standards in R. J Stat Softw 2011;440:1–28. [Google Scholar]
- 14.Pinheiro J, Bates D, DebRoy S, Sarkar D; R Core Team. nlme: Linear and Nonlinear Mixed Effects Models [online]. 2018. Available at: CRAN.R-project.org/package=nlme. Accessed March 1, 2018. [Google Scholar]
- 15.Koller M. robustlmm: an R package for robust estimation of linear mixed-effects models. J Stat Softw 2016;75:1–24. [DOI] [PMC free article] [PubMed] [Google Scholar]
- 16.Desikan RS, Ségonne F, Fischl B, et al. An automated labeling system for subdividing the human cerebral cortex on MRI scans into gyral based regions of interest. Neuroimage 2006;31:968–980. [DOI] [PubMed] [Google Scholar]
- 17.Bates D, Mächler M, Bolker B, Walker S. Fitting linear mixed-effects models using lme4. J Stat Softw 2015;67:1–48. [Google Scholar]
- 18.Grimmer T, Diehl J, Drzezga A, Förstl H, Kurz A. Region-specific decline of cerebral glucose metabolism in patients with frontotemporal dementia: a prospective 18F-FDG-PET study. Dement Geriatr Cogn Disord 2004;18:32–36. [DOI] [PubMed] [Google Scholar]
- 19.Diehl-Schmid J, Grimmer T, Drzezga A, et al. Longitudinal changes of cerebral glucose metabolism in semantic dementia. Dement Geriatr Cogn Disord 2006;22:346–351. [DOI] [PubMed] [Google Scholar]
- 20.Diehl-Schmid J, Grimmer T, Drzezga A, et al. Decline of cerebral glucose metabolism in frontotemporal dementia: a longitudinal 18F-FDG-PET-study. Neurobiol Aging 2007;28:42–50. [DOI] [PubMed] [Google Scholar]
- 21.Tetzloff KA, Duffy JR, Clark HM, et al. Longitudinal structural and molecular neuroimaging in agrammatic primary progressive aphasia. Brain 2018;28:42–50. [DOI] [PMC free article] [PubMed] [Google Scholar]
- 22.Seeley WW, Crawford R, Rascovsky K, et al. Frontal paralimbic network atrophy in very mild behavioral variant frontotemporal dementia. Arch Neurol 2008;65:249–255. [DOI] [PMC free article] [PubMed] [Google Scholar]
- 23.Whitwell JL, Jack CR, Senjem ML, et al. MRI correlates of protein deposition and disease severity in postmortem frontotemporal lobar degeneration. Neurodegener Dis 2009;6:106–117. [DOI] [PMC free article] [PubMed] [Google Scholar]
- 24.Whitwell JL, Anderson VM, Scahill RI, Rossor MN, Fox NC. Longitudinal patterns of regional change on volumetric MRI in frontotemporal lobar degeneration. Dement Geriatr Cogn Disord 2004;17:307–310. [DOI] [PubMed] [Google Scholar]
- 25.Brambati SM, Renda NC, Rankin KP, et al. A tensor based morphometry study of longitudinal gray matter contraction in FTD. Neuroimage 2007;35:998–1003. [DOI] [PMC free article] [PubMed] [Google Scholar]
- 26.Broe M, Hodges JR, Schofield E, Shepherd CE, Kril JJ, Halliday GM. Staging disease severity in pathologically confirmed cases of frontotemporal dementia. Neurology 2003;60:1005–1011. [DOI] [PubMed] [Google Scholar]
- 27.Kril JJ, Macdonald V, Patel S, Png F, Halliday GM. Distribution of brain atrophy in behavioral variant frontotemporal dementia. J Neurol Sci 2005;232:83–90. [DOI] [PubMed] [Google Scholar]
- 28.Rabinovici GD, Jagust WJ, Furst AJ, et al. Aβ amyloid and glucose metabolism in three variants of primary progressive aphasia. Ann Neurol 2008;64:388–401. [DOI] [PMC free article] [PubMed] [Google Scholar]
- 29.Josephs KA, Duffy JR, Fossett TR, et al. Fluorodeoxyglucose F18 positron emission tomography in progressive apraxia of speech and primary progressive aphasia variants. Arch Neurol 2010;67:596–605. [DOI] [PubMed] [Google Scholar]
- 30.Rogalski E, Cobia D, Martersteck A, et al. Asymmetry of cortical decline in subtypes of primary progressive aphasia. Neurology 2014;83:1184–1191. [DOI] [PMC free article] [PubMed] [Google Scholar]
- 31.Brambati SM, Amici S, Racine CA, et al. Longitudinal gray matter contraction in three variants of primary progressive aphasia: a tenser-based morphometry study. Neuroimage Clin 2015;8:345–355. [DOI] [PMC free article] [PubMed] [Google Scholar]
- 32.Josephs KA, Duffy JR, Strand EA, et al. Clinicopathological and imaging correlates of progressive aphasia and apraxia of speech. Brain 2006;129:1385–1398. [DOI] [PMC free article] [PubMed] [Google Scholar]
- 33.Mesulam M, Wicklund A, Johnson N, et al. Alzheimer and frontotemporal pathology in subsets of primary progressive aphasia. Ann Neurol 2008;63:709–719. [DOI] [PMC free article] [PubMed] [Google Scholar]
- 34.Spinelli EG, Mandelli ML, Miller ZA, et al. Typical and atypical pathology in primary progressive aphasia variants. Ann Neurol 2017;81:430–443. [DOI] [PMC free article] [PubMed] [Google Scholar]
- 35.Santos-Santos MA, Mandelli M, Binney RJ, et al. Features of patients with nonfluent/agrammatic primary progressive aphasia with underlying progressive supranuclear palsy pathology or corticobasal degeneration. JAMA Neurol 2016;73:733–742. [DOI] [PMC free article] [PubMed] [Google Scholar]
- 36.Desgranges B, Matuszewski V, Piolino P, et al. Anatomical and functional alterations in semantic dementia: a voxel-based MRI and PET study. Neurobiol Aging 2007;28:1904–1913. [DOI] [PubMed] [Google Scholar]
- 37.Drzezga A, Grimmer T, Henriksen G, et al. Imaging of amyloid plaques and cerebral glucose metabolism in semantic dementia and Alzheimer's disease. Neuroimage 2008;39:619–633. [DOI] [PubMed] [Google Scholar]
- 38.Bejanin A, La Joie R, Landeau B, et al. Distinct interplay between atrophy and hypometabolism in Alzheimer's versus semantic dementia. Cereb Cortex 2019;39:619–633. [DOI] [PubMed] [Google Scholar]
- 39.Kim E-J, Kim BC, Kim SJ, et al. Clinical staging of semantic dementia in an FDG-PET study using FTLD-CDR. Dement Geriatr Cogn Disord 2012;34:300–306. [DOI] [PubMed] [Google Scholar]
- 40.Whitwell JL, Avula R, Senjem ML, et al. Gray and white matter water diffusion in the syndromic variants of frontotemporal dementia. Neurology 2010;74:1279–1287. [DOI] [PMC free article] [PubMed] [Google Scholar]
- 41.Landau SM, Harvey D, Madison CM, et al. Associations between cognitive, functional, and FDG-PET measures of decline in AD and MCI. Neurobiol Aging 2011;32:1207–1218. [DOI] [PMC free article] [PubMed] [Google Scholar]
- 42.Womack KB, Diaz-Arrastia R, Aizenstein HJ, et al. Temporoparietal hypometabolism in frontotemporal lobar degeneration and associated imaging diagnostic errors. Arch Neurol 2011;68:329–337. [DOI] [PMC free article] [PubMed] [Google Scholar]
- 43.Scheltens NME, van der Weijden K, Adriaanse SM, et al. Hypometabolism of the posterior cingulate cortex is not restricted to Alzheimer's disease. Neuroimage Clin 2018;19:625–632. [DOI] [PMC free article] [PubMed] [Google Scholar]
Associated Data
This section collects any data citations, data availability statements, or supplementary materials included in this article.
Data Availability Statement
The data that support the findings of this study are openly available in the Laboratory of Neuroimaging Image Data Archive at ida.loni.usc.edu.


