Abstract
The “A Disintegrin and Metalloproteinase with Thrombospondin Motif” (ADAMTS) family of genes is involved in the occurrence and development of different cancers. However, the prognostic value of these genes in gastric cancer (GC) has not been revealed. The present study was thus conducted to determine the prognostic value for the ADAMTS family of genes in GC. First, we evaluated the mRNA expression levels of the ADAMTS family in GC patients using a GEPIA dataset. Thereafter, we determined the prognostic value of these genes by analyzing their mRNA level using the Kaplan–Meier Plotter database. The mRNA expression level of ADAMTS12 was randomly validated by qRT-PCR and meta-analysis while its coexpression genes were derived using Coexpedia. Finally, we performed Gene Ontology (GO) annotation and Kyoto Encyclopedia of Genes and Genomes (KEGG) pathway enrichment analyses using the OmicShare Tools. Compared to normal tissues, expression of ADAMTS2 and 12 was significantly higher while that of ADAMTS1, 13, and 15 was significantly lower in GC tissues. According to the RNA-seq and gene chip data, the ADAMTS family (6, 7, 12, 15, and 18) of genes was closely related to the prognosis of GC, and their high expression levels were associated with poor prognosis and survival time. In addition, ADAMTS12 was highly expressed in 20 pairs of GC tissues based on RT-PCR (P=0.016) and meta-analysis (SMD: 0.73, 95% CI: 0.32–1.14, P < 0.001). GO and KEGG pathway analyses indicated that the ADAMTS12 coexpressed genes were enriched in the pathways of extracellular matrix organization, extracellular matrix structural constituent, extracellular matrix, and protein digestion and absorption. Herein, we discovered the prognostic values and biological roles of the ADAMTS genes in GC.
1. Introduction
Gastric cancer (GC) is the most common lethal cancer worldwide. Although it is ranked fifth based on the number of patients diagnosed each year, it has the third highest mortality rate of all cancers [1]. Although the techniques used for early screening have improved, and there have been considerable improvements in comprehensive prevention and treatment measures owing to surgical treatment [2, 3], the prognosis of GC remains unsatisfactory [2]. Therefore, establishing reliable biomarkers to predict the prognosis of GC could contribute to the development of individualized clinical treatment.
Carcinogenesis is associated with abnormalities in different cellular and intercellular mechanisms such as extracellular matrix (ECM) remodeling. Among all ECM proteases, “A Disintegrin and Metalloproteinase with Thrombospondins” (ADAMTSs) are a relatively new group and are considered to be associated with carcinogenesis and the local/distant spread of cancer [4].
ADAMTS is a complex extracellular protease related to carcinogenesis and tumor protection. ADAMTS can cleave or interact with different ECM components or regulatory factors, ultimately affecting cell adhesion, migration, proliferation, and angiogenesis. Differences in the overexpression, mutation, or epigenetic silencing of the ADAMTS genes were identified in different sources of tumors, indicating the direct effect of these metalloproteinases on the development of cancer [5].
Presently, only few studies have been carried out on the ADAMTS family in GC. Jiang found that ADAMTS2 may be a potential biomarker for determining the prognosis of GC. This researcher also demonstrated that ADAMTS1, 8, and 18 were highly expressed in GC and its lymph node metastasis [6]. Conversely, however, other studies have found that the hypermethylation of ADAMTS8 and 18 is related to a decrease in the expression of GC and may play an important role in the invasion and metastasis of this malignancy [7]. ADAMTS12 may also play a role in the tumor process owing to its proteolytic activity or serve as a potential molecule involved in the regulation of cell adhesion [8].
Because the role of the ADAMTS family of genes in tumor diseases remains unclear, especially in the study of prognosis, we aimed to determine the prognostic value of their expression in GC.
2. Materials and Methods
2.1. Detection of the Gene Expression of the ADAMTS Family
The expression level of the ADAMTS family of genes was detected using the GEPIA tool (http://gepia.cancer-pku.cn) [9]. Normal samples were selected from TCGA and GTEx databases and compared to those from the TCGA tumor group, using a standard processing pipeline. To explore the expression of the ADAMTS family of genes in the different stages of tumor development, major pathological stages or subpathological stages were selected for plotting. All expression data were first log2(TPM + 1) transformed for plotting. One-way ANOVA was employed for differential analysis, and disease state (tumor or normal) was used as a variable to calculate the differential expression. The RNA-seq data for stomach cancer, which were used in the heatmap, were downloaded from UCSC Xena project (http://xena.ucsc.edu). Genomic alterations of the ADAMTS family were analyzed by cBioPortal, an integrative analytic platform of TCGA [10].
2.2. Prognostic Analysis of the ADAMTS Gene Family in GC Using the Kaplan–Meier (K-M) Plotter
The K-M plotter database was established using gene expression data and survival information from Gene Expression Omnibus (GEO) and TCGA (http://kmplot.com/analysis) [11]. Briefly, the gene chip data from the GEO database and mRNA-seq data from the TCGA database were selected. The chip data contains GSE14210, GSE22377, GSE51105, GSE15459, GSE29272, GSE62254, and other chips. The clinical parameters of tumor subtypes (tumor stage and grade) were recorded for patients, including gender, treatment, and HER2 status. The prognosis of ADAMTS in these subtypes was then compared. Thereafter, 19 genes were separately searched in the K-M plotter and the resulting images were downloaded from the website.
2.3. Verification of ADAMTS12 Expression Using the Chip Data and RT-PCR
We searched the chip data to identify the GC-related chip datasets, including cancer and its control group, and extracted the expression of ADAMTS12. The STATA v12.0 statistical software was employed in the meta-analysis to derive the continuous variables. Standardized mean difference (SMD) and 95% confidence interval (CI) were calculated using the Random (I–V heterogeneity) test. A two-sided P value <0.05 was considered to indicate statistical significance.
Following the retrieval of written informed consent, a total of 20 paired GC and corresponding adjacent noncancerous tissues were collected from patients who underwent gastric resection at the Department of Gastrointestinal Surgery between January 2019 and May 2019 at the First Affiliated Hospital of Guangxi Medical University. All experiments were approved by the Ethics Committee of the Hospital. Total RNA extraction was conducted with NucleoZOL (Macherey-Nagel, Germany), following the protocol of the manufacturer. Reverse transcription of the extracted RNA and real-time quantitative PCR (qRT-PCR) were successively performed according to the instructions provided in the RT-PCR kit (TaKaRa Biotechnology) and the fluorescence quantitative PCR kit (TaKaRa Biotechnology). The primer sequences for ADAMTS12 and β-actin were produced by Sangon Biotech Company (Shanghai, China). The following primer sequences were used: ADAMTS12, 5′-AACGCTATCGCTTGTGCAAC-3′ and 5′-CTCACAAGGATGTGCTGGGT-3′; and β-actin, 5′-TGGCACCCAGCACAATGAA-3′ and 5′-CTAAGTCATAGTCCGCCTAGAAGCA-3′. The relative expression levels of ADAMTS12 were quantified using the 2−ΔΔCT method.
2.4. Gene Function Enrichment Analysis
Coexpedia is a database that contains context-associated coexpression networks inferred from individual series of microarray samples for human and mouse from chip data. Hence, this database (http://www.coexpedia.org) was employed to analyze the ADAMTS12-related genes [12]. In addition, we analyzed the ADAMTS12 coexpressed genes using RNA-seq data to determine the possible mechanisms of action of ADAMTS12. Kyoto Encyclopedia of Genes and Genomes (KEGG) and Gene Ontology (GO) analyses were performed using the OmicShare tools, a free online platform for data analysis (http://www.omicshare.com/tools).
3. Results
3.1. mRNA Expression Level of the ADAMTS Family in GC
Based on our search of the RNA-seq data, the expression level of ADAMTS2, ADAMTS9, ADAMTS12, ADAMTS14, and other genes in the GC group was higher than that found in the normal group (Figure 1) (P < 0.05). However, the expression level of ADAMTS1 was significantly lower in the GC tissues than in normal tissues (P < 0.05) (Figure 1). The heatmap presented in Figure 2 shows the expression of each ADAMTS family of molecules in tumor tissues and the adjacent tissues. Figure 3 depicts the relationship between the ADAMTS molecules and tumor progression. Genes such as ADAMTS1, ADAMTS10, and ADAMTS12 were found to increase with tumor progression (P < 0.05). By analyzing the ADAMTS family of genes, we found that ADAMTS12 and ADAMTS16 had the highest mutation rate (i.e., 12%), which was mainly due to amplification and missense mutation. The lowest rate of genetic change occurred in ADAMTS6 (rate = 1.8%; Figure 4).
Figure 1.
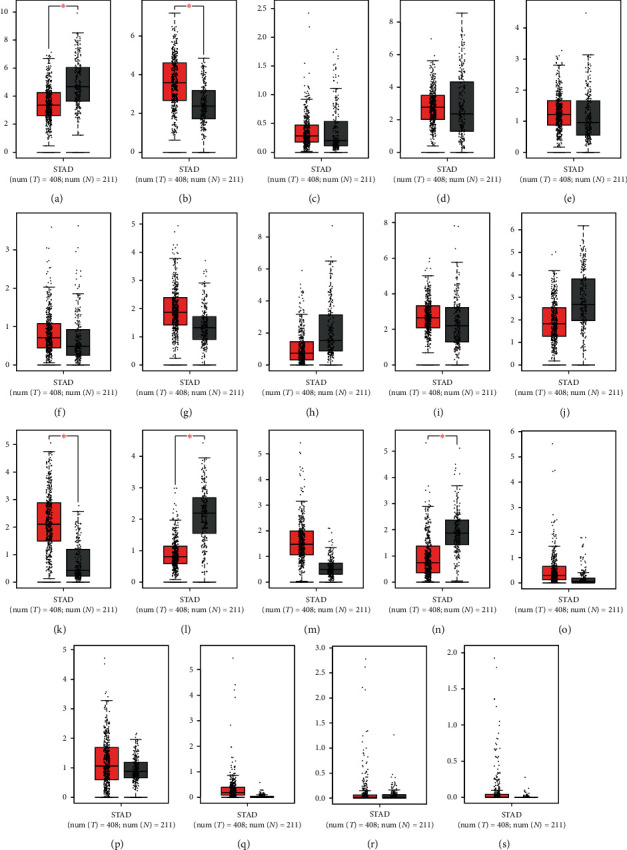
The expression of the ADAMTS family based on sequencing data. The mRNA expression of the ADAMTS family between tumor and normal; red: tumor; gray: normal; ∗P < 0.01. (a) ADAMTS1, (b) ADAMTS2, (c) ADAMTS3, (d) ADAMTS4, (e) ADAMTS5, (f) ADAMTS6, (g) ADAMTS7, (h) ADAMTS8, (i) ADAMTS9, (j) ADAMTS10, (k) ADAMTS12, (l) ADAMTS13, (m) ADAMTS14, (n) ADAMTS15, (o) ADAMTS16, (p) ADAMTS17, (q) ADAMTS18, (r) ADAMTS19, and (s) ADAMTS20.
Figure 2.
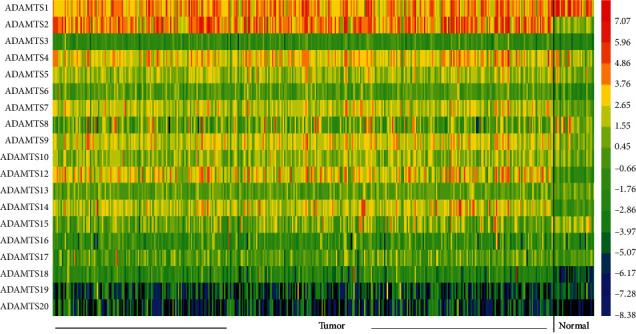
Heatmap depicting the expression of the ADAMTS family in GC patients. Red represents high expression; blue represents low expression; black represents not detected.
Figure 3.
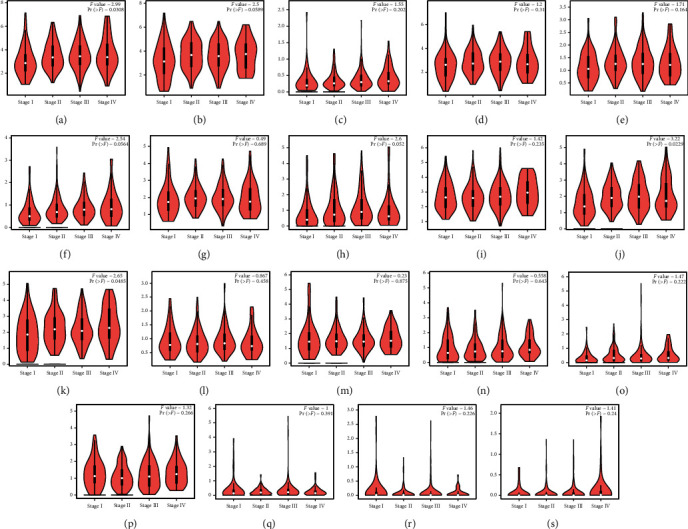
Expression of the ADAMTS family at different clinical stages. One-way ANOVA was performed to calculate the expression of the ADAMTS family in the differential pathological stage. (a) ADAMTS1, (b) ADAMTS2, (c) ADAMTS3, (d) ADAMTS4, (e) ADAMTS5, (f) ADAMTS6, (g) ADAMTS7, (h) ADAMTS8, (i) ADAMTS9, (j) ADAMTS10, (k) ADAMTS12, (l) ADAMTS13, (m) ADAMTS14, (n) ADAMTS15, (o) ADAMTS16, (p) ADAMTS17, (q) ADAMTS18, (r) ADAMTS19, and (s) ADAMTS20.
Figure 4.
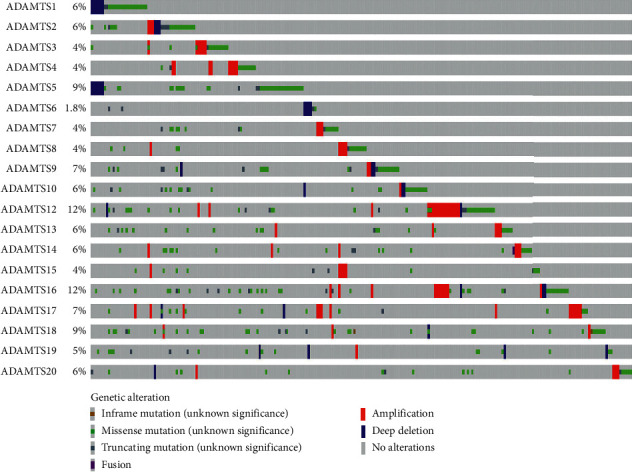
The genomic alterations of the ADAMTS family in RNA-seq data. ADAMTS12 was found to have the highest alteration (12%), with amplification detected to be the main cause of alterations.
3.2. Prognostic Values of the ADAMTS Family in Patients with GC Based on RNA-Seq and Chip Data
Using the RNA-seq data, we determined the prognostic value for the mRNA expression of the ADAMTS family in GC. ADAMTS4 (HR = 1.39, P < 0.001), ADAMTS6 (HR = 1.75, P < 0.001), ADAMTS7 (HR = 1.43, P < 0.033), ADAMTS10 (HR = 1.45, P < 0.026), ADAMTS12 (HR = 1.41, P < 0.040), ADAMTS15 (HR = 1.49, P < 0.016), ADAMTS16 (HR = 1.42, P < 0.034), ADAMTS18 (HR = 1.59, P=0.005), and other molecules were found to be associated with the overall survival (OS) of patients with GC. In fact, the survival time of patients with a high expression of these molecules was significantly shorter than that of patients with a low expression of these molecules (Figure 5).
Figure 5.
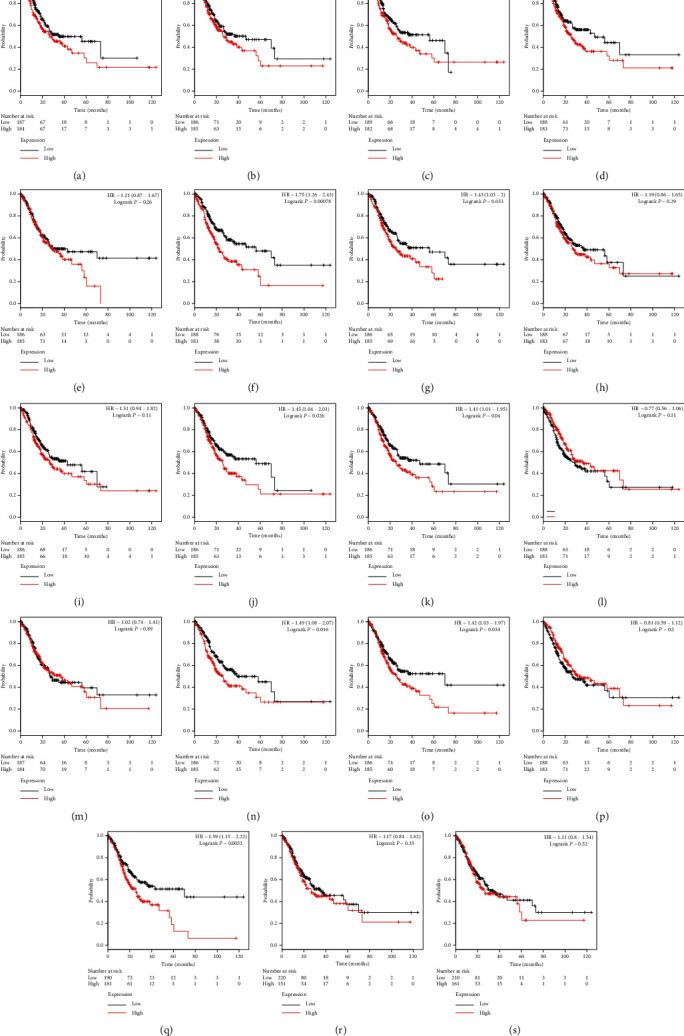
The overall survival value for the expression of the ADAMTS family based on RNA-seq data. (a) ADAMTS1, (b) ADAMTS2, (c) ADAMTS3, (d) ADAMTS4, (e) ADAMTS5, (f) ADAMTS6, (g) ADAMTS7, (h) ADAMTS8, (i) ADAMTS9, (j) ADAMTS10, (k) ADAMTS12, (l) ADAMTS13, (m) ADAMTS14, (n) ADAMTS15, (o) ADAMTS16, (p) ADAMTS17, (q) ADAMTS18, (r) ADAMTS19, and (s) ADAMTS20.
The expression levels of ADAMTS10 (HR = 2.22, P=0.020), ADAMTS18 (HR = 2.02, P=0.036), and ADAMTS20 (HR = 2.47, P=0.006) were recognized to be associated with the recurrence of GC. The survival time of patients with a high expression level of these genes was significantly lower than that of patients with a low expression level of these genes (Figure 6).
Figure 6.
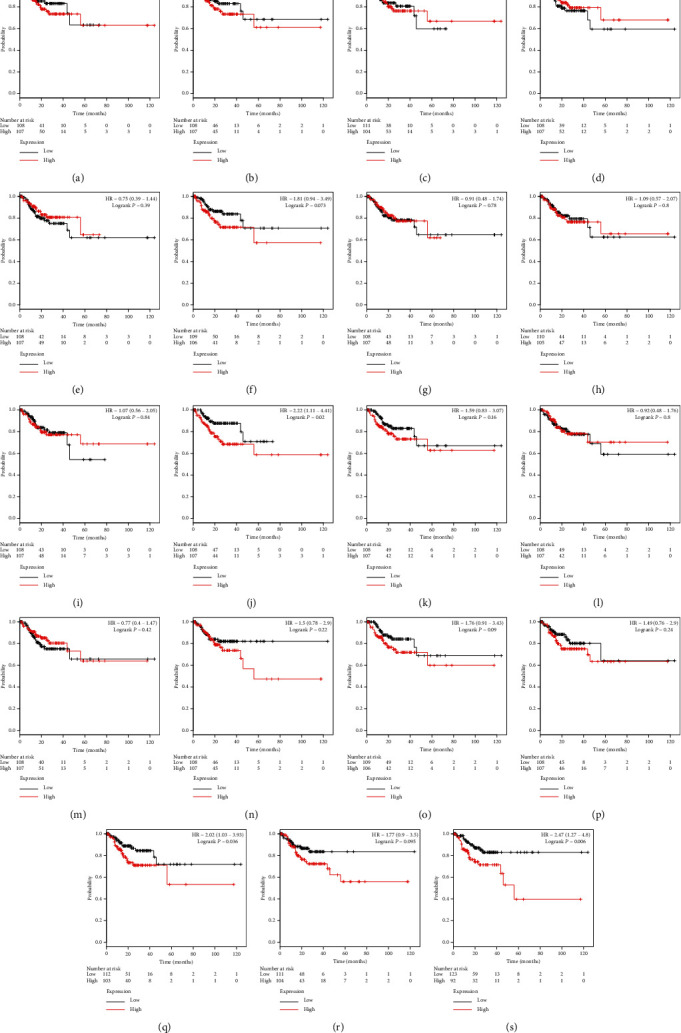
The relapse-free survival value for the expression of the ADAMTS family based on RNA-seq data. (a) ADAMTS1, (b) ADAMTS2, (c) ADAMTS3, (d) ADAMTS4, (e) ADAMTS5, (f) ADAMTS6, (g) ADAMTS7, (h) ADAMTS8, (i) ADAMTS9, (j) ADAMTS10, (k) ADAMTS12, (l) ADAMTS13, (m) ADAMTS14, (n) ADAMTS15, (o) ADAMTS16, (p) ADAMTS17, (q) ADAMTS18, (r) ADAMTS19, and (s) ADAMTS20.
Finally, we verified the prognostic value of 19 genes of the ADAMTS family in the chip data. As a result, ADAMTS1 (HR = 1.68, P < 0.001), ADAMTS2 (HR = 1.49, P < 0.001), ADAMTS3 (HR = 1.33, P < 0.001), ADAMTS5 (HR = 1.4, P < 0.002), ADAMTS6 (HR = 1.7, P < 0.001), ADAMTS7 (HR = 1.63, P < 0.001), ADAMTS8 (HR = 1.72, P < 0.001), ADAMTS9 (HR = 1.46, P < 0.001), ADAMTS12 (HR = 1.39, P < 0.001), ADAMTS14 (HR = 1.58, P < 0.001), ADAMTS15 (HR = 1.29, P < 0.001), ADAMTS18 (HR = 1.53, P < 0.001), and ADAMTS20 (HR = 1.67) were found to be closely related to OS in patients with GC (P < 0.001). The total survival time of patients with a high expression level of these molecules was significantly shorter than that of patients with low expression (Figure 7).
Figure 7.
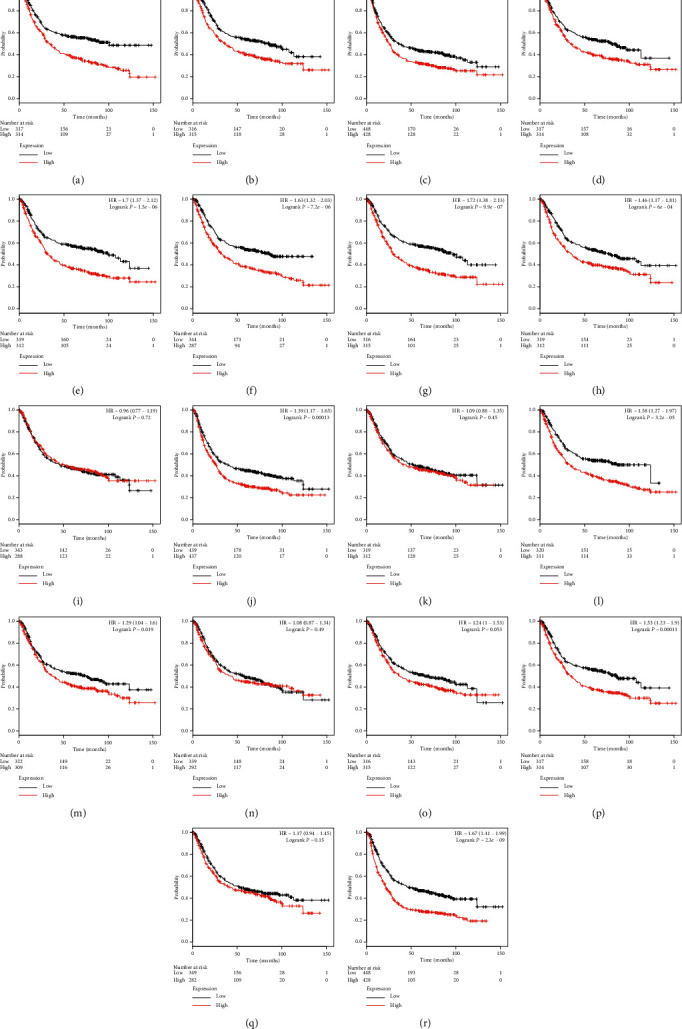
The overall survival value for the expression of the ADAMTS family based on chip data. (a) 222486_s_at ADAMTS1, (b) 226311_at ADAMTS2, (c) 214913_at ADAMTS3, (d) 235368_at ADAMTS5, (e) 237411_at ADAMTS6, (f) 228911_at ADAMTS7, (g) 235649_at ADAMTS8, (h) 1554697_at ADAMTS9, (i) 232133_at ADAMTS10, (j) 221421_s_at ADAMTS12, (k) 223844_at ADAMTS13, (l) 230167_at ADAMTS14, (m) 1553427_at ADAMTS15, (n) 238125_at ADAMTS16, (o) 1552726_at ADAMTS17, (p) 230040_at ADAMTS18, (q) 1553179_at ADAMTS19, and (r) 220717 ADAMTS20.
For postprogression survival (PPS) (Figure 8), we found that 14 genes, namely, ADAMTS1 (HR = 2.14, P < 0.001), ADAMTS2 (HR = 1.66, P < 0.001), ADAMTS3 (HR = 1.27, P < 0.001), ADAMTS5 (HR = 1.89, P < 0.001), ADAMTS6 (HR = 1.97, P < 0.001), ADAMTS7 (HR = 1.98, P < 0.001), ADAMTS8 (HR = 1.7, P < 0.001), ADAMTS9 (HR = 1.42, P < 0.001), ADAMTS12 (HR = 1.59, P < 0.001), ADAMTS14 (HR = 1.94, P < 0.001), ADAMTS15 (HR = 1.43, P < 0.001), ADAMTS17 (HR = 1.44, P < 0.001), ADAMTS18 (HR = 1.67, P < 0.001), and ADAMTS20 (HR = 1.97, P < 0.001), were closely related to PPS. The total survival time of patients with a high expression level of these genes was significantly shorter than that of patients with a low expression level.
Figure 8.
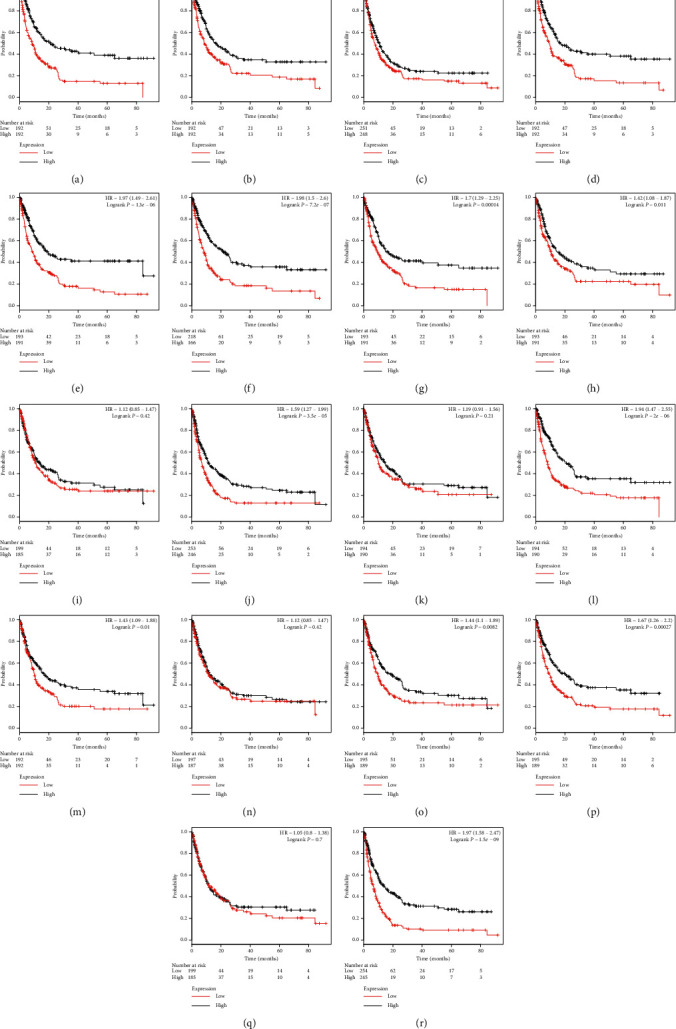
The postprogression survival value for the expression of the ADAMTS family based on chip data. (a) 222486_s_at ADAMTS1, (b) 226311_at ADAMTS2, (c) 214913_at ADAMTS3, (d) 235368_at ADAMTS5, (e) 237411_at ADAMTS6, (f) 228911_at ADAMTS7, (g) 235649_at ADAMTS8, (h) 1554697_at ADAMTS9, (i) 232133_at ADAMTS10, (j) 221421_s_at ADAMTS12, (k) 223844_at ADAMTS13, (l) 230167_at ADAMTS14, (m) 1553427_at ADAMTS15, (n) 238125_at ADAMTS16, (o) 1552726_at ADAMTS17, (p) 230040_at ADAMTS18, (q) 1553179_at ADAMTS19, and (r) 220717 ADAMTS20.
Through subgroup analysis, genes such as ADAMTS15, 16, and 18 were identified to be associated with unfavorable OS in stage II; ADAMTS2, 5, 6, 7, and 20 were associated with unfavorable OS in stage III; and ADAMTS1, 5, 6, 7, and 14 were associated with unfavorable OS in stage IV (Table 1). The expression of ADAMTS1, 5, 6, 7, 12, 16, 18, and 20 was associated with poor OS and did not significantly differ based on gender. Although the expression levels of ADAMTS2, 4, 14, and 15 were related to poor OS among men, only the expression level of ADAMTS9 was associated with poor OS among women (Table 2). Table 3 contains the prognosis of ADAMTS in the tumor stratification group. The expression of genes such as ADAMTS6, 7, 12, 15, 16, and 18 was closely related to poor OS in grade III.
Table 1.
Correlation between genes expression of ADAMTS family and OS in gastric cancer patients of clinical stage.
| ADAMTSs gene chip | Clinical stages I (n = 69); II (n = 145); III (n = 319); IV (n = 152) | HR (95% CI) | P value | ADAMTSs RNA-seq | Clinical stages I (n = 50); II (n = 111); III (n = 149); IV (n = 38) | HR (95% CI) | P value |
|---|---|---|---|---|---|---|---|
| ADAMTS1 | I | 1.95 (0.60–6.40) | 0.26 | ADAMTS1 | I | 1.08 (0.32–3.64) | 0.90 |
| II | 1.57 (0.83–2.97) | 0.16 | II | 2.00 (0.98–4.05) | 0.05 | ||
| III | 1.11 (0.77–1.62) | 0.57 | III | 1.12 (0.69–1.80) | 0.65 | ||
| IV | 1.52 (1.02–2.27) | 0.04 | IV | 1.12 (0.49–2.56) | 0.78 | ||
|
| |||||||
| ADAMTS2 | I | 0.26 (0.07–0.96) | 0.03 | ADAMTS2 | I | 2.11 (0.61–7.25) | 0.22 |
| II | 0.62 (0.33–1.19) | 0.15 | II | 1.62 (0.80–3.26) | 0.17 | ||
| III | 1.56 (1.07–2.28) | 0.02 | III | 1.36 (0.84–2.19) | 0.21 | ||
| IV | 1.29 (0.87–1.91) | 0.20 | IV | 1.28 (0.55–2.96) | 0.57 | ||
|
| |||||||
| ADAMTS3 | I | 1.18 (0.43–3.23) | 0.75 | ADAMTS3 | I | 0.60 (0.18–2.07) | 0.42 |
| II | 1.52 (0.83–2.76) | 0.17 | II | 1.26 (0.63–2.51) | 0.51 | ||
| III | 1.13 (0.85–1.5) | 0.40 | III | 1.35 (0.83–2.18) | 0.22 | ||
| IV | 1.46 (1.00–2.15) | 0.05 | IV | 1.12 (0.48–2.58) | 0.80 | ||
|
| |||||||
| ADAMTS4(none) | — | ADAMTS4 | I | 1.42 (0.41–4.91) | 0.57 | ||
| II | 2.04 (0.99–4.19) | 0.05 | |||||
| III | 1.24 (0.76–2.01) | 0.39 | |||||
| IV | 1.20 (0.52–2.78) | 0.67 | |||||
|
| |||||||
| ADAMTS5 | I | 0.48 (0.16–1.49) | 0.19 | ADAMTS5 | I | 0.69 (0.22–2.16) | 0.52 |
| II | 1.66 (0.86–3.18) | 0.13 | II | 1.20 (0.61–2.36) | 0.61 | ||
| III | 1.81 (1.24–2.64) | <0.01 | III | 1.44 (0.89–2.33) | 0.14 | ||
| IV | 1.51 (1.02–2.25) | 0.04 | IV | 1.32 (0.57–3.08) | 0.51 | ||
|
| |||||||
| ADAMTS6 | I | 0.41 (0.12–1.33) | 0.12 | ADAMTS6 | I | 1.15 (0.36–3.65) | 0.81 |
| II | 1.40 (0.74–2.63) | 0.29 | II | 1.50 (0.75–3.00) | 0.25 | ||
| III | 1.36 (0.93–1.98) | 0.11 | III | 1.68 (1.04–2.72) | 0.03 | ||
| IV | 1.31 (0.88–1.95) | 0.18 | IV | 3.37 (1.30–8.69) | <0.01 | ||
|
| |||||||
| ADAMTS7 | I | 2.56 (0.77–8.56) | 0.11 | ADAMTS7 | I | 2.82 (0.75–10.63) | 0.11 |
| II | 1.35 (0.71–2.57) | 0.35 | II | 1.10 (0.55–2.17) | 0.79 | ||
| III | 1.77 (1.21–2.57) | <0.01 | III | 1.44 (0.89–2.33) | 0.14 | ||
| IV | 1.76 (1.18–2.63) | <0.01 | IV | 1.19 (0.51–2.76) | 0.68 | ||
|
| |||||||
| ADAMTS8 | I | 1.87 (0.56–6.23) | 0.30 | ADAMTS8 | I | 1.89 (0.57–6.32) | 0.29 |
| II | 1.52 (0.80–2.88) | 0.19 | II | 1.16 (0.59–2.28) | 0.66 | ||
| III | 1.2 (0.82–1.74) | 0.34 | III | 1.55 (0.96–2.52) | 0.07 | ||
| IV | 1.4 (0.94–2.09) | 0.10 | IV | 1.13 (0.49–2.59) | 0.77 | ||
|
| |||||||
| ADAMTS9 | I | 0.86 (0.29–2.57) | 0.78 | ADAMTS9 | I | 1.11 (0.34–3.65) | 0.87 |
| II | 1.39 (0.74–2.61) | 0.31 | II | 1.08 (0.55–2.13) | 0.82 | ||
| III | 1.36 (0.94–1.98) | 0.10 | III | 1.22 (0.75–1.99) | 0.41 | ||
| IV | 1.58 (1.06–2.34) | 0.02 | IV | 1.35 (0.58–3.12) | 0.49 | ||
|
| |||||||
| ADAMTS10 | I | 2.12 (0.69–6.48) | 0.18 | ADAMTS10 | I | 1.10 (0.33–3.62) | 0.88 |
| II | 0.89 (0.48–1.65) | 0.71 | II | 1.72 (0.86–3.43) | 0.12 | ||
| III | 1.15 (0.79–1.67) | 0.47 | III | 1.25 (0.77–2.02) | 0.37 | ||
| IV | 0.76 (0.51–1.13) | 0.17 | IV | 1.46 (0.63–3.39) | 0.38 | ||
|
| |||||||
| ADAMTS12 | I | 1.06 (0.40–2.84) | 0.91 | ADAMTS12 | I | 1.41 (0.45–4.44) | 0.56 |
| II | 1.67 (0.92–3.05) | 0.09 | II | 1.72 (0.85–3.46) | 0.12 | ||
| III | 1.33 (1.00–1.77) | 0.05 | III | 1.43 (0.89–2.32) | 0.14 | ||
| IV | 1.13 (0.77–1.65) | 0.54 | IV | 1.57 (0.67–3.66) | 0.29 | ||
|
| |||||||
| ADAMTS13 | I | 1.75 (0.57–5.37) | 0.32 | ADAMTS13 | I | 0.39 (0.12–1.31) | 0.11 |
| II | 1.33 (0.71–2.49) | 0.37 | II | 0.99 (0.50–1.94) | 0.97 | ||
| III | 1.11 (0.77–1.62) | 0.57 | III | 0.91 (0.56–1.46) | 0.69 | ||
| IV | 0.86 (0.58–1.28) | 0.47 | IV | 0.88 (0.39–2.01) | 0.76 | ||
|
| |||||||
| ADAMTS14 | I | 0.83 (0.26–2.67) | 0.75 | ADAMTS14 | I | 0.66 (0.21–2.09) | 0.47 |
| II | 1.19 (0.62–2.25) | 0.60 | II | 0.76 (0.38–1.49) | 0.42 | ||
| III | 1.42 (0.98–2.07) | 0.06 | III | 1.36 (0.84–2.20) | 0.21 | ||
| IV | 2.10 (1.40–3.16) | <0.01 | IV | 0.96 (0.42–2.23) | 0.93 | ||
|
| |||||||
| ADAMTS15 | I | 1.13 (0.38–3.39) | 0.82 | ADAMTS15 | I | 0.69 (0.21–2.26) | 0.54 |
| II | 1.33 (0.71–2.49) | 0.36 | II | 2.14 (1.05–4.35) | 0.03 | ||
| III | 1.10 (0.76–1.60) | 0.62 | III | 1.32 (0.82–2.13) | 0.26 | ||
| IV | 1.31 (0.89–1.95) | 0.17 | IV | 1.78 (0.76–4.17) | 0.18 | ||
|
| |||||||
| ADAMTS16 | I | 1.25 (0.42–3.73) | 0.69 | ADAMTS16 | I | 1.10 (0.35–3.50) | 0.87 |
| II | 1.00 (0.53–1.87) | 0.99 | II | 2.60 (1.26–5.36) | <0.01 | ||
| III | 1.06 (0.73–1.54) | 0.76 | III | 1.13 (0.70–1.81) | 0.62 | ||
| IV | 1.20 (0.81–1.77) | 0.37 | IV | 1.66 (0.71–3.88) | 0.24 | ||
|
| |||||||
| ADAMTS17 | I | 0.89 (0.29–2.70) | 0.84 | ADAMTS17 | I | 1.22 (0.38–3.87) | 0.74 |
| II | 1.88 (0.99–3.58) | 0.05 | II | 0.53 (0.26–1.08) | 0.08 | ||
| III | 1.17 (0.81–1.70) | 0.40 | III | 0.71 (0.44–1.14) | 0.16 | ||
| IV | 0.97 (0.65–1.43) | 0.86 | IV | 1.58 (0.69–3.64) | 0.27 | ||
|
| |||||||
| ADAMTS18 | I | 1.32 (0.42–4.16) | 0.64 | ADAMTS18 | I | 2.51 (0.75–8.42) | 0.12 |
| II | 2.35 (1.20–4.59) | 0.01 | II | 2.41 (1.18–4.82) | 0.01 | ||
| III | 1.06 (0.73–1.55) | 0.74 | III | 1.49 (0.92–2.41) | 0.11 | ||
| IV | 1.22 (0.82–1.81) | 0.32 | IV | 1.00 (0.43–2.33) | 1.00 | ||
|
| |||||||
| ADAMTS19 | I | 3.17 (0.97–10.37) | 0.05 | ADAMTS19 | I | 4.89 (1.32–18.14) | <0.01 |
| II | 1.07 (0.57–2.01) | 0.82 | II | 0.52 (0.26–1.06) | 0.07 | ||
| III | 1.06 (0.73–1.54) | 0.74 | III | 1.30 (0.80–2.09) | 0.29 | ||
| IV | 0.97 (0.65–1.44) | 0.88 | IV | 1.52 (0.65–3.52) | 0.33 | ||
|
| |||||||
| ADAMTS20 | I | 1.56 (0.55–4.37) | 0.40 | ADAMTS20 | I | 1.58 (0.48–5.21) | 0.45 |
| II | 1.36 (0.75–2.46) | 0.31 | II | 1.44 (0.73–2.85) | 0.29 | ||
| III | 1.42 (1.07–1.89) | 0.02 | III | 0.87 (0.54–1.41) | 0.58 | ||
| IV | 1.25 (0.85–1.82) | 0.26 | IV | 1.04 (0.44–2.45) | 0.92 | ||
Table 2.
Correlation between genes expression of ADAMTS family and OS in gastric cancer patients of differentiation.
| ADAMTSs gene chip | Differentiation poorly (n = 166); moderately (n = 67); well (n = 32) | HR (95% CI) | P value | ADAMTSs RNA-seq | Differentiation I (n = 12); II (n = 134); III (n = 218) | HR (95% CI) | P value |
|---|---|---|---|---|---|---|---|
| ADAMTS1 | Poorly differentiated | 0.85 (0.57–1.27) | 0.43 | ADAMTS1 | Grade I | 1.29 × 10⁹ (0–inf) | 0.23 |
| Moderately differentiated | 0.96 (0.50–1.83) | 0.90 | Grade II | 1.26 (0.72–2.20) | 0.43 | ||
| Well differentiated | — | Grade III | 1.37 (0.91–2.07) | 0.13 | |||
|
| |||||||
| ADAMTS2 | Poorly differentiated | 1.17 (0.78–1.74) | 0.45 | ADAMTS2 | Grade I | 1.29 × 10⁹ (0-inf) | 0.23 |
| Moderately differentiated | 1.31 (0.69–2.52) | 0.41 | Grade II | 1.35 (0.76–2.37) | 0.30 | ||
| Well differentiated | — | Grade III | 1.30 (0.86–1.97) | 0.21 | |||
|
| |||||||
| ADAMTS3 | Poorly differentiated | 1.23 (0.82–1.83) | 0.32 | ADAMTS3 | Grade I | 1.29 × 10⁹ (0-inf) | 0.23 |
| Moderately differentiated | 1.35 (0.71–2.59) | 0.36 | Grade II | 0.79 (0.45–1.40) | 0.43 | ||
| Well differentiated | 1.52 (0.64–3.61) | 0.34 | Grade III | 1.33 (0.88–2.01) | 0.17 | ||
|
| |||||||
| ADAMTS5 | Poorly differentiated | 1.16 (0.72–1.88) | 0.54 | ADAMTS5 | Grade I | 1.29 × 10⁹ (0-inf) | 0.23 |
| Moderately differentiated | 0.96 (0.50–1.84) | 0.91 | Grade II | 0.98 (0.56–1.73) | 0.95 | ||
| Well differentiated | — | Grade III | 1.26 (0.83–1.91) | 0.27 | |||
|
| |||||||
| ADAMTS6 | Poorly differentiated | 1.07 (0.66–1.73) | 0.78 | ADAMTS6 | Grade I | 3.9 × 10⁹ (0-inf) | 0.44 |
| Moderately differentiated | 1.49 (0.78–2.84) | 0.23 | Grade II | 1.45 (0.81–2.58) | 0.20 | ||
| Well differentiated | — | Grade III | 1.93 (1.27–2.93) | <0.01 | |||
|
| |||||||
| ADAMTS7 | Poorly differentiated | 0.97 (0.65–1.44) | 0.86 | ADAMTS7 | Grade I | 1.41 (0.08–23.57) | 0.81 |
| Moderately differentiated | 2.39 (1.24–4.59) | <0.01 | Grade II | 1.12 (0.63–1.99) | 0.69 | ||
| Well differentiated | — | Grade III | 1.58 (1.03–2.41) | 0.04 | |||
|
| |||||||
| ADAMTS8 | Poorly differentiated | 1.10 (0.68–1.79) | 0.69 | ADAMTS8 | Grade I | 3.56 × 10⁹ (0-inf) | 0.06 |
| Moderately differentiated | 1.43 (0.75–2.74) | 0.28 | Grade II | 1.00 (0.57–1.75) | 0.99 | ||
| Well differentiated | — | Grade III | 1.07 (0.71–1.61) | 0.76 | |||
|
| |||||||
| ADAMTS9 | Poorly differentiated | 1.07 (0.66–1.74) | 0.77 | ADAMTS9 | Grade I | 1.29 × 10⁹ (0-inf) | 0.23 |
| Moderately differentiated | 1.34 (0.70–2.55) | 0.38 | Grade II | 0.85 (0.48–1.49) | 0.57 | ||
| Well differentiated | — | Grade III | 1.50 (0.98–2.29) | 0.06 | |||
|
| |||||||
| ADAMTS10 | Poorly differentiated | 1.08 (0.67–1.74) | 0.76 | ADAMTS10 | Grade I | 1.29 × 10⁹ (0-inf) | 0.23 |
| Moderately differentiated | 0.81 (0.42–1.55) | 0.52 | Grade II | 1.31 (0.75–2.30) | 0.35 | ||
| Well differentiated | – | Grade III | 1.41 (0.93–2.14) | 0.10 | |||
|
| |||||||
| ADAMTS12 | Poorly differentiated | 1.30 (0.87–1.94) | 0.21 | ADAMTS12 | Grade I | 0.71 (0.04–11.79) | 0.81 |
| Moderately differentiated | 1.00 (0.52–1.92) | 0.99 | Grade II | 1.50 (0.85–2.66) | 0.16 | ||
| Well differentiated | 0.95 (0.40–2.23) | 0.90 | Grade III | 1.54 (1.02–2.34) | 0.04 | ||
|
| |||||||
| ADAMTS13 | Poorly differentiated | 0.87 (0.54–1.41) | 0.58 | ADAMTS13 | Grade I | 1.62 × 10⁹ (0-inf) | 0.32 |
| Moderately differentiated | 1.06 (0.55–2.04) | 0.87 | Grade II | 0.46 (0.25–0.85) | 0.01 | ||
| Well differentiated | — | Grade III | 0.88 (0.59–1.33) | 0.56 | |||
|
| |||||||
| ADAMTS14 | Poorly differentiated | 1.28 (0.78–2.08) | 0.32 | ADAMTS14 | Grade I | 1.29 × 10⁹ (0-inf) | 0.23 |
| Moderately differentiated | 1.80 (0.93–3.47) | 0.08 | Grade II | 0.81 (0.46–1.44) | 0.48 | ||
| Well differentiated | — | Grade III | 0.99 (0.66–1.49) | 0.95 | |||
|
| |||||||
| ADAMTS15 | Poorly differentiated | 0.97 (0.59–1.59) | 0.91 | ADAMTS15 | Grade I | 2.60 × 10⁹ (0-inf) | 0.09 |
| Moderately differentiated | 1.34 (0.69–2.59) | 0.38 | Grade II | 1.23 (0.70–2.17) | 0.47 | ||
| Well differentiated | — | Grade III | 1.59 (1.05–2.41) | 0.03 | |||
|
| |||||||
| ADAMTS16 | Poorly differentiated | 0.69 (0.42–1.14) | 0.14 | ADAMTS16 | Grade I | 0.71 (0.04–11.79) | 0.81 |
| Moderately differentiated | 1.43 (0.75–2.73) | 0.28 | Grade II | 0.95 (0.54–1.68) | 0.86 | ||
| Well differentiated | — | Grade III | 1.56 (1.03–2.36) | 0.03 | |||
|
| |||||||
| ADAMTS17 | Poorly differentiated | 0.95 (0.59–1.53) | 0.83 | ADAMTS17 | Grade I | 1.41 (0.08–23.57) | 0.81 |
| Moderately differentiated | 1.14 (0.59–2.18) | 0.70 | Grade II | 0.98 (0.55–1.74) | 0.93 | ||
| Well differentiated | — | Grade III | 0.77 (0.51–1.17) | 0.22 | |||
|
| |||||||
| ADAMTS18 | Poorly differentiated | 1.18 (0.73–1.91) | 0.50 | ADAMTS18 | Grade I | 1.29 × 10⁹ (0-inf) | 0.23 |
| Moderately differentiated | 1.27 (0.66–2.43) | 0.47 | Grade II | 1.27 (0.72–2.24) | 0.41 | ||
| Well differentiated | — | Grade III | 1.84 (1.20–2.83) | <0.01 | |||
|
| |||||||
| ADAMTS19 | Poorly differentiated | 0.79 (0.49–1.28) | 0.34 | ADAMTS19 | Grade I | 1.86 × 10⁹ (0-inf) | 0.16 |
| Moderately differentiated | 1.25 (0.65–2.38) | 0.50 | Grade II | 1.12 (0.63–1.98) | 0.71 | ||
| Well differentiated | — | Grade III | 1.20 (0.79–1.81) | 0.39 | |||
|
| |||||||
| ADAMTS20 | Poorly differentiated | 1.10 (0.74–1.64) | 0.63 | ADAMTS20 | Grade I | 0 (0-inf) | 0.09 |
| Moderately differentiated | 0.95 (0.5–1.82) | 0.88 | Grade II | 1.21 (0.68–2.15) | 0.52 | ||
| Well differentiated | 1.92 (0.81–4.57) | 0.13 | Grade III | 1.20 (0.80–1.81) | 0.38 | ||
Table 3.
Correlation between genes expression of ADAMTS family and OS in gastric cancer patients of different genders.
| ADAMTSs gene chip | Gender female (n = 244); male (n = 567) | HR (95% CI) | P value | ADAMTSs RNA-seq | Gender female (n = 133); male (n = 238) | HR (95% CI) | P value | |
|---|---|---|---|---|---|---|---|---|
| ADAMTS1 | Female | 1.63 (1.05–2.50) | 0.03 | ADAMTS1 | Female | 1.37 (0.76–2.47) | 0.29 | |
| Male | 1.63 (1.21–2.20) | <0.01 | Male | 1.39 (0.94–2.06) | 0.10 | |||
|
| ||||||||
| ADAMTS2 | Female | 1.27 (0.83–1.95) | 0.27 | ADAMTS2 | Female | 1.59 (0.87–2.89) | 0.13 | |
| Male | 1.68 (1.24–2.26) | <0.01 | Male | 1.16 (0.79–1.72) | 0.45 | |||
|
| ||||||||
| ADAMTS3 | Female | 1.56 (1.09–2.22) | 0.01 | ADAMTS3 | Female | 1.27 (0.86–1.88) | 0.23 | |
| Male | 1.24 (1.00–1.53) | 0.05 | Male | 1.65 (0.90–3.02) | 0.10 | |||
|
| ||||||||
| ADAMTS4 (Not find) |
— | ADAMTS4 | Female | 0.86(0.48–1.54) | 0.60 | |||
| Male | 1.62(1.09–2.43) | 0.02 | ||||||
|
| ||||||||
| ADAMTS5 | Female | 1.75 (1.13–2.70) | 0.01 | ADAMTS5 | Female | 1.65 (0.91–2.98) | 0.10 | |
| Male | 1.47 (1.09–1.98) | 0.01 | Male | 1.01 (0.68–1.49) | 0.97 | |||
|
| ||||||||
| ADAMTS6 | Female | 1.57 (1.02–2.42) | 0.04 | ADAMTS6 | Female | 2.36 (1.28–4.35) | <0.01 | |
| Male | 1.76 (1.31–2.38) | <0.01 | Male | 1.47 (0.99–2.18) | 0.05 | |||
|
| ||||||||
| ADAMTS7 | Female | 1.64 (1.07–2.52) | 0.02 | ADAMTS7 | Female | 1.35 (0.74–2.45) | 0.32 | |
| Male | 1.88 (1.40–2.53) | <0.01 | Male | 1.48 (0.99–2.21) | 0.05 | |||
|
| ||||||||
| ADAMTS8 | Female | 1.98 (1.28–3.08) | <0.01 | ADAMTS8 | Female | 1.04 (0.58–1.86) | 0.91 | |
| Male | 1.31 (0.97–1.76) | 0.07 | Male | 1.16 (0.79–1.72) | 0.45 | |||
|
| ||||||||
| ADAMTS9 | Female | 1.58 (1.03–2.43) | 0.03 | ADAMTS9 | Female | 1.72 (0.94–3.14) | 0.08 | |
| Male | 1.27 (0.95–1.70) | 0.11 | Male | 1.43 (0.97–2.13) | 0.07 | |||
|
| ||||||||
| ADAMTS10 | Female | 1.08 (0.70–1.65) | 0.73 | ADAMTS10 | Female | 1.66 (0.91–3.01) | 0.09 | |
| Male | 0.94 (0.70–1.26) | 0.67 | Male | 1.26 (0.85–1.86) | 0.25 | |||
| ADAMTS12 | Female | 1.67 (1.17–2.37) | <0.01 | ADAMTS12 | Female | 2.02 (1.10–3.70) | 0.02 | |
| Male | 1.30 (1.05–1.61) | 0.02 | Male | 1.63 (1.00–2.66) | <0.05 | |||
|
| ||||||||
| ADAMTS13 | Female | 0.94 (0.62–1.45) | 0.79 | ADAMTS13 | Female | 0.63 (0.35–1.15) | 0.13 | |
| Male | 1.15 (0.86–1.54) | 0.34 | Male | 0.87 (0.59–1.29) | 0.49 | |||
|
| ||||||||
| ADAMTS14 | Female | 1.23 (0.80–1.89) | 0.35 | ADAMTS14 | Female | 1.09 (0.61–1.97) | 0.76 | |
| Male | 1.80 (1.33–2.43) | <0.01 | Male | 1.00 (0.67–1.47) | 0.98 | |||
|
| ||||||||
| ADAMTS15 | Female | 1.22 (0.79–1.87) | 0.37 | ADAMTS15 | Female | 0.86 (0.48–1.55) | 0.61 | |
| Male | 1.23 (0.92–1.65) | 0.16 | Male | 1.87 (1.25–2.79) | <0.01 | |||
|
| ||||||||
| ADAMTS16 | Female | 1.34 (0.87–2.05) | 0.18 | ADAMTS16 | Female | 1.83 (1.01–3.32) | 0.04 | |
| Male | 1.08 (0.80–1.45) | 0.61 | Male | 1.87 (1.25–2.79) | <0.01 | |||
|
| ||||||||
| ADAMTS17 | Female | 1.31 (0.85–2.01) | 0.22 | ADAMTS17 | Female | 0.78 (0.43–1.41) | 0.41 | |
| Male | 1.12 (0.83–1.50) | 0.45 | Male | 0.87 (0.59–1.29) | 0.49 | |||
|
| ||||||||
| ADAMTS18 | Female | 1.32 (0.86–2.02) | 0.21 | ADAMTS18 | Female | 2.25 (1.23–4.10) | <0.01 | |
| Male | 1.43 (1.06–1.92) | 0.02 | Male | 1.36 (0.92–2.02) | 0.13 | |||
|
| ||||||||
| ADAMTS19 | Female | 1.22 (0.79–1.87) | 0.36 | ADAMTS19 | Female | 0.89 (0.49–1.60) | 0.70 | |
| Male | 0.96 (0.72–1.30) | 0.81 | Male | 1.26 (0.85–1.86) | 0.25 | |||
|
| ||||||||
| ADAMTS20 | Female | 1.98 (1.38–2.83) | <0.01 | ADAMTS20 | Female | 1.14 (0.64–2.06) | 0.65 | |
| Male | 1.67 (1.35–2.07) | <0.01 | Male | 1.12 (0.75–1.65) | 0.58 | |||
3.3. Validation of ADAMTS12 mRNA Expression Level
By screening 38 GC chips from the GEO database (a total of 1559 GC samples and 883 control samples), we found that the expression level of ADAMTS12 was significantly increased in GC (SMD = 0.73, 95% CI (0.32–1.14) (P < 0.05) (Figure 9)). Thereafter, by performing qRT-PCR using 20 pairs of clinical samples, we found that the expression level of ADAMTS12 in GC tissues was significantly higher than that in adjacent tissues (P=0.024) (Figure 10).
Figure 9.
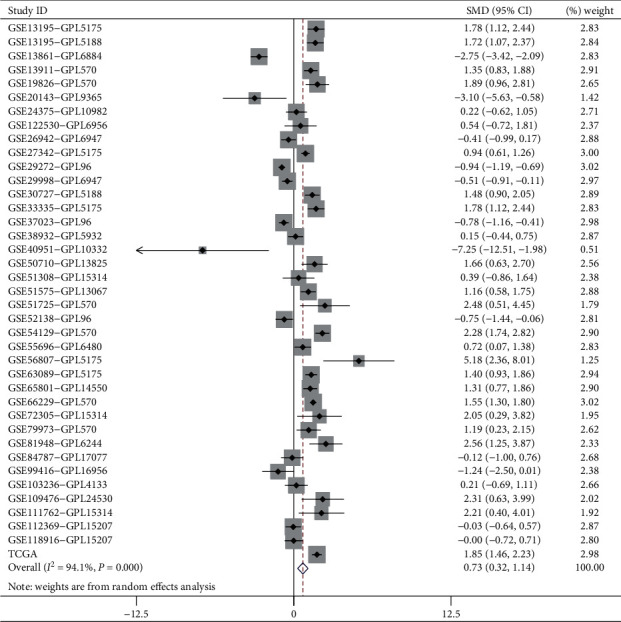
Forest plot of ADAMTS12 expression level. Meta-analysis revealed that the expression level of ADAMTS12 in the cancer patients was higher than that in noncancer patients (standardized mean difference (SMD): 0.73 (0.32–1.14), P < 0.001).
Figure 10.
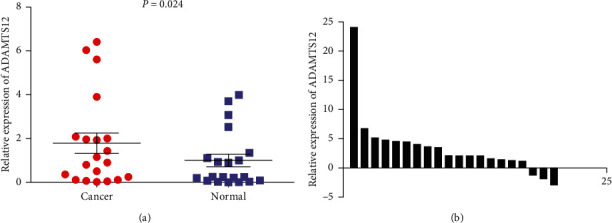
The expression of ADAMTS12 in gastric cancer patients. The expression level of ADAMTS12 was higher in GC tissues compared to that in adjacent noncancerous tissues (P < 0.05).
3.4. ADAMTS12 Functional Enrichment Analysis
By analyzing the chip data in the Coexpedia database, we found that the ADAMTS12 expression-related genes were COL5A2, COL5A1, COL1A2, SPARC, COL3A1, COL6A3, ADAMTS12, ADAMTS2, FBN1, COL1A1, and other related genes (Figure 11(a)). Similarly, by analyzing genes related to ADAMTS12 expression using the RNA-seq data, we found that ADAMTS2, COL5A2, FAP, COL1A2, COL1A1, SPARC, SULF1, COL5A1, COL3A1, and COL12A1 were the genes closely related to its expression (Figure 11(b)). Through functional enrichment analysis of the top 100 expression-related genes, we found that these genes were closely related to signaling pathways such as protein digestion and absorption, ECM-receptor interaction, and focal adhesion (Figure 12). Through GO analysis, we found that ADAMTS12 and other related genes were significantly enriched in the ECM organization (biological process), ECM structural constituent (molecular function), and ECM (cellular component) (Figure 13).
Figure 11.
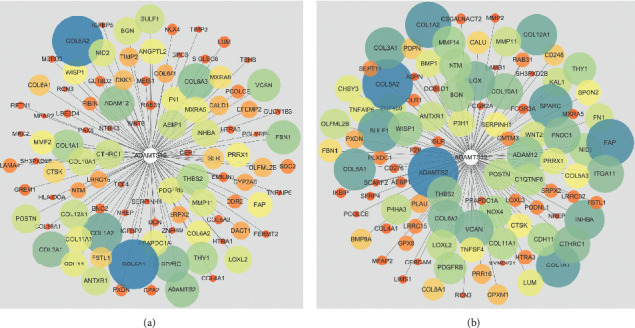
Coexpression networks. The coexpressed genes of ADAMTS12 in (a) RNA-seq data and (b) chip data. In both network diagrams, color and size represent the degree of correlation, with the blue and large circles depicting a high degree of correlation.
Figure 12.
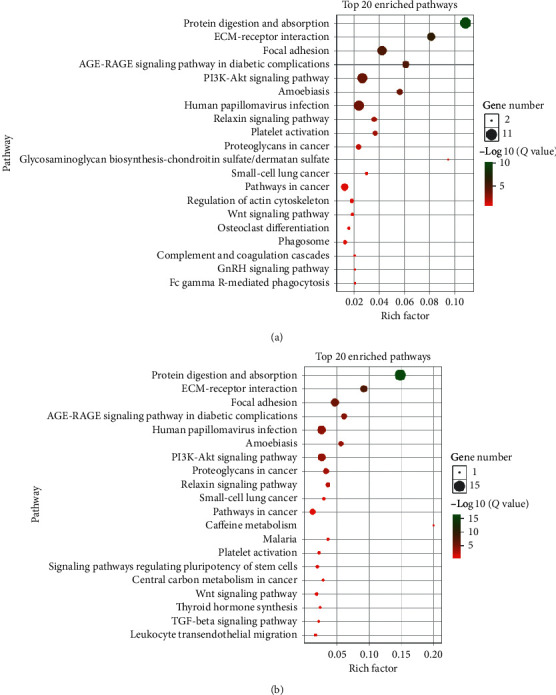
(a) KEGG analysis of the coexpressed genes from the RNA-seq data revealed that protein digestion and absorption was the most significantly enriched pathway. (b) KEGG analysis of the coexpressed genes from the chip data also revealed that the pathway of protein digestion and absorption was significantly enriched.
Figure 13.
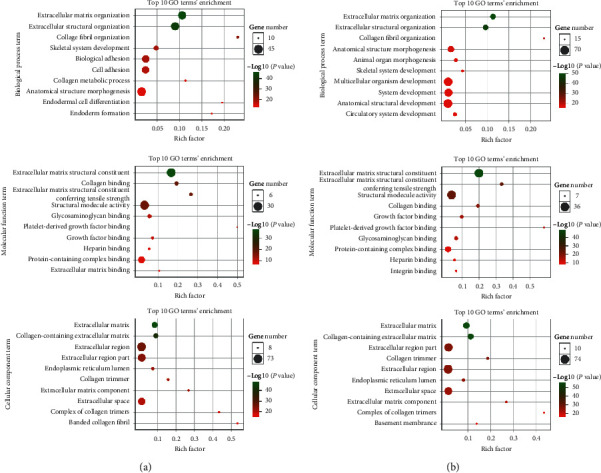
GO functional analysis of the coexpressed genes. The coexpressed genes of the (a) RNA-seq data and (b) chip data. The top 10 genes for biological process, molecular function, and cellular component term are displayed.
4. Discussion
In the present study, we sought to explore the significance of the expression of the ADAMTS family of genes in the prognosis of GC by using a K-M plotter. Thus, the expression of this family of genes in GC was analyzed. According to the RNA-seq and gene chip data, most genes in the ADAMTS family (6, 7, 12, 15, and 18) were found to be closely related to the prognosis of GC. In addition, their high expression was found to be associated with poor prognosis and survival time. By exploring gene mutations of the ADAMTS family, we recognized that it was indeed the most frequent cause of gene alterations. Furthermore, through PCR analysis, we could confirm that the expression level of ADAMTS12 in GC was consistent with the sequencing data.
Based on the studies conducted on the ADAMTS family, we recognized that most were related to osteoarthritis, blood vessels, and diseases of the platelet [13]. In the present study, however, we primarily discussed prior researches and the role of the ADAMTS family of genes in cancers.
ADAMTS1 is highly expressed in pancreatic cancer and ovarian cancer [14, 15]. Although a study found that its expression level was elevated in GC [6], other studies have found that it displays a low expression level in this malignancy [16, 17]. As these findings align with the sequencing data obtained in our study, its expression level in GC is yet to be clarified. Through a study of ADAMTS1 in breast cancer, its expression level was found to be low [18–21]. However, another study found that it can promote breast cancer metastasis [22].
ADAMTS2 is highly expressed in GC and colon cancer and is closely related to distant metastasis and the prognosis of colon cancer. However, it is an independent prognostic factor for GC [23, 24]. We found that the overexpression of ADAMTS2 was associated with unfavorable OS in GC patients, which aligns with the findings of the abovementioned study.
ADAMTS3 is involved in the alteration of osteosarcoma matrices [25], and the single nucleotide polymorphism (SNP) of the ADAMTS3 gene is an independent prognostic biomarker for cutaneous melanoma [26].
ADAMTS4 is highly expressed in colon cancer and is associated with poor prognosis [27]. ADMATS4 was also found to be mutated in early-onset familial colorectal cancer [28].
The role of ADAMTS5 in digestive system tumors is unclear, but its expression level was confirmed to be low in GC, colon cancer, and liver cancer [29–31]. A study found that ADAMTS5 overexpresses colon cancer cells to inhibit their invasion and migration [30]. However, Yu et al. found that it is highly expressed in colon cancer and is associated with lymph node metastasis [32]. A high expression level of ADAMTS5 promotes the invasion and migration of human glioblastoma, non-small-cell lung cancer, and HNSCC cells [33, 34].
ADAMTS6 is highly expressed in esophageal cancer and is an independent marker of its prognosis [35]. Notably, ADAMTS6 displays the opposite trend in expression in colon and rectal cancer [36, 37]. In the current analysis, we found that a high expression level of ADAMTS6 was significantly correlated with favorable survival in GC patients.
Presently, only few reports exist on the direction of ADAMTS7 tumors. Among the genetic mutations in liver cancer, the Asian ADAMTS7 mutation is only found in Asian Americans [38].
A study revealed that the ADAMTS8 gene is highly methylated in GC while its mRNA expression level is significantly reduced [7]. ADAMTS8 is underexpressed in liver cancer and affects its progression by targeting the ERK signaling pathway [39]. Conversely, it is highly expressed in head and neck squamous cell carcinoma [40]. Porter et al. demonstrated that the expression level of ADAMTS8 is a predictor of poor OS [41].
ADAMTS9 is poorly expressed in breast cancer, colorectal cancer, and GC and is associated with the hypermethylation of their promoters [42–44]. ADAMTS9 can also inhibit tumor progression by inhibiting angiogenesis [45].
ADAMTS12 is associated with ovarian and renal cancer metastases, and its expression level is significantly elevated in metastatic tumors compared to primary tumors [46, 47]. ADAMTS12 is also highly expressed in esophageal squamous cell carcinoma [48] but has low expression in colon cancer [49]. A previous study revealed that ADAMTS12 has anti-tumor-growth and angiogenesis effects [50]. In the present study, the data clearly indicate that a higher expression level of ADAMTS12 was significantly correlated with poor prognosis in patients with GC.
Garam et al. found that ADAMTS13 is a prognostic risk factor for colon and liver cancer [51]. The single nucleotide polymorphism of ADAMTS14 is closely related to liver cancer and oral cancer [52, 53].
ADAMTS15 inhibits tumor cell migration and angiogenesis in breast cancer and serves as an independent prognostic factor of this cancer type [41, 54]. ADAMTS15 also has a negative correlation with the degree of tumor tissue differentiation in colorectal cancer and inhibits the growth and invasion ability of colon cancer cells [55]. According to our research, ADAMTS15 has a low expression level in GC and may also exhibit an inhibitory effect.
The DNA of ADAMTS16 displays a hypermethylation state in colorectal tissue and can inhibit tumor proliferation [56]. However, ADAMTS16 was found to be highly expressed in the esophagus, and its knockout inhibited tumor invasion [57].
ADAMTS18 is a gene that has received considerable attention. In GC, colorectal cancer, pancreatic cancer, lung cancer, breast cancer, esophageal cancer, and nasopharyngeal carcinoma, its low expression level was found to be associated with the abnormal methylation of their promoter [58–63]. Similar studies have also found that ADAMTS19 is highly methylated in colorectal cancer [64]. Evidently, ADAMTS20 causes somatic mutation in GC patients with liver metastases [65]. In the present study, ADAMTS18 was found to be correlated with unfavorable prognosis in GC patients.
In conclusion, the present study was carried out to determine the mRNA expression levels of the ADAMTS family of genes in GC and the prognostic value of their expression using a KM survival curve. As a result, the expression of the ADAMTS family of genes was found to be closely related to the poor prognosis of GC patients. Such findings could enable a better understanding of the prognostic function of the ADAMTS family of genes in GC. Furthermore, these findings may serve as a favorable predictor of GC prognosis, ultimately contributing to the design of strategies.
Acknowledgments
The present study was supported by grants from the Key Research and Development Program of Science and Technology Department of Guangxi (grant no. 2017AB45153), the Innovation Project of Guangxi Graduate Education (grant no. YCBZ2019043), and the Education Department Foundation for Innovation Team of Guangxi Zhuang Autonomous Region.
Contributor Information
Xin-gan Qin, Email: qinxingan_gxmu@163.com.
Jun-qiang Chen, Email: gxhans@163.com.
Data Availability
The data used to support the findings of this study are available from the corresponding author upon request.
Conflicts of Interest
The authors declare that there are no conflicts of interest regarding the publication of this paper.
Authors' Contributions
Liang Liang and Jin-hui Zhu equally contributed to this work.
References
- 1.Bray F., Ferlay J., Soerjomataram I., Siegel R. L., Torre L. A., Jemal A. Global cancer statistics 2018: GLOBOCAN estimates of incidence and mortality worldwide for 36 cancers in 185 countries. CA: A Cancer Journal for Clinicians. 2018;68(6):394–424. doi: 10.3322/caac.21492. [DOI] [PubMed] [Google Scholar]
- 2.Ajani J. A., D’Amico T. A., Almhanna K., et al. Gastric cancer, version 3.2016, NCCN clinical practice guidelines in oncology. Journal of the National Comprehensive Cancer Network: JNCCN. 2016;14(10):1286–1312. doi: 10.6004/jnccn.2016.0137. [DOI] [PubMed] [Google Scholar]
- 3.Wilke H., Muro K., Van Cutsem E., et al. Ramucirumab plus paclitaxel versus placebo plus paclitaxel in patients with previously treated advanced gastric or gastro-oesophageal junction adenocarcinoma (RAINBOW): a double-blind, randomised phase 3 trial. The Lancet Oncology. 2014;15(11):1224–1235. doi: 10.1016/s1470-2045(14)70420-6. [DOI] [PubMed] [Google Scholar]
- 4.Binder M. J., McCoombe S., Williams E. D., McCulloch D. R., Ward A. C. The extracellular matrix in cancer progression: role of hyalectan proteoglycans and ADAMTS enzymes. Cancer Letters. 2017;385:55–64. doi: 10.1016/j.canlet.2016.11.001. [DOI] [PubMed] [Google Scholar]
- 5.Cal S., López-Otín C. ADAMTS proteases and cancer. Matrix Biology. 2015;44–46:77–85. doi: 10.1016/j.matbio.2015.01.013. [DOI] [PubMed] [Google Scholar]
- 6.Kilic M. O., Aynekin B., Kara A., Icen D., Demircan K. Differentially regulated ADAMTS1, 8, and 18 in gastric adenocarcinoma. Bratislava Medical Journal. 2017;118(02):71–76. doi: 10.4149/bll_2017_014. [DOI] [PubMed] [Google Scholar]
- 7.Chen J., Zhang J., Li X., et al. Downregulation of ADAMTS8 by DNA hypermethylation in gastric cancer and its clinical significance. BioMed Research International. 2016;2016:9. doi: 10.1155/2016/5083841.5083841 [DOI] [PMC free article] [PubMed] [Google Scholar]
- 8.Cal S., Argüelles J. M., Fernández P. L., López-Otín C. Identification, characterization, and intracellular processing of ADAM-TS12, a novel human disintegrin with a complex structural organization involving multiple thrombospondin-1 repeats. Journal of Biological Chemistry. 2001;276(21):17932–17940. doi: 10.1074/jbc.m100534200. [DOI] [PubMed] [Google Scholar]
- 9.Tang Z., Li C., Kang B., Gao G., Li C., Zhang Z. GEPIA: a web server for cancer and normal gene expression profiling and interactive analyses. Nucleic Acids Research. 2017;45(W1):W98–W102. doi: 10.1093/nar/gkx247. [DOI] [PMC free article] [PubMed] [Google Scholar]
- 10.Cerami E., Gao J., Dogrusoz U., et al. The cBio cancer genomics portal: an open platform for exploring multidimensional cancer genomics data: figure 1. Cancer Discovery. 2012;2(5):401–404. doi: 10.1158/2159-8290.cd-12-0095. [DOI] [PMC free article] [PubMed] [Google Scholar]
- 11.Szász A. M., Lánczky A., Nagy Á., et al. Cross-validation of survival associated biomarkers in gastric cancer using transcriptomic data of 1,065 patients. Oncotarget. 2016;7(31):49322–49333. doi: 10.18632/oncotarget.10337. [DOI] [PMC free article] [PubMed] [Google Scholar]
- 12.Yang S., Kim C. Y., Hwang S., et al. COEXPEDIA: exploring biomedical hypotheses via co-expressions associated with medical subject headings (MeSH) Nucleic Acids Research. 2017;45(D1):D389–D396. doi: 10.1093/nar/gkw868. [DOI] [PMC free article] [PubMed] [Google Scholar]
- 13.Zampeli E., Skopouli F. N., Moutsopoulos H. M. Polyserositis in a patient with active systemic lupus erythematosus: a case of pseudo-pseudo meigs syndrome. The Journal of Rheumatology. 2018;45(6):877–878. doi: 10.3899/jrheum.171296. [DOI] [PubMed] [Google Scholar]
- 14.Kilic M. O., Aynekin B., Bozer M., et al. Differentially regulated ADAMTS1, 8, 9, and 18 in pancreas adenocarcinoma. Przeglad Gastroenterologiczny. 2017;12(4):262–270. doi: 10.5114/pg.2017.72101. [DOI] [PMC free article] [PubMed] [Google Scholar]
- 15.Lima M. A., Dos Santos L., Turri J. A., et al. Prognostic value of ADAMTS proteases and their substrates in epithelial ovarian cancer. Pathobiology. 2016;83(6):316–326. doi: 10.1159/000446244. [DOI] [PubMed] [Google Scholar]
- 16.Chen J., Zhang C., Xu X., Zhu X., Dai D. Downregulation of A disintegrin and metallopeptidase with thrombospondin motif type 1 by DNA hypermethylation in human gastric cancer. Molecular Medicine Reports. 2015;12(2):2487–2494. doi: 10.3892/mmr.2015.3667. [DOI] [PMC free article] [PubMed] [Google Scholar]
- 17.Chen J., Zhi Y., Chang X., Zhang S., Dai D. Expression of ADAMTS1 and its correlation with angiogenesis in primary gastric cancer and lymph node metastasis. Digestive Diseases and Sciences. 2013;58(2):405–413. doi: 10.1007/s10620-012-2379-x. [DOI] [PubMed] [Google Scholar]
- 18.Li M., Liu L., Zang W., et al. miR-365 overexpression promotes cell proliferation and invasion by targeting ADAMTS-1 in breast cancer. International Journal of Oncology. 2015;47(1):296–302. doi: 10.3892/ijo.2015.3015. [DOI] [PubMed] [Google Scholar]
- 19.Martino-Echarri E., Fernández-Rodríguez R., Rodríguez-Baena F. J., et al. Contribution of ADAMTS1 as a tumor suppressor gene in human breast carcinoma. Linking its tumor inhibitory properties to its proteolytic activity on nidogen-1 and nidogen-2. International Journal of Cancer. 2013;133(10):2315–2324. doi: 10.1002/ijc.28271. [DOI] [PubMed] [Google Scholar]
- 20.Freitas V. M., do Amaral J. B., Silva T. A., et al. Decreased expression of ADAMTS-1 in human breast tumors stimulates migration and invasion. Molecular Cancer. 2013;12(1):p. 2. doi: 10.1186/1476-4598-12-2. [DOI] [PMC free article] [PubMed] [Google Scholar]
- 21.Malvia S., Bagadi S. A. R., Pradhan P., et al. Study of gene expression profiles of breast cancers in Indian women. Scientific Reports. 2019;9(1):p. 10018. doi: 10.1038/s41598-019-46261-1. [DOI] [PMC free article] [PubMed] [Google Scholar]
- 22.Tan I. A., Frewin K., Ricciardelli C., Russell D. L. ADAMTS1 promotes adhesion to extracellular matrix proteins and predicts prognosis in early stage breast cancer patients. Cellular Physiology and Biochemistry: International Journal of Experimental Cellular Physiology, Biochemistry, and Pharmacology. 2019;52(6):1553–1568. doi: 10.33594/000000108. [DOI] [PubMed] [Google Scholar]
- 23.Jiang C., Zhou Y., Huang Y., Wang Y., Wang W., Kuai X. Overexpression of ADAMTS-2 in tumor cells and stroma is predictive of poor clinical prognosis in gastric cancer. Human Pathology. 2019;84:44–51. doi: 10.1016/j.humpath.2018.08.030. [DOI] [PubMed] [Google Scholar]
- 24.Kirana C., Peng L., Miller R., et al. Combination of laser microdissection, 2D-DIGE and MALDI-TOF MS to identify protein biomarkers to predict colorectal cancer spread. Clinical Proteomics. 2019;16:p. 3. doi: 10.1186/s12014-019-9223-7. [DOI] [PMC free article] [PubMed] [Google Scholar]
- 25.Aydemir A. T., Alper M., Kockar F. SP1-mediated downregulation of ADAMTS3 gene expression in osteosarcoma models. Gene. 2018;659:1–10. doi: 10.1016/j.gene.2018.03.009. [DOI] [PubMed] [Google Scholar]
- 26.Xu Y., Wang Y., Liu H., et al. Genetic variants in the metzincin metallopeptidase family genes predict melanoma survival. Molecular Carcinogenesis. 2018;57(1):22–31. doi: 10.1002/mc.22716. [DOI] [PMC free article] [PubMed] [Google Scholar]
- 27.Chen J., Luo Y., Zhou Y., et al. Promotion of tumor growth by ADAMTS4 in colorectal cancer: focused on macrophages. Cellular Physiology and Biochemistry. 2018;46(4):1693–1703. doi: 10.1159/000489245. [DOI] [PubMed] [Google Scholar]
- 28.Rao N., Ke Z., Liu H., et al. ADAMTS4 and its proteolytic fragments differentially affect melanoma growth and angiogenesis in mice. International Journal of Cancer. 2013;133(2):294–306. doi: 10.1002/ijc.28037. [DOI] [PubMed] [Google Scholar]
- 29.Huang J., Sun Y., Chen H., et al. ADAMTS5 acts as a tumor suppressor by inhibiting migration, invasion and angiogenesis in human gastric cancer. Gastric Cancer. 2019;22(2):287–301. doi: 10.1007/s10120-018-0866-2. [DOI] [PubMed] [Google Scholar]
- 30.Li J., Liao Y., Huang J., et al. Epigenetic silencing of ADAMTS5 is associated with increased invasiveness and poor survival in patients with colorectal cancer. Journal of Cancer Research and Clinical Oncology. 2018;144(2):215–227. doi: 10.1007/s00432-017-2545-9. [DOI] [PubMed] [Google Scholar]
- 31.Li C., Xiong Y., Yang X., et al. Lost expression of ADAMTS5 protein associates with progression and poor prognosis of hepatocellular carcinoma. Drug Design, Development and Therapy. 2015;9:1773–1783. doi: 10.2147/dddt.s77069. [DOI] [PMC free article] [PubMed] [Google Scholar]
- 32.Yu L., Lu Y., Han X., et al. microRNA -140-5p inhibits colorectal cancer invasion and metastasis by targeting ADAMTS5 and IGFBP5. Stem Cell Research & Therapy. 2016;7(1):p. 180. doi: 10.1186/s13287-016-0438-5. [DOI] [PMC free article] [PubMed] [Google Scholar] [Retracted]
- 33.Gu J., Chen J., Feng J., et al. Overexpression of ADAMTS5 can regulate the migration and invasion of non-small cell lung cancer. Tumor Biology. 2016;37(7):8681–8689. doi: 10.1007/s13277-015-4573-x. [DOI] [PubMed] [Google Scholar]
- 34.Zhang J., Qin X., Sun Q., et al. Transcriptional control of PAX4-regulated miR-144/451 modulates metastasis by suppressing ADAMs expression. Oncogene. 2015;34(25):3283–3295. doi: 10.1038/onc.2014.259. [DOI] [PubMed] [Google Scholar]
- 35.Liu L., Yang Z., Ni W., Xuan Y. ADAMTS-6 is a predictor of poor prognosis in patients with esophageal squamous cell carcinoma. Experimental and Molecular Pathology. 2018;104(2):134–139. doi: 10.1016/j.yexmp.2018.02.004. [DOI] [PubMed] [Google Scholar]
- 36.Xie Y., Gou Q., Xie K., Wang Z., Wang Y., Zheng H. ADAMTS6 suppresses tumor progression via the ERK signaling pathway and serves as a prognostic marker in human breast cancer. Oncotarget. 2016;7(38):61273–61283. doi: 10.18632/oncotarget.11341. [DOI] [PMC free article] [PubMed] [Google Scholar]
- 37.Xiao W. H., Qu X. L., Li X. M., et al. Identification of commonly dysregulated genes in colorectal cancer by integrating analysis of RNA-Seq data and qRT-PCR validation. Cancer Gene Therapy. 2015;22(5):278–284. doi: 10.1038/cgt.2015.20. [DOI] [PubMed] [Google Scholar]
- 38.Sun S., Johnson C., Hu Q., et al. Differences in somatic mutation landscape of hepatocellular carcinoma in Asian American and European American populations. Oncotarget. 2016;7(26):40491–40499. doi: 10.18632/oncotarget.9636. [DOI] [PMC free article] [PubMed] [Google Scholar]
- 39.Zhao X., Yang C., Wu J., Nan Y. ADAMTS8 targets ERK to suppress cell proliferation, invasion, and metastasis of hepatocellular carcinoma. OncoTargets and Therapy. 2018;11:7569–7578. doi: 10.2147/ott.s173360. [DOI] [PMC free article] [PubMed] [Google Scholar]
- 40.Stokes A., Joutsa J., Ala-aho R., et al. Expression profiles and clinical correlations of degradome components in the tumor microenvironment of head and neck squamous cell carcinoma. Clinical Cancer Research. 2010;16(7):2022–2035. doi: 10.1158/1078-0432.ccr-09-2525. [DOI] [PubMed] [Google Scholar]
- 41.Porter S., Span P. N., Sweep F. C. G. J., et al. ADAMTS8 and ADAMTS15 expression predicts survival in human breast carcinoma. International Journal of Cancer. 2006;118(5):1241–1247. doi: 10.1002/ijc.21476. [DOI] [PubMed] [Google Scholar]
- 42.Shao B., Feng Y., Zhang H., et al. The 3p14.2 tumour suppressor ADAMTS9 is inactivated by promoter CpG methylation and inhibits tumour cell growth in breast cancer. Journal of Cellular and Molecular Medicine. 2018;22(2):1257–1271. doi: 10.1111/jcmm.13404. [DOI] [PMC free article] [PubMed] [Google Scholar]
- 43.Chen L., Tang J., Feng Y., et al. ADAMTS9 is silenced by epigenetic disruption in colorectal cancer and inhibits cell growth and metastasis by regulating Akt/p53 signaling. Cellular Physiology and Biochemistry. 2017;44(4):1370–1380. doi: 10.1159/000485534. [DOI] [PubMed] [Google Scholar]
- 44.Du W., Wang S., Zhou Q., et al. ADAMTS9 is a functional tumor suppressor through inhibiting AKT/mTOR pathway and associated with poor survival in gastric cancer. Oncogene. 2013;32(28):3319–3328. doi: 10.1038/onc.2012.359. [DOI] [PubMed] [Google Scholar]
- 45.Lo P. H. Y., Lung H. L., Cheung A. K. L., et al. Extracellular protease ADAMTS9 suppresses esophageal and nasopharyngeal carcinoma tumor formation by inhibiting angiogenesis. Cancer Research. 2010;70(13):5567–5576. doi: 10.1158/0008-5472.can-09-4510. [DOI] [PMC free article] [PubMed] [Google Scholar]
- 46.Ho T. H., Serie D. J., Parasramka M., et al. Differential gene expression profiling of matched primary renal cell carcinoma and metastases reveals upregulation of extracellular matrix genes. Annals of Oncology. 2017;28(3):604–610. doi: 10.1093/annonc/mdw652. [DOI] [PMC free article] [PubMed] [Google Scholar]
- 47.Mariani A., Wang C., Oberg A. L., et al. Genes associated with bowel metastases in ovarian cancer. Gynecologic Oncology. 2019;154(3):495–504. doi: 10.1016/j.ygyno.2019.06.010. [DOI] [PMC free article] [PubMed] [Google Scholar]
- 48.Li X., Xiao X., Chang R., Zhang C. Comprehensive bioinformatics analysis identifies lncRNA HCG22 as a migration inhibitor in esophageal squamous cell carcinoma. Journal of Cellular Biochemistry. 2019;121(1):468–481. doi: 10.1002/jcb.29218. [DOI] [PubMed] [Google Scholar]
- 49.Wang D., Zhu T., Zhang F.-B., He C. Expression of ADAMTS12 in colorectal cancer-associated stroma prevents cancer development and is a good prognostic indicator of colorectal cancer. Digestive Diseases and Sciences. 2011;56(11):3281–3287. doi: 10.1007/s10620-011-1723-x. [DOI] [PubMed] [Google Scholar]
- 50.El Hour M., Moncada-Pazos A., Blacher S., et al. Higher sensitivity of Adamts12-deficient mice to tumor growth and angiogenesis. Oncogene. 2010;29(20):3025–3032. doi: 10.1038/onc.2010.49. [DOI] [PubMed] [Google Scholar]
- 51.Garam N., Maláti É., Sinkovits G., et al. Platelet count, ADAMTS13 activity, von Willebrand factor level and survival in patients with colorectal cancer: 5-year follow-up study. Thrombosis and Haemostasis. 2018;118(1):123–131. doi: 10.1160/th17-07-0548. [DOI] [PubMed] [Google Scholar]
- 52.Sheu M. J., Hsieh M. J., Chou Y. E., et al. Effects of ADAMTS14 genetic polymorphism and cigarette smoking on the clinicopathologic development of hepatocellular carcinoma. PLoS One. 2017;12(2) doi: 10.1371/journal.pone.0172506.e0172506 [DOI] [PMC free article] [PubMed] [Google Scholar]
- 53.Su S. C., Hsieh M. J., Liu Y. F., et al. ADAMTS14 gene polymorphism and environmental risk in the development of oral cancer. PLoS One. 2016;11(7) doi: 10.1371/journal.pone.0159585.e0159585 [DOI] [PMC free article] [PubMed] [Google Scholar]
- 54.Kelwick R., Wagstaff L., Decock J., et al. Metalloproteinase-dependent and -independent processes contribute to inhibition of breast cancer cell migration, angiogenesis and liver metastasis by a disintegrin and metalloproteinase with thrombospondin motifs-15. International Journal of Cancer. 2015;136(4):E14–E26. doi: 10.1002/ijc.29129. [DOI] [PubMed] [Google Scholar]
- 55.Viloria C. G., Obaya A. J., Pazos M.-A., et al. Genetic inactivation of ADAMTS15 metalloprotease in human colorectal cancer. Cancer Research. 2009;69(11):4926–4934. doi: 10.1158/0008-5472.can-08-4155. [DOI] [PubMed] [Google Scholar]
- 56.Moncada-Pazos F., Kolarova J., Schafmayer S., et al. Aberrant DNA methylation of ADAMTS16 in colorectal and other epithelial cancers. BMC Cancer. 2018;18(1):p. 796. doi: 10.1186/s12885-018-4701-2. [DOI] [PMC free article] [PubMed] [Google Scholar]
- 57.Sakamoto N., Oue N., Noguchi T., et al. Serial analysis of gene expression of esophageal squamous cell carcinoma: ADAMTS16 is upregulated in esophageal squamous cell carcinoma. Cancer Science. 2010;101(4):1038–1044. doi: 10.1111/j.1349-7006.2009.01477.x. [DOI] [PMC free article] [PubMed] [Google Scholar]
- 58.Zhang Y., Xu H., Mu J., et al. Inactivation of ADAMTS18 by aberrant promoter hypermethylation contribute to lung cancer progression. Journal of Cellular Physiology. 2019;234(5):6965–6975. doi: 10.1002/jcp.27439. [DOI] [PubMed] [Google Scholar]
- 59.Xu H., Xiao Q., Fan Y., et al. Epigenetic silencing ofADAMTS18 promotes cell migration and invasion of breast cancer through AKT and NF-κB signaling. Cancer Medicine. 2017;6(6):1399–1408. doi: 10.1002/cam4.1076. [DOI] [PMC free article] [PubMed] [Google Scholar]
- 60.Guilleret I., Losi L., Chelbi S. T., et al. DNA methylation profiling of esophageal adenocarcinoma using Methylation Ligation-dependent Macroarray (MLM) Biochemical and Biophysical Research Communications. 2016;479(2):231–237. doi: 10.1016/j.bbrc.2016.09.049. [DOI] [PubMed] [Google Scholar]
- 61.Xu B., Zhang L., Luo C., et al. Hypermethylation of the 16q23.1 tumor suppressor gene ADAMTS18 in clear cell renal cell carcinoma. International Journal of Molecular Sciences. 2015;16(1):1051–1065. doi: 10.3390/ijms16011051. [DOI] [PMC free article] [PubMed] [Google Scholar]
- 62.Li Z., Zhang W., Shao Y. C., et al. High-resolution melting analysis of ADAMTS18 methylation levels in gastric, colorectal and pancreatic cancers. Medical Oncology. 2010;27(3):998–1004. doi: 10.1007/s12032-009-9323-8. [DOI] [PubMed] [Google Scholar]
- 63.Zhang H., Wang X., Ying J., et al. Epigenetic identification of ADAMTS18 as a novel 16q23.1 tumor suppressor frequently silenced in esophageal, nasopharyngeal and multiple other carcinomas. Oncogene. 2007;26(53):7490–7498. doi: 10.1038/sj.onc.1210559. [DOI] [PMC free article] [PubMed] [Google Scholar]
- 64.Alonso S., Gonzalez B., Ruiz-Larroya T., et al. Epigenetic inactivation of the extracellular matrix metallopeptidase ADAMTS19 gene and the metastatic spread in colorectal cancer. Clinical Epigenetics. 2015;7:p. 124. doi: 10.1186/s13148-015-0158-1. [DOI] [PMC free article] [PubMed] [Google Scholar]
- 65.Ikari N., Serizawa A., Mitani S., Yamamoto M., Furukawa T. Near-comprehensive resequencing of cancer-associated genes in surgically resected metastatic liver tumors of gastric cancer. The American Journal of Pathology. 2019;189(4):784–796. doi: 10.1016/j.ajpath.2018.12.015. [DOI] [PubMed] [Google Scholar]
Associated Data
This section collects any data citations, data availability statements, or supplementary materials included in this article.
Data Availability Statement
The data used to support the findings of this study are available from the corresponding author upon request.


