Abstract
Mixed-metal cyanides (Cu1/2Au1/2)CN, (Ag1/2Au1/2)CN, and (Cu1/3Ag1/3Au1/3)CN adopt an AuCN-type structure in which metal-cyanide chains pack on a hexagonal lattice with metal atoms arranged in sheets. The interactions between and within the metal-cyanide chains are investigated using density functional theory (DFT) calculations, 13C solid-state NMR (SSNMR), and X-ray pair distribution function (PDF) measurements. Long-range metal and cyanide order is found within the chains: (−Cu–NC–Au–CN−)∞, (−Ag–NC–Au–CN−)∞, and (−Cu–NC–Ag–NC–Au–CN−)∞. Although Bragg diffraction studies establish that there is no long-range order between chains, X-ray PDF results show that there is local order between chains. In (Cu1/2Au1/2)CN and (Ag1/2Au1/2)CN, there is a preference for unlike metal atoms occurring as nearest neighbors within the metal sheets. A general mathematical proof shows that the maximum average number of heterometallic nearest-neighbor interactions on a hexagonal lattice with two types of metal atoms is four. Calculated energies of periodic structural models show that those with four unlike nearest neighbors are most favorable. Of these, models in space group Immm give the best fits to the X-ray PDF data out to 8 Å, providing good descriptions of the short- and medium-range structures. This result shows that interactions beyond those of nearest neighbors must be considered when determining the structures of these materials. Such interactions are also important in (Cu1/3Ag1/3Au1/3)CN, leading to the adoption of a structure in Pmm2 containing mixed Cu–Au and Ag-only sheets arranged to maximize the numbers of Cu···Au nearest- and next-nearest-neighbor interactions.
Short abstract
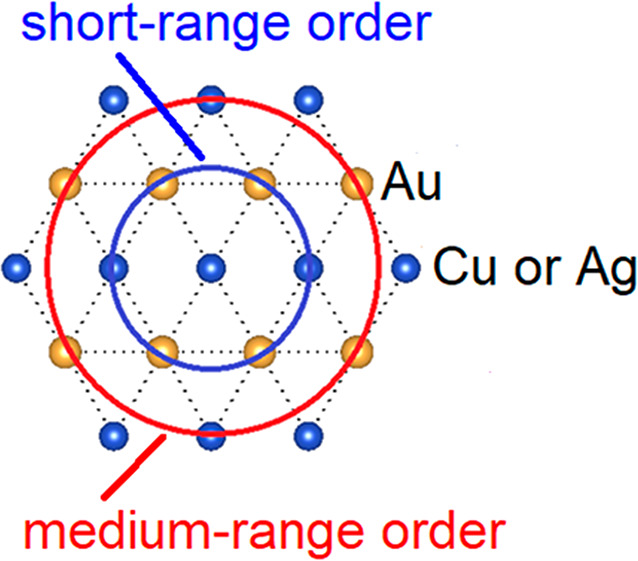
In Cu1/2Au1/2CN, Ag1/2Au1/2CN, and (Cu1/3Ag1/3Au1/3)CN, hexagonally packed [−Cu (Ag)−NC−Au−CN−] and (−Cu−NC−Ag−NC−Au−CN−) chains produce bimetallic layers in which the numbers of nearest- and next-nearest heterometallic interactions are locally maximized at four.
Introduction
The group 11 cyanides CuCN,1−4 AgCN,4−7 and AuCN4,8−10 and the bimetallic cyanides (Cu1/2Au1/2)CN, (Ag1/2Au1/2)CN, and (CuxAg1–x)CN,11,12 exhibit a surprising degree of structural complexity belied by their simple formula and apparently simple basic structures based on (−M–C≡N−) metal-cyanide chains. This complexity arises because a number of possible local inter- and intrachain arrangements can exist, all of which have similar energies. All of the group 11 cyanides form solids in which the metal-cyanide chains pack together on a hexagonal lattice, adopting one of two structure types, as shown in Figure 1. In AuCN, (Cu1/2Au1/2)CN, and (Ag1/2Au1/2)CN, the metal atoms occur in sheets. The adoption of this structure by AuCN has been ascribed to aurophilic interactions between Au atoms in neighboring chains,13 despite the fact that this metal alignment leads to unfavorable electrostatic interactions as the C and N atoms in neighboring chains are brought close together. HT-CuCN (high-temperature phase of CuCN),1 AgCN,5 and (CuxAg1–x)CN11 have a different structure in which the metal-cyanide chains are offset from each other in order to minimize the unfavorable electrostatic interactions. Theoretical calculations support this interpretation, showing that argentophilic and cuprophilic interactions are generally weaker than aurophilic interactions.14,15
Figure 1.
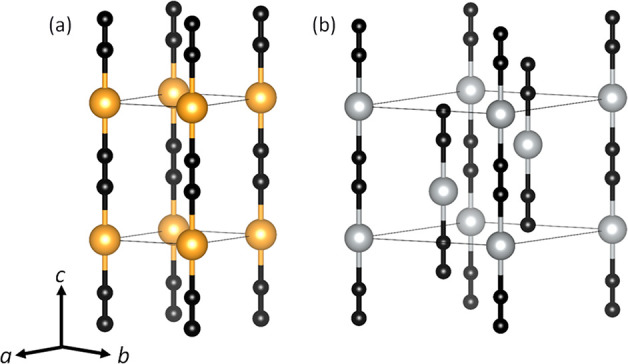
Structures of (a) AuCN and (b) AgCN. Key: Au and Ag atoms are represented by yellow and light-gray spheres, respectively. The cyanide groups show head-to-tail disorder and are represented by bonded black spheres.
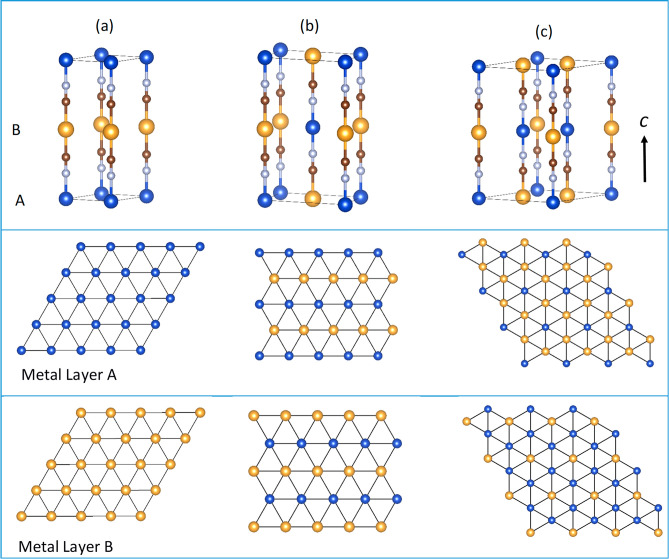
Although it might be assumed that aurophilic interactions are responsible for (Cu1/2Au1/2)CN and (Ag1/2Au1/2)CN adopting the AuCN structure, our previous neutron diffraction studies of these materials reached different conclusions.11Figure 2 shows three AuCN-based structural models for (Cu1/2Au1/2)CN and (Ag1/2Au1/2)CN: two in space group P6/mmm [P6/mmm{2} and P6/mmm{6}, where {n} denotes the number of (Cu1/2Au1/2)CN or (Ag1/2Au1/2)CN units in the unit cell] and one in Immm (denoted as Immm{4}). In the P6/mmm{2} structure, all of the nearest-neighbor metal interactions are homometallic, leading to distinct metal sheets containing exclusively Au and Cu (or Au and Ag). In both the Immm{4} and P6/mmm{6} structures, all of the metal sheets contain both Au and Cu (or Ag) atoms, with the number of heterometallic nearest-neighbor metal interactions averaging four. Four is the maximum average number of heterometallic interactions possible for two metal types in a hexagonally packed sheet, as is proven below.
Figure 2.
Three periodic structural models for (Cu1/2Au1/2)CN and (Ag1/2Au1/2)CN: (a) P6/mmm{2}, (b) Immm{4}, and (c) P6/mmm{6} corresponding to models A, G, and J, respectively, in Table 1. Key: Au, yellow; Cu or Ag, blue; C, brown; N, gray. The upper box shows unit cells and contents, and the middle and lower boxes show metal packing in the metal layers A and B. All of these models show cyanide ordering with the C end of the ligand bound to Au. Note: the average number of unlike nearest neighbors is four in both the Immm {4}and P6/mmm{6} models.
Our neutron diffraction work on (Ag1/2Au1/2)CN showed that the derived pair distribution is best accounted for by models in which nearest-neighbor heterometallic Ag···Au interactions, rather than Au···Au interactions, are maximized.11 Although the Immm{4} and P6/mmm{6} models both have the same average number of nearest-neighbor heterometallic interactions (i.e., four), they differ in the average number of unlike next-nearest metal neighbors. Unfortunately, using the neutron-diffraction-derived pair distribution function (PDF), it is not possible to determine which, if either, of the Immm{4} or P6/mmm{6} models gives a better description of the medium-range structure in (Ag1/2Au1/2)CN.11 In the case of (Cu1/2Au1/2)CN, IR and Raman spectroscopies showed that strict ordering of either (−Cu–NC–Au–CN−) or (−Cu–CN–Au–NC−) must occur in the chains. The neutron PDF allowed us to determine unequivocally that the C end of the cyanide ligand is attached to Au. Neutron PDF studies did not allow us to reach any conclusions regarding the preference for homometallic or heterometallic interactions upon packing of the chains in (Cu1/2Au1/2)CN. It should be emphasized that neither X-ray nor neutron Bragg diffraction helps in resolving which of the structures in Figure 2 gives the best description of the local- and medium-range order in (Ag1/2Au1/2)CN and (Cu1/2Au1/2)CN because of the lack of long-range order in the metal layers. This lack of long-range order means that the Bragg diffraction patterns of both (Ag1/2Au1/2)CN and (Cu1/2Au1/2)CN can be indexed using small hexagonal unit cells of dimensions similar to those determined for AuCN itself, with lattice parameter a equal to the interchain distance (∼3.4 Å) and lattice parameter c equal to the M–NC–Au distance (∼5 Å) rather than the M–NC–Au–CN–M chain repeat distance (∼10 Å).
Recently, Goodwin et al. used density functional theory (DFT) calculations to investigate the interactions between pairs of chains (−Ag–CN−), (−Au–CN−), and (−Ag–NC–Au–CN−) and the concomitant structural consequences for AgCN, AuCN, and (Ag1/2Au1/2)CN.12 Their results show that metallophilicity dominates in the case of AuCN, but ionic repulsions between C and N atoms in neighboring chains dominate in the case of AgCN. Furthermore, they found that heterometallic interactions are favored in the case of (Ag1/2Au1/2)CN, in agreement with our earlier neutron studies.11 In addition, they concluded that there is also a high degree of chain slippage in AgCN and AuCN, which is consistent with our earlier determinations of chain slipping in AgCN5 and AuCN,8 made using neutron Bragg diffraction (via displacement parameters) and reverse Monte Carlo (RMC) modeling of combined neutron Bragg diffraction and PDF.4
We have recently prepared a trimetallic cyanide, (Cu1/3Ag1/3Au1/3)CN, which also adopts an AuCN-related structure.1613C solid-state NMR (SSNMR), DFT calculations, and a preliminary analysis of synchrotron X-ray PDF data established that the metal-cyanide chains are ordered as (−Cu–NC–Ag–NC–Au–CN−). This compound is unusual in that, unlike all of the group 11 parent and binary metallic cyanides, MCN, and (MxM′1–x)CN (M = Cu, Ag, Au), which exhibit negative thermal expansion along the chains, it exhibits positive thermal expansion in this direction. The origin of this behavior has been investigated using DFT and inelastic neutron scattering.16
The principal concern of this paper is with the computational and experimental determinations of the inter- and intrachain order in the heterometallic cyanides (Cu1/2Au1/2)CN and (Ag1/2Au1/2)CN. Here we report the results for (Cu1/2Au1/2)CN and (Ag1/2Au1/2)CN, determined using X-ray PDF from synchrotron data, DFT calculations, and 13C SSNMR. The 13C NMR studies show unequivocally that, in both compounds, the C end of the cyanide group is bound to Au, giving ordered chains of the form (−Cu–NC–Au–CN)– and (−Ag–NC–Au–CN)–. DFT calculations confirm these senses of cyanide ordering within the chains.
Furthermore, DFT calculations show that, upon packing of the chains, the energy is lowered as the number of nearest-neighbor heterometallic interactions within the metallic layers increases up to four. Further, it is proven mathematically that the maximum possible average number of such unlike interactions is indeed four.
We also show, using X-ray PDF studies for (Cu1/2Au1/2)CN and (Ag1/2Au1/2)CN, that not only is the maximum number of nearest-neighbor heterometallic interactions within the metallic layers of four achieved locally but also next-nearest neighbor interactions are important in determining which of the possible structures is adopted. We also show that achieving the maximum number of unlike Cu···Au nearest-neighbor interactions and unlike Cu···Au next-nearest-neighbor interactions between chains determines the local- and medium-range order in the new trimetallic compound (Cu1/3Ag1/3Au1/3)CN.
Results and Discussion
Intrachain Order in (Cu1/2Au1/2)CN, (Ag1/2Au1/2)CN, (Cu1/3Ag1/3Au1/3)CN, and AuCN from 13C SSNMR
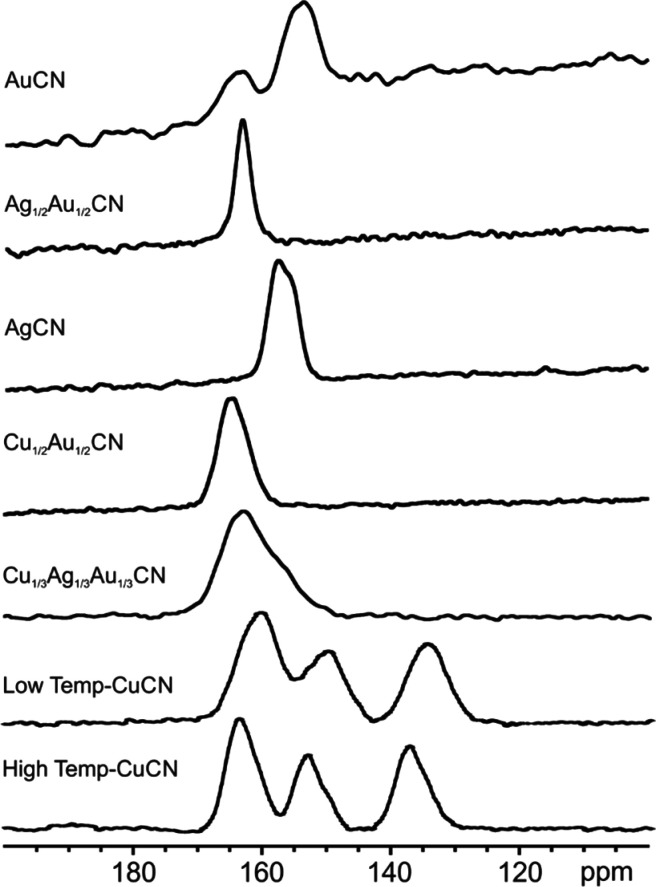
Figure 3 shows the isotropic peaks of the 13C SSNMR spectra of (Cu1/2Au1/2)CN, (Ag1/2Au1/2)CN, and (Cu1/3Ag1/3Au1/3)CN, together with those of the parents HT-CuCN and LT-CuCN, AgCN, and AuCN (see also section S.8 for the 13C DEPTH spectra42). The 13C NMR spectra of HT-CuCN and LT-CuCN are similar. This is not unexpected because both forms of copper cyanide contain (−Cu–CN–Cu−) chains. The greater width of the resonances in LT-CuCN is understandable because, in this polymorph, the copper-cyanide chains adopt a wavelike configuration with five crystallographically distinct C sites present.3 The multiplet structure in both polymorphs of CuCN arises from 13C coupling to the 63/65Cu nuclei with I = 3/2. The relative intensities of these three peaks have been explained previously by Kroeker et al.,17 assuming linear chains as found in HT-CuCN, but a comparison of their experimental spectrum with ours (Figure 3) suggests that the data were collected on LT-CuCN. In the 13C NMR spectrum of (Cu1/2Au1/2)CN, only a single peak with a chemical shift of 164.42 ppm is observed, showing unequivocally that the C end of the cyanide ligand is always bound to Au and the metal cyanide chains are of the form (−Cu–NC–Au–CN−)∞. This orientation of the cyanide ligand confirms the conclusion drawn from our neutron PDF studies.11 In the 13C NMR spectrum of AgCN, the splitting of the resonance at around 157 ppm arises from coupling to the two isotopes 107Ag and 109Ag.6 The absence of this splitting in the 13C NMR spectrum of (Ag1/2Au1/2)CN confirms that, in this compound, the C end of the CN ligand is again attached to Au, yielding chains of the form (−Ag–NC–Au–CN−)∞, as we also proposed in our neutron PDF study.11 The chemical shifts of 164.42 and 163.12 ppm observed in the spectra of (Cu1/2Au1/2)CN and (Ag1/2Au1/2)CN, respectively, are therefore ascribed as arising from C attached to Au atoms in (−NC–Au–CN−) units. It seems reasonable to assign the resonance in AuCN at 163 ppm to 13C in (−NC–Au–CN−) units and that at 153.63 ppm to 13C bound to Au in (−CN– Au–CN−) units. This interpretation contrasts with that of Washylishen et al., who, although they observed a similar 13C NMR spectrum for one of the polymorphs of AuCN, ascribed the different resonances as arising from a significant number of neighboring chains being realigned as in the AgCN structure.18 The extreme degree of chain realignment proposed by Wasylishen et al. is not observed in the neutron PDF studies and is of a completely different magnitude from the chain slippage observed in those experiments.4,8 The 13C NMR spectrum reported previously for (Cu1/3Ag1/3Au1/3)CN is consistent with chains having the form (−Cu–NC–Ag–NC–Au–CN−)∞, with C bonded to Au and Ag and not to Cu.16 The chemical shifts of 163 and 157 ppm are ascribed to 13C in (NC–Au–CN) units and the C attached to Ag in (NC–Ag–NC) units, respectively.
Figure 3.
13C SSNMR spectra of AuCN, (Ag1/2Au1/2)CN, AgCN, (Cu1/2Au1/2)CN, (Cu1/3Ag1/3Au1/3)CN, LT-CuCN, and HT-CuCN showing only the isotopic peaks.
Construction of Structural Models for (Cu1/2Au1/2)CN, (Ag1/2Au1/2)CN, and (Cu1/3Ag1/3Au1/3)CN
To examine interchain order in (Cu1/2Au1/2)CN, (Ag1/2Au1/2)CN, and (Cu1/3Ag1/3Au1/3)CN, periodic structural models were built. We used periodic models because these are computationally accessible for the DFT calculations described below.
It is well-known that it is possible to color the hexagonal lattice with three colors in such a way that nearest neighbors are always of different colors. That is to say, the maximum number of unlike nearest neighbors of six is achieved for each color. With two colors, or, as in this paper, two atom types, the average number (suitably defined) of unlike nearest neighbors must be lower than six. Experimenting with different colorings suggested that the maximum average number of unlike nearest neighbors possible is four. A proof that four is indeed the maximum average number of unlike nearest neighbors for a two-coloring of the hexagonal lattice is given in section S2.
In this paper, we make use of these results in our modeling of the bimetallic systems (Cu1/2Au1/2)CN and (Ag1/2Au1/2)CN to create models with an average of four unlike neighbors and also of the known three-coloring result for construction of a model in R3m for the trimetallic system (Cu1/3Ag1/3Au1/3)CN to maximize the number of unlike nearest neighbors at six.
(Cu1/2Au1/2)CN and (Ag1/2Au1/2)CN
A total of 10 periodic models for (Cu1/2Au1/2)CN and (Ag1/2Au1/2)CN, with different average numbers of homometallic and heterometallic nearest neighbors within the metal layers and different numbers of next- and next-next-nearest homometallic nearest neighbors (Table 1, models A–J, and sections S.3 and S.5), were constructed for use in DFT calculations and to test against the X-ray-derived PDF data. For DFT calculations, two versions of each model were constructed, both with strict metal alternation down the chains, in accordance with our previous vibrational spectroscopy results.11 One version of each model had the CN ligand bonding with C attached to Au in (−NC–Au–CN−) units, and the other had N attached to Au in (−CN–Au–NC−) units.
Table 1. Interchain Correlations in Different Periodic Structural Models Defined by the Metal–Metal Relationships within the Metal Layers in (Cu1/2Au1/2)CN and (Ag1/2Au1/2)CNa.
| average
no. of nearest-metal neighbors |
average
no. of next-nearest-metal neighbors |
average
no. of next-next-nearest-metal neighbors |
|||||
|---|---|---|---|---|---|---|---|
| structural model | space group | hetero- | homo- | hetero- | homo- | hetero- | homo- |
| A | P6/mmm{2}b | 0c | 6c | 0c | 6c | 0c | 6c |
| B | Am2m{8} | 2c | 4c | 4c | 2c | 4c | 2c |
| C | Cmmm{12} | 22/3 | 31/3 | 4 | 2 | 22/3 | 31/3 |
| D | Pmmm{12} | 22/3 | 31/3 | 4c | 2c | 4 | 2 |
| E | Pmmm{8} | 3 | 3 | 2 | 4 | 2 | 4 |
| F | C2/m{16} | 3c | 3c | 4c | 2c | 4c | 2c |
| G | Immm{4} | 4c | 2c | 4c | 2c | 0c | 6c |
| H | Pmnm{12} | 4 | 2 | 11/3 | 42/3 | 4 | 2 |
| I | Amam{8} | 4c | 2c | 2c | 4c | 4c | 2c |
| J | P6/mmm{6} | 4 | 2 | 0c | 6c | 4 | 2 |
See sections S.3 and S.5 for details of models.
{n} denotes the number of (Cu1/2Au1/2)CN or (Ag1/2Au1/2)CN units in the unit cell.
In these cases, these average values are also the actual values for each metal atom.
Considering the metal atoms, there is only one model possible in which the sheets are homometallic. This is shown in Figure 2 as model P6/mmm{2} (A). In this model, the number of Au···Au nearest-neighbor interactions is maximized (at six) and the number of heterometallic nearest neighbors is minimized (at zero). This is the structure expected if aurophilic interactions are responsible for driving (Cu1/2Au1/2)CN and (Ag1/2Au1/2)CN to adopt AuCN-type structures.
Further models were constructed with up to four heterometallic nearest neighbors in each layer. A mathematical proof that the maximum average number of unlike neighbors that can be reached in a hexagonal tiling with two colors is four is given in the section S.2. This maximum number of four unlike nearest neighbors can be achieved in a number of ways: for example, in Immm{4} (G), Pmnm{6} (H), Amam{8} (I), and P6/mmm{6} (J) (Table 1). It should be noted, however, that these arrangements differ in the numbers of next-nearest heterometallic neighbors they possess. Additional models with average numbers of heterometallic nearest neighbors of 2, 22/3, and 3 (B–F) were also constructed for comparison and are shown in Table 1 and section S.3.
(Cu1/3Ag1/3Au1/3)CN
The DFT and X-ray PDF results for the bimetallic phases (Cu1/2Au1/2)CN and (Ag1/2Au1/2)CN informed the model construction for the trimetallic phase (Cu1/3Ag1/3Au1/3)CN. Four models constructed from (−Cu–NC–Ag–NC–Au–CN−)∞ chains packed on a hexagonal lattice were developed. Three of these were considered in our previous paper on the inelastic neutron scattering and DFT studies of atomic motion and thermal expansion properties of (Cu1/3Ag1/3Au1/3)CN.16 These structural models (K–M in Table 2 and section S.6) are, like those of (Cu1/2Au1/2)CN and (Ag1/2Au1/2)CN, derived from that of AuCN, with metal atoms occurring in sheets.
Table 2. Interchain Correlations in Different Periodic Structural Models Defined by the Metal–Metal Relationships within the Metal Layers in (Cu1/3Ag1/3Au1/3)CN for Cu, Ag, and Au Atomsa.
| nearest-metal
neighbors (r ∼ 3.4 Å) |
next-nearest-metal
neighbors (r ∼ 5.8 Å) |
next-next-nearest-metal
neighbors (r ∼ 6.8 Å) |
|||||
|---|---|---|---|---|---|---|---|
| structural model | space group | hetero- | homo- | hetero- | homo- | hetero- | homo- |
| K | P6mm{1}b | 0 | 6 Cu···Cu | 0 | 6 Cu···Cu | 0 | 6 Cu···Cu |
| 6 Ag···Ag | 6 Ag···Ag | 6 Ag···Ag | |||||
| 6 Au···Au | 6 Au···Au | 6 Au···Au | |||||
| L | R3m{3} | 6 Cu···Ag | 0 | 0 | 6 Cu···Cu | 6 Cu···Ag | 0 |
| 6 Cu···Au | 6 Ag···Ag | 6 Cu···Au | |||||
| 6 Ag···Au | 6 Au···Au | 6 Ag···Au | |||||
| M | Pmm2{2}, Cu–Au layers and Ag-only layers | 8 Cu···Au | 6 Ag···Ag | 8 Cu···Au | 6 Ag···Ag | 0 | 6 Cu···Cu |
| 2 Cu···Cu | 2 Cu···Cu | 6 Ag···Ag | |||||
| 2 Au···Au | 2 Au···Au | 6 Au···Au | |||||
| N | Pmm2{2}, Ag–Au layers and Cu-only layers | 8 Ag···Au | 6 Cu···Cu | 8 Ag···Au | 6 Cu···Cu | 0 | 6 Cu···Cu |
| 2 Ag···Ag | 2 Ag···Ag | 6 Ag···Ag | |||||
| 2 Au···Au | 2 Au···Au | 6 Au···Au | |||||
See section S.6 for details of models.
{n} denotes the number of (Cu1/3Ag1/3Au1/3)CN units in the unit cell.
Model K, containing only homometallic sheets, was constructed in space group P6mm, model L, which maximizes heterometallic atom nearest neighbors and with each metal having three nearest neighbors of the other type, in R3m, and model M, containing mixed Cu–Au sheets of the type found in the Immm (G) structure of (Cu1/2Au1/2)CN, together with additional Ag-atom-only sheets, in Pmm2. In this work, we also constructed a second model in Pmm2 (model N) with the same chain order of (−Cu–NC–Ag–NC–Au–CN−) but containing mixed Ag–Au sheets and Cu-only sheets (section S.6).
DFT Results for (Cu1/2Au1/2)CN, (Ag1/2Au1/2)CN, and (Cu1/3Ag1/3Au1/3)CN
(Cu1/2Au1/2)CN and (Ag1/2Au1/2)CN
Total-energy DFT calculations were performed on the 10 periodic structural models constructed for (Cu1/2Au1/2)CN and (Ag1/2Au1/2)CN (A–J in Table 1 and section S.4) using three different theoretical approaches. In the first approach, van der Waals’ (vdW) interactions were not included in the calculations (no-vdW). Then as a route to incorporating weak aurophilic and argentophilic interactions, vdW interactions were considered and approximated using two DFT-based schemes, vdW-119 and vdW-220,21 (see the Computational Details section). The rationale behind the inclusion of vdW interactions is given in the section S.4. Such an approach has been applied previously to other heavy-metal cyanide materials22,23 and Au dimers,24 as well as metal–organic frameworks.25
For all of the models (A–J) for (Cu1/2Au1/2)CN and (Ag1/2Au1/2)CN, the energies of both CN binding possibilities along the chains, i.e., CN bonding to Au as (−NC–Au–CN–M) and as (−CN–Au–NC–M), were calculated (section S.4 and Tables S.3 and S.4). The results from all three DFT approaches show that, in the case of (Cu1/2Au1/2)CN, models containing (−Cu–NC–Au–CN−)-ordered chains are ∼0.33 eV per formula unit more stable than those containing (−Cu–CN–Au–NC−) chains and, in the case of (Ag1/2Au1/2)CN, models containing (−Ag–NC–Au–CN−)-ordered chains are ∼0.26 eV more stable than those containing (−Ag–CN–Au–NC−) chains. These results are consistent with those obtained previously from vibrational spectroscopy,11 which showed that the cyanide groups are fully ordered in these systems and support our conclusions from NMR and neutron diffraction, i.e., that the C end of the cyanide ligand is bound to Au in both compounds. Subsequent discussion will only therefore consider models containing (−Cu–NC–Au–CN−)- and (−Ag–NC–Au–CN−)-ordered chains.
Using the three DFT approaches, the calculations for both (Cu1/2Au1/2)CN and (Ag1/2Au1/2)CN give consistent results and show that the total energy decreases as the number of heterometallic nearest neighbors, N, increases from 0 to 4. Variations of the relative energies with N for (Cu1/2Au1/2)CN and (Ag1/2Au1/2)CN, calculated using the vdw-2 scheme,19,20 are compared in Figure 4 and show decreases in energy of 0.0461 and 0.0426 eV per formula unit, respectively, upon moving from homometallic layers (model A for both Cu- and Ag-containing compounds) to the most stable models, which have four heterometallic nearest neighbors, namely, model J for (Cu1/2Au1/2)CN and model I for (Ag1/2Au1/2)CN. (The results from calculations using no-vdW and vdW-1 are shown in Figures S.3 and S.4 and Tables S.1 and S.2.) Our findings are in agreement with the DFT calculations for (Ag1/2Au1/2)CN by Goodwin et al.,12 but these authors only considered the alignment of pairs of (Ag1/2Au1/2)CN chains and concluded that the heterometallic alignment of chain pairs is favored relative to the homometallic alignment. In the present work, we have applied DFT calculations to the extended solid (Ag1/2Au1/2)CN, and the results support our earlier findings from neutron diffraction studies for (Ag1/2Au1/2)CN, i.e., that heterometallic layers are favored. Furthermore, our DFT calculations show for the first time that (Cu1/2Au1/2)CN behaves similarly to (Ag1/2Au1/2)CN in favoring heterometallic interactions between chains. Indeed, the change in energy as a function of N is almost identical for the two compounds.
Figure 4.
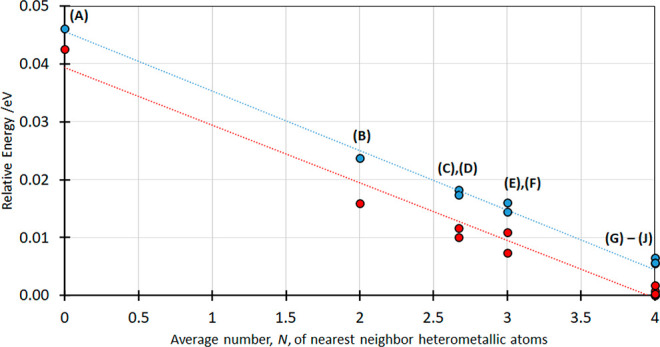
Scaled energies per formula unit of (Cu1/2Au1/2)CN (blue circles) and (Ag1/2Au1/2)CN (red circles) for the different crystallographic models (A–J) plotted as a function of the number of nearest-neighbor heterometallic atoms, N, relative to the model with the lowest energy. Values are taken from Table S.5 using DFT vdW-2 calculations.
For both (Cu1/2Au1/2)CN and (Ag1/2Au1/2)CN, the models with four heterometallic nearest neighbors (G–J) have the lowest energy. However, the energy differences between these different models with N = 4 are, for both bimetallic compounds, very small: a difference of only 0.0065 eV per formula unit is calculated between the (Cu1/2Au1/2)CN models and of 0.0018 eV between the (Ag1/2Au1/2)CN models (Table S.5). Thus, DFT does not give a clear preference for one of these models (G–J), being the correct description of the short- and medium-range order in the real materials or, indeed, if any one of them in isolation is an adequate representation. To test the conclusion from DFT calculations that the number of heterometallic nearest-neighbor atoms in both (Cu1/2Au1/2)CN and (Ag1/2Au1/2)CN, N, is equal to 4 and also to determine which of the periodic structures (G–J) best describes the short- and medium-range order in these materials, X-ray PDF studies were undertaken.
(Cu1/3Ag1/3Au1/3)CN
Total-energy DFT calculations were performed on the four periodic structural models constructed for (Cu1/2Ag1/2Au1/2)CN (K–N in Table 3) using the PBE-D3 method as described previously.16
Table 3. Total Energy (eV) per Formula Unit (Three Atoms) of the Four Models (K–N) for (Cu1/3Ag1/3Au1/3)CN Relative to the Model with the Lowest Energy, Calculated Using the PBE-D3 Method16.
| Ka | La | Ma | N | |
|---|---|---|---|---|
| space group | P6mm{1} | R3m{3} | Pmm2{2} (mixed Cu–Au layers) | Pmm2{2} (mixed Ag–Au layers) |
| total energy/eV | –20.2394 | –20.2739 | –20.2665 | –20.2586 |
| relative energy/eV | 0.0345 | 0 | 0.0074 | 0.0154 |
Results for models K–M from ref (16). See section S.6 for model details.
The DFT results for the trimetallic cyanide (Cu1/3Ag1/3Au1/3)CN place the model with homometallic layers, K, at much higher energy than the other models. Model L, corresponding to the three coloring of the hexagonal lattice, has the lowest energy with models M and N, which maximize the number of heterometallic interactions involving Au lying slightly higher in energy. The DFT results suggest that it is highly improbable that model K is a good description of the structure of (Cu1/3Ag1/3Au1/3)CN. However, the energies of the remaining models are close. Fortunately, examination of the X-ray PDF provides a tool to discriminate between these models.
X-ray PDFs and the Structures of (Cu1/2Au1/2)CN, (Ag1/2Au1/2)CN, and (Cu1/3Ag1/3Au1/3)CN
X-ray scattering from (Cu1/2Au1/2)CN, (Ag1/2Au1/2)CN, and (Cu1/3Ag1/3Au1/3)CN is dominated by scattering from the metal atoms, and the resulting PDFs (X-ray PDF) are much more sensitive to different metal arrangements and associated chain packings than those determined using neutron diffraction (neutron PDF) and enable the preferred models from the DFT calculations to be distinguished.
(Cu1/2Au1/2)CN and (Ag1/2Au1/2)CN
The differences between models with different numbers of heterometallic near neighbors should be distinguishable in the X-ray PDF particularly in the case of (Cu1/2Au1/2)CN, where the atomic form factors for Cu (Z = 29) and Au (Z = 79) differ significantly. This is in marked contrast to our neutron diffraction experiments,11 where the almost equal coherent neutron scattering lengths (Cu, b = 7.718 fm; Au, b = 7.63 fm)26 prevented us from reaching any conclusions about the distribution of Cu and Au within the metal layers.
The principal metal-based correlations that contribute to peaks in D(r) for (Cu1/2Au1/2)CN and (Ag1/2Au1/2)CN are summarized in Table 4, with reference to the distances indicated in Figure 5.
Table 4. Metal–Metal Contributions to Peaks in D(r) for (Cu1/2Au1/2)CN and (Ag1/2Au1/2)CNa.
| r/Å | metal···metal relationship at distance r | arrow shown on Figure 5 |
|---|---|---|
| ∼3.35 | M···M nearest neighbors within a layer | a |
| ∼4.96 | Cu–N≡C–Au along the a chain | b |
| ∼5.18 | Ag–N≡C–Au along the a chain | b |
| ∼5.80 | M···M next-nearest neighbors within a layer | c |
| ∼5.98 | Cu/Au···Cu/Au nearest metals in adjacent chains lying above and below the layer | d |
| ∼6.17 | Ag/Au···Ag/Au nearest metals in adjacent chains lying above and below the layer | d |
| ∼6.70 | M···M next-next-nearest neighbors within a layer | e |
| ∼7.70 | M···M in next-next-nearest chains lying above and below the layer | f |
M···C and M···N correlations are also significant; for example, peaks observed at just over 4 Å involve only correlations of these types. Such correlations also make contributions to some of the peaks assigned above and need to be included to calculate D(r).
Figure 5.
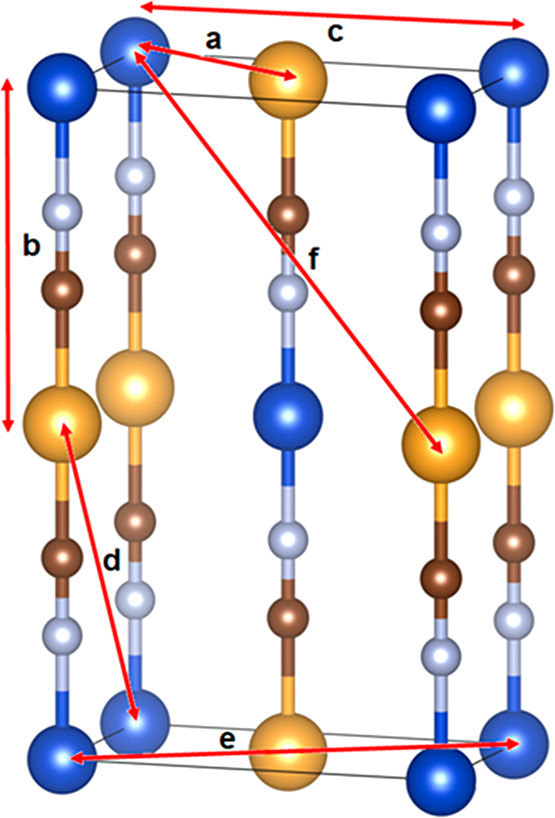
Structure of (M1/2Au1/2)CN (M = Cu, Ag) in Immm{4} (model G). Red arrows indicate the M···M relationships corresponding to the distances referred to in Table 4. Key: as in Figure 2.
Thus, upon examination of the X-ray PDFs for (Cu1/2Au1/2)CN and (Ag1/2Au1/2)CN shown in Figure 6, model A, with homometallic metallic layers (Tables S.6 and S.7), can be ruled out immediately because both fits are poor. This conclusion agrees with the DFT results, above which it is shown that homometallic layers are unfavorable for both (Cu1/2Au1/2)CN and (Ag1/2Au1/2)CN. Simply by considering the intensities of the peaks centered at around 3.4 Å in each pattern, where the principal contributions are M···M nearest neighbors within a layer, gives information on the number of unlike nearest metal neighbors. In both cases, the best fit to this peak occurs with four unlike neighbors (N = 4). However, fixing the average number of heterometallic near neighbors at a value of 4 does not determine the long- or, indeed, medium-range structures of (Cu1/2Au1/2)CN and (Ag1/2Au1/2)CN. The average value of 4 can be achieved either in ordered structures, for example, those described in space groups Immm{4} (G), Pmnm{12} (H), Amam{8} (I), and P6/mmm{6} (J) (Table 1) or in models without long-range order. Here we consider only the periodic models shown in Table 1. The reason for doing this is that, considering next-nearest-neighbor interactions, there are two limiting cases, namely, maximizing the number of unlike next-nearest-neighbor interactions, which forces the mixed-metal cyanides to adopt the Immm{4} structure, or maximizing the number of like next-nearest-neighbor interactions, which imposes the P6/mmm{6} structure.
Figure 6.
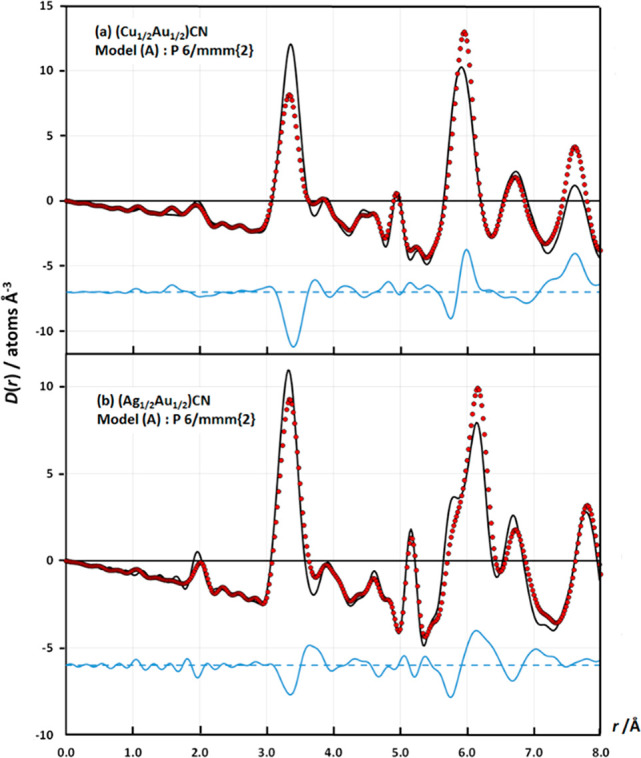
Final fits to the medium-r region of the X-ray correlation function, D(r), for (a) (Cu1/2Au1/2)CN and (b) (Ag1/2Au1/2)CN using model A, P6/mmm{2}. The poor fits [RD(r)(0.0–8.0 Å) = 0.3416 for part a and 0.2167 for part b] confirm that the structures of the mixed-metal cyanides do not contain homometallic layers. Key: experimental data, D(r)exp, red circles; fits, D(r)calc, continuous black lines; difference plots, D(r)exp – D(r)calc, displaced continuous blue lines. Note: R factors calculated using RD(r) = [∑|Yi(obs) – Yi(calc)|2/Yi(obs)2]1/2.
The X-ray PDFs show that the local- and medium-range orders for both (Cu1/2Au1/2)CN and (Ag1/2Au1/2)CN are best described by the Immm{4} model, G (Figure 7). A feature of the Immm{4} model is that there are no M···M heterometallic next-next-nearest neighbors within a layer, whereas the other models (H–J) all have four heterometallic next-next-nearest neighbors within a layer. This difference in the type of next-next-nearest neighbors thus allows discrimination between the different N = 4 models and is especially clear-cut in the case of (Cu1/2Au1/2)CN (Figures S.9 and S.10).
Figure 7.
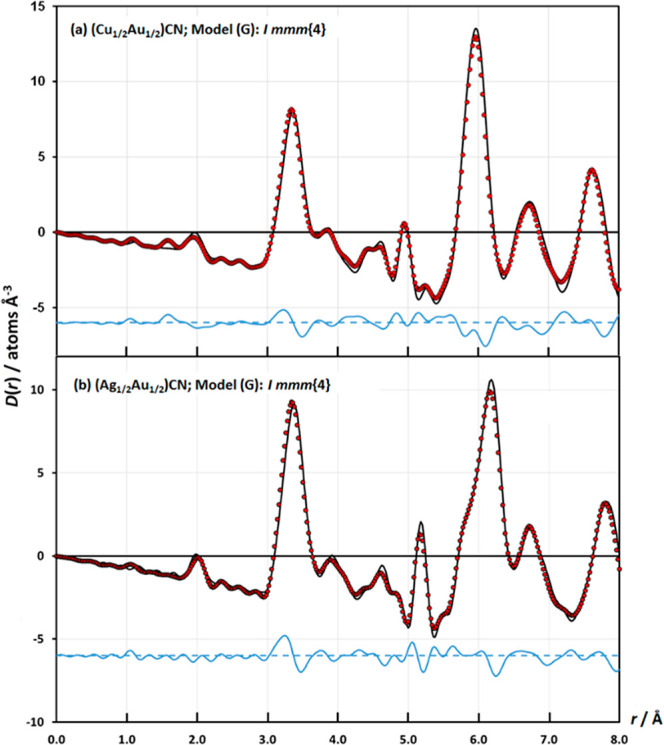
Final fits to the medium-r region of the X-ray correlation function, D(r), for (a) (Cu1/2Au1/2)CN and (b) (Ag1/2Au1/2)CN in Immm{4} (model G), which gives the best fits to the experimental data [RD(r)(0.0–8.0 Å) = 0.1361 for (a) and 0.1290 for (b)]. Key and R-factor calculation as in Figure 6.
The fact that the Immm{4} model provides such a good description of the short- and medium-range order in (Cu1/2Au1/2)CN and (Ag1/2Au1/2)CN shows that interactions beyond those between neighboring chains are important. However, although the combination of the nearest- and next-nearest interactions between chains is sufficient to determine the short- and medium-range order, the strength of these interactions does not produce order on a sufficiently long-range length scale so as to affect the Bragg diffraction pattern. No superlattice peaks are seen in the powder X-ray diffraction (PXRD) patterns of the two cyanides (Figures S.1 and S.2), which can be indexed on simple hexagonal cells (Table 4). This lack of long-range order is reminiscent of the results found by Zehe et al. in their single-crystal studies of columnar molecular crystals, which also crystallize as hexagonally packed chains.27 In these materials, next-nearest-neighbor interactions were also shown to be important but again do not produce long-range order.
(Cu1/3Ag1/3Au1/3)CN
Examination of the X-ray PDF of (Cu1/3Ag1/3Au1/3)CN shows that the model built in P6mm (K) containing three homometallic sheets can immediately be rejected because it is a poor description of the local order. This conclusion was also reached in our previous paper16 because, in this model, the large number of Au–Au nearest neighbors produces far too much intensity in the peak centered around ∼3.35 Å corresponding to the distance between nearest-neighbor metals in the metal sheets. This result also tallies with those from DFT calculations, which found the energy of the P6mm structure to be significantly higher than that for the other three structures (L–N in Table 2). The energies calculated for (Cu1/3Ag1/3Au1/3)CN adopting the R3m (L) and Pmm2 (M) structures differ by only 0.0074 eV per formula unit with the R3m (L) structure lying at lower energy. The additional structure in Pmm2 (N), with the same distribution of Au atoms in the metal sheets as model M but with mixed Ag–Au and Cu-only layers, has a higher calculated energy than M.
Determining which of the models, L, M, or N, gives the best description of the local- and medium-range order is something that can be achieved using X-ray PDF studies but only by going to higher r (i.e., 7.0 Å) than was reported in our previous study.16 Extending the maximum r examined to 7.0 Å means that the contribution of the highly significant M···M correlations between next-next-nearest neighbors at ∼6.75 Å is included in the calculation of the X-ray PDF. As we found above when examining possible structures for the bimetallic compounds, (Cu1/2Au1/2)CN and (Ag1/2Au1/2)CN, inclusion of next-next-nearest metal neighbors is a powerful discriminator between structures. This is also applicable in the case of (Cu1/3Ag1/3Au1/3)CN because, in the R3m (L) structure, Au has three Cu and three Ag atoms as next-next-nearest-metal neighbors, whereas in Pmm2 (M and N), each Au atom has six Au atoms as next-next-nearest-metal neighbors (Figure 8). This consideration shows that the R3m (L) model cannot account for the X-ray scattering from (Cu1/3Ag1/3Au1/3)CN when we examine the experimental PDF to higher r and therefore can be discounted. The calculated PDF from the Pmm2 (M) structure, with the Au atoms in sheets of the type found in (Cu1/2Au1/2)CN, is in good agreement with the experimental PDF (Figure 9). It should be noted that the alternative model constructed in Pmm2, model N, gave a slightly worse fit to the X-ray PDF than model M.
Figure 8.
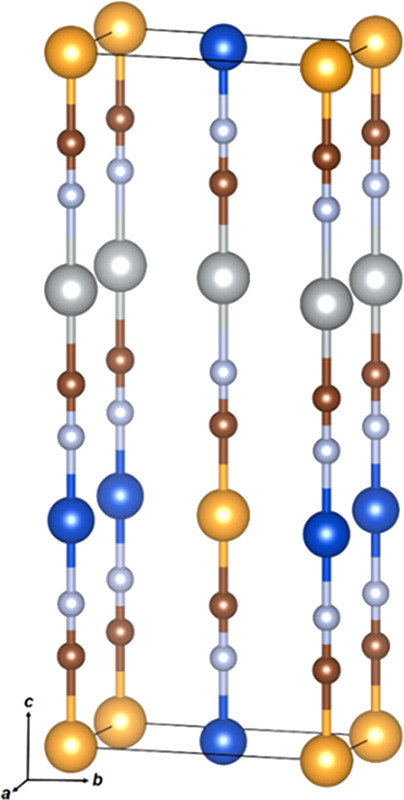
Structural model (M) for (Cu1/3Ag1/3Au1/3)CN in Pmm2 (lattice parameters: a = 3.39 Å, b = 5.87 Å, and c = 15.01 Å). Key: Au, yellow; Ag, silver; Cu, blue; C, brown; N, gray.
Figure 9.
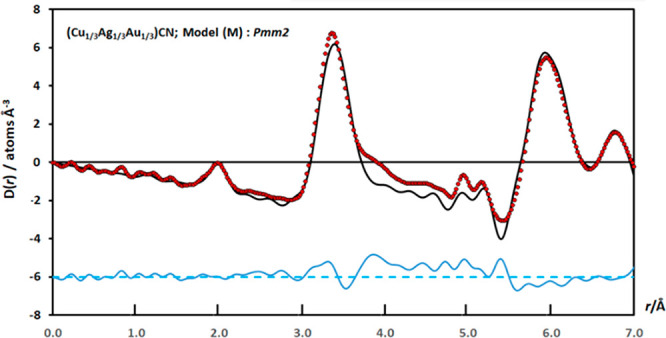
Final fits to the medium-r region of the X-ray correlation function, D(r), for (Cu1/3Ag1/3Au1/3)CN using model M in Pmm2, which gives the best fits to the experimental data [RD(r)(0.0–7.0 Å) = 0.2055]. Key and R-factor calculation as in Figure 6.
Thus, it appears that, as in the case for (Cu1/2Au1/2)CN and (Ag1/2Au1/2)CN, interactions beyond those of nearest neighbors appear to be important in determining the local- and medium-range order in (Cu1/3Ag1/3Au1/3)CN. This would account for the fact that structure L, which has the lowest predicted energy in DFT calculations, is not adopted. Structures M and N in Pmm2 both produce heterometallic next-nearest neighbors within the metal-atom sheets, in contrast to structure L, in which only homometallic next-nearest-neighbor interactions occur. In structures M and N, the number of heterometallic nearest and next-nearest neighbors within the bimetallic sheets is maximized at four, as it is in the (Cu1/2Au1/2)CN and (Ag1/2Au1/2)CN materials. The DFT calculations show that nearest-neighbor Cu···Au interactions are more favorable than Ag···Au interactions, with structure M lying at lower energy than structure N, and this explains why structure M is the one adopted.
Conclusion
The aim of this work was to investigate the intra- and interchain order in the mixed group 11 cyanides (Cu1/2Au1/2)CN, (Ag1/2Au1/2)CN, and (Cu1/3Ag1/3Au1/3)CN. The absence of long-range order means that standard Bragg diffraction techniques are inadequate for the study of the local- and medium-range order in these materials. In this work, we therefore turned to computational, i.e., DFT, methods, together with SSNMR and PDF determination using X-ray diffraction and modeling to establish chain ordering.
DFT-based calculations and SSNMR measurements show that (Cu1/2Au1/2)CN and (Ag1/2Au1/2)CN contain ordered metal cyanide chains of the form (Cu–NC–Au–CN−)∞ and (Ag–NC–Au–CN−)∞, respectively. In both compounds, these chains are packed on a hexagonal lattice, with the metal atoms lying in sheets. DFT calculations and X-ray PDF measurements show that the chains pack so as to tend to maximize, at four, the number of unlike nearest-metal neighbors within individual metal sheets. Of the many different ways that this can be achieved, it was found that a model constructed in space group Immm, which also maximized the number of unlike next-nearest neighbors, gave the best description of the short- and medium-range order in the two cyanides, revealing the importance of interactions beyond those of nearest neighbors. This result illustrates the importance of combining DFT studies with experimental work.
In the related trimetallic compound (Cu1/3Ag1/3Au1/3)CN, SSNMR measurements previously established that the compound consists of metal-cyanide chains ordered in the form (Cu–NC–Ag–NC–Au–CN−)∞.16 Analyzing the X-ray PDF measurement over the range r = 0.0–7.0 Å, instead of r = 0.0–6.5 Å as was done previously,16 enabled an unequivocal conclusion to be drawn that the structure in R3m, in which the number of heterometallic nearest neighbors is maximized at six and which is found to have the lowest energy from DFT calculations, does not provide a good description of the structure. It is found instead that the short- and medium-range order in this material is best described by a structure in Pmm2 with mixed Cu–Au sheets, similar to those found in (Cu1/2Au1/2)CN, together with Ag-only sheets. The energy of this structure was found to be only slightly higher in DFT calculations than that found for the R3m structure. In the Pmm2 structure, the number of Cu···Au nearest neighbors is maximized at four, and the number of Cu···Au next-nearest neighbors is also maximized at four. This latter observation shows that, as in the case of the bimetallic compounds, interactions beyond those of nearest neighbors are significant in determining the packing of the chains and, hence, the structure adopted. It should be noted that maximizing the number of Cu···Au nearest neighbors does not imply that it is only metal–metal interactions that are important or that these interactions are covalent in nature. Interchain interactions between the nonmetal atoms, C and N, are also important, and electrostatic interactions are the likely cause of the ordering of next-nearest-neighbor chains.
For such apparently simple systems, the one-dimensional metal cyanides are surprisingly complex, and there remain further complexities to untangle, for example, both the intra- and interchain ordering in the (CuxAg1–x)CN materials,11 which, unlike the mixed Cu–Au and Ag–Au cyanides that show a complete range of solid solutions, are currently under investigation.
Experimental Section
Sample Preparation
Sample preparations are based on those described previously11,16 and are given in section S.1. PXRD and vibrational spectroscopy confirmed the identities of (Cu1/2Au1/2)CN, (Ag1/2Au1/2)CN, and (Cu1/3Ag1/3Au1/3)CN (Table 5), and the PXRD patterns agree with those reported previously11,16 (Figures S.1 and S.2).
Table 5. Lattice Parameters, Principal Stretching Frequencies, and Measured and Calculated Densities for the Mixed-Metal Cyanides (Cu1/2Au1/2)CN, (Ag1/2Au1/2)CN, and (Cu1/3Ag1/3Au1/3)CN.
| lattice
parametersa |
νC≡N/cm–1 |
|||||
|---|---|---|---|---|---|---|
| compound | a/Å | c/Å | IR | Raman | ρmeas(295 K)/g cm–3 | ρcalc(295 K)b/g cm–3 |
| (Cu1/2Au1/2)CN | 3.396(5) | 4.931(6) | 2207 (s)11 | 2226 (s)11 | 5.224 | 5.253 |
| (Ag1/2Au1/2)CN | 3.425(5) | 5.158(6) | 2208 (s)11 | 2225 (s)11 | 5.689 | 5.688 |
| (Cu1/3Ag1/3Au1/3)CN | 3.441(1) | 5.011(3) | 2206 (s)16 | 2223 (s),16 2172 (w) | 4.810 | |
Hexagonal lattice parameters determined from PXRD at 295 K.
Density calculated at 295 K from the hexagonal lattice parameters.
Synchrotron X-ray Experiments
Data Collection and Reduction
(Cu1/2Au1/2)CN and (Ag1/2Au1/2)CN
A total of 0.0517 g of (Cu1/2Au1/2)CN and 0.0814 g of (Ag1/2Au1/2)CN were loaded into silica capillaries of 1 mm diameter mounted on the I15 X-ray diffractometer at the Diamond Light Source (U.K.). This diffractometer was equipped with a MAR345 image plate, which was placed perpendicular to the X-ray beam and ca. 216 mm behind the capillary. The X-ray wavelength of 0.17325 Å and exact sample-to-detector distance were determined by calibration with diffraction patterns from Si. Data were recorded for each sample at 100 K for a collection time of 30 min. Diffraction patterns were produced by integration of the images after suitable removal of dead pixels using the program FIT2D.28 Fitting the Bragg diffraction pattern yielded hexagonal lattice parameters a = 3.3590(7) Å and c = 4.957(2) Å for (Cu1/2Au1/2)CN and a = 3.3752(4) Å and c = 5.183(1) Å for (Ag1/2Au1/2)CN at 100 K.
The normalized structure factors, S(Q), were obtained using the program PDFGETX2.(29) after application of standard corrections (e.g., Compton scattering, detector effects) and by subtracting a background from each pattern obtained from the scatter from an empty capillary. The radial distribution functions, D(r), were obtained by Fourier transforming S(Q) using a Qmax value of 24.87 Å–1 for (Cu1/2Au1/2)CN and a Qmax value of 25.48 Å–1 for (Ag1/2Au1/2)CN.
(Cu1/3Ag1/3Au1/3)CN
A total of 0.0278 g of (Cu1/3Ag1/3Au1/3)CN was loaded into a borosilicate capillary of 1 mm diameter and mounted on the reconfigured I15-1 X-ray diffractometer at the Diamond Light Source (U.K.) fitted with a PerkinElmer X-ray diffraction 4343 CT detector. The X-ray wavelength used was 0.161669 Å. Data were measured at 100 K for a collection time of 20 min. Data integration, along with flat-field, detector transmission, polarization, and geometrical corrections were carried out using Dawn.30,31 The total scattering structure function and corresponding PDF were extracted using GudrunX(32) for a Qmax value of 25.50 Å–1.
Model Building and Calculation of the PDFs
(Cu1/2Au1/2)CN and (Ag1/2Au1/2)CN
The shortest internuclear distance in the metal cyanides (Cu1/2Au1/2)CN and (Ag1/2Au1/2)CN is between C and N in the cyanide group. However, the relatively small X-ray scattering factors of C and N compared to those of the metals mean that the peak in D(r) expected for the cyanide group at ∼1.15 Å cannot be resolved (Figures 6 and 7).
The structure of the metal-cyanide chains was arrived at by assuming that they are linear and by adjusting slightly the values of the Cu–N, Ag–N, and Au–C bond lengths previously determined by neutron diffraction11 in order to fit the features occurring at close to 2 Å in D(r) for both cyanides. This process yielded values of the interatomic distances of Cu–N = 1.826 Å and Au–C = 1.979 Å for (Cu1/2Au1/2)CN and values of Ag–N = 2.042 Å and Au–C = 1.985 Å for (Ag1/2Au1/2)CN. The peak at ∼5 Å in D(r) yielded the M–NC–Au distance along the chains and fixed the structure of the chains and the lattice repeat distance in the c direction for the structural models. Crystallographic models were constructed in the different space groups using these chains as a basis, with the interchain distances adjusted to give a good fit to the peaks occurring in each case at ∼3.35 Å (Table 1 and section S.4). The final values were in good agreement with those used in our neutron diffraction work.11
The Debye equation was used to calculate i(Q) for the different models and converted to D(r) by carrying out a Fourier transform and subtracting the average scattering density of the appropriate metal cyanide. It was necessary to use significantly different mean-square variations in the internuclear distances for the inter- and intrachain correlations, reflecting the fact that there are strong bonding interactions along chains and weaker interactions between chains. Using different mean-square variations for different groups of interatomic correlations is an approach that we have used in the past for (Cu1/2Au1/2)CN, (Ag1/2Au1/2)CN,11 and Ni(CN)233 and represents an intermediate state between full atomistic RMC and direct calculation of the PDF using a crystallographic model with displacement parameters for atoms rather than for correlations. The computations were carried out using a workbook created using Mathcad 15.0.
(Cu1/3Ag1/3Au1/3)CN
Structural models were constructed for (Cu1/3Ag1/3Au1/3)CN assuming straight chains and a distance of 15.01 Å (i.e., three times the c lattice parameter of the simple hexagonal cell at 100 K) for the length of the −Cu–NC–Ag–NC–Au–CN– repeating unit. The repeat distance of 15.01 Å is a little shorter than the value of ∼15.144 Å that would be expected by summing the Cu–N, Ag–C/N, Au–C, and C–N distances found in the MCN and (M1/2Au1/2)CN compounds, suggesting that, in reality, there is a small degree of bending of the metal cyanide chains. The effect of this small degree of chain bending on the M–C/N and C–N distances will have little effect on the X-ray PDF because the X-ray PDF is dominated by metal–metal correlations. Hence, the straight-chain model (using interatomic distances of Ag–C/N = 2.044 Å, Au–C = 1.952 Å, Cu–N = 1.803 Å, and C–N = 1.136 Å] is sufficient to allow discrimination between different chain packing models. Indeed, examining only the metal–metal correlations using models constructed in P6mm (with homometallic layers), R3m (with all unlike nearest neighbors), and Pmm2 (one model with mixed Cu–Au and Ag-only layers and one with Ag–Au and Cu-only layers) (section S.6) shows that only the Pmm2 model with mixed Cu–Au and Ag-only layers can account for the experimentally determined X-ray PDF (Figure 9).
Computational Details
Total-energy calculations were performed using the projector-augmented-wave formalism34,35 of the Kohn–Sham DFT,36,37 within the generalized gradient approximation (GGA), implemented in the Vienna ab initio simulation package (VASP).38 Relativistic effects are taken into account in VASP. The GGA was formulated by the Perdew–Burke–Ernzerhof (PBE) density functional.39 The Gaussian broadening technique was adopted. A plane-wave energy cutoff of 700 eV was used, and the integrations over the Brillouin zone were sampled using grids of k points generated by the Monkhorst–Pack method.40 All results were well converged with respect to the k mesh and the energy cutoff for the plane-wave expansion. The break condition for the self-consistent-field loop was set to 10–8 eV. Possible aurophilic and/or argentophilic effects, stemming from closed d-shell dispersive weak interactions (if any), were explored by considering two different vdW-based correction approximations implemented in VASP. The first vdW approach is based on the Grimme method19 (hereafter labeled as vdW-1). The second is a density functional, where the nonlocal correlation functional approximately accounts for dispersion interactions,20,21 implemented in optPBE-vdW41 (hereafter labeled as vdW-2). Further details are given in section S.4.
NMR Experimental Data
13C SSNMR spectra were acquired at 100.6 MHz in a 9.4 T magnet using either direct polarization or a DEPTH42 sequence to suppress the probe background. Each sample was packed in a 4-mm-o.d. rotor and spun at 10 kHz. Typically 2000 scans were acquired with a pulse delay of 180 s and an acquisition time of 12.5 ms (2k points with a spectral width of 810 ppm). Each spectrum was referenced to adamantane [the upfield methine resonance was taken to be at δ = 29.5 ppm43 on a scale where δ(TMS) = 0] as a secondary reference.
Acknowledgments
The University of Reading is acknowledged for provision of the Chemical Analysis Facility, and Professor Alex Hannon (STFC, Rutherford Appleton Laboratory, Chilton, Oxon, U.K.) is thanked for assistance with X-ray PDF data collection. S.d’A. thanks the ILL, University of Reading, and Engineering and Physical Sciences Research Council (Award Ref 1808696) for a Ph.D. studentship. This work was carried out with the support of the Diamond Light Source, instrument i15 (proposal EE7288) and I15-1 (proposal EE17685).
Supporting Information Available
The Supporting Information is available free of charge at https://pubs.acs.org/doi/10.1021/acs.inorgchem.0c01593.
Synthesis of cyanide materials, mathematical proof that the maximum average number of heterometallic nearest-neighbor interactions on a hexagonal lattice is four, structural models, DFT calculations, NMR spectra, and PXRD patterns (PDF)
Accession Codes
CCDC 2012872–2012874 contain the supplementary crystallographic data for this paper. These data can be obtained free of charge via www.ccdc.cam.ac.uk/data_request/cif, or by emailing data_request@ccdc.cam.ac.uk, or by contacting The Cambridge Crystallographic Data Centre, 12 Union Road, Cambridge CB2 1EZ, UK; fax: +44 1223 336033.
Author Present Address
† H.W.: Helmholtz Institute Ulm, Helmholtz-Strasse 11, D-89081 Ulm, Germany.
Author Contributions
The manuscript was written through contributions of all authors.
The authors declare no competing financial interest.
Supplementary Material
References
- Hibble S. J.; Hannon A. C.; Cheyne S. M.; Eversfield S. G. CuCN: A Polymorphic Material. Structure of One Form Determined from Total Neutron Diffraction. Inorg. Chem. 2002, 41, 4990–4992. 10.1021/ic0257569. [DOI] [PubMed] [Google Scholar]
- Reckeweg O.; Lind A.; Simon A.; Salvo J. Synthesis, Thermal and X-Ray Investigations of the High-Temperature Phase of Copper(I) Cyanide. Z. Naturforsch., B: J. Chem. Sci. 2003, 58, 155–158. 10.1515/znb-2003-0123. [DOI] [Google Scholar]
- Hibble S. J.; Eversfield S. G.; Cowley A. R.; Chippindale A. M. Copper(I) Cyanide: a Simple Compound with a Complicated Structure and Surprising Room-Temperature Reactivity. Angew. Chem., Int. Ed. 2004, 43, 628–630. 10.1002/anie.200352844. [DOI] [PubMed] [Google Scholar]
- Hibble S. J.; Wood G. B.; Bilbe E. J.; Pohl A. H.; Tucker M. G.; Hannon A. C.; Chippindale A. M. Structures and Negative Thermal Expansion Properties of the One-Dimensional Cyanides, CuCN, AgCN and AuCN. Z. Kristallogr. 2010, 225, 457–462. 10.1524/zkri.2010.1314. [DOI] [Google Scholar]
- Hibble S. J.; Cheyne S. M.; Hannon A. C.; Eversfield S. G. Beyond Bragg Scattering: the Structure of AgCN Determined from Total Neutron Diffraction. Inorg. Chem. 2002, 41, 1042–1044. 10.1021/ic015610u. [DOI] [PubMed] [Google Scholar]
- Bryce D. L.; Wasylishen R. E. Insight into the Structure of Silver Cyanide from 13C and 15N Solid-State NMR Spectroscopy. Inorg. Chem. 2002, 41, 4131–4138. 10.1021/ic0201553. [DOI] [PubMed] [Google Scholar]
- Bowmaker G. A.; Kennedy B. J.; Reid J. C. Crystal Structures of AuCN and AgCN and Vibrational Spectroscopic Studies of AuCN, AgCN, and CuCN. Inorg. Chem. 1998, 37, 3968–3974. 10.1021/ic9714697. [DOI] [PubMed] [Google Scholar]
- Hibble S. J.; Hannon A. C.; Cheyne S. M. Structure of AuCN Determined from Total Neutron Diffraction. Inorg. Chem. 2003, 42, 4724–4730. 10.1021/ic0342043. [DOI] [PubMed] [Google Scholar]
- Pyykko P. Theoretical Chemistry of Gold. Angew. Chem., Int. Ed. 2004, 43, 4412–4456. 10.1002/anie.200300624. [DOI] [PubMed] [Google Scholar]
- Zaleski-Ejgierd P.; Hakala M.; Pyykko P. Comparison of Chain Versus Sheet Crystal Structures for the Cyanides MCN (M=Cu-Au) and Dicarbides MC2 (M = Be-Ba, Zn-Hg). Phys. Rev. 2007, B76, 094104-1–094104-9. [Google Scholar]
- Chippindale A. M.; Hibble S. J.; Bilbe E. J.; Marelli E.; Hannon A. C.; Allain C.; Pansu R.; Hartl F. Mixed Copper, Silver, and Gold Cyanides, (MxM′1–x)CN: Tailoring Chain Structures to Influence Physical Properties. J. Am. Chem. Soc. 2012, 134, 16387–16400. 10.1021/ja307087d. [DOI] [PubMed] [Google Scholar]
- Cairns A. B.; Cliffe M. J.; Paddison J. A. M.; Daisenberger D.; Tucker M. G.; Coudert F. – X.; Goodwin A. L. Encoding Complexity within Supramolecular Analogues of Frustrated Magnets. Nat. Chem. 2016, 8, 442–447. 10.1038/nchem.2462. [DOI] [PMC free article] [PubMed] [Google Scholar]
- Jansen M. Homoatomic d10–d10 Interactions: their Effects on Structure and Chemical and Physical Properties. Angew. Chem., Int. Ed. Engl. 1987, 26, 1098–1110. 10.1002/anie.198710981. [DOI] [Google Scholar]
- Schmidbaur H.; Schier A. Argentophilic Interactions. Angew. Chem., Int. Ed. 2015, 54, 746–784. 10.1002/anie.201405936. [DOI] [PubMed] [Google Scholar]
- Schmidbaur H.; Schier A. Aurophilic Interactions as a Subject of Current Research: an Up-date. Chem. Soc. Rev. 2012, 41, 370–412. 10.1039/C1CS15182G. [DOI] [PubMed] [Google Scholar]
- d’Ambrumenil S.; Zbiri M.; Hibble S. J.; Chippindale A. M.; Keeble D. S.; Wright C.; Rees N. H. Anomalous Thermal Expansion in One-Dimensional Transition-Metal Cyanides: Behavior of the Trimetallic Cyanide, (Cu1/3Ag1/3Au1/3)CN. Phys. Rev. B: Condens. Matter Mater. Phys. 2019, 100, 174302-1–174302-13. 10.1103/PhysRevB.100.174302. [DOI] [Google Scholar]
- Kroeker S.; Wasylishen R. E.; Hanna J. V. The Structure of Solid Copper(I) Cyanide: A Multinuclear Magnetic and Quadrupole Resonance Study. J. Am. Chem. Soc. 1999, 121, 1582–1590. 10.1021/ja983253p. [DOI] [Google Scholar]
- Harris K. J.; Wasylishen R. E. A 13C and 15N solid-state NMR Study of Structural Disorder and Aurophilic Bonding in Au(I) and Au(III) Cyanide Complexes. Inorg. Chem. 2009, 48, 2316–2332. 10.1021/ic8022198. [DOI] [PubMed] [Google Scholar]
- Grimme S. Semiempirical GGA-type Density Functional Constructed with a Long-Range Dispersion Correction. J. Comput. Chem. 2006, 27, 1787–1799. 10.1002/jcc.20495. [DOI] [PubMed] [Google Scholar]
- Dion M.; Rydberg H.; Schröder E.; Langreth D. C.; Lundqvist B. I. van der Waals’ Density Functional for General Geometries. Phys. Rev. Lett. 2004, 92, 246401-1–246401-4. 10.1103/PhysRevLett.92.246401. [DOI] [PubMed] [Google Scholar]
- Roman-Pérez G.; Soler J. M. Efficient Implementation of a van der Waals’ Density Functional: Application to Double-Wall Carbon Nanotubes. Phys. Rev. Lett. 2009, 103, 096102-1–096102-4. 10.1103/PhysRevLett.103.096102. [DOI] [PubMed] [Google Scholar]
- Calleja M.; Goodwin A. L.; Dove M. T. Origin of the Colossal Positive and Negative Thermal Expansion in Ag3[Co(CN)6]: an Ab Initio Density Functional Theory Study. J. Phys.: Condens. Matter 2008, 20, 255226. 10.1088/0953-8984/20/25/255226. [DOI] [Google Scholar]
- Goodwin A. L.; Calleja M.; Conterio M. J.; Dove M. T.; Evans J. S. O.; Keen D. A.; Peters L.; Tucker M. G. Colossal Positive and NegativeThermal Expansion in the Framework Material Ag3[Co(CN)6]. Science 2008, 319, 794–797. 10.1126/science.1151442. [DOI] [PubMed] [Google Scholar]
- Andris E.; Andrikopoulos P. C.; Schulz J.; Turek J.; Ruzicka A.; Roithova J.; Rulisek L. Aurophilic Interactions in [(L)AuCl]···[(L′)AuCl] Dimers: Calibration by Experiment and Theory. J. Am. Chem. Soc. 2018, 140, 2316–2325. 10.1021/jacs.7b12509. [DOI] [PubMed] [Google Scholar]
- Vlaisavljevich B.; Huck J.; Hulvey Z.; Lee K.; Mason J. A.; Neaton J. B.; Long J. R.; Brown C. M.; Alfè D.; Michaelides A.; Smit B. Performance of van der Waals’ Corrected Functionals for Guest Adsorption in the M2(dobdc) Metal–Organic Frameworks. J. Phys. Chem. A 2017, 121, 4139–4151. 10.1021/acs.jpca.7b00076. [DOI] [PMC free article] [PubMed] [Google Scholar]
- Sears V. F. Neutron Scattering Lengths and Cross Sections. Neutron News 1992, 3, 26–37. 10.1080/10448639208218770. [DOI] [Google Scholar]
- Zehe C. S.; Hill J. A.; Funnell N. P.; Kreger K.; van der Zwan K. P.; Goodwin A. L.; Schmidt H. W.; Senker J. Mesoscale Polarization by Geometric Frustration in Columnar Supramolecular Crystals. Angew. Chem., Int. Ed. 2017, 56, 4432–4437. 10.1002/anie.201612122. [DOI] [PMC free article] [PubMed] [Google Scholar]
- Hammersley A. P.FIT2D: An Introduction and Overview. ESRF Internal Report ESRF97HA02T; ESRF, 1997.
- Qiu X.; Thompson J. W.; Billinge S. J. L. PDFgetX2: a GUI-Driven Program to Obtain the Pair Distribution Function from X-ray Powder Diffraction Data. J. Appl. Crystallogr. 2004, 37, 678–678. 10.1107/S0021889804011744. [DOI] [Google Scholar]
- Basham M.; Filik J.; Wharmby M. T.; Chang P. C. Y.; El Kassaby B.; Gerring M. W.; Aishima J.; Levik K.; Pulford W. C. A.; Sikharulidze I.; Sneddon D.; Webber M.; Dhesi S. S.; Maccherozzi F.; Svensson O.; Brockhauser S.; Náray G.; Ashton A. W. Data Analysis WorkbeNch (DAWN). J. Synchrotron Radiat. 2015, 22, 853–858. 10.1107/S1600577515002283. [DOI] [PMC free article] [PubMed] [Google Scholar]
- Filik J.; Ashton A. W.; Chang P. C. Y.; Chater P. A.; Day S. J.; Drakopoulos M.; Gerring M. W.; Hart M. L.; Magdysyuk O. V.; Michalik S.; Smith A.; Tang C. C.; Terrill N. J.; Wharmby M. T.; Wilhelm H. Processing Two-dimensional X-ray Diffraction and Small-angle Scattering Data in DAWN 2. J. Appl. Crystallogr. 2017, 50, 959–966. 10.1107/S1600576717004708. [DOI] [PMC free article] [PubMed] [Google Scholar]
- Soper A. K.; Barney E. R. Extracting the Pair Distribution Function from Whitebeam X-ray Total Scattering Data. J. Appl. Crystallogr. 2011, 44, 714–726. 10.1107/S0021889811021455. [DOI] [Google Scholar]
- Hibble S. J.; Chippindale A. M.; Pohl A. H.; Hannon A. C. Surprises from a Simple Material - the Structure and Properties of Nickel Cyanide. Angew. Chem., Int. Ed. 2007, 46, 7116–7118. 10.1002/anie.200701246. [DOI] [PubMed] [Google Scholar]
- Kresse G.; Joubert D. From Ultrasoft Pseudopotentials to the Projector Augmented-Wave Method. Phys. Rev. B: Condens. Matter Mater. Phys. 1999, B59, 1758–1774. 10.1103/PhysRevB.59.1758. [DOI] [Google Scholar]
- Dal Corso A. Projector Augmented-Wave Method: Application to Relativistic Spin-Density Functional Theory. Phys. Rev. B: Condens. Matter Mater. Phys. 2010, 82, 075116-1–075116-18. 10.1103/PhysRevB.82.075116. [DOI] [Google Scholar]
- Hohenberg P.; Kohn W. Inhomogeneous Electron Gas. Phys. Rev. 1964, 136, B864–B871. 10.1103/PhysRev.136.B864. [DOI] [Google Scholar]
- Kohn W.; Sham L. J. Self-Consistent Equations Including Exchange and Correlation Effects. Phys. Rev. 1965, 140, A1133–A1138. 10.1103/PhysRev.140.A1133. [DOI] [Google Scholar]
- Kresse G.; Furthmüller J. Efficiency of Ab-Initio Total Energy Calculations for Metals and Semiconductors using a Plane-Wave Basis Set. Comput. Mater. Sci. 1996, 6, 15–50. 10.1016/0927-0256(96)00008-0. [DOI] [PubMed] [Google Scholar]
- Perdew J. P.; Burke K.; Ernzerhof M. Generalized Gradient Approximation Made Simple. Phys. Rev. Lett. 1996, 77, 3865–3867. 10.1103/PhysRevLett.77.3865. [DOI] [PubMed] [Google Scholar]
- Monkhorst H. J.; Pack J. D. Special Points for Brillouin-Zone Integrations. Phys. Rev. 1976, B13, 5188–5192. 10.1103/PhysRevB.13.5188. [DOI] [Google Scholar]
- Klimes J.; Bowler D. R.; Michaelides A. Chemical Accuracy for the van der Waals’ Density Functional. J. Phys.: Condens. Matter 2010, 22, 022201-1–022201-5. 10.1088/0953-8984/22/2/022201. [DOI] [PubMed] [Google Scholar]
- Cory D. G.; Ritchey W. M. Suppression of Signals from the Probe in Bloch Decay Spectra. J. Magn. Reson. 1988, 80, 128–132. 10.1016/0022-2364(88)90064-9. [DOI] [Google Scholar]
- Earl W. L.; Vanderhart D. L. Measurement of 13C Chemical Shifts in Solids. J. Magn. Reson. 1982, 48, 35–54. 10.1016/0022-2364(82)90236-0. [DOI] [Google Scholar]
Associated Data
This section collects any data citations, data availability statements, or supplementary materials included in this article.


