

Abstract
The role of adhesion G protein-coupled receptors (aGPCRs) in cancer has become increasingly evident in recent years. Yet, data supporting the contribution of this family of genes to hematological malignancies, particularly acute myeloid leukemia (AML) are limited. Here, we use publicly available genomic data to characterize the expression of the 33 aGPCRs in patients with AML and examine whether upregulation of these genes is associated with the clinical and molecular characteristics of patients. Upregulation in one or more of eight aGPCR genes (ADGRB1, ADGRC2, ADGRD1, ADGRE1, ADGRE2, ADGRE5, ADGRG1, and/or ADGRG3) was significantly associated with shorter overall survival (OS) (median OS: 11.8 vs 55.4 months; P < 0.0001). This was also significant in multivariate survival analysis (hazard ratio: 1.73; 95% confidence interval 1.11–2.69; P = 0.015) after adjusting for age, molecular risk status, and transplant status. High expression of the eight aGPCRs was significantly associated with older age (≥60; P = 0.011). Patients with high aGPCRs expression were more frequently classified in the poor molecular risk status group and less in the good risk status group compared with patients with low aGPCRs expression (31% vs 17% P = 0.049 and 14% vs 28% P = 0.027, respectively). Via Ingenuity Pathway Analysis, we identified the interleukin-8 signaling pathway among the most activated pathways in patients with high aGPCRs expression. Overall, our data suggest that particular aGPCRs are frequently upregulated in AML and associated with poor clinical outcome. Future functional and mechanistic analyses are needed to address the role of aGPCRs in AML. (Translational Research 2019; 212:26–35)
INTRODUCTION
Adhesion G protein-coupled receptors (aGPCRs) are the second largest group of the five GPCR families, consisting of 33 different aGPCRs in humans.1 aGPCRs are characterized by their large extracellular region that is linked to a TM7 (7-span transmembrane) moiety via a GPCR proteolytic site-containing stalk region. The extracellular region of aGPCRs contains various domains that are involved in protein-protein interaction, cell adhesion, and cell signaling.1–3
The role of adhesion GPCRs in cancer has gained increasing attention in recent years. All aGPCRs share similar structures and several similar functions relating to migration, adhesion, and polarity that contribute to cancer hallmarks such as metastasis, invasion, and angiogenesis.4 The expression of aGPCRs is deregulated in several types of cancers including hematological malignancies.4 Of all the aGPCRs, the roles of CD97 (ADGRE5) and BAI1 (ADGRB1) in cell migration, cell invasion, and angiogenesis in cancer have been the best elucidated.4 Transcriptomic analysis of all GPCRs families identified several aGPCRs genes—CD97 (ADGRE5), EMR1 (ADGRE1), EMR2 (ADGRE2), and GPR114 (ADGRG5)—that were deregulated in acute myeloid leukemia (AML) compared with normal CD34+ cells.5 Other studies have shown that both CD97 (ADGRE5) and GPR56 (ADGRG1) contribute to the engraftment and migration of primary leukemia cells in mice.6–8 CD97 was found to be upregulated in leukemic stem cell (LSC) enriched blasts. And the targeting of CD97 was shown to reduce cell growth, induce apoptosis in AML cell lines, and delay mortality in murine xenograft leukemia models. CD97 upregulation in AML is also associated with the presence of FLT3-ITD mutation.8 CD97 also stimulates angiogenesis through binding integrin α5β1 and αvβ3 in vivo.9 GPR56 expression was also found to be associated with poor outcome and specific genetic lesions in AML. Furthermore, it identifies LSCs with high repopulating potential in murine leukemia models.7 GRP56 accelerates myeloid leukemogenesis in collaboration with HOXA9, possibly via a mechanism that involves GPCRs and integrin signaling.6 Yet the signaling pathways of aGPCRs and the molecular mechanisms underlying aGPCR signal transduction remain unknown.
The interaction of leukemic stem cells with the bone marrow niche enhances the repopulation capacity of LSCs leading to AML relapse. It is plausible that adhesive molecules including aGPCR contribute to the interaction between leukemic stem cells and the niche, protecting them from chemotherapy.10 Because of the accumulating evidence of the roles several aGPCRs play in AML and the functional and structural similarity among them, we speculated that aGPCRs are deregulated in AML and that upregulation of aGPCRs may affect AML clinical outcome via common signaling pathways. Here, we performed a comprehensive analysis of the expression of the 33 aGPCRs in patients with AML and assessed the association between each gene and patients’ clinical outcome. Genes that were significantly associated with shorter survival were combined into one group for further analyses to test their association with patients’ clinical and molecular characteristics as well as clinical outcome. To gain insights into the mechanistic role of aGPCRs in AML, we conducted Ingenuity Pathway Analysis (IPA) to identify potential pathways common among aGPCR genes that are associated with poor survival.
MATERIAL AND METHOD
Patient’s data.
We analyzed public deidentified patient’s data, thus no relevant ethical guidelines for human and animal research were required. We analyzed data from the cancer genome atlas (TCGA) dataset of 173 patients with AML with complete clinical and RNA expression data for each patient. Patients in this dataset were all diagnosed and received treatment according to the National Comprehensive Cancer Network guidelines between November 2001 and March 2010.11 Patients in the intermediate and poor cytogenetic risk groups did not receive uniform treatment: they were included in clinical trials and received allogeneic stem cell transplant whenever applicable or when matched donors were available. In total, 91 patients (52.6%) were aged <60 years and 82 patients (47.4%) were aged ≥ 60 years. The diagnosis of AML, and the molecular risk stratification were done according to the National Comprehensive Cancer Network guidelines. The patients were also assigned subtype classifications according to the French-American-British (FAB) classifications. The patients included in the study were assessed for gene expression as well as somatic mutations frequently found in AML, such as FLT3, NPM1, IDH1/2, TET2, etc. Patient’s clinical, gene expression (Z scores), mutations, gene methylation, and survival data were downloaded from the TCGA database on July 3, 2018 via cBioportal.12,13 To analyze differential expression of the aGPCR genes in normal tissue vs AML, we utilized the Andersson Leukemia dataset (GSE7186)14 with six samples from healthy bone marrow and 23 samples from patients with AML, the Haferlach Leukemia dataset15 with 74 samples from healthy donor peripheral blood mononuclear cells and 542 samples from patients with AML and the Valk Leukemia dataset (GSE1159)16 with five samples from healthy donor bone marrow, three samples from CD34+ cells, and 285 samples from patients with AML. We also validated our survival analysis in two Metzeler (GSE12417 n = 79 and n = 163)17 Leukemia datasets and the Bullinger (GSE425 n = 119)18 Leukemia dataset. All these datasets were downloaded from Oncomine.
Gene expression analyses.
Publicly available analyzed RNA sequencing data were downloaded from TCGA via cBioportal12,13 or Oncomine. Expression values (Z scores) were used to dichotomize patients into two groups based on aGPCRs expression data Z ≥ 1 and Z < 1. Survival analyses were performed using this cutoff for each of the 33 genes, genes associated with shorter survival outcome (n = 8) using a nonadjusted P value of 0.05 were included in the expanded combined analysis. In combined analysis, patients who had at least one of the eight genes with Z score ≥ 1 were categorized as high expression; patients with all genes with Z score <1 were characterized as low expression.
Statistical analyses.
The time between diagnosis and removal from the study due to lack of complete remission, relapse, or death was defined as disease-free survival (DFS). The time between diagnosis and death due to any reason was defined as overall survival (OS). Kaplan-Meier survival curves were generated for the comparison of overall and DFS between patients with Z ≥ 1 and Z < 1 aGPCRs expression. OS and DFS a were considered undefined when the curve did not cross 50%. For the combined 8-aGPCRs OS analysis, patients were grouped into higher expression level (Z score ≥ 1) if they had at least one of the eight genes with Z score ≥ 1; patients were grouped into low expression level (Z score < 1) if none of the eight genes had a Z score >1. To determine associations between aGPCRs expression level and patient’s clinical/molecular characteristics, Mann-Whitney U’s nonparametric and Fisher’s exact test were used for continuous and categorical variables, respectively, using STATA 15.1 SE. Figures were generated using GraphPad Prism software package (ver. 6.0; GraphPad Software Inc., La Jolla, CA). The Stata 15.1 SE software was utilized to perform multivariate survival analysis using the Cox Proportional Hazards Model to assess the association between the combination of the eight aGPCRs expression levels and OS after adjusting for other factors. Additionally, we conducted survival analysis after dichotomizing patients according to age into younger (<60) and older ( ≥ 60) and excluding patients with t15:17 translocation (M3). A statistical cutoff of P < 0.05 was used for inclusion of variables from univariate analysis to multivariate analysis. Spearman and Pearson correlation analyses were conducted to assess the correlation of gene expression between each two genes of the eight identified aGPCRs. Distribution figures of methylation β values and heatmaps were generated using R studio 3.5.1. The analysis of the association between individual gene expression and survival was performed with a nonadjusted P value of 0.05. For the primary analysis (8-aGPCR combined analysis), we used a P value of 0.05/29 = 0.00172 as significant to correct for the multiple hypothesis testing.
Pathway analyses.
The mRNA enrichment analysis data was downloaded from TCGA database on cBioportal—using Z score ≥±2 as the threshold and only included genes with enrichment P value < 0.05. IPA, version 01–13 was used to predict the potential signaling pathways. IPA was used to identify potential common pathways among the eight aGPCR genes that were associated with poor survival. The pathways were built based on the Ingenuity Knowledge Base and confined in mammalian species (human, mouse, and rat).
RESULTS
Genomic profile of adhesion GPCRs in AML samples.
aGPCRs exhibited a wide spectrum of genomic and transcriptomic alternations in AML, present in 0.6% (in ADGRF2) to 35% (in ADGRG5) of patients studied (Fig 1). Each of the 33 aGPCR genes was found to be genetically or transcriptionally altered in at least one patient with AML. Most alterations were mRNA upregulation and mRNA downregulation with very few amplification, deep deletion, and missense mutation alterations (Table S1). Two patients had fusions in ADGRG7. 154 (95.1%) of the 162 patients with AML in the TCGA study had one or more genomic and transcriptional alternations in at least one of the 33 adhesion GPCR genes (Fig 1 and S1).
Fig 1.
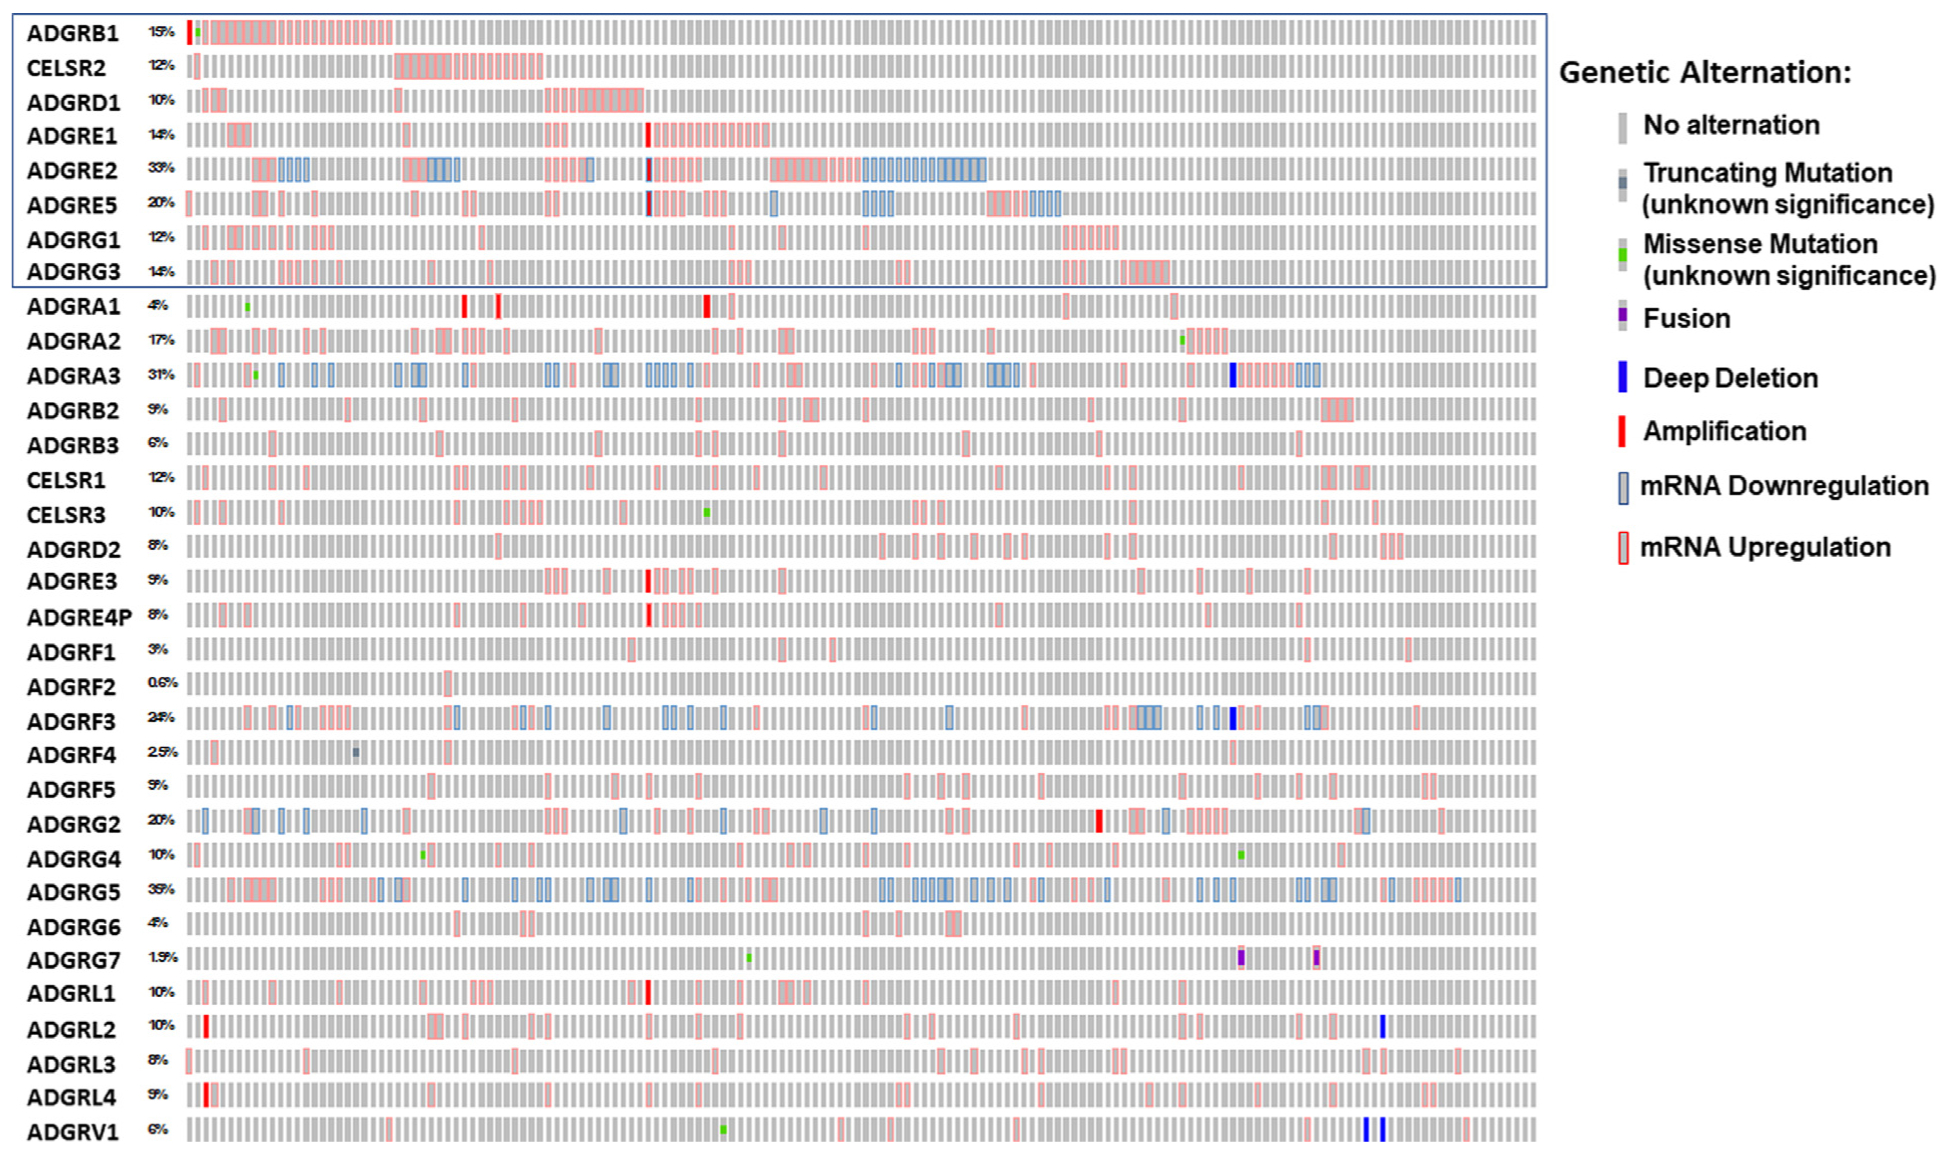
Distribution of 33 adhesion GPCR genes in 162 patients with and without alterations. (Z score 1 ≥ is the threshold). The data were acquired from acute myeloid leukemia TCGA data set (TCGA NEJM 2013) and plotted using Oncoprint from the cBioportal. The blue rectangle corresponds to the eight adhesion GPCRs that their upregulation is associated with worse outcome. The percentages listed reflect that of patients with genomic or transcriptomic alternations. GPCRs, G protein-coupled receptors; TCGA, the cancer genome atlas.
Association between the upregulation of eight aGPCRs and shorter overall and disease free survival.
We compared OS and DFS between patients with high (Z ≥ 1) and patients with low (Z < 1) expression of each of the 33 aGPCR genes. Expression data for GPR123 (ADGRA1), GPR111 (ADGRF2), GPR115 (ADGRF4), GPR112 (ADGRG4), and GPR128 (ADGRG7) genes were not available, therefore we could not exclude their possible association with clinical outcome. Otherwise, we found that eight of the remaining aGPCRs (BAI1 [ADGRB1], CELSR2 [ADGRC2], GPR133 [ADGRD1], EMR1 [ADGRE1], EMR2 [ADGRE2], CD97 [ADGRE5], GPR56 [ADGRG1], and GPR97 [ADGRG3]) were associated with shorter OS and/or DFS (unadjusted P < 0.05). High expression (Z ≥ 1) of each gene of the identified eight genes was significantly associated with shorter median OS and/or DFS compared with low expression (Z < 1) (Figure S2.a,b; ADGRB1: OS 8.2 vs 21.5 months, P = 0.0157; ADGRC2: OS 10.0 vs 21.5 months, P = 0.0488; ADGRD1: OS 11.1 vs 20.5 months, P = 0.0085; ADGRE1: OS 10.6 vs 20.5 months, P = 0.0198; ADGRE2: DFS 12.1 vs 18.2 months, P = 0.0374; ADGRE5: OS 7.35 vs 24.1 months, P = 0.0015; ADGRG1: OS 6.8 vs 22.3 months, P = 0.0057; ADGRG3: OS 10.0 vs 21.5 months, P = 0.0177).
Thus, we conducted a combined analysis in which patients with high (Z ≥ 1) expression of at least one of the eight aGPCRs were categorized into the 8-aGPCRs high expressers group and patients with all eight genes with Z < 1 were categorized into the 8-aGPCRs low expressers group. We found that patients in the 8-aGPCR high expression group had significantly shorter OS (median: 11.8 months vs 55.4 months; P < 0.0001) and DFS (median: 12 months vs Undefined; P < 0.0001) than patients in the 8-aGPCR low expression group (Fig 2a and b). Similarly, when we excluded patients with FAB M3 AML who receive different therapy and generally have better OS, the association between high aGPCRs expression and worse survival remained significant (OS median: 11.80 vs 53.90 months P = 0.0001; DFS median:11.90 vs 35.60 months P = 0.0002; Fig 2 c and d).
Fig 2.
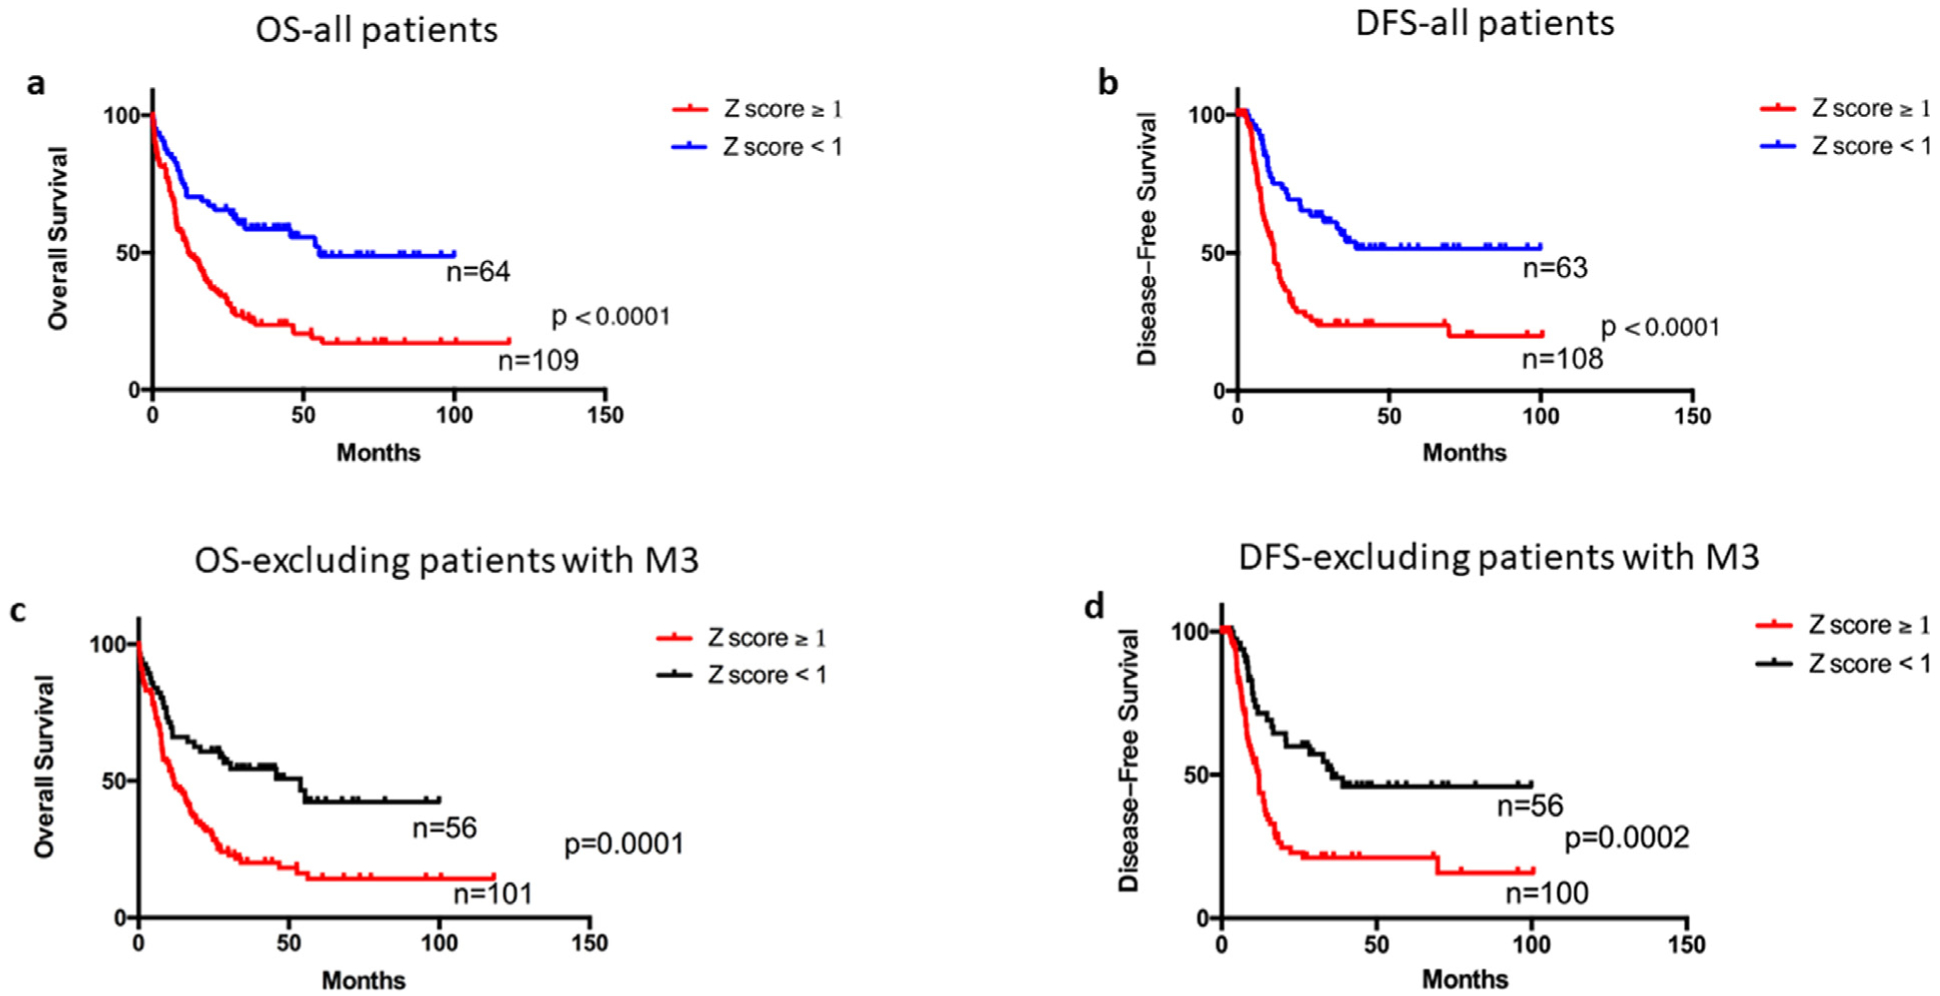
Survival analyses of patients with AML according to eight aGPCRs mRNA expression. Patients with at least one of the eight genes (ADGRB1[BAI1], ADGRC2[CELSE2], ADGRE1[EMR1], ADGRE2[EMR2], ADGRE5[CD97], ADGRG1[GPR56], ADGRG3[GPR97], and ADGRG5[GPR133]) have high (Z ≥ 1) expression are grouped in the 8-aGPCRs high expressers, and patients with all eight genes have expression Z < 1 are grouped in the 8-aGPCRs low expressers group, survival analyses were compared between the high and low expressors. a, Overall survival (OS) of 173 AML patients in the high expresser group (Z score ≥ 1) and low expresser group (Z score < 1). b, Disease-free survival (DFS) of 171 AML patients in high expresser group (Z score ≥ 1) and low expresser group (Z score < 1). c, Overall survival of 157 AML patients (excluding patients with M3 FAB type) in the high expresser group (Z score ≥ 1) and low expresser group (Z score < 1). d, Disease-free survival of 156 AML patients (excluding patients with M3 FAB) in the high expresser group (Z score ≥ 1) and low expresser group (Z score < 1).
We were able to validate the association between individual gene upregulation of GPR56, CD97, and EMR2 and worse survival in other datasets but not the remaining genes (Figure S3a–d). However, we validated the combined analysis of the 8-genes and their association with clinical outcome in the Metzeler leukemia 2 dataset, which had expression data available for all eight genes. We categorized patients as high expressers if they had gene expression of any of the eight genes in the top 10%, otherwise, they were categorized as low expressers. We found a similar but not significant trend to that observed in the TCGA data. Patients with high expression (top 10%) of any of the eight aGPCR genes had worse survival compared with patients with low expression (OS median: 15.4 vs 42 P = 0.10; Figure S3e).
Furthermore, we dichotomized patients into young (age < 60) and old (age ≥ 60) and found that in younger patients, high expression of the eight aGPCRs was significantly associated with worse OS (median OS in younger: 17.0 VS Undefined P = 0.0003) but not in older patients (age ≥ 60; Fig 3a and b). Importantly, in multivariate survival analysis we found that upregulation of the eight aGPCRs was associated with significantly shorter OS when adjusting for age, molecular risk, and transplant status (all patients: hazard ratio = 1.73, 95% confidence interval = 1.11 – 2.69, P = 0.015; younger patients: hazard ratio = 2.94, 95% confidence interval = 1.49–5.79, P = 0.002; Table Ia and b).
Fig 3.
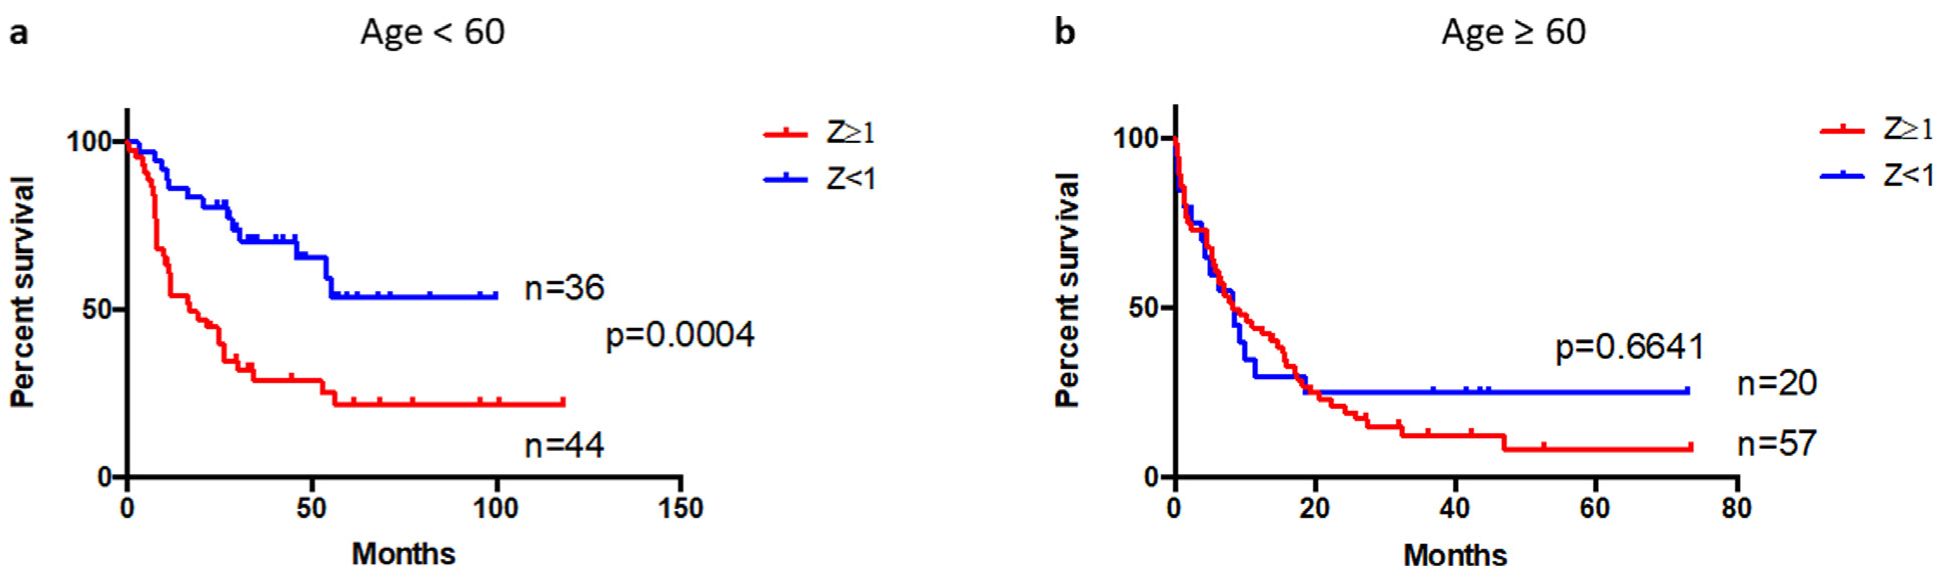
Survival analysis of patients with AML according to eight aGPCRs mRNA expression and stratified by age. Patients with at least one of the eight genes (ADGRB1[BAI1], ADGRC2[CELSE2], ADGRE1[EMR1], ADGRE2[EMR2], ADGRE5[CD97], ADGRG1[GPR56], ADGRG3[GPR97], and ADGRG5[GPR133]) have high (Z ≥ 1) expression are grouped in the 8-aGPCRs high expressers, and patients with all eight genes have expression Z < 1 are grouped in the 8-aGPCRs low expressers group, survival analysis were compared between the high and low expressors. a, Overall survival of 80 young AML patients (age < 60) b, Overall survival of 77 old (age ≥ 60). AML, acute myeloid leukemia; GPCRs, G protein-coupled receptors.
Table I.
Multivariate analysis
| a. Cox Proportional Hazards model for overall survival In AML comparing patients with high (Z ≥ 1) adhesion GPCRs expression and low (Z < 1) adhesion GPCRs expression (N = 169). | ||||
|---|---|---|---|---|
| Variable | Hazard ratio | 95% CI | P value | |
| Age | 1.02 | 1.01 | 1.04 | 0.008 |
| Molecular risk Intermediate | 3.02 | 1.50 | 6.06 | 0.002 |
| Poor | 5.78 | 2.68 | 12.5 | <0.001 |
| Transplant status (Y/N) | 0.44 | 0.28 | 0.69 | <0.001 |
| aGPCRs (Z ≥ 1) | 1.73 | 1.11 | 2.69 | 0.015 |
| b. Cox Proportional Hazards model for overall survival in AML comparing patients with high (Z ≥ 1) adhesion GPCRs expression and low (Z < 1) adhesion GPCRs expression in younger patients (N = 89). | ||||
| Variable | Hazard ratio | 95% CI | P value | |
| Age | 1.00 | 0.97 | 1.03 | 0.987 |
| Molecular risk Intermediate | 5.64 | 1.99 | 15.96 | 0.001 |
| Poor | 4.41 | 1.36 | 14.3 | 0.013 |
| Transplant status (Y/N) | 0.71 | 0.34 | 1.46 | 0.348 |
| aGPCRs (Z ≥ 1) | 2.94 | 1.49 | 5.79 | 0.002 |
GPCRs, G protein-coupled receptors.
Association between the upregulation of the eight aGPCRs expression and patient’s clinical characteristics.
Next, we assessed the differential expression of each of the identified eight aGPCRs mRNA expression (log2-transformed) in patients with AML based on their molecular risk status, cytogenetic, and FAB classification (Figure S4). We found that median BAI1 (ADGRB1) mRNA expression was significantly higher in patients with poor molecular risk than in patients with intermediate molecular risk (Figure S4a). Median CELSR2 (ADGRC2) mRNA expression was higher in poor compared with that in intermediate and good molecular risk (Figure S4b). GPR56 (ADGRG1) median expression was higher in poor compared with good molecular risk (Figure S4g). However, EMR1 expression was higher in intermediate molecular risk (Figure S4d). The median mRNA expression levels of GPR133, EMR2, CD97, and GPR97 were not significantly associated with patient’s molecular risk status (Figure S4c,e,f and h). EMR1 (ADGRE1) and CD97 (ADGRE5) mRNA expression were significantly higher in cytogenetically normal patients compared with cytogenetically abnormal patients (Figure S4e and f).
We also examined the association between the combined eight aGPCRs (using the 8-aGPCR high and low definition explained above) and patient’s clinical characteristics (Table II). A total of 64 patients had low (Z < 1) aGPCRs expression while 109 patients had high (Z ≥ 1) aGPCRs expression. Patients in the 8-aGPCR high group were more likely to have poor molecular risk and less likely to have good molecular risk status than patients in the 8-aGPCR low group (poor: 31% vs 17% P = 0.049; good: 14% vs 28% P = 0.027). High 8-aGPCRs expression was also significantly associated with age. There was no significant association between high 8-aGPCRs expression and sex, FAB subtypes, white blood count, blast count, cytogenetic status, or transplant status.
Table II.
Clinical characteristics of 173 AML patients according to eight adhesion GPCRs expression Z score ≥ 1
| Characteristic | Z score (<1) (n = 64) | Z score (≥1) (n = 109) | P value | ||
|---|---|---|---|---|---|
| Age, median (y) | 54.5 | 61 | 0.052 | ||
| Young (n, %) | 42 | 66% | 49 | 45% | 0.011 |
| Old (n, %) | 22 | 34% | 60 | 55% | |
| Sex | |||||
| Female (n, %) | 30 | 47% | 51 | 47% | >0.999 |
| Male (n, %) | 34 | 53% | 58 | 53% | |
| FAB | |||||
| M0 (n, %) | 3 | 5% | 13 | 12% | 0.173 |
| M1 (n, %) | 18 | 28% | 26 | 24% | 0.589 |
| M2 (n, %) | 15 | 23% | 23 | 21% | 0.709 |
| M3 (n, %) | 8 | 13% | 8 | 7% | 0.285 |
| M4 (n, %) | 12 | 19% | 22 | 20% | >0.999 |
| M5 (n, %) | 4 | 6% | 14 | 13% | 0.205 |
| M6 (n, %) | 1 | 2% | 1 | 1% | >0.999 |
| M7 (n, %) | 1 | 2% | 2 | 2% | >0.999 |
| WB count, median | 13.95 | 27.1 | 0.062 | ||
| In mean | 28.098 | 36.631 | 0.062 | ||
| %BM blast, median | 71.5 | 73 | 0.765 | ||
| %PB blast, median | 37 | 39 | 0.908 | ||
| Risk status | |||||
| Poor (n, %) | 11 | 17% | 34 | 31% | 0.049 |
| Intermediate (n, %) | 34 | 53% | 58 | 53% | >0.999 |
| Good (n, %) | 18 | 28% | 15 | 14% | 0.027 |
| Cytogenetic status | |||||
| Normal (n, %) | 30 | 47% | 50 | 46% | >0.999 |
| Abnormal (n, %) | 33 | 52% | 57 | 52% | |
| Transplant status | |||||
| No (n, %) | 34 | 53% | 66 | 61% | 0.345 |
| Yes (n, %) | 30 | 47% | 43 | 39% | |
AML, acute myeloid leukemia.
Association between the upregulation of eight aGPCRs and patient’s mutational status.
We also analyzed the association of aGPCRs expression with patient’s mutational status (Table III). Patients in the high eight aGPCRs were less likely to have CEBPA mutation (%: 3.7 vs 14.1, P = 0.017). However, the analysis of the association between each individual aGPCR gene and the presence of different AML mutations showed no association between CEBPA mutations and the expression of any of the eight aGPCRs (Table S2). Yet, TP53 and NPM1 mutations were associated with several aGPCR genes: GPR133 (ADGRG1) (TP53: 23.5% vs 6.4%, P = 0.035), CD97 (ADGRE5) (NPM1: 53.8% vs 23.1% P = 0.003), EMR1 (ADGRE1) (IDH2: 22.7% vs 7.9% P = 0.046; NPM1 63.6% vs 22.5% P < 0.001) and GPR97 (ADGRG3) (NPM1: 47.8% vs 24.7%, P = 0.026), in which high (Z ≥ 1) expression of the particular gene was associated with higher frequency of the mutation.
Table III.
Expression of the eight adhesion GPCRs (Z score ≥ 1) according to the top mutations present in AML (N = 173 patients)
| Genes | Z score (<1) (n = 64) | Z score (≥ 1) (n = 109) | P value | ||
|---|---|---|---|---|---|
| FLT3 (n, %) | 15 | 23.4% | 34 | 31.2% | 0.299 |
| TP53 (n, %) | 3 | 4.7% | 11 | 10.1% | 0.259 |
| WT1 (n, %) | 6 | 9.4% | 4 | 3.7% | 0.176 |
| IDH1 (n, %) | 6 | 9.4% | 10 | 9.2% | >0.999 |
| IDH2 (n, %) | 5 | 7.8% | 12 | 11.0% | 0.602 |
| CEBPA (n, %) | 9 | 14.1% | 4 | 3.7% | 0.017 |
| RUNX1 (n, %) | 7 | 10.9% | 8 | 7.3% | 0.417 |
| NRAS (n, %) | 5 | 7.8% | 7 | 6.4% | 0.762 |
| TET2 (n, %) | 7 | 10.9% | 8 | 7.3% | 0.417 |
| NPM1 (n, %) | 13 | 20.3% | 35 | 32.1% | 0.114 |
| DNMT3A (n, %) | 14 | 21.9% | 28 | 25.7% | 0.714 |
AML, acute myeloid leukemia; GPCRs, G protein-coupled receptors.
We also assessed whether the expression levels of the eight aGPCR genes were correlated in patients with AML. We found correlations in four pairs of genes among the eight selected aGPCRs: CD97 (ADGRE5) vs EMR2 (ADGRE2) (Pearson correlation: 0.43, Spearman correlation:0.45 P = 1.59 × 10⁻⁹), CD97 (ADGRE5) vs EMR1 (ADGRE1) (Pearson correlation: 0.44, Spearman correlation:0.41 P = 6.44 × 10⁻⁸), BAI1 (ADGRB1) vs GPR133 (ADGRG1) (Pearson correlation: 0.46, Spearman correlation: 0.44 P = 3.08 × 10⁻⁹) and GPR97 (ADGRG3) vs. GPR56 (ADGRG1) (Pearson correlation: 0.43, Spearman correlation: 0.45 P = 9.485 × 10⁻⁵) (Figure S5).
Adhesion GPCRs are hypomethylated in patients with high aGPCRs gene expression.
Because only a portion of the aGPCRs upregulation was explained by the association with patient mutational status, we speculated that DNA hypomethylation may contribute to the upregulation of these genes. We assessed the methylation β-value distribution of each of the eight genes based on high (Z ≥ 1) and low (Z < 1) expression. We found that five of the eight genes— BAI1 (ADGRB1), EMR1 (ADGRE1), EMR2 (ADGRE2), and CELSR2 (ADGRC2), CD97 (ADGRE5)—were hypomethylated in the majority of the patients (median β value < 0.2; Figure S6). Additionally when considering each gene individually, we found that aGPCR methylation was significantly lower in the aGPCR high (Z ≥ 1) group for five of the eight aGPCR genes (Figure S7; median methylation β value: BAI1: 0.04560 vs 0.06087, P = 0.0011; GPR133: 0.5806 vs 0.8781, P = 0.0005; EMR1: 0.1341 vs 0.3178, P = 0.0001; GPR56: 0.4906 vs 0.6053, P < 0.0001; GPR97: 0.6471 vs 0.7567, P = 0.0152). However, there was no significant association between the level of aGPCRs methylation and clinical outcome. Importantly, not all eight genes were found to be upregulated in AML compared with normal hematopoietic cells from healthy donors. EMR1, EMR2, and CD97 were upregulated in leukemia vs normal in Valk leukemia and Haferlach leukemia data sets (data are no shown).
IL8 signaling pathway is activated in patients with high aGPCRs.
Because aGPCRs share similar structure as shown in the similarity and identity matrix in Figure S8, we speculated that genes in this family may act in common pathways. To gain insights into the mechanisms shared by aGPCRs and how they contribute to AML, we performed knowledge-based pathway analysis. We used a Z score >2 for any of the eight aGPCRs, excluded patients who have downregulation in any of the aGPCR eight genes, and conducted enrichment analysis between the gene expression altered group (expression Z score > 2) and unaltered group. We extracted genes that were significantly different between the two groups. The extracted genes were analyzed using IPA (QIAGEN Inc., https://www.qiagenbioinformatics.com/products/ingenuitypathway-analysis) (Fig 4a and b). IPA identified the IL8 (interleukin-8) signaling pathway among the top enriched pathways in patients with high aGPCRs. Other pathways that were found to be activated are the FCɣ receptor mediated phagocytosis in macrophages and monocytes, integrin, B cell receptor, and NGF signaling pathways (Table S3).
Fig 4.
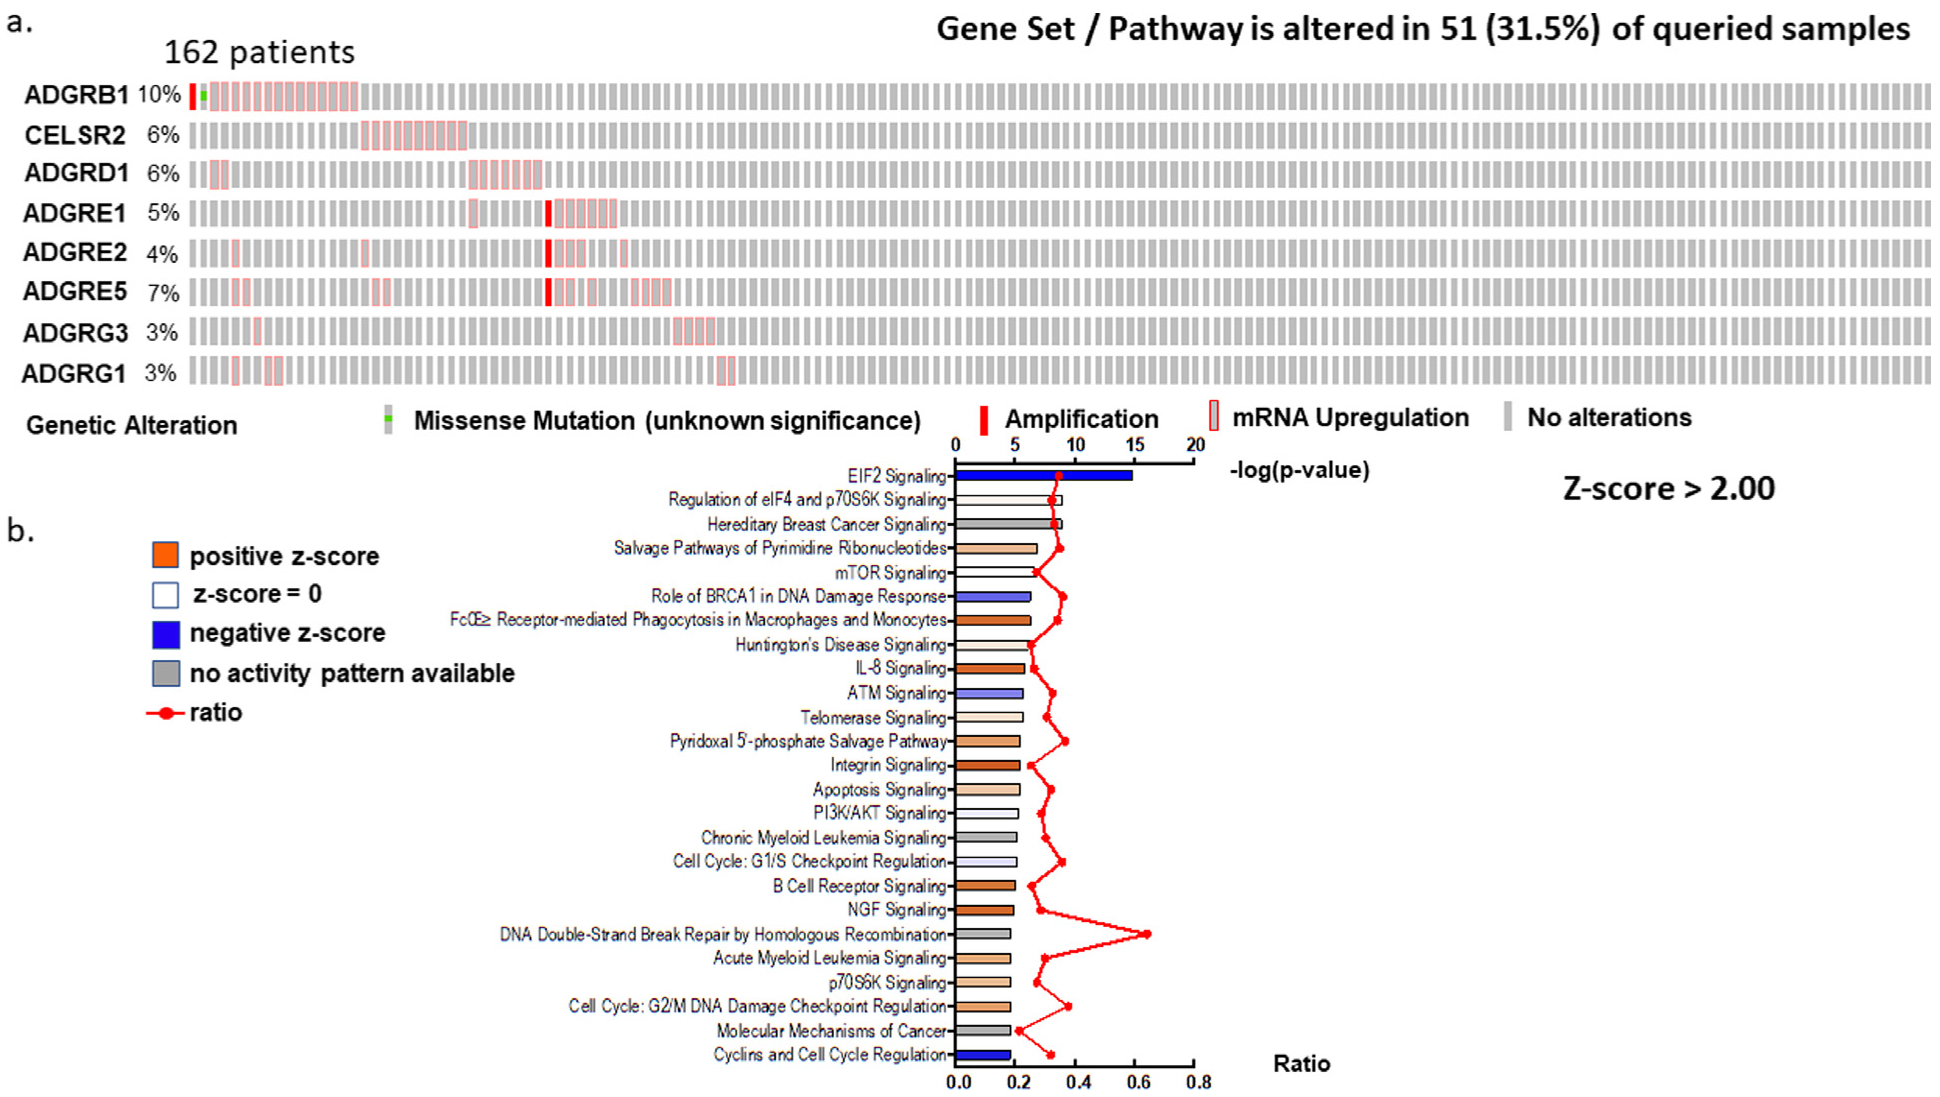
Pathway analysis of the eight aGPCRs. a, Oncoprint of the eight aGPCR genes with upregulation and amplification (Z score > 2 is the threshold) b, IPA pathway enrichment analysis of the eight aGPCR genes. The x-axis shows enrichment P values and ratios for the eight aGPCRs expressions altered group compared with the unaltered group (Z score > 2 as altered; Z score < 2 as unaltered). Pathways with the most significant activation are bright orange, and pathways with the most significant inhibition are bright blue.
DISCUSSION
Adhesion GPCRs are emerging as important drug targets for the development of human disease therapeutics. Adhesion GPCR members exhibit very discrete patterns of distribution and involvement in a broad range of human diseases including cancer.19 Adhesion GPCRs were increasingly found to play important roles in tumor initiation and progression. Recent findings reporting the mechanoreceptive features of aGPCRs20–22 further support their implication in cancer growth. In addition to the genetic and epigenetic aberrations that differentiate cancer from normal cells, cancer cells have developed biomechanical features that allow them to respond to intrinsic and extrinsic mechanical cues.10 Evidence shows that GPCRs deregulation is also associated with stem cell maintenance and induced pluripotent stem cells reprogramming.23 Recent transcriptomic analysis has examined GPCRs in patients with AML and shown deregulation of the expression of several GPCR genes including members of the aGPCRs, suggesting that some of these genes could serve as a potential therapeutic targets.5
In addition to their ability to function through GPCR-dependent signaling, aGPCRs also signal through 7-TM independent mechanisms. aGPCRs feature a long extracellular N terminal domain, longer than most other GPCRs. It contains multiple conserved domains that are involved in cell adhesion and cellular interaction, in addition to a GPCR proteolysis site.19 These receptors provide a huge opportunity for drug development in the form of agonists, antagonists, and other pharmacologic intervention; as a result, functional and mechanistic characterization of these genes in AML will deepen our understanding of their role in this disease.
Among the 33 aGPCR we investigated in this study, we found that eight aGPCRs—BAI1 (ADGRB1), CELSR2 (ADGRC2), GPR133 (ADGRD1), EMR1 (ADGRE1), EMR2 (ADGRE2), CD97 (ADGRE5), GPR56 (ADGRG1), and GPR97 (ADGRG3)—were associated with poor clinical outcome. GPR56 was previously reported to significantly accelerate HOXA9-induced leukemogenesis in mice, providing evidence that GPR56 upregulation contributes to AML development and establishing this gene as a potential novel target for antibody-mediated antileukemic strategies.6 CD97 was identified as a leukemic stem cell marker in AML24 and reported to be associated with FLT3-ITD.8 Although less is known about the contribution of other aGPCRs in AML, the high frequency of deregulated EMR1 and EMR2 in patients with AML suggests a possible role in disease development. The contribution of aGPCRs to AML development is further supported by the association between their upregulation and the patient’s clinical outcome reported here.
The concept of studying genes as families or clusters with similar functions, share similar structures or work together to regulate a particular process is unique. It enables the identification of larger patient population that are affected by similar molecular and biological dysfunction that otherwise would not be identified. This will also facilitate the identification of therapeutic approaches that would affect the mutual downstream regulator, process or mechanism rather than the individual genes. This approach led us to the identification of IL8 as a possible mutual signaling pathway that is deregulated in patients with upregulated aGPCRs. IL8 is a proinflammatory chemokine that is associated with the promotion of neutrophil chemotaxis and degranulation. IL8 signaling activates multiple downstream signaling pathways such as Akt, PKC, and MAPK signaling that promote angiogenesis, proliferation, and tumor and endothelial cells migration.25 IL8 also plays a role in the induction and maintenance of EMT,26 a process that is associated with more aggressive and invasive malignancies.27 In fact, the upregulation of EMT marker vimentin was also associated with poor OS in patients with AML.28 IL8 and its receptor CXCR2 were reported to be overexpressed in AML stem cells and associated with worse disease prognosis.29,30 The inhibition of CXCR2 resulted in decreased cell viability in AML preclinical models.29,31 A recent study has shown that the activation of EMR2/ADGRE2 promotes the differentiation of the AML cells (THP-1) and induces the expression of proinflammatory mediators including IL8.32 Furthermore, CD97 mAb inhibits IL8- but not G-CSF-induced hematopoietic stem and progenitor cell mobilization.33 The nature of the association between IL8 signaling pathway and aGPCRs gene upregulation and whether one acts as an upstream regulator of the other has yet to be determined.
In conclusion, our study suggests that particular aGPCRs are frequently upregulated in AML and that their overexpression is associated with poor clinical outcome and the activation of IL8 signaling pathway. Future functional and mechanistic analyses are needed to address the role of aGPCRs in AML.
Supplementary Material
At a Glance Commentary.
Background
Acute myeloid leukemia is devastating heterogeneous hematological malignancy with overall survival of less than 30%, thus identifying new therapeutic targets remains a high need.
Translational Significance
Here we characterize the expression of aGPCRs in patients with AML and report that genes in this class of GPCRs are highly upregulated in AML and that their upregulation is associated with poor clinical outcome. Importantly, we established that IL8 is a signaling pathway that is mutually deregulated in patients with upregulated aGPCRs. Thus, the emergence of adhesion GPCRs as important drug targets for the development of human disease therapeutics may impact AML treatment.
ACKNOWLEDGMENTS
We would like to thank the Bioinformatics core at the Norris medical library, University of Southern California and TCGA. We like to acknowledge the University of Southern California School of Pharmacy Seed Fund. This work was also supported by grant UL1TR001855 from the National Center for Advancing Translational Science (NCATS) of the U.S. National Institutes of Health. The content is solely the responsibility of the authors and does not necessarily represent the official views of the National Institutes of Health. All authors have read the journal’s authorship agreement.
Abbreviations:
- AML
acute myeloid leukemia
- αGPCRs
adhesion G protein-coupled receptors
- OS
overall survival
- DFS
disease-free survival
Footnotes
DISCLOSURES
All authors have read the journal’s policy on disclosure of potential conflicts of interest and declared no conflict of interests.
SUPPLEMENTARY MATERIALS
Supplementary material associated with this article can be found in the online version at doi:10.1016/j.trsl.2019.05.004.
REFERENCES
- 1.Lagerstrom MC, Schioth HB. Structural diversity of G protein-coupled receptors and significance for drug discovery. Nat Rev Drug Discov 2008;7:339–57. [DOI] [PubMed] [Google Scholar]
- 2.Paavola KJ, Hall RA. Adhesion G protein-coupled receptors: signaling, pharmacology, and mechanisms of activation. Mol Pharmacol 2012;82:777–83. [DOI] [PMC free article] [PubMed] [Google Scholar]
- 3.Yona S, Lin HH, Siu WO, Gordon S, Stacey M. Adhesion-GPCRs: emerging roles for novel receptors. Trends Biochem Sci 2008;33:491–500. [DOI] [PubMed] [Google Scholar]
- 4.Aust G, Zhu D, Van Meir EG, Xu L. Adhesion GPCRs in tumori-genesis. Handb Exp Pharmacol 2016;234:369–96. [DOI] [PMC free article] [PubMed] [Google Scholar]
- 5.Maiga A, Lemieux S, Pabst C, et al. Transcriptome analysis of G protein-coupled receptors in distinct genetic subgroups of acute myeloid leukemia: identification of potential disease-specific targets. Blood Cancer J 2016;6:e431. [DOI] [PMC free article] [PubMed] [Google Scholar]
- 6.Daria D, Kirsten N, Muranyi A, et al. GPR56 contributes to the development of acute myeloid leukemia in mice. Leukemia 2016;30:1734–41. [DOI] [PubMed] [Google Scholar]
- 7.Pabst C, Bergeron A, Lavallee VP, et al. GPR56 identifies primary human acute myeloid leukemia cells with high repopulating potential in vivo. Blood 2016;127:2018–27. [DOI] [PubMed] [Google Scholar]
- 8.Wobus M, Bornhauser M, Jacobi A, et al. Association of the EGF-TM7 receptor CD97 expression with FLT3-ITD in acute myeloid leukemia. Oncotarget 2015;6:38804–15. [DOI] [PMC free article] [PubMed] [Google Scholar]
- 9.Wang T, Ward Y, Tian L, et al. CD97, an adhesion receptor on inflammatory cells, stimulates angiogenesis through binding integrin counterreceptors on endothelial cells. Blood 2005;105:2836–44. [DOI] [PubMed] [Google Scholar]
- 10.Scholz N Cancer cell mechanics: adhesion G protein-coupled receptors in action? Front Oncol 2018;8:59. [DOI] [PMC free article] [PubMed] [Google Scholar]
- 11.Ley TJ, Miller C, Ding L, et al. Genomic and epigenomic landscapes of adult de novo acute myeloid leukemia. N Engl J Med 2013;368:2059–74. [DOI] [PMC free article] [PubMed] [Google Scholar]
- 12.Gao J, Aksoy BA, Dogrusoz U, et al. Integrative analysis of complex cancer genomics and clinical profiles using the cBioPortal. Sci Signal 2013;6:l1. [DOI] [PMC free article] [PubMed] [Google Scholar]
- 13.Cerami E, Gao J, Dogrusoz U, et al. The cBio cancer genomics portal: an open platform for exploring multidimensional cancer genomics data. Cancer Discov 2012;2:401–4. [DOI] [PMC free article] [PubMed] [Google Scholar]
- 14.Andersson A, Ritz C, Lindgren D, et al. Microarray-based classification of a consecutive series of 121 childhood acute leukemias: prediction of leukemic and genetic subtype as well as of minimal residual disease status. Leukemia 2007;21:1198–203. [DOI] [PubMed] [Google Scholar]
- 15.Haferlach T, Kohlmann A, Wieczorek L, et al. Clinical utility of microarray-based gene expression profiling in the diagnosis and subclassification of leukemia: report from the International Microarray Innovations in Leukemia Study Group. J Clin Oncol 2010;28:2529–37. [DOI] [PMC free article] [PubMed] [Google Scholar]
- 16.Valk PJ, Verhaak RG, Beijen MA, et al. Prognostically useful gene-expression profiles in acute myeloid leukemia. N Engl J Med 2004;350:1617–28. [DOI] [PubMed] [Google Scholar]
- 17.Metzeler KH, Hummel M, Bloomfield CD, et al. An 86-probe-set gene-expression signature predicts survival in cytogenetically normal acute myeloid leukemia. Blood 2008; 112:4193–201. [DOI] [PMC free article] [PubMed] [Google Scholar]
- 18.Bullinger L, Dohner K, Bair E, et al. Use of gene-expression profiling to identify prognostic subclasses in adult acute myeloid leukemia. N Engl J Med 2004;350:1605–16. [DOI] [PubMed] [Google Scholar]
- 19.Purcell RH, Hall RA. Adhesion G protein-coupled receptors as drug targets. Annu Rev Pharmacol Toxicol 2018;58:429–49. [DOI] [PMC free article] [PubMed] [Google Scholar]
- 20.Scholz N, Gehring J, Guan C, et al. The adhesion GPCR latrophilin/CIRL shapes mechanosensation. Cell Rep 2015;11:866–74. [DOI] [PubMed] [Google Scholar]
- 21.Wilde C, Fischer L, Lede V, et al. The constitutive activity of the adhesion GPCR GPR114/ADGRG5 is mediated by its tethered agonist. FASEB J 2016;30:666–73. [DOI] [PubMed] [Google Scholar]
- 22.Scholz N, Monk KR, Kittel RJ, Langenhan T. Adhesion GPCRs as a putative class of metabotropic mechanosensors. Handb Exp Pharmacol 2016;234:221–47. [DOI] [PubMed] [Google Scholar]
- 23.Choi HY, Saha SK, Kim K, et al. G protein-coupled receptors in stem cell maintenance and somatic reprogramming to pluripotent or cancer stem cells. BMB Rep 2015;48:68–80. [DOI] [PMC free article] [PubMed] [Google Scholar]
- 24.Bonardi F, Fusetti F, Deelen P, van Gosliga D, Vellenga E, Schuringa JJ. A proteomics and transcriptomics approach to identify leukemic stem cell (LSC) markers. Mol Cell Proteom 2013;12:626–37. [DOI] [PMC free article] [PubMed] [Google Scholar]
- 25.Waugh DJ, Wilson C. The interleukin-8 pathway in cancer. Clin Cancer Res 2008;14:6735–41. [DOI] [PubMed] [Google Scholar]
- 26.Palena C, Hamilton DH, Fernando RI. Influence of IL-8 on the epithelial-mesenchymal transition and the tumor microenvironment. Future Oncol 2012;8:713–22. [DOI] [PMC free article] [PubMed] [Google Scholar]
- 27.Brabletz T, Kalluri R, Nieto MA, Weinberg RA. EMT in cancer. Nat Rev Cancer 2018;18:128–34. [DOI] [PubMed] [Google Scholar]
- 28.Wu S, Du Y, Beckford J, Alachkar H. Upregulation of the EMT marker vimentin is associated with poor clinical outcome in acute myeloid leukemia. J Transl Med 2018;16:170. [DOI] [PMC free article] [PubMed] [Google Scholar]
- 29.Schinke C, Giricz O, Li W, et al. IL8-CXCR2 pathway inhibition as a therapeutic strategy against MDS and AML stem cells. Blood 2015;125:3144–52. [DOI] [PMC free article] [PubMed] [Google Scholar]
- 30.Kuett A, Rieger C, Perathoner D, et al. IL-8 as mediator in the microenvironment-leukaemia network in acute myeloid leukaemia. Sci Rep 2015;5:18411. [DOI] [PMC free article] [PubMed] [Google Scholar]
- 31.Li Y, Cheng J, Jiang Y, Ma J, Li Q, Pang T. CXCL8 is associated with the recurrence of patients with acute myeloid leukemia and cell proliferation in leukemia cell lines. Biochem Biophys Res Commun 2018;499:524–30. [DOI] [PubMed] [Google Scholar]
- 32.I KY, Huang YS, Hu CH, et al. Activation of adhesion GPCR EMR2/ADGRE2 induces macrophage differentiation and inflammatory responses via Galpha16/Akt/MAPK/NF-kappaB signaling pathways. Front Immunol 2017;8:373. [DOI] [PMC free article] [PubMed] [Google Scholar]
- 33.van Pel M, Hagoort H, Kwakkenbos MJ, Hamann J, Fibbe WE. Differential role of CD97 in interleukin-8-induced and granulocyte-colony stimulating factor-induced hematopoietic stem and progenitor cell mobilization. Haematologica 2008; 93:601–4. [DOI] [PubMed] [Google Scholar]
Associated Data
This section collects any data citations, data availability statements, or supplementary materials included in this article.