Abstract
Patients with clear cell renal cell carcinoma (ccRCC) typically face aggressive disease progression when metastasis occurs. Here, we screened and identified differentially expressed genes in three microarray datasets from the Gene Expression Omnibus database. We identified 112 differentially expressed genes with functional enrichment as candidate prognostic biomarkers. Lasso Cox regression suggested 10 significant oncogenic hub genes involved in earlier recurrence and poor prognosis of ccRCC. Receiver operating characteristic curves validated the specificity and sensitivity of the Cox regression penalty used to predict prognosis. The area under the curve indexes of the integrated genes scores were 0.758 and 0.772 for overall and disease-free survival, respectively. The prognostic values of ADAMTS9, C1S, DPYSL3, H2AFX, MINA, PLOD2, RUNX1, SLC19A1, TPX2, and TRIB3 were validated through an analysis of 10 hub genes in 380 patients with ccRCC from a real-world cohort. The expression levels of were of high prognostic value for predicting metastatic potential. These findings will likely significantly contribute to our understanding of the underlying mechanisms of ccRCC, which will enhance efforts to optimize therapy.
Keywords: Clear cell renal cell carcinoma, metastasis, signature, bioinformatics, prognosis
Introduction
Renal cell carcinoma (RCC) is one of the most common malignancies of the urinary system, accounting for approximately 2% of cancer deaths [1]. The worldwide morbidity and mortality rates of RCC are increasing by approximately 2%-3% each decade [2]. Until recently, the rates stabilized or declined in many economically advanced countries [3]. As the most predominant histological subtype, clear cell renal cell carcinoma (ccRCC) represents approximately 70% of RCC cases. Although numerous factors contribute to the pathogenesis of RCC, limited information is available that can be applied to explain the aggressive pathogenesis and progression of ccRCC. The aggressiveness of ccRCC is directly associated with metastatic potential, which is typically not efficiently targeted despite great advances in therapeutic strategies [4]. Metastasis is a significant hallmark of tumor progression and thus the major cause of poor overall survival of patients with ccRCC [5]. Therefore, the identification of new prognostic biomarkers and molecular alterations is urgently required to develop more effective treatments of ccRCC.
Accumulating evidence has demonstrated that gene expression panels and related hallmarks participate in the carcinogenesis and aggressive progression of ccRCC [6-8]. For example, the expression levels of a panel of seven genes associated with the extracellular matrix significantly correlate with metastasis and prognosis of ccRCC [9]. Moreover, multigene panels help predict signatures that detect ccRCC in biopsy specimens [10]. Nomograms employing integrated clinical and gene expression profiles predict pathological nuclear grades and help clinicians to manage personalized regimens [8]. Despite these encouraging advances in strategies to treat metastatic ccRCC, many patients do not achieve longer survival [11]. Therefore, we urgently require methods that identify the underlying biochemical mechanisms associated with metastasis and predict the prognosis of patients with ccRCC. Such methods will facilitate the development of optimal therapeutic strategies.
During the latest decade, high-throughput nucleotide sequencing technologies, combined with bioinformatics analysis, sensitively and specifically detect mRNA expression levels, which identify differentially expressed genes (DEGs) that represent hallmarks associated with the pathogenesis and progression of ccRCC [8,9,12]. However, the diversity of genomic alterations and molecular interactions associated with metastasis hinders the identification of patients at high-risk for metastasis who may benefit from available as well as potential therapies. To address these challenges, here we analyzed three transcriptional microarray datasets acquired from the Gene Expression Omnibus (GEO) database to identify DEGs between cancer tissues and adjacent tissues that will serve as biomarkers of ccRCC. We conducted functional pathway enrichment analyses to better understand the associated molecular mechanisms. Moreover, we employed protein-protein interaction (PPI) network analysis to better define the importance of these interactions as they relate to biological processes, molecular functions, and signal transduction [13-15].
Our findings led us to hypothesize that the oncogenicity of significant hub genes correlates with metastasis and that these genes may serve as potential prognostic factors that will facilitate the identification of therapeutic targets for managing ccRCC.
Materials and methods
Raw biological microarray data
Raw transcriptional microarray data from GEO (http://www.ncbi.nlm.nih.gov/geo) [16] were screened for metastatic or primary ccRCC. Corresponding genes were converted into probes and assigned symbols associated with annotation information. We analyzed the datasets GSE22541 (24 primary and 44 metastatic tumors), GSE47352 (4 primary and 4 metastatic tumors), and GSE85258 (14 primary and 14 metastatic tumors) (Affymetrix Human Genome U133 Plus 2.0 Array).
Data normalization and identification of DEGs
Preprocessing and normalization of raw biological data were the first steps in processing the DNA microarrays. This process removes biased microarray data to ensure its uniformity and integrity. Subsequently, background correction, propensity analysis, normalization, and visualization of probe data were performed using the robust multiarray average analysis algorithm 17 in the affy package of R.
DEGs between primary and metastatic ccRCC samples were screened and identified across experimental conditions. Delineating parameters such as adjusted P values (adj. P), the Benjamini and Hochberg false-discovery rate (FDR), and fold-change values were used for filtering DEGs and balancing between discovery of significant genes and limitations of false-positives. Probe sets without corresponding gene symbols, or genes with more than one overlapping probe-set, were removed or averaged. Log2FC (fold-change) >1 and adj. P value <0.01 were considered to indicate a significant difference.
Protein-protein interaction (PPI) network and functional annotations
We used Search Tool for the Retrieval of Interacting Genes (http://string-db.org) (version 10.0) to predict a PPI network of DEGs and to analyze the degree of interactions between proteins [17]. A significant edge score was considered as an interaction combined score >0.4. Cytoscape (version 3.5) was used to visualize interactive network data [18].
To identify the role of DEGs in ccRCC, we used Gene Ontology (GO) enrichment analysis to extract functional attributes including biological processes (BP), molecular functions (MF), and cellular component (CC) [19]. The Kyoto Encyclopedia of Genes and Genomes (KEGG) database was used for this purpose as well [20]. The Database for Annotation, Visualization and Integrated Discovery (DAVID) (http://david.ncifcrf.gov; Version 6.8) was analyzed to explore the role of development-related signaling pathways in ccRCC [21]. P<0.05 was considered to indicate a significant.
ClueGO is a Cytoscape plug-in that visualizes nonredundant biological terms associated with large clusters of genes in a functionally grouped network [22]. The results of KEGG pathway analysis of selected hub genes enriched in the GO term BP were visualized using ClueGO (version 2.5.3) and the Cytoscape plugin CluePedia (version 1.5.3). Potential associations of 24 coordinately expressed hub genes and their potential prognostic values are shown using a heat map. The hub nodes of networks with connectivity degrees >10 were identified. A network comprising 24 genes and their coordinately expressed neighboring genes was constructed using cBioPortal (http://www.cbioportal.org) [23].
Statistical analysis of TCGA data cohort
A lasso Cox regression model was used to identify independent prognostic factors. Functional annotations and enrichment of signaling pathways were predicted and illustrated using DAVID. Phenotype and transcriptomics data of selected hub genes of 515 patients with ccRCC in TCGA data are displayed. Expression profiles were respectively identified as binary variables (high vs low), referring to the median expression level of each hub gene in TCGA cohort data. The primary and secondary endpoints for patients were disease-free survival (DFS) and overall survival (OS), respectively. The duration of follow-up was estimated using the Kaplan-Meier method with 95% confidence intervals (95% CI) and the log-rank test. X-tile software was used to determine the cutoff value [24]. All hypothetical tests were two-sided, and P values <0.05 were considered to indicate a significant difference for all tests. Hierarchical partitioning was performed using transcriptional expression profiles of selected oncogenes in a heat map. Color gradients indicate a high (red) or a low (blue) expression level.
The human protein atlas
The Human Protein Atlas project (https://www.proteinatlas.org) contains immunohistochemistry (IHC) data acquired using a tissue microarray analysis of 17 paired, major cancer types [25]. Data include IHC staining intensity, quantity, location, and patients’ information. Here we used the Human Protein Atlas (https://www.proteinatlas.org) to identify representative proteins differentially expressed between ccRCC and corresponding normal tissues.
ccRCC patients from a validated cohort
We analyzed samples acquired from 380 ccRCC patients who underwent nephrectomy at the Department of Urology of Fudan University Shanghai Cancer Center (FUSCC; Shanghai, China) from June 2009 to September 2017. Tissue samples were obtained during surgery, and available from the FUSCC tissue bank.
Quantitative real-time PCR (RT-qPCR) analysis
Total cellular RNA, which was isolated using Trizol (Invitrogen, Carlsbad, CA) in accordance with the source’s protocols, was reversed-transcribed using a PrimeScript RT reagent kit (Thermo Fisher, USA). Primers were diluted and mixed in RNase-Free ddH2O, and RT-qPCR was performed using the SYBR Green qPCR method (Takara Biotechnology Co.). The levels of GAPDH mRNA were measured to serve as a standard. Specific amplification conditions were performed using the SYBR Green qPCR Master Mix (Applied Biosystems) according to the manufacturer’s protocols. Primes sequences were shown in Table 2. The relative expression level of the target mRNA was calculated using the 2-ΔΔCt method.
Table 2.
Primer sequences (5’-3’) of 10 prognostic hub genes for qRT-PCR
| No. | Gene symbol | Forward | Reverse |
|---|---|---|---|
| 1 | ADAMTS9 | CAGAAGGGGCTTGGTTGG | TCGTGTTCCTACCCTATTTTGA |
| 2 | C1S | GTTGTCATGGACAGTGAGAG | GCCTAAATTCACCCTGGAAG |
| 3 | DPYSL3 | GGATCACGAGTGACCGCCTT | TCGTCATTCACGCGCCATGT |
| 4 | H2AFX | CGGCAGTGCTGGAGTACCTCA | AGCTCCTCGTCGTTGCGGATG |
| 5 | MINA | CCAAAGAACTGCTTTCCTCAGAC | CTACACTGTCCAGCCTCGGTAA |
| 6 | PLOD2 | CATGGACACAGGATAATGGCTG | AGGGGTTGGTTGCTCAATAAAAA |
| 7 | RUNX1 | GCCAGGAACCGGCCTTACTC | GCTAGTGTGCCGAGGAAGA |
| 8 | SLC19A1 | TTGCCCAAGCTATTCTCAGTCGA | CAGAGACACCGCCAGCCACAT |
| 9 | TPX2 | ACCTTGCCCTACTAAGATT | AATGTGGCACAGGTTGAGC |
| 10 | TRIB3 | ATGCCCCCTCGGATTTCATC | TTGCCCTGAAAAAGCCCTCC |
| 11 | GAPDH | GTCTTC TCCACCATGGAGAAGG | CATGCCAGTGAGCTTCCCGTTCA |
Statistical analysis of FUSCC-cohort data
We evaluated the significance of the associations of DFS and OS with distinct mRNA expression groups of 10 hub genes expressed by patients with ccRCC. The duration of follow-up was estimated using the Kaplan-Meier method (95% CI) and the log-rank test. Integrated scores represent the sums of each significant oncogenic hub-gene weight. Receiver operating characteristic (ROC) curves were generated to validate the specificity and sensitivity of a diagnosis according to high or low integrated scores of significant hub-gene levels. Area under the curve (AUC) analysis was performed to determine diagnostic ability.
Gene set enrichment analysis (GSEA) and related gene networks
TCGA data were subjected to GSEA using Bioconductor category version 2.10.1 package. For each analysis, the Student t test was performed, and the mean levels of differentially expressed genes were calculated. A permutation test (1000 times) was used to identify significantly changed pathways. The default adj. P values determined using the BH-FDR method were applied to correct for false-positives [26]. Significantly related genes were defined as those with adj. P<0.01 and FDR>0.25. Statistical analyses and graphical presentation were conducted using R software (Version 3.3.2). A detailed PPI network associated with a default set of 10 hub genes was constructed using GeneMANIA (http://genemania.org/).
Results
We first assessed DEGs using three datasets hosted on the GEO platform to identify coordinately-regulated hub genes. Second, we evaluated the significance of the associations between the expression levels of hub genes and prognosis according to TCGA data and then validated their prognostic value using a real-world cohort. Third, we predicted potential functional annotations and hallmark pathways.
Identification of DEGs in ccRCC
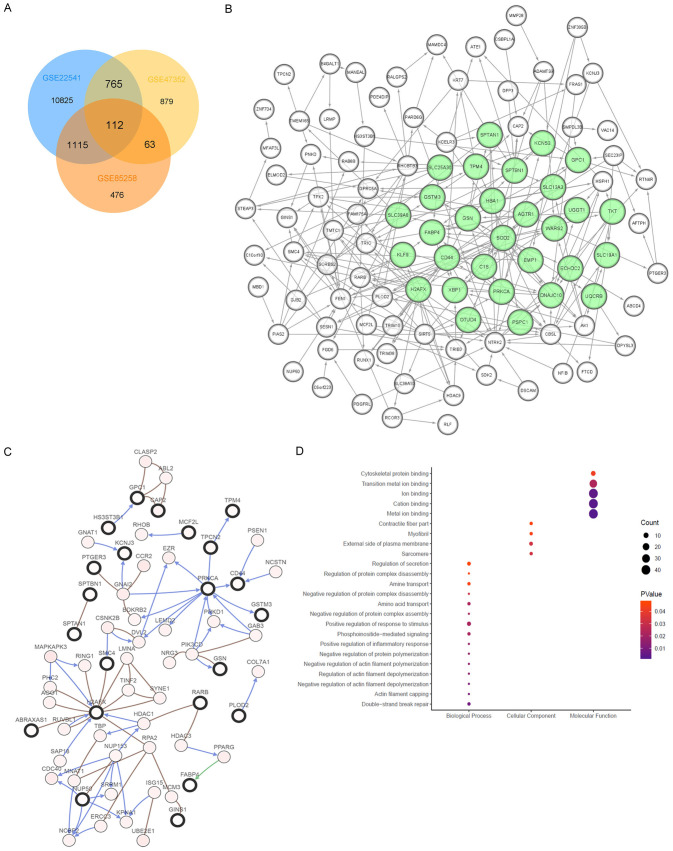
After normalization and identification of mRNA microarray data, the DEGs (12,817; 1,817; and 1,766 probe samples in GSE22541, GSE85258, and GSE47352, respectively) were determined as significant according to the analytical and statistical parameters of the data processing steps. The overlap among the three datasets included 112 significant genes (Figure 1A).
Figure 1.
Screening and selection of DEGs using multiple GEO database. A. After normalization and identification of mRNA microarray data, the DEGs (12,817; 1,817; and 1,766 probe samples in GSE22541, GSE85258, and GSE47352, respectively) were determined as significant according to the analytical and statistical parameters of the data processing steps. The overlap among the three datasets included 112 significant genes. B. The PPI network of the DEGs was constructed using Cytoscape. MCODE, a plug-in of Cytoscape, predicts the most significant gene panel, marked in light green. C. DEGs and their co-regulated network were analyzed using cBioPortal. Nodes with bold black outline represent hub genes. Nodes with thin black outline represent the co-expression genes. D. The enrichment profiles from DAVID GO functional analyses of the 112 hub genes suggested that the hub genes in this module were primarily enriched in double-strand break, positive response to stimulus, sarcomere, external side of plasma membrane, metal ion biding, cation binding, ion binding, cytoskeletal protein binding and so one.
Construction of a PPI network and functional analysis of modules
The PPI network comprising the DEGs is shown in Figure 1B, and the network of the DEGs and their coordinately expressed neighboring genes are shown in Figure 1C. The enrichment profiles determined using DAVID-GO functional analyses suggested that the 112 DEGs in this module were primarily enriched in GO terms such as double-strand break, positive response to stimulus, sarcomere, external side of plasma membrane, metal ion biding, cation binding, ion binding, and cytoskeletal protein binding (Figure 1D).
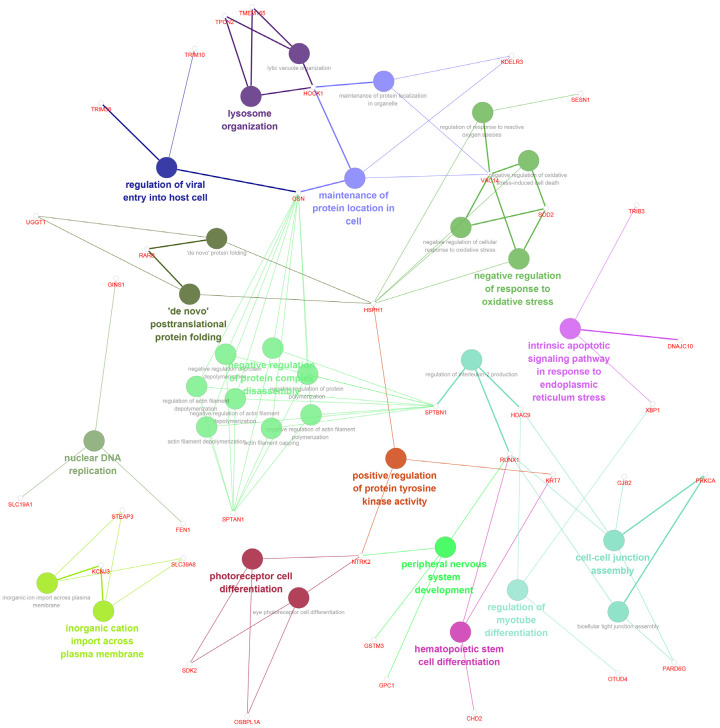
To further identify underlying signaling pathways, we analyzed KEGG pathways together with GO functional annotations (Figure 2). Detailed functional notes and classification pie charts are shown in Supplementary Figure 1. The frequencies of GO terms determined using ClueGO analysis were as follows: 25.0%, negative regulation of protein complex disassembly; 12.5%, negative regulation of response to oxidative stress; 9.38%, cell-cell junction assemble; 6.25%, maintenance of protein location in cell; 6.25%, photoreceptor cell differentiation; 6.25%, inorganic cation import across plasma membrane; and 6.25%, lysosome organization.
Figure 2.
Functional annotations of significant DEGs. To further identify underlying signaling pathways, we analyzed KEGG pathways together with GO functional annotations using ClueGO and CluePedia, plug-ins of Cytoscape.
Selection of significant hub genes
Lasso Cox regression analysis suggested that C1S, PLOD2, ADAMTS9, AK1, CHD2, DCAF8, DNAJC10, DPP3, DPYSL3, GSTM3, H2AFX, HBA1, RUNX1, MAMDC4, MFAP3L, MINA, OSBPL1A, PIAS2, RBBP6, RCOR3, RHOBTB3, SLC19A1, SORBS2, SPTAN1, SPTBN1, SYT13, TPM4, TPX2, TRIB3, UGGT1 were significant weighted prognostic factors. Functional annotation of these genes revealed they were primarily enriched in the terms as follows: regulation of actin filament capping, non-membrane-bounded organelle, sarcomere, myofibril, organelle lumen, nucleolus, actin cytoskeleton, and nuclear lumen (Figure 3).
Figure 3.
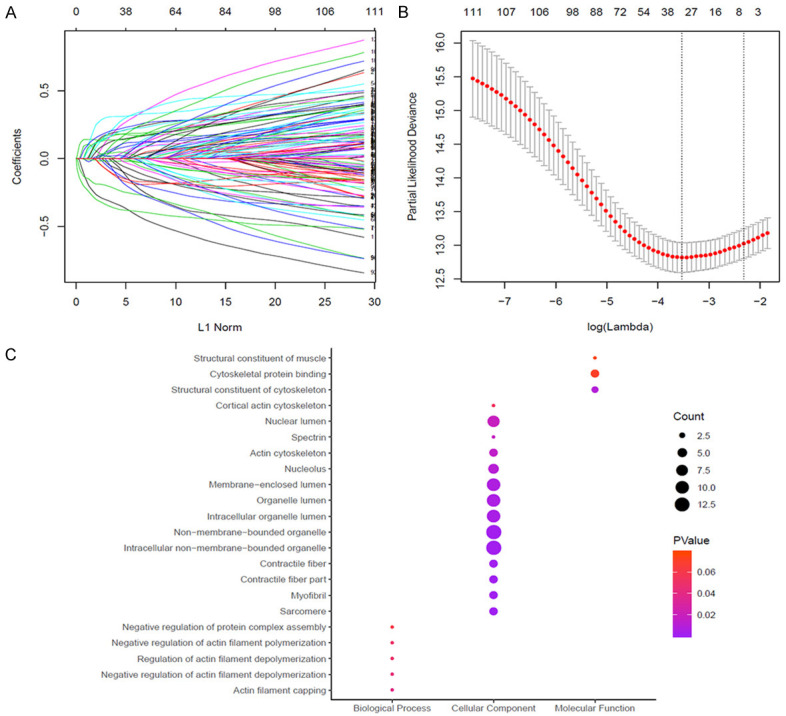
Further identification of hub genes using LASSO regression analysis. A, B. To further select significant prognostic metastasis-related biomarkers, LASSO Cox regression was performed to further search for hub genes associated with metastasis and to narrow the scope of the panel, suggested that a total of 31 genes, including C1S, PLOD2, ADAMTS9, AK1, CHD2, DCAF8, DNAJC10, DPP3, DPYSL3, GSTM3, H2AFX, HBA1, RUNX1, MAMDC4, MFAP3L, MINA, OSBPL1A, PIAS2, RBBP6, RCOR3, RHOBTB3, SLC19A1, SORBS2, SPTAN1, SPTBN1, SYT13, TPM4, TPX2, TRIB3, UGGT1 are significant weighted prognostic factors. C. GO function annotations of 31 selected genes. Functional annotation of these genes revealed they were primarily enriched in the terms as follows: regulation of actin filament capping, non-membrane-bounded organelle, sarcomere, myofibril, organelle lumen, nucleolus, actin cytoskeleton, and nuclear lumen.
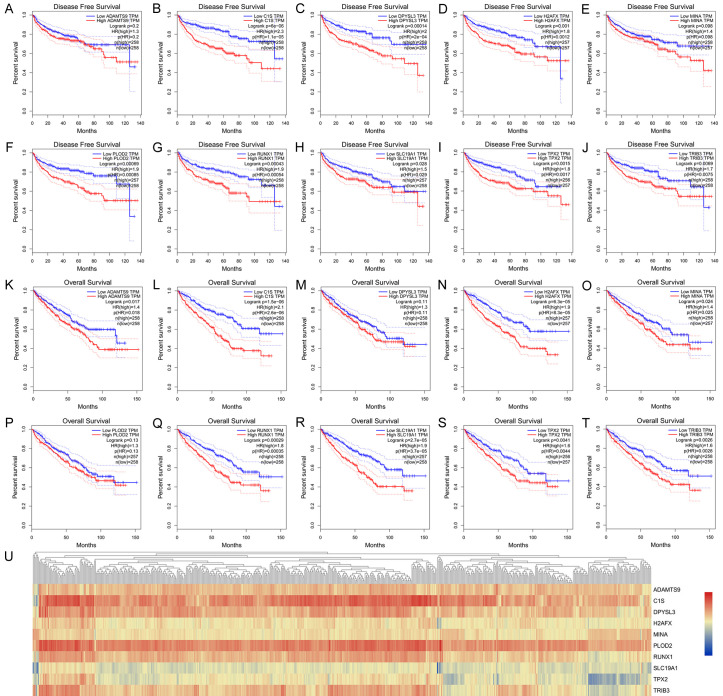
Kaplan-Meier analysis indicated that differentially elevated levels of the hub genes ADAMTS9, C1S, DPYSL3, H2AFX, MINA, PLOD2, RUNX1, SLC19A1, TPX2, and TRIB3 significantly correlated with poor prognosis of 513 patients with ccRCC (Figure 4A-T). Functional annotations of each prognostic hub gene are listed in Table 1. Hierarchical partitioning was performed using the transcriptional expression profiles of selected 10 oncogenes (Figure 4U).
Figure 4.
Prognostic value of significant hub genes from TCGA cohort. A-T. Kaplan-Meier analysis indicated that differentially elevated levels of the hub genes ADAMTS9, C1S, DPYSL3, H2AFX, MINA, PLOD2, RUNX1, SLC19A1, TPX2, and TRIB3 significantly correlated with poor prognosis of 513 patients with ccRCC. U. Hierarchical partitioning was performed using transcriptional expression profiles of 10 selected oncogenes.
Table 1.
Functional roles of 10 prognostic hub genes
| No. | Gene symbol | Full name | Function |
|---|---|---|---|
| 1 | ADAMTS9 | A Disintegrin And Metalloproteinase With Thrombospondin Motifs 9 | Pathway: Metabolism of proteins and O-linked glycosylation. |
| GO: Metalloendopeptidase activity and endopeptidase activity. | |||
| 2 | C1S | Complement C1s | Pathway: Immune response Lectin induced complement pathway and Creation of C4 and C2 activators. |
| GO: Calcium ion binding and serine-type endopeptidase activity. | |||
| 3 | DPYSL3 | Dihydropyrimidinase Like 3 | Pathway: Semaphorin interactions and Developmental Biology. |
| GO: Hydrolase activity and phosphoprotein binding. | |||
| 4 | H2AFX | H2A Histone Family Member X | Pathway: Activated PKN1 stimulates transcription of AR (androgen receptor) regulated genes KLK2 and KLK3 and ATM Pathway. |
| GO: Sequence-specific DNA binding and enzyme binding. | |||
| 5 | MINA | MYC-Induced Nuclear Antigen | Pathway: Validated targets of C-MYC transcriptional activation and Chromatin organization. |
| 6 | PLOD2 | Procollagen-Lysine, 2-Oxoglutarate 5-Dioxygenase 2 | Pathway: Collagen chain trimerization and Lysine degradation. |
| GO: Oxidoreductase activity and oxidoreductase activity, acting on paired donors, with incorporation or reduction of molecular oxygen. | |||
| 7 | RUNX1 | Runt Related Transcription Factor 1 | Pathway: Transport of glucose and other sugars, bile salts and organic acids, metal ions and amine compounds and Embryonic and Induced Pluripotent Stem Cell Differentiation Pathways and Lineage-specific Markers. |
| GO: DNA-binding transcription factor activity and protein homodimerization activity. | |||
| 8 | SLC19A1 | Solute Carrier Family 19 Member 1 | Pathway: Metabolism of water-soluble vitamins and cofactors and Antifolate resistance. |
| GO: Oxidoreductase activity and folic acid transmembrane transporter activity. | |||
| 9 | TPX2 | Targeting Protein For Xklp2 | Pathway: Gene Expression and Cell Cycle, Mitotic. |
| GO: GTP binding and protein kinase binding. | |||
| 10 | TRIB3 | Tribbles Pseudokinase 3 | Pathway: Class I MHC mediated antigen processing and presentation and RET signaling. |
| GO: Transferase activity, transferring phosphorus-containing groups and protein kinase binding. |
External validation of hub DEGs in 380 ccRCC patients from FUSCC cohort
DEGs corresponding to ADAMTS9, C1S, DPYSL3, H2AFX, MINA, PLOD2, RUNX1, SLC19A1, TPX2, and TRIB3 mRNAs were identified using the TCGA database and GSE11151 [27] (Figure 5). Significantly increased levels of these mRNAs were expressed by both cohorts. In contrast, MINA mRNA was differentially expressed at lower levels. The levels of the cognate proteins expressed by these hub genes in tumor and adjacent tissues detected using IHC and reported by the Human Protein Atlas are shown in Supplementary Figure 2.
Figure 5.
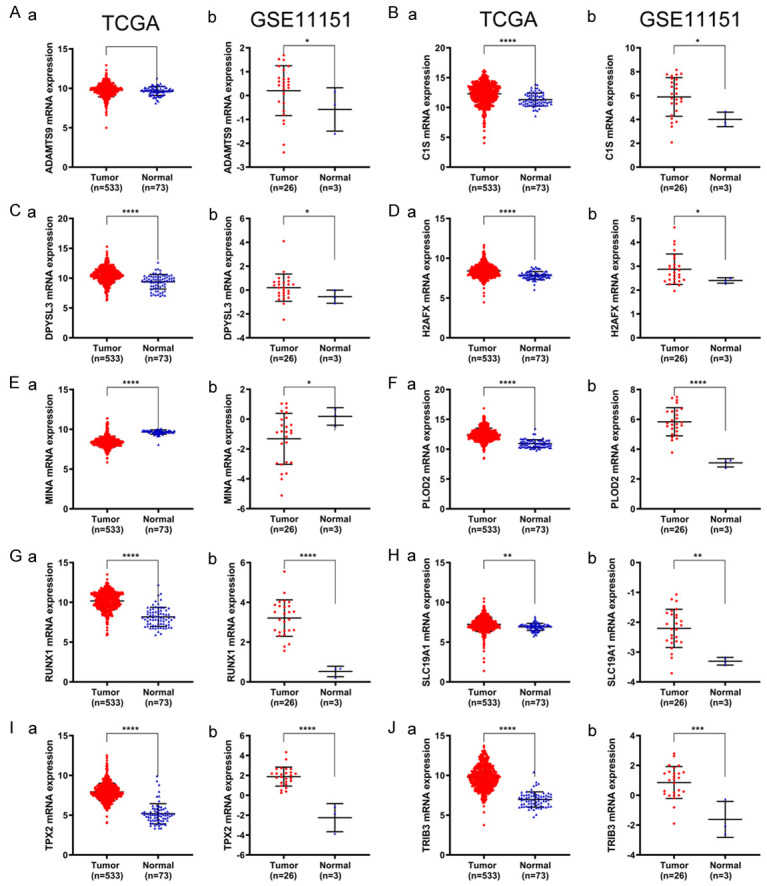
Differential expression validation of 10 hub genes in TCGA and GSE11151. Transcriptional expression of ADAMTS9, C1S, DPYSL3, H2AFX, MINA, PLOD2, RUNX1, SLC19A1, TPX2, TRIB3 between were tumor and normal samples were generated using TCGA database and GSE11151.
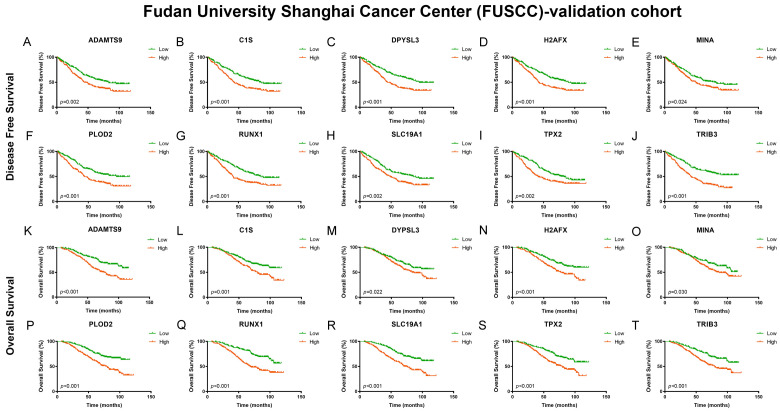
A total of 380 ccRCC patients with available clinical and pathological data were enrolled in this study (Table 3). After integration of qRT-PCR and clinical follow-up data for 380 patients with ccRCC, we confirmed that ADAMTS9, C1S, DPYSL3, H2AFX, PLOD2, RUNX1, SLC19A1, TPX2, and TRIB3 mRNAs were differentially expressed in the FUSCC cohort. Differentially elevated mRNA levels were significantly associated with shorter DFS and OS (P<0.05) (Figure 6).
Table 3.
Clinicopathological characteristics baseline in 380 ccRCC patients from FUSCC cohort (FUSCC: Fudan university shanghai cancer center)
| Characteristics | FUSCC cohort (N=380) |
|---|---|
| N (%) | |
| Age | |
| <60 years | 253 (66.6) |
| ≥60 years | 127 (33.4) |
| Gender | |
| Male | 258 (67.9) |
| Female | 122 (32.1) |
| BMI | |
| <25 kg/m2 | 231 (60.8) |
| ≥25 kg/m2 | 149 (39.2) |
| pT stage | |
| T1-T2 | 307 (80.8) |
| T3-T4 | 73 (19.2) |
| pN stage | |
| N0 | 334 (87.9) |
| N1 | 46 (12.1) |
| pM stage | |
| M0 | 310 (81.6) |
| M1 | 70 (18.4) |
| AJCC stage | |
| I-II | 292 (76.8) |
| III-IV | 88 (23.2) |
| ISUP grade | |
| G1-G2 | 182 (47.9) |
| G3-G4 | 198 (52.1) |
Figure 6.
External validation for prognostic value of 10 hub genes and prediction model in 380 ccRCC patients from FUSCC cohort. After integration of qRT-PCR and clinical follow-up data for 380 patients with ccRCC, we confirmed that ADAMTS9, C1S, DPYSL3, H2AFX, PLOD2, RUNX1, SLC19A1, TPX2, and TRIB3 mRNAs were differentially expressed in the FUSCC cohort. Differentially elevated mRNA levels were significantly associated with shorter DFS and OS (P<0.05).
An integrated gene panel was constructed using 10 hub gene (ADAMTS9, C1S, DPYSL3, H2AFX, MINA, PLOD2, RUNX1, SLC19A1, TPX2, TRIB3), which may serve as an independent panel to predict the progression of ccRCC. Kaplan-Meier analysis revealed significant associations of mRNA levels with DFS (P<0.0001) and OS (P<0.0001) (Figure 7A, 7B). ROC curve analysis indicated the ability of the gene model to predict metastasis (AUCs of the integrated model were 0.758 for OS and 0.772 for DFS) (Figure 7C).
Figure 7.
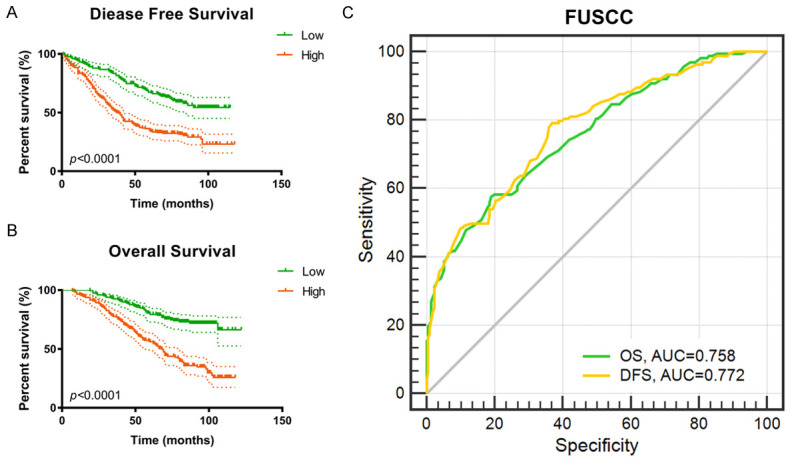
External validation for prognostic value of integrated prediction model in 380 ccRCC patients from FUSCC cohort. A, B. An integrated gene panel was constructed using 10 hub genes (ADAMTS9, C1S, DPYSL3, H2AFX, MINA, PLOD2, RUNX1, SLC19A1, TPX2, TRIB3), which may serve as an independent panel to predict the progression of ccRCC. Kaplan-Meier analysis revealed significant associations of mRNA levels with DFS (P<0.0001) and OS (P<0.0001). C. ROC curve analysis indicated the ability of the gene model to predict metastasis (AUCs of the integrated model were 0.758 for OS and 0.772 for DFS).
Significantly associated genes and their signaling pathways
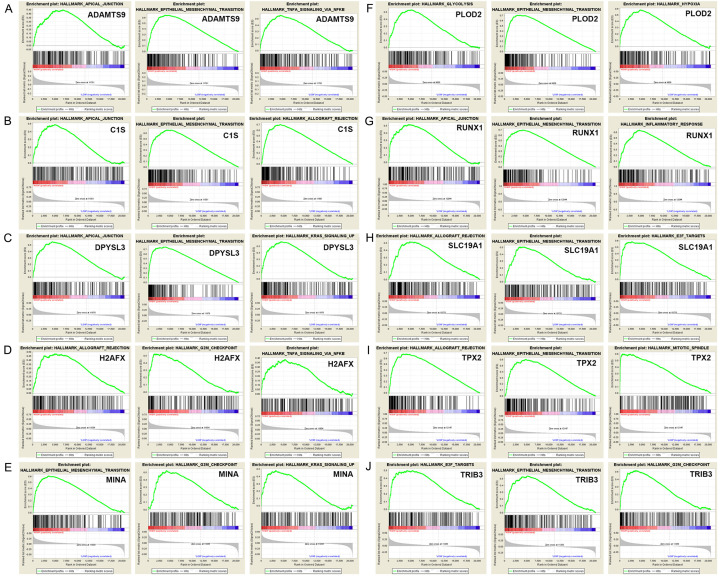
GSEA identified 100 DEGs with positive or negative correlations. Among them, we used the hallmarks ADAMTS9, C1S, DPYSL3, H2AFX, MINA, PLOD2, RUNX1, SLC19A1, TPX2, and TRIB3 to perform GSEA. Figure 8 shows the three most relevant hallmark pathways of each hub gene. The most significant genes associated with 10 hub genes, and their relationships are shown in Figure 9A, and a detailed PPI network related to this gene set shows additional interrelated nodes at the protein level (Figure 9B).
Figure 8.
GSEA was used to perform hallmark analysis for ADAMTS9, C1S, DPYSL3, H2AFX, MINA, PLOD2, RUNX1, SLC19A1, TPX2 and TRIB3. GSEA identified 100 DEGs with positive or negative correlations. Among them, we used the hallmarks ADAMTS9, C1S, DPYSL3, H2AFX, MINA, PLOD2, RUNX1, SLC19A1, TPX2, and TRIB3 to perform GSEA. Results suggested that the most involved three significant pathways of each oncogene included apical junction, epithelial mesenchymal transition, allograft rejection, G2M checkpoint, mitotic spindle, Kras signaling pathway up, inflammatory response, TNF-alpha signaling via NF-κB, etc.
Figure 9.
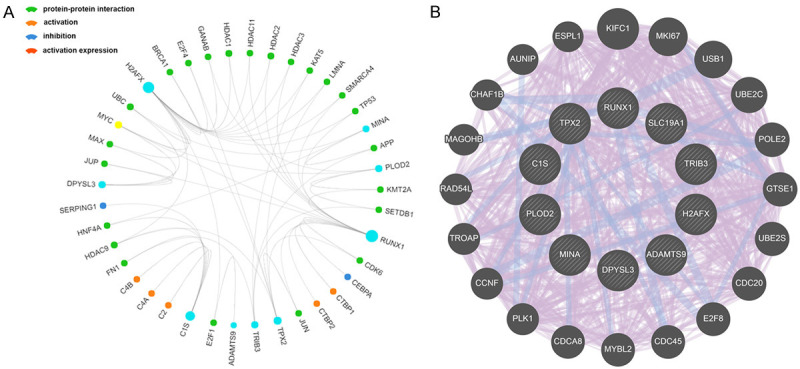
PPI network of nodes from integrated prediction model. A. The most significant genes associated with ten hub genes and their relationship, including protein-protein interaction, activation, inhibition and activation expression, were visualized in a circos plot. B. A detailed PPI network related to this gene sets were constructed to show more interrelated nodes at protein level.
Discussion
Genetic and epigenetic alterations contribute to the development and progression of RCC [28]. ccRCC, which is the most aggressive histological subtype of ccRCC, is associated with elevated mortality owing to its high metastatic potential [29]. Unfortunately, the underlying mechanisms of oncogenesis and metastasis of ccRCC are unknown. We reasoned that microarray technology represents a powerful tool to fill this gap in our knowledge, because it enables comprehensive mRNA expression profiling of ccRCC through its ability to identify and characterize new biomarkers involved in tumorigenesis and progression [30,31]. Here we conducted an integrated systematic analysis microarray data of well-characterized primary and metastatic ccRCCs to identify unique gene expression profiles characteristic of tumor aggressiveness. We identified 112 DEGs and 10 prognostic hub genes associated with functional annotations in different expression levels. GSEA was used to visualize significantly enriched gene-set hallmarks of 10 selected hub genes. These findings provide the basis for further screening and identification of promising biomarkers of tumor aggressiveness.
Several scoring systems combine clinical and pathological features to determine prognosis and to accurately predict survival outcomes of patients with primary and metastatic ccRCC [32-34]. These predictive models improve the specificity and accuracy of predicting survival outcomes of patients ccRCC, and the incorporated clinicopathological parameters are surrogate measures of major fundamental mechanisms that determine the aggressiveness of malignant tumors. Moreover, proteogenomic characterization of cancers that aims to develop therapeutic strategies will benefit from the acquisition of knowledge of the details of the biological mechanisms that contribute to the oncogenesis and progression of ccRCC.
At present, there have been multiple clinical research models based on multi-center or retrospective studies to predict prognosis, which helps to predict clinical prognosis from the perspective of multiple prognostic factors. These models have the potential to change our clinical practice and guide clinicians to implement individualized research strategies, which has strong clinical guidance value. In 2018, RCClnc4 classifier has been demonstrated to have precise prognostic significance in early ccRCC using four LncRNAs [35]. A retrospective analysis and multicentre validation study also constructed a six-SNP-based classifier for predicting recurrence in localised renal cell carcinoma [36]. Interestingly, there are few researches to analyze the genomic difference between of metastatic and primary ccRCC. The present study represents the first attempt to establish a gene regulatory network incorporating metastasis-related and identifies the hub genes associated with the metastatic potential of ccRCC. Moreover, we show here that the alterations of the expression levels of ADAMTS9, C1S, DPYSL3, H2AFX, MINA, PLOD2, RUNX1, SLC19A1, TPX2, and TRIB3 were significantly associated with shorter OS and DFS, indicating that these significant DEGs may play important roles in the aggressive malignant phenotype of ccRCC.
The limitations of this study are as follows: First, the microarray data were unbalanced with respect to the numbers of ccRCC and control tissues, which were restricted in quantity and acquired from the GEO databases. Second, these microarray data comprised relatively few ccRCC samples. Furthermore, only 513 patients were enrolled from the TCGA cohort with corresponding transcriptome data and relatively complete phenotypic data. Third, a prospective cohort was not analyzed, and identification of the underlying mechanisms was not addressed. Fourth, only the mRNA levels of hub genes are shown. Thus, further functional analyses of validated cohorts are required to verify these findings.
In conclusion, the present study identifies DEGs and hub genes that may be involved in earlier recurrence and poor prognosis of ccRCC. The expression levels of ADAMTS9, C1S, DPYSL3, H2AFX, MINA, PLOD2, RUNX1, SLC19A1, TPX2, and TRIB3 have high prognostic value and may help us better understand the underlying mechanisms of oncogenesis and progression of ccRCC.
Acknowledgements
We would like to present our sincere gratitude to ccRCC patients from the FUSCC cohort. We also would like to thank Cui-Zhu Zhang, Wei-Yi Yang, and Ying Shen for helping with follow-up of patients. We thank Liwen Bianji, Edanz Editing China (www.liwenbianji.cn/ac), for editing the English text of a draft of this manuscript. This work is supported by Grants from the National Key Research and Development Project (No. 2019YFC1316000) and the National Natural Science Foundation of China (No. 81802525 and 81772706).
Disclosure of conflict of interest
None.
Abbreviations
- ccRCC
clear cell renal cell carcinoma
- DEGs
differentially expressed genes
- PPI
Protein-protein interaction
- TCGA
the Cancer Genome Atlas
- DFS
disease-free survival
- OS
overall survival
- HR
hazard ratio
- CI
confidence interval
- ROC
receiver operating characteristic curve
- AUC
Area under curve
- GO
Gene Ontology
- KEGG
Kyoto Encyclopedia of Genes and Genomes
- GSEA
Gene set enrichment analysis
Supporting Information
References
- 1.Siegel RL, Miller KD, Jemal A. Cancer statistics, 2018. CA Cancer J Clin. 2018;68:7–30. doi: 10.3322/caac.21442. [DOI] [PubMed] [Google Scholar]
- 2.Gupta K, Miller J, Li J, Russell M, Charbonneau C. Epidemiologic and socioeconomic burden of metastatic renal cell carcinoma (mRCC): a literature review. Cancer Treat Rev. 2008;34:193–205. doi: 10.1016/j.ctrv.2007.12.001. [DOI] [PubMed] [Google Scholar]
- 3.Ljungberg B, Campbell SC, Choi HY, Jacqmin D, Lee JE, Weikert S, Kiemeney LA. The epidemiology of renal cell carcinoma. Eur Urol. 2011;60:615–21. doi: 10.1016/j.eururo.2011.06.049. [DOI] [PubMed] [Google Scholar]
- 4.Kroeger N, Seligson D, Signoretti S, Yu H, Magyar C, Huang J, Belldegrun A, Pantuck A. Poor prognosis and advanced clinicopathological features of clear cell renal cell carcinoma (ccRCC) are associated with cytoplasmic subcellular localisation of Hypoxia inducible factor-2alpha. Eur J Cancer. 2014;50:1531–40. doi: 10.1016/j.ejca.2014.01.031. [DOI] [PubMed] [Google Scholar]
- 5.Oliveira R, Ivanovic R, Ramos Moreira Leite K, Viana N, Pimenta R, Junior J, Guimarães V, Morais D, Abe D, Nesrallah A, Srougi M, Nahas W, Reis S. Expression of micro-RNAs and genes related to angiogenesis in ccRCC and associations with tumor characteristics. BMC Urol. 2017;17:113. doi: 10.1186/s12894-017-0306-3. [DOI] [PMC free article] [PubMed] [Google Scholar]
- 6.Grasmann G, Smolle E, Olschewski H, Leithner K. Gluconeogenesis in cancer cells - repurposing of a starvation-induced metabolic pathway? Biochim Biophys Acta Rev Cancer. 2019;1872:24–36. doi: 10.1016/j.bbcan.2019.05.006. [DOI] [PMC free article] [PubMed] [Google Scholar]
- 7.Xu W, Xu Y, Wang J, Wan F, Wang H, Cao D, Shi G, Qu Y, Zhang H, Ye D. Prognostic value and immune infiltration of novel signatures in clear cell renal cell carcinoma microenvironment. Aging (Albany NY) 2019;11:6999–7020. doi: 10.18632/aging.102233. [DOI] [PMC free article] [PubMed] [Google Scholar]
- 8.Wu J, Xu W, Wei Y, Qu Y, Zhang H, Ye D. An integrated score and nomogram combining clinical and immunohistochemistry factors to predict high ISUP grade clear cell renal cell carcinoma. Front Oncol. 2018;8:634. doi: 10.3389/fonc.2018.00634. [DOI] [PMC free article] [PubMed] [Google Scholar]
- 9.Ho T, Serie D, Parasramka M, Cheville J, Bot B, Tan W, Wang L, Joseph R, Hilton T, Leibovich B, Parker A, Eckel-Passow J. Differential gene expression profiling of matched primary renal cell carcinoma and metastases reveals upregulation of extracellular matrix genes. Ann Oncol. 2017;28:604–610. doi: 10.1093/annonc/mdw652. [DOI] [PMC free article] [PubMed] [Google Scholar]
- 10.Scelo G, Purdue M, Brown K, Johansson M, Wang Z, Eckel-Passow J, Ye Y, Hofmann J, Choi J, Foll M, Gaborieau V, Machiela M, Colli L, Li P, Sampson J, Abedi-Ardekani B, Besse C, Blanche H, Boland A, Burdette L, Chabrier A, Durand G, Calvez-Kelm F, Prokhortchouk E, Robinot N, Skryabin K, Wozniak M, Yeager M, Basta-Jovanovic G, Dzamic Z, Foretova L, Holcatova I, Janout V, Mates D, Mukeriya A, Rascu S, Zaridze D, Bencko V, Cybulski C, Fabianova E, Jinga V, Lissowska J, Lubinski J, Navratilova M, Rudnai P, Szeszenia-Dabrowska N, Benhamou S, Cancel-Tassin G, Cussenot O, Baglietto L, Boeing H, Khaw K, Weiderpass E, Ljungberg B, Sitaram R, Bruinsma F, Jordan S, Severi G, Winship I, Hveem K, Vatten L, Fletcher T, Koppova K, Larsson S, Wolk A, Banks R, Selby P, Easton D, Pharoah P, Andreotti G, Freeman L, Koutros S, Albanes D, Männistö S, Weinstein S, Clark P, Edwards T, Lipworth L, Gapstur S, Stevens V, Carol H, Freedman M, Pomerantz M, Cho E, Kraft P, Preston M, Wilson K, Gaziano J, Sesso H, Black A, Freedman N, Huang W, Anema J, Kahnoski R, Lane B, Noyes S, Petillo D, Teh B, Peters U, White E, Anderson G, Johnson L, Luo J, Buring J, Lee I, Chow W, Moore L, Wood C, Eisen T, Henrion M, Larkin J, Barman P, Leibovich B, Choueiri T, Lathrop G, Rothman N, Deleuze J, McKay J, Parker A, Wu X, Houlston R, Brennan P, Chanock S. Genome-wide association study identifies multiple risk loci for renal cell carcinoma. Nat Commun. 2017;8:15724. doi: 10.1038/ncomms15724. [DOI] [PMC free article] [PubMed] [Google Scholar]
- 11.Ni D, Ma X, Li H, Gao Y, Li X, Zhang Y, Ai Q, Zhang P, Song EL, Huang QB, Fan Y, Zhang X. Downregulation of FOXO3a promotes tumor metastasis and is associated with metastasis-free survival of patients with clear cell renal cell carcinoma. Clin Cancer Res. 2014;20:1779–90. doi: 10.1158/1078-0432.CCR-13-1687. [DOI] [PubMed] [Google Scholar]
- 12.Clark D, Dhanasekaran S, Petralia F, Pan J, Song X, Hu Y, Leprevost F, Reva B, Lih T, Chang H, Ma W, Huang C, Ricketts C, Chen L, Krek A, Li Y, Rykunov D, Li Q, Chen L, Ozbek U, Vasaikar S, Wu Y, Yoo S, Chowdhury S, Wyczalkowski M, Ji J, Schnaubelt M, Kong A, Sethuraman S, Avtonomov D, Ao M, Colaprico A, Cao S, Cho K, Kalayci S, Ma S, Liu W, Ruggles K, Calinawan A, Gümüş Z, Geiszler D, Kawaler E, Teo G, Wen B, Zhang Y, Keegan S, Li K, Chen F, Edwards N, Pierorazio P, Chen X, Pavlovich C, Hakimi A, Brominski G, Hsieh J, Antczak A, Omelchenko T, Lubinski J, Wiznerowicz M, Linehan W, Kinsinger C, Thiagarajan M, Boja E, Mesri M, Hiltke T, Robles A, Rodriguez H, Qian J, Fenyö D, Zhang B, Ding L, Schadt E, Chinnaiyan A, Zhang Z, Omenn G, Cieslik M, Chan D, Nesvizhskii A, Wang P, Zhang H Clinical Proteomic Tumor Analysis Consortium. Integrated proteogenomic characterization of clear cell renal cell carcinoma. Cell. 2019;179:964–983. e31. doi: 10.1016/j.cell.2019.10.007. [DOI] [PMC free article] [PubMed] [Google Scholar]
- 13.Wu J, Vallenius T, Ovaska K, Westermarck J, Mäkelä T, Hautaniemi S. Integrated network analysis platform for protein-protein interactions. Nat Methods. 2009;6:75–7. doi: 10.1038/nmeth.1282. [DOI] [PubMed] [Google Scholar]
- 14.Bapat S, Krishnan A, Ghanate A, Kusumbe A, Kalra R. Gene expression: protein interaction systems network modeling identifies transformation-associated molecules and pathways in ovarian cancer. Cancer Res. 2010;70:4809–19. doi: 10.1158/0008-5472.CAN-10-0447. [DOI] [PubMed] [Google Scholar]
- 15.Sharan R, Ulitsky I, Shamir R. Network-based prediction of protein function. Mol Syst Biol. 2007;3:88. doi: 10.1038/msb4100129. [DOI] [PMC free article] [PubMed] [Google Scholar]
- 16.Edgar R, Domrachev M, Lash A. Gene expression omnibus: NCBI gene expression and hybridization array data repository. Nucleic Acids Res. 2002;30:207–10. doi: 10.1093/nar/30.1.207. [DOI] [PMC free article] [PubMed] [Google Scholar]
- 17.Franceschini A, Szklarczyk D, Frankild S, Kuhn M, Simonovic M, Roth A, Lin J, Minguez P, Bork P, von Mering C, Jensen L. STRING v9.1: protein-protein interaction networks, with increased coverage and integration. Nucleic Acids Res. 2013;41:D808–15. doi: 10.1093/nar/gks1094. [DOI] [PMC free article] [PubMed] [Google Scholar]
- 18.Smoot M, Ono K, Ruscheinski J, Wang P, Ideker T. Cytoscape 2.8: new features for data integration and network visualization. Bioinformatics. 2011;27:431–2. doi: 10.1093/bioinformatics/btq675. [DOI] [PMC free article] [PubMed] [Google Scholar]
- 19.Ashburner M, Ball C, Blake J, Botstein D, Butler H, Cherry J, Davis A, Dolinski K, Dwight S, Eppig J, Harris M, Hill D, Issel-Tarver L, Kasarskis A, Lewis S, Matese J, Richardson J, Ringwald M, Rubin G, Sherlock G. Gene ontology: tool for the unification of biology. The gene ontology consortium. Nat Genet. 2000;25:25–9. doi: 10.1038/75556. [DOI] [PMC free article] [PubMed] [Google Scholar]
- 20.Kanehisa M. The KEGG database. Novartis Found Symp. 2002;247:91–101. discussion 101-3, 119-28, 244-52. [PubMed] [Google Scholar]
- 21.Huang D, Sherman B, Tan Q, Collins J, Alvord W, Roayaei J, Stephens R, Baseler M, Lane H, Lempicki R. The DAVID gene functional classification tool: a novel biological module-centric algorithm to functionally analyze large gene lists. Genome Biol. 2007;8:R183. doi: 10.1186/gb-2007-8-9-r183. [DOI] [PMC free article] [PubMed] [Google Scholar]
- 22.Mlecnik B, Hackl H, Charoentong P, Tosolini M, Kirilovsky A, Fridman W, Pagès F, Trajanoski Z, Galon J. ClueGO: a Cytoscape plug-in to decipher functionally grouped gene ontology and pathway annotation networks. Bioinformatics. 2009;25:1091–3. doi: 10.1093/bioinformatics/btp101. [DOI] [PMC free article] [PubMed] [Google Scholar]
- 23.Cerami E, Gao J, Dogrusoz U, Gross B, Sumer S, Aksoy B, Jacobsen A, Byrne C, Heuer M, Larsson E, Antipin Y, Reva B, Goldberg A, Sander C, Schultz N. The cBio cancer genomics portal: an open platform for exploring multidimensional cancer genomics data. Cancer Discov. 2012;2:401–4. doi: 10.1158/2159-8290.CD-12-0095. [DOI] [PMC free article] [PubMed] [Google Scholar]
- 24.Camp R, Dolled-Filhart M, Rimm D. X-tile: a new bio-informatics tool for biomarker assessment and outcome-based cut-point optimization. Clin Cancer Res. 2004;10:7252–9. doi: 10.1158/1078-0432.CCR-04-0713. [DOI] [PubMed] [Google Scholar]
- 25.Asplund A, Edqvist P, Schwenk J, Pontén F. Antibodies for profiling the human proteome-the human protein atlas as a resource for cancer research. Proteomics. 2012;12:2067–77. doi: 10.1002/pmic.201100504. [DOI] [PubMed] [Google Scholar]
- 26.Subramanian A, Tamayo P, Mootha V, Mukherjee S, Ebert B, Gillette M, Paulovich A, Pomeroy S, Golub T, Lander E, Mesirov J. Gene set enrichment analysis: a knowledge-based approach for interpreting genome-wide expression profiles. Proc Natl Acad Sci U S A. 2005;102:15545–50. doi: 10.1073/pnas.0506580102. [DOI] [PMC free article] [PubMed] [Google Scholar]
- 27.Yusenko M, Ruppert T, Kovacs G. Analysis of differentially expressed mitochondrial proteins in chromophobe renal cell carcinomas and renal oncocytomas by 2-D gel electrophoresis. Int J Biol Sci. 2010;6:213–24. doi: 10.7150/ijbs.6.213. [DOI] [PMC free article] [PubMed] [Google Scholar]
- 28.Liao L, Testa J, Yang H. The roles of chromatin-remodelers and epigenetic modifiers in kidney cancer. Cancer Genet. 2015;208:206–14. doi: 10.1016/j.cancergen.2015.02.008. [DOI] [PMC free article] [PubMed] [Google Scholar]
- 29.Gumz M, Zou H, Kreinest P, Childs A, Belmonte L, LeGrand S, Wu K, Luxon B, Sinha M, Parker A, Sun L, Ahlquist D, Wood C, Copland J. Secreted frizzled-related protein 1 loss contributes to tumor phenotype of clear cell renal cell carcinoma. Clin Cancer Res. 2007;13:4740–9. doi: 10.1158/1078-0432.CCR-07-0143. [DOI] [PubMed] [Google Scholar]
- 30.Yang J, Shi S, Xu W, Qiu Y, Zheng J, Yu K, Song X, Li F, Wang Y, Wang R, Qu Y, Zhang H, Zhou X. Screening, identification and validation of CCND1 and PECAM1/CD31 for predicting prognosis in renal cell carcinoma patients. Aging (Albany NY) 2019;11:12057–12079. doi: 10.18632/aging.102540. [DOI] [PMC free article] [PubMed] [Google Scholar]
- 31.Dondeti V, Wubbenhorst B, Lal P, Gordan J, D’Andrea K, Attiyeh E, Simon M, Nathanson K. Integrative genomic analyses of sporadic clear cell renal cell carcinoma define disease subtypes and potential new therapeutic targets. Cancer Res. 2012;72:112–21. doi: 10.1158/0008-5472.CAN-11-1698. [DOI] [PMC free article] [PubMed] [Google Scholar]
- 32.Sorbellini M, Kattan M, Snyder M, Reuter V, Motzer R, Goetzl M, McKiernan J, Russo P. A postoperative prognostic nomogram predicting recurrence for patients with conventional clear cell renal cell carcinoma. J Urol. 2005;173:48–51. doi: 10.1097/01.ju.0000148261.19532.2c. [DOI] [PubMed] [Google Scholar]
- 33.Zisman A, Pantuck A, Dorey F, Said J, Shvarts O, Quintana D, Gitlitz B, deKernion J, Figlin R, Belldegrun A. Improved prognostication of renal cell carcinoma using an integrated staging system. J. Clin. Oncol. 2001;19:1649–57. doi: 10.1200/JCO.2001.19.6.1649. [DOI] [PubMed] [Google Scholar]
- 34.Leibovich B, Han K, Bui M, Pantuck A, Dorey F, Figlin R, Belldegrun A. Scoring algorithm to predict survival after nephrectomy and immunotherapy in patients with metastatic renal cell carcinoma: a stratification tool for prospective clinical trials. Cancer. 2003;98:2566–75. doi: 10.1002/cncr.11851. [DOI] [PubMed] [Google Scholar]
- 35.Qu L, Wang Z, Chen Q, Li Y, He H, Hsieh J, Xue S, Wu Z, Liu B, Tang H, Xu X, Xu F, Wang J, Bao Y, Wang A, Wang D, Yi X, Zhou Z, Shi C, Zhong K, Sheng Z, Zhou Y, Jiang J, Chu X, He J, Ge J, Zhang Z, Zhou W, Chen C, Yang J, Sun Y, Wang L. Prognostic value of a long non-coding RNA signature in localized clear cell renal cell carcinoma. Eur Urol. 2018;74:756–763. doi: 10.1016/j.eururo.2018.07.032. [DOI] [PubMed] [Google Scholar]
- 36.Wei J, Feng Z, Cao Y, Zhao H, Chen Z, Liao B, Wang Q, Han H, Zhang J, Xu Y, Li B, Wu J, Qu G, Wang G, Liu C, Xue W, Liu Q, Lu J, Li C, Li P, Zhang Z, Yao H, Pan Y, Chen W, Xie D, Shi L, Gao Z, Huang Y, Zhou F, Wang S, Liu Z, Chen W, Luo J. Predictive value of single-nucleotide polymorphism signature for recurrence in localised renal cell carcinoma: a retrospective analysis and multicentre validation study. Lancet Oncol. 2019;20:591–600. doi: 10.1016/S1470-2045(18)30932-X. [DOI] [PubMed] [Google Scholar]
Associated Data
This section collects any data citations, data availability statements, or supplementary materials included in this article.


