

Abstract
Hot flashes (HF) are intense, transient feelings of heat usually accompanied with flushed skin and sweating that are experienced by women around the time of menopause. HFs are associated with poor quality of life and increased cardiovascular risk. Automatic detection of HF occurrence and precise timing of HF onset could provide unique insight into the physiology of the HF and its effect on the cardiovascular system. A novel automatic algorithm is proposed for the detection of HFs occurrence and timing from the sternal skin conductance signal that is robust to noise and artifacts. The method is based on the gold standard rule (2 μS rise in skin conductance within 30 s) and considers several conditions based on the skin conductance level and its derivative to reject unwanted events. ECG-derived heart rate pattern variations are studied prior to the detected HF onset. The algorithm is validated against expert detected HFs over 200 hours of sleep data collected from 12 perimenopausal women. It achieved a total accuracy of 93% and a total error of 3% in HF detection. It was observed that heart rate increased before the onset of 80% of the HFs occurring in undisturbed sleep. Application of this algorithm along with fusion of other simultaneously recorded physiological measures has the potential to advance understanding of the HF.
I. INTRODUCTION
A hot flash (HF), also called vasomotor symptoms or hot flush, is a sensation of heat, sweating, flashing, anxiety and chills that may occur hourly or daily lasting between 3 and 10 min [1]. HFs are a common symptom in women approaching menopause and post-menopause, affecting up to 80% of women [2–4].
Menopausal HFs occur in association with a shift in reproductive hormone levels, with an increase in follicle stimulating hormone and decrease in estradiol in the approach to menopause. This withdrawal of estrogen is hypothesized to impact the stability of the central thermoregulatory center in the brain, leading to the manifestation of HFs [5]. HFs negatively influence daytime functioning, work productivity, mood, and sleep, and are also linked with increased risk for cardiovascular disease in later life [6].
HF frequency, timing, severity, and triggers are important parameters to consider in devising HF management strategies beyond hormone therapy and to advance understating of the physiology of HFs and their impact on sleep, quality of life, and cardiovascular health.
A HF is objectively identified by a sudden increase in sternal skin conductivity due to the sweat response, which tails off as sweating decreases (see Fig. 1), considered the gold-standard method of measuring HF frequency [7–14]. The most widely accepted rule for the detection of a HF is based on an observed rapid rise of at least 2 μS in sternal skin conductance within a 30-second period [8–11]. Pattern recognition techniques such as support vector machines, neural networks and template matching have been used to classify HFs [7, 13, 14]. Though such techniques have reported improved results, they rely on a large training dataset of HF patterns and their performance may degrade when encountering new HF patterns not seen during training.
Figure 1.

Skin conductance variations representing HF occurence.
Automatic detection of HFs is crucial for analysis of physiological data collected over extended time periods where expert-scoring is not feasible. While some of the existing techniques are automatic, they mostly are based on analyzing artifact-free skin conductance signals and/or require expert manual scoring in which the rapid voltage changes caused by movement artifacts and electrode displacements are identified and discarded from further analysis. Moreover, the existing methods identify HF events within a time period (usually 10 or 20 min) without considering the exact timing of HF onset. Knowledge of the exact timing of a HF can further enhance the understanding of its physiology and mechanisms linking HFs to cardiovascular risk, such as via impact on the autonomic nervous system [15, 16]. A fully automatic algorithm is needed for the detection of HF occurrence, with precise time resolution that can perform well in noise and artifact conditions without the need for expert scoring.
The focus of this paper is the demonstration of a novel automatic approach to improve the reliability of HF physiology analysis using sternal skin conductance. New algorithms are developed for the detection of HFs and the timing of their onset, as well as rejection of noise and artifacts by analyzing the skin conductance level and slope. The algorithm is validated on sleep data collected from 12 perimenopausal women against expert identified HFs. To serve as an example of how the algorithm can be applied to study physiological changes around the HF, heart rate pattern is further analyzed before the detected onsets of HFs uncontaminated by sleep disturbances.
The paper is organized as follows. In Section II the experimental design, the proposed automatic HF detection algorithm, and the data analysis details are provided. In Section III, the experimental results obtained on a dataset of 84 HFs identified on the skin conductance signal are summarized and discussed, and in Section IV the paper is concluded.
II. Methodology
A. Experimental Design
Objective HFs were assessed in 12 perimenopausal women (8 Caucasian; Age, 53.4 ± 3 years) over 26 polysomnographic (PSG) nights spent at the SRI International Human Sleep Research Laboratory. Menopausal status was defined according to the Stages of Reproductive Aging Workshop criteria [17]. None of the women met criteria for a sleep disorder other than insomnia (e.g., breathing or leg movement disorders) as confirmed by PSG. Women were free from severe medical conditions (e.g., major depressive disorder), and none of them were currently taking medications affecting their sleep or cardiovascular system. The study was reviewed and approved by SRI International’s Institutional Review Board. Written informed consent was obtained from each participant.
A standard PSG, i.e. assessment of electroencephalogram (EEG: F3/4, C3/4, O3/4 referenced to the contralateral mastoids; 256 Hz sampled and 0.3–35 Hz filtered), submental electromyogram and bilateral electrooculogram, was performed according to American Academy of Sleep Medicine (AASM) criteria [18] using Grael HD PSG/EEG amplifiers (Compumedics, Abbotsford, Victoria, Australia). PSG records were scored in 30-s epochs (wake, N1, N2, N3 and rapid-eyes-movement [REM] sleep) according to AASM rules. ECG was also collected (512 Hz) via Ag/AgCl Meditrace surface spot electrodes in a modified lead II Einthoven configuration. Sternal skin conductance was measured with a BioDerm Skin Conductance Meter (model 2701; UFI, Morro Bay, CA). Two 1.5 cm in diameter Ag/AgCl electrodes filled with 0.05 M potassium chloride Velvachol/glycol gel [19] were placed on either side of the sternum (about 4 cm apart). A 0.5-V constant voltage circuit [20] was maintained between them. The Bioderm was connected via an optically isolated DC input to Compumedics amplifiers and the skin conductance signal was sampled at 16 Hz and co-registered online as a PSG channel. Participants slept in temperature-controlled and sound-attenuated bedrooms.
B. Automatic Algorithm
A novel algorithm was developed for the detection of HFs and the precise timing of their onset during sleep from the sternal skin conductance signal based on the gold standard 2 μS/30 s rule [10]. To avoid any unwanted events, several conditions based on the skin conductance signal and its derivative level and timing were considered. The proposed HF detection algorithm is summarized in Fig. 2 and its main steps are shown in Fig. 3 on real skin conductance data.
Figure 2.

Automatic algorithm for the detection of HF occurrence and timing.
Figure 3.
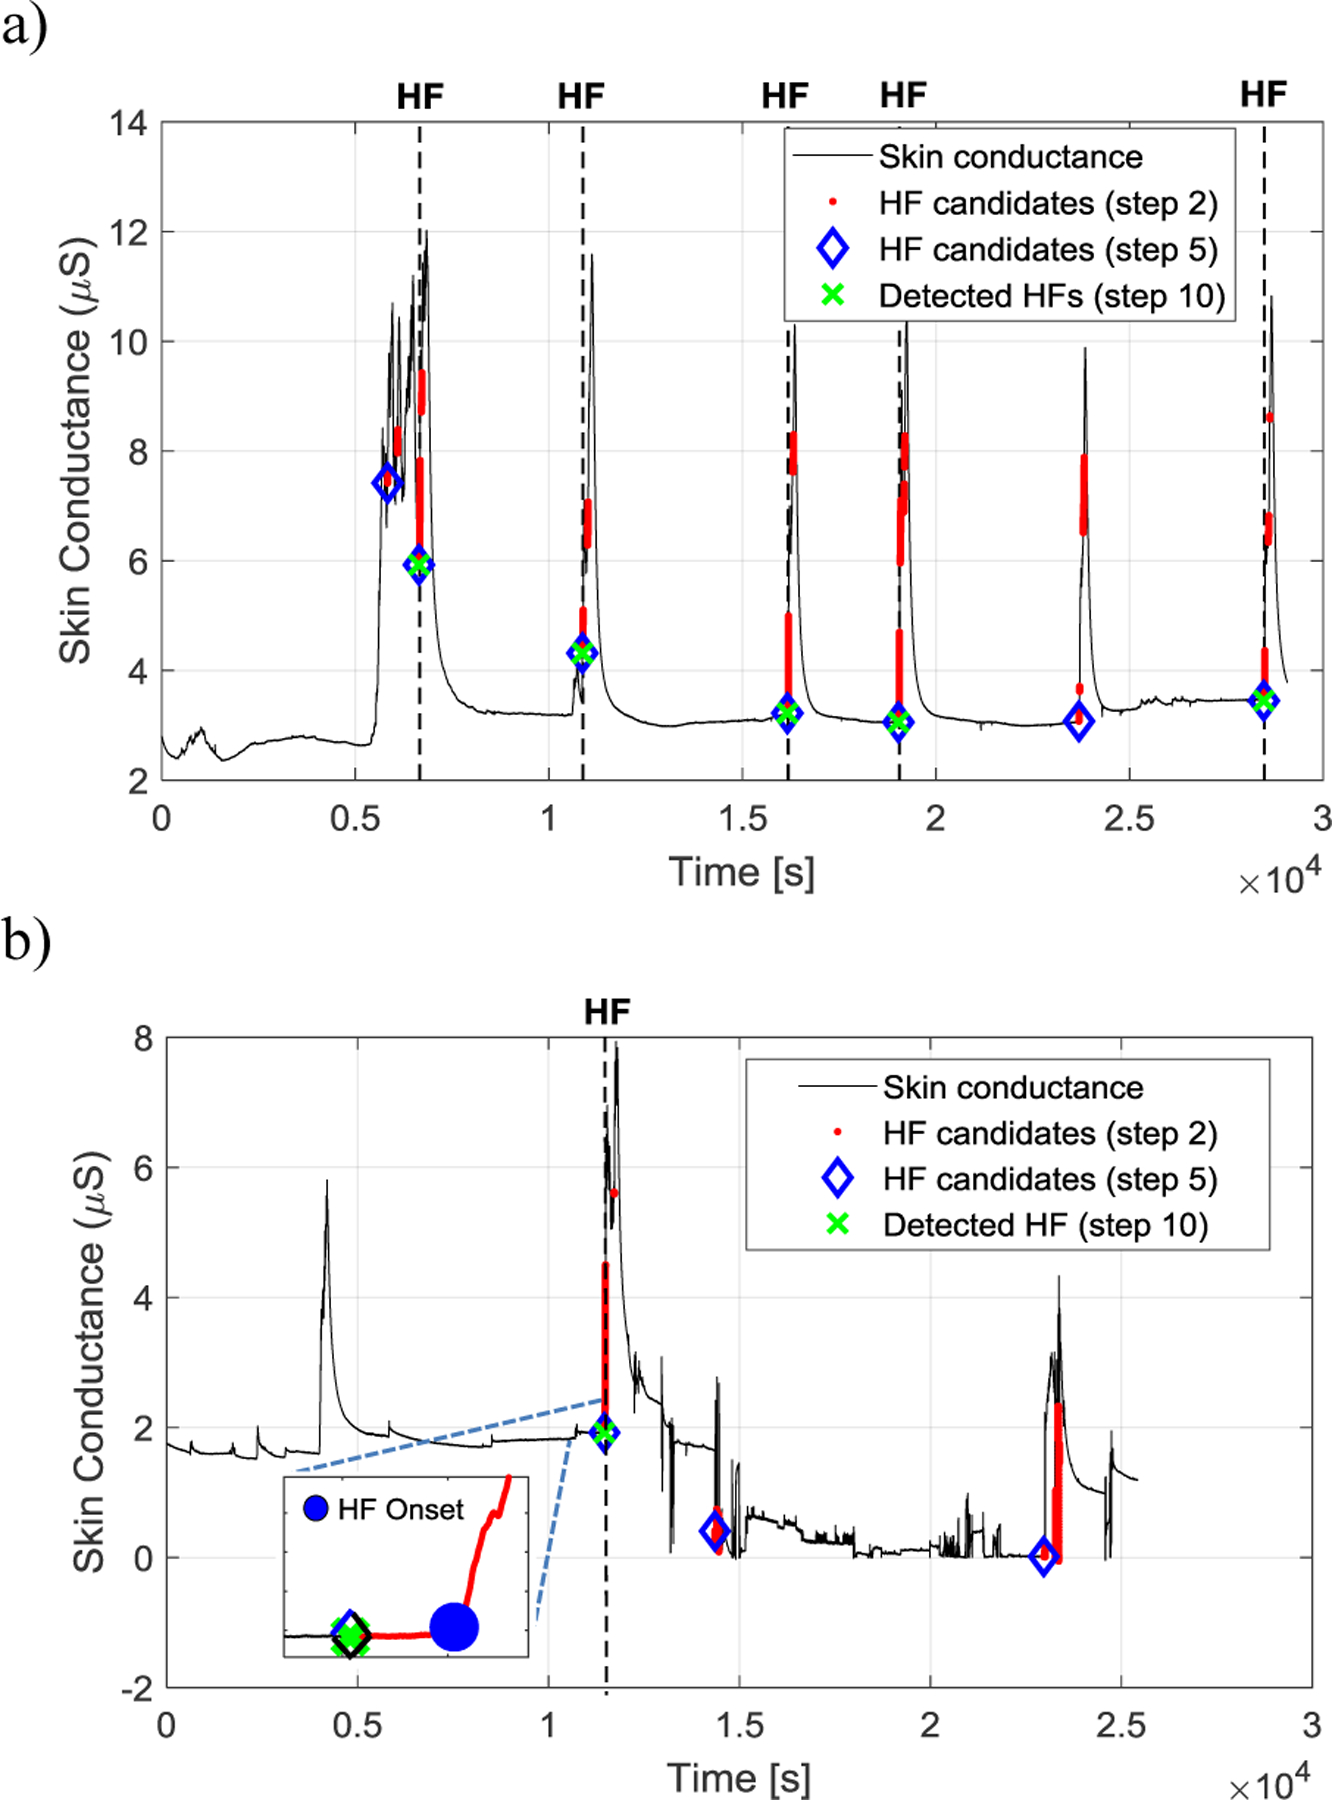
Examples of HF detection using the proposed autmatic algorithm. The skin conductance signal is shown in black and the HF candidates after steps 2, 5, and 10 (see Fig. 2) are shown in red dots, blue diamonds, and green crosses, respectively. The locations of the expert visually identified HFs are shown by black vertical dashed lines. An example of the detected HF onset is shown in the inset in Fig. 3(b).
The skin conductance signal was digitally filtered using a 4th-order Butterworth lowpass filter with a cutoff frequency of 2 Hz to remove the high frequency noise. The filter was applied in both forward and backward directions to avoid any phase shift. Skin conductance signal samples preceding a ≥2 μS rise in amplitude within a 30-second interval were then detected. This ensured that only significant changes in skin conductance level that are more likely representing HFs rather than other physiological and/or psychological arousals be selected [10]. Each set of the detected skin conductance signal samples that were connected in time formed a HF candidate. Those HF candidates shorter than a second were removed as the HF rapid rise usually lasts at least several seconds [5]. The first sample of the remaining HFs was then chosen as the HF candidate and the rest of their samples were discarded. A 10-minute refractory period following a HF candidate was applied during which the rest of the candidates were removed as HFs typically last less than 10 min [1, 14]. The derivative of the skin conductance signal was derived and the slope was calculated. The HF onset candidates with a maximum slope of greater than 4 μS/s in their following 30-s interval or a minimum slope of less than −4 μS/s in their preceding 30-sec interval were removed. This rule rejects those HF candidates that are accompanied a very fast change in skin conductance which is not physiologically possible and are more likely due to rapid voltage changes caused by movement artifacts and electrode displacements. The minimum of the skin conductance signal within a −30-s to +30-s time window around the HF candidates was calculated and those candidates with a minimum of less than 0.05 μS were removed as the skin conductance signal level is always well above zero [21]. A latency window before each HF was further considered to avoid those rises in skin conductance signal that follow another continuous activation. To do so, standard deviation of the skin conductance signal within a 30-s window prior the HF candidate was calculated. Any HF candidate with a standard deviation of greater than 0.2 μS was removed. The remaining HF candidates were considered as the true HFs.
To detect the HF onset, the skin conductance signal was digitally filtered using a 4th-order Butterworth lowpass filter with a cutoff frequency of 0.1 Hz (in both forward and backward directions to avoid any phase shift) to remove any fast oscillations. The slope of the skin conductance signal within a 30-s window following the HF was calculated and the first sample at which the slope reached at least 0.02 μS/s was selected at the HF onset.
C. Data Analysis
HFs were manually evaluated by an expert (MdZ), blinded to the algorithm scoring, for fluctuations meeting the accepted standard criteria for physiological HFs [10], which marked the onset of a HF.
True positive (TP), false positive (FP), false negative (FN), and true negative (TN) rates were calculated according to the expert scores. An algorithm detected HF was marked as a TP when its onset was within a minute time interval of an expert identified HF onset and as a FP otherwise. Those expert identified HFs that did not accompany an algorithm detected HF, were marked as a FN. All non-overlapping 10-min intervals lacking both algorithm and expert detected HFs were marked as TNs [14].
The performance of the proposed algorithm was evaluated in terms of total accuracy (TP+TN/TP+TN+FP+FN), total error (FP+FN/TP+TN+FP+FN), sensitivity (TP/TP +FN), specificity (TN/FP+TN), positive predictive value (TP/TP+FP), and negative predictive value (TN/TN+FN).
ECG R-peaks were detected using a customized peak detection algorithm [22] and the instantaneous heart rate was derived within a 30-s time window before the HF onset. Heart rate was calculated as HR = 60/RR bpm, where RR is the time difference between two consecutive R-peaks. In order to limit other factors causing heart rate variations, the analysis was limited to those HFs following undisturbed sleep (N2 and N3 stages) within a 60 s time window prior to the HF onset. A slope index was calculated by fitting a first order polynomial curve to the heart rate signal [23] to identify ascending and descending heart rate patterns.
All the algorithms were developed in MATLAB R2017a (MathWorks, INC., Natick, MA).
III. Results
Figure 3 shows examples of HF detection from the skin conductance signal. It is shown how the proposed algorithm improves the detection of HFs and rejects other events and artifacts in different steps.
Over 200 hours of sleep data collected from 12 perimenopausal women were analyzed. A total number of 84 HFs were scored by the expert among which 72 were correctly detected by the proposed algorithm (TP). The algorithm also detected 18 HFs that were not scored by the expert as a HF (FP). The proposed algorithm achieved a total accuracy of 93%, total error of 3%, sensitivity of 86%, specificity of 98%, predictive positive value of 80%, and negative predictive value of 99%, which shows close agreement with the reference.
The detected onset of those HFs that were correctly identified by the algorithm were used to study the heart rate pattern before the HF onset. Among the 72 truly detected HFs only those that followed at least 60 s of N2 or N3 sleep stages were analyzed (51 HFs). This ensured that the variations observed in heart rate were mainly due to the following occurring HF rather than other events like awakenings. It was observed that 80% of the HFs followed an increase in heart rate (having a positive slope index). Figure 4 shows the average ascending pattern of heart rate 30 s before the HF onset.
Figure 4.

Heart rate average pattern 30 s prior the HFs onset. The heart rate average values are shown in red circles and the standard errors are shown in blue vertical bars.
IV. Conclusions
HFs have significant negative influence on quality of life and may lead to higher cardiovascular risk. However, the HF physiology still requires further study. Here, we proposed an automatic algorithm for the detection of HFs and their onset that can be adopted for evaluation of HF physiology over extended time periods where self-reports and expert scoring are not feasible. The algorithm was evaluated on sleep data collected from 12 perimenopausal women and found to achieve close agreement with the expert scores.
The parameters of the proposed algorithm were empirically set based on known physiological variations of skin conductance. Optimum parameters of the algorithm can be found using a cross-validation technique.
An example of the application of the algorithm was provided in Section III, showing an increase in heart rate before HF onset in the majority (80%) of cases. These data correspond with early work suggesting increased sympathetic activation at HF onset [24]. Fusion of other simultaneously recorded physiological measures such as blood pressure, pulse pressure, pre-ejection period, etc. can lead to a better understanding of physiological changes coincident with a HF and may also lead to more accurate detection of HFs and characterization of objective HF severity beyond frequency.
In this study, the focus was on the detection of HF onset. Future work should be directed toward the detection of HF offset as well. This can further improve the precision of any physiological analysis around HFs.
Acknowledgments
Research supported by the National Institutes of Health, HL103688 (FCB).
Contributor Information
Mohamad Forouzanfar, Center for Health Sciences, SRI International, Menlo Park, CA 94025, USA..
Massimiliano de Zambotti, Center for Health Sciences, SRI International, Menlo Park, CA 94025, USA..
Aimée Goldstone, Center for Health Sciences, SRI International, Menlo Park, CA 94025, USA..
Fiona C. Baker, Center for Health Sciences, SRI International, Menlo Park, CA 94025, USA.
References
- [1].Kronenberg F, “Menopausal hot flashes: a review of physiology and biosociocultural perspective on methods of assessment,” J Nutr, vol. 140, pp. 1380S–5S, July 2010. [DOI] [PubMed] [Google Scholar]
- [2].Avis NE, Crawford SL, Greendale G, Bromberger JT, Everson-Rose SA, Gold EB, et al. , “Duration of menopausal vasomotor symptoms over the menopause transition,” JAMA Intern Med, vol. 175, pp. 531–9, April 2015. [DOI] [PMC free article] [PubMed] [Google Scholar]
- [3].Gold EB, Colvin A, Avis N, Bromberger J, Greendale GA, Powell L, et al. , “Longitudinal analysis of the association between vasomotor symptoms and race/ethnicity across the menopausal transition: Study of women’s health across the nation,” Am J Public Health, vol. 96, pp. 1226–35, July 2006. [DOI] [PMC free article] [PubMed] [Google Scholar]
- [4].Woods NF, Mitchell ES, and Landis C, “Anxiety, hormonal changes, and vasomotor symptoms during the menopause transition,” Menopause, vol. 12, pp. 242–5, May-Jun 2005. [DOI] [PubMed] [Google Scholar]
- [5].Freedman RR, “Physiology of hot flashes,” Am J Hum Biol, vol. 13, pp. 453–64, Jul-Aug 2001. [DOI] [PubMed] [Google Scholar]
- [6].Thurston RC, Christie IC, and Matthews KA, “Hot flashes and cardiac vagal control: a link to cardiovascular risk?,” Menopause, vol. 17, pp. 456–61, May-Jun 2010. [DOI] [PMC free article] [PubMed] [Google Scholar]
- [7].Bahr DE, Webster JG, Grady D, Kronenberg F, Creasman J, Macer J, et al. , “Miniature ambulatory skin conductance monitor and algorithm for investigating hot flash events,” Physiol Meas, vol. 35, pp. 95–110, February 2014. [DOI] [PMC free article] [PubMed] [Google Scholar]
- [8].Carpenter JS, Andrykowski MA, Freedman RR, and Munn R, “Feasibility and psychometrics of an ambulatory hot flash monitoring device,” Menopause, vol. 6, pp. 209–15, Fall 1999. [DOI] [PubMed] [Google Scholar]
- [9].de Zambotti M, Colrain IM, Javitz HS, and Baker FC, “Magnitude of the impact of hot flashes on sleep in perimenopausal women,” Fertil Steril, vol. 102, pp. 1708–15 e1, December 2014. [DOI] [PMC free article] [PubMed] [Google Scholar]
- [10].Freedman RR, “Laboratory and ambulatory monitoring of menopausal hot flashes,” Psychophysiology, vol. 26, pp. 573–9, September 1989. [DOI] [PubMed] [Google Scholar]
- [11].Freedman RR, Norton D, Woodward S, and Cornelissen G, “Core body temperature and circadian rhythm of hot flashes in menopausal women,” J Clin Endocrinol Metab, vol. 80, pp. 2354–8, August 1995. [DOI] [PubMed] [Google Scholar]
- [12].Savard MH, Savard J, and Ivers H, “Validation of a sternal skin conductance criterion for measuring hot flashes in breast cancer patients,” Menopause, vol. 21, pp. 165–9, February 2014. [DOI] [PubMed] [Google Scholar]
- [13].Thurston RC, Hernandez J, Del Rio JM, and De La Torre F, “Support Vector Machines to improve physiologic hot flash measures: application to the ambulatory setting,” Psychophysiology, vol. 48, pp. 1015–21, July 2011. [DOI] [PMC free article] [PubMed] [Google Scholar]
- [14].Thurston RC, Matthews KA, Hernandez J, and De La Torre F, “Improving the performance of physiologic hot flash measures with support vector machines,” Psychophysiology, vol. 46, pp. 285–92, March 2009. [DOI] [PMC free article] [PubMed] [Google Scholar]
- [15].de Zambotti M, Colrain IM, Sassoon SA, Nicholas CL, Trinder J, and Baker FC, “Vagal withdrawal during hot flashes occurring in undisturbed sleep,” Menopause, vol. 20, pp. 1147–53, November 2013. [DOI] [PMC free article] [PubMed] [Google Scholar]
- [16].Thurston RC, Christie IC, and Matthews KA, “Hot flashes and cardiac vagal control during women’s daily lives,” Menopause, vol. 19, pp. 406–12, April 2012. [DOI] [PMC free article] [PubMed] [Google Scholar]
- [17].Soules MR, Sherman S, Parrott E, Rebar R, Santoro N, Utian W, et al. , “Executive summary: Stages of Reproductive Aging Workshop (STRAW),” Fertil Steril, vol. 76, pp. 874–8, November 2001. [DOI] [PubMed] [Google Scholar]
- [18].Iber C, The AASM manual for the scoring of sleep and associated events: rules, terminology and technical specifications: American Academy of Sleep Medicine, 2007. [Google Scholar]
- [19].Dormire SL and Carpenter JS, “An alternative to Unibase/glycol as an effective nonhydrating electrolyte medium for the measurement of electrodermal activity,” Psychophysiology, vol. 39, pp. 423–6, July 2002. [DOI] [PubMed] [Google Scholar]
- [20].Lykken DT and Venables PH, “Direct measurement of skin conductance: a proposal for standardization,” Psychophysiology, vol. 8, pp. 656–72, September 1971. [DOI] [PubMed] [Google Scholar]
- [21].Dawson M, Schell A, and Filion D, “The Electrodermal System,” in Handbook of Psychophysiology, Cacioppo J, Tassinary L, and Berntson G, Eds., ed: Cambridge University Press, 2007, pp. 159–181. [Google Scholar]
- [22].Forouzanfar M, de Zambotti M, McCall C, Giovangrandi L, and Kovacs GTA, “Toward a better noninvasive assessment of pre-ejection period: a novel automatic algorithm for B-point detection and correction on thoracic impedance cardiogram,” Psychophysiology, 2018. [DOI] [PMC free article] [PubMed] [Google Scholar]
- [23].Shahrbabaki SS, Ahmed B, Penzel T, and Cvetkovic D, “Blood pressure and cardiovascular parameters during sleep arousals,” Conf Proc IEEE Eng Med Biol Soc, vol. 2017, pp. 2830–2833, July 2017. [DOI] [PubMed] [Google Scholar]
- [24].Sturdee DW, Wilson KA, Pipili E, and Crocker AD, “Physiological aspects of menopausal hot flush,” Br Med J, vol. 2, pp. 79–80, July 8 1978. [DOI] [PMC free article] [PubMed] [Google Scholar]