

Abstract
The nucleus accumbens shell (NAcSh) regulates emotional and motivational responses, a function mediated, in part, by integrating and prioritizing extensive glutamatergic projections from limbic and paralimbic brain regions. Each of these inputs is thought to encode unique aspects of emotional and motivational arousal. The projections do not operate alone, but rather are often activated simultaneously during motivated behaviors, during which they can interact and coordinate in shaping behavioral output. To understand the anatomic and physiological bases underlying these interprojection interactions, the current study in mice of both sexes focused on how the basolateral amygdala projection (BLAp) to the NAcSh regulates, and is regulated by, projections from the medial prefrontal cortex (mPFCp) and paraventricular nucleus of the thalamus (PVTp). Using a dual-color SynaptoTag technique combined with a backfilling spine imaging strategy, we found that all three afferent projections primarily targeted the secondary dendrites of NAcSh medium spiny neurons, forming putative synapses. We detected a low percentage of BLAp contacts closely adjacent to mPFCp or PVTp presumed synapses, and, on some rare occasions, the BLAp formed heterosynaptic interactions with mPFCp or PVTp profiles or appeared to contact the same spines. Using dual-rhodopsin optogenetics, we detected signs of dendritic summation of BLAp with PVTp and mPFCp inputs. Furthermore, high-frequency activation of BLAp synchronous with the PVTp or mPFCp resulted in a transient enhancement of the PVTp, but not mPFCp, transmission. These results provide anatomic and functional indices that the BLAp interacts with the mPFCp and PVTp for informational processing within the NAcSh.
SIGNIFICANCE STATEMENT The nucleus accumbens regulates emotional and motivational responses by integrating extensive glutamatergic projections, but the anatomic and physiological bases on which these projections integrate and interact remain underexplored. Here, we used dual-color synaptic markers combined with backfilling of nucleus accumbens medium spiny neurons to reveal some unique anatomic alignments of presumed synapses from the basolateral amygdala, medial prefrontal cortex, and paraventricular nucleus of thalamus. We also used dual-rhodopsin optogenetics in brain slices, which reveal a nonlinear interaction between some, but not all, projections. These results provide compelling anatomic and physiological mechanisms through which different glutamatergic projections to the nucleus accumbens, and possibly different aspects of emotional and motivational arousal, interact with each other for final behavioral output.
Keywords: algebraic summation, basolateral amygdala, heterosynaptic, nucleus accumbens, paraventricular nucleus of thalamus, prefrontal cortex
Introduction
The nucleus accumbens shell (NAcSh) is a key brain region that integrates emotional and motivational arousals for adaptive behavioral output (Mogenson et al., 1980; Wolf, 2010). These arousals are thought to be differentially encoded by multiple glutamatergic projections that converge onto individual medium spiny neurons (MSNs), principal cells that mediate the output of NAcSh (French and Totterdell, 2002, 2003; Sesack and Grace, 2010; Everitt, 2014). The basolateral amygdala (BLA) is a key limbic region that projects to the NAcSh. Through monosynaptic contacts (Johnson et al., 1994), the BLA projection (BLAp) directly activates NAcSh MSNs, and this activation either directly produces rewarding effects or regulates reward-motivated responses (Setlow et al., 2002; Shiflett and Balleine, 2010; Stuber et al., 2011; Lee et al., 2013; Janak and Tye, 2015; Wang et al., 2020). However, the BLAp does not operate independently during motivated behaviors. Rather, it is often activated simultaneously with other glutamatergic projections, among which the current study focused on the projections from the medial prefrontal cortex (mPFCp) and paraventricular nucleus of the thalamus (PVTp; Stevenson and Gratton, 2003; Mashhoon et al., 2010; Janak and Tye, 2015; Abivardi and Bach, 2017; Kerestes et al., 2017; Millan et al., 2017; Otis et al., 2019; Zhou and Zhu, 2019).
Both the mPFCp and PVTp form monosynaptic contacts onto NAcSh MSNs (Sesack and Pickel, 1992; Pinto et al., 2003) and, on activation, generate EPSCs and trigger action potential firing (Ma et al., 2014; Neumann et al., 2016; Zhu et al., 2016; Yu et al., 2017). The mPFCp and PVTp are also differentially implicated in motivated behaviors. For example, the mPFC is dynamically activated in animals performing motivated behaviors, and experimental activation of the mPFC or mPFCp inhibits behavior, suggesting the mPFCp as a key projection through which the cortex provides top-down cognitive, motivational, and emotional control (Jentsch and Taylor, 1999; Peters et al., 2008; Feil et al., 2010; LaLumiere et al., 2012; Chen et al., 2013; Ferenczi et al., 2016). On the other hand, the PVT receives inputs related to visceral arousal, energy needs, circadian rhythms, rewards and environmental cues, and relays processed information to the NAcSh for prioritization and eventual behavioral output (Kelley, 2004; Sesack and Grace, 2010; Haight and Flagel, 2014; Hsu et al., 2014; Koob and Volkow, 2016; Zhu et al., 2016). For appropriate and coherent initiation of motivated behavior, information from the mPFCp and PVTp must be effectively integrated and coordinated with the BLAp. This study was designed to examine the interaction of these NAcSh projections at anatomic and physiological levels. We asked three questions. (1) Does the mPFCp or PVTp contact the same dendrites of an NAcSh MSN as receive putative synapses from the BLAp for potential dendritic integration? (2) Does the mPFCp or PVTp contact common dendrites proximal to BLAp presumed synapses for potential heterosynaptic interaction? (3) Does the mPFCp or PVTp electrophysiologically regulate the responses of NAcSh MSNs to BLAp synapses?
To address these questions, we used the dual-color SynaptoTag approach to examine how BLAp presumed synapses align with mPFCp or PVTp contacts on the dendrites of filled NAcSh MSNs. We also used a dual-rhodopsin system to optogenetically examine how BLAp synapses interact with mPFCp or PVTp in brain slices. Our results provide anatomic and physiological insights into how and to what degree the BLAp interacts and coordinates with the mPFCp and PVTp for functional integration and ultimately regulation of behavioral output of the NAcSh.
Materials and Methods
Subjects.
Both male and female C57BL/6J wild-type mice (The Jackson Laboratory) at the age of 5–6 weeks were used for in vivo viral injection. Mice were singly housed on a regular 12 h light/dark cycle (light on at 7:00 A.M./off 7:00 P.M.), with food and water available ad libitum. When the mice were used for anatomic or electrophysiological experiments, they were 8–12 weeks old. The animals were used in accordance with the National Institutes of Health Guide for the Care and Use of Laboratory Animals and under protocols approved by the Institutional Animal Care and Use Committees at the University of Pittsburgh.
Viral vectors and drugs.
Recombinant adeno-associated virus (AAV) vectors were used for in vivo viral-mediated gene expression. SynaptoTag AAV2-Synaptobrevin2-EGPF and AAV2-Synaptobrevin2-mScarlet were cloned by restriction cloning and gene synthesis with the use of the plasmid SynaptoTag as a backbone viral vector (Xu and Südhof, 2013). Briefly, the AAV2 genomic backbone expressing Venus tagged with the intended gene was pseudotyped with AAV2, or eight capsid proteins. HEK293T cells were cotransfected with the plasmids pF6 (adenoviral helper plasmid), pRVI, pH21 for AAV1/2, or pDP8rs for AAV8 together with the AAV2 plasmid, using linear polyethylenimine-assisted transfection (Suska et al., 2013). Cultures grown in DMEM (Biochrom) with 10% substituted FBS (catalog #S0115, Biochrom) were harvested from 15 dishes (15 cm diameter) after 48 h. AAVs were harvested and purified as described previously (Lee et al., 2013; Suska et al., 2013). AAV-ChR2-EYFP and AAV-Chrimson-tdTomato were purchased from the University of North Carolina Virus Core. All chemicals for making solutions were purchased from Sigma-Aldrich.
In vivo viral injection.
Mice were anesthetized with a ketamine (50 mg/kg)–xylazine (5 mg/kg) mixture injected intraperitoneally. A 33 gauge injection needle was used to bilaterally inject 1 μl/site (0.33 μl/min) of the AAV solution into the BLA [in mm: anteroposterior (AP), −1.10; mediolateral (ML), ±2.95; dorsoventral (DV), −5.10], mPFC (AP, +1.90; ML, ±0.31; DV, −2.70), or PVT (AP, −1.0; ML, 0; DV, −2.95). After surgery, mice were placed on a heating pad for recovery. Carprofen (5 mg/kg, s.c.) was injected daily for up to 3 d after surgery. Mice were kept in their home cages for 4–5 weeks for viral expression before anatomic or electrophysiological experiments.
Slice preparation for spine and SynaptoTag imaging.
Mice with SynaptoTag viral expression were first anesthetized with isoflurane and then perfused with ice-cold 1% PFA in 0.1 m phosphate buffer, followed by 4% PFA and 0.125% glutaraldehyde in 0.1 m phosphate buffer. Brains were removed and postfixed in 4% PFA and 0.125% glutaraldehyde in 0.1 m phosphate buffer for 12–14 h at 4°C. Following postfix, the brains were transferred into 0.1 m PBS and sectioned into 300-μm-thick slices using a VT1200S vibratome (Leica). Cell filling was performed within 8 h after slicing in a regular electrophysiological rig equipped with a fluorescence microscope (Olympus). All cells that were chosen for filling were from the medial NAcSh, where the expression of both SynaptoTag colors exhibited similar degrees of brightness. For a chosen cell, we “backfilled” it with CF633 hydrazide (catalog #SCJ4600037, Sigma-Aldrich), using single-cell microinjections (Dumitriu et al., 2011). Specifically, the cell was impaled with a fine micropipette containing 5 mm CF633 hydrazide dissolved in 2 m KCl and injected with 5–10 nA of positive current until the dendrites and spines were filled under visual guidance. The slices were then mounted in Invitrogen ProLong Gold Antifade (Thermo Fisher Scientific) on slides for imaging. Spacers (300 μm thick) were placed along the edge of the slide before mounting to avoid tissue compression.
SynaptoTag and spine imaging.
Images were captured with a Leica TCS SP5 confocal microscope, equipped with Application Suite software (Leica). All images were obtained under the sequential scanning mode at a 700 Hz scanning speed to detect multiple fluorophores, which prevented cross talk among channels. To reduce image graininess, a frame-averaging mode was applied, which allowed the software to rescan each slice four times and average automatically. Both EGFP and mScarlet fluorophores were excited by the same imaging configurations, which included, for example, the laser power, gain, offset, and pinhole, to rule out any artificial factors from hardware settings. The laser power for EGFP and mScarlet was <20%. For CF633, the laser power was <10%. Individual dendritic segments were focused and scanned at 0.2 μm intervals along the z-axis to obtain a z-stack. All images were deconvolved using Leica Application Suite software before final data analysis. Spines and SynaptoTag signals in axon varicosities were counted and analyzed manually (Graziane et al., 2016; Wright et al., 2020). Only dendrites that exhibited spines were sampled. Approximately 70% of primary dendrites did not exhibit spine-like protrusions and were not sampled.
Slice preparation for electrophysiology.
To prepare fresh slices for electrophysiology, we decapitated mice under isoflurane anesthesia. Sagittal slices (250 μm) containing the NAcSh were prepared on a VT1200S vibratome (Leica) in a 4°C cutting solution containing the following (in mm): 135 N-methyl-d-glutamine, 1 KCl, 1.2 KH2PO4, 0.5 CaCl2, 1.5 MgCl2, 20 choline-HCO3, and 11 glucose, saturated with 95% O2/5% CO2, and pH adjusted to 7.4 with HCl. Osmolality was adjusted to 305. Slices were incubated in artificial CSF (aCSF) containing the following (in mm): 119 NaCl, 2.5 KCl, 2.5 CaCl2, 1.3 MgCl2, 1 NaH2PO4, 26.2 NaHCO3, and 11 glucose, with the osmolality adjusted to 280–290. aCSF was saturated with 95% O2/5% CO2. Acute brain slices were incubated at 34°C for 30 min and then allowed to recover for >30 min at 20–22°C before experimentation. More detailed procedures for obtaining acute NAc slices can be found in our previous publications (Huang et al., 2011; Ishikawa et al., 2013).
Optogenetic stimulation.
The laser systems for optogenetic stimulation (RLM635TA-400S-FC for 635 nm, BLM445TA-300FC for 445 nm) were purchased from Shanghai Laser & Optics Century Co., Ltd. A customized 1 × 2 fanout bundle (FG200UCC-FBUNDLE, Thorlabs) was used to connect both laser sources to a single fluorescence port of the Olympus BX51WI microscope. Laser beams were reflected by a dichroic filter (640FDC4001-C, Knight Optical) and converged by the microscope condenser. The laser beams then passed through a customized cube (Chroma Technology) to reach the objective lens of the microscope. The output powers of the 445 and 635 nm lasers were calibrated before each experiment by placing a laser power meter (catalog #S130A, Thorlabs) below the objective lens.
Electrophysiological recordings.
All recordings were made in the medial NAcSh. The internal solution filling the electrodes contained the following (in mm): 130 KMeSO4, 10 KCl, 10 HEPES, 0.4 EGTA (K), 3 Mg-ATP, 0.5 Na3-GTP, 2 MgCl2, and 7.5 phosphocreatine. Series resistance was 9–20 MΩ, uncompensated, and monitored continuously during recording. Cells with a change in series resistance >15% were excluded from subsequent data analysis. Synaptic currents were recorded with a MultiClamp 700B amplifier, filtered at 2.6–3 kHz, amplified five times, and then digitized at 20 kHz.
In experiments involving activation of both Chrimson and Channelrhodopsin 2 (ChR2), the 635 nm laser, typically at 0.1–0.4 mW, was used first to establish stable EPSCs triggered by Chrimson, with the amplitude typically between 100 and 200 pA. The 635 nm laser was then decreased to a minimal threshold power (typically, 0.05–0.2 mW) that barely induced EPSCs (i.e., 0–20 pA). The 445 nm laser was then used at a power less than or equal to the threshold power of the 635 nm laser. At the same power, the 635 nm laser always triggered Chrimson-induced EPSCs with larger amplitudes than the 445 nm laser. Under our experimental condition, Ch2R-mediated EPSCs could never be triggered by the 635 nm laser but reliably by the 445 nm laser at low powers (see Fig. 6A–F). As such, this procedure maximized the separation of Chrimson- and ChR2-mediated EPSCs in a single-slice setup. In analyzing regular EPSCs (see Figs. 7, 8), we set up a cutoff standard such that only cells with EPSC amplitudes >40 pA that exhibited stable baselines (changes <10%) were kept for subsequent experimentation or analysis. In the minimal stimulation assay (see Fig. 9), the pulse duration of the 445 nm laser was adjusted between 0.5 and 1.0 ms to acquire a success rate of ∼50%. In all other experiments, the pulse duration of the laser was set at 1 ms. In recording of EPSCs, GABAergic receptor antagonists were not included. Although previous studies show that action potentials can be triggered in NAc fast-spiking interneurons (FSIs) by optogenetic stimulation of glutamatergic inputs, the laser powers were relatively high (Yu et al., 2017). In the current studies, very low laser powers were used to minimize cross-projection contamination, reducing the likelihood of triggering action potentials in FSIs. Furthermore, MSNs were recorded at −70 mV, which was close to the reversal potential of GABAergic transmission, further minimizing the potential contribution of GABAergic transmission in our recording. We also scrutinized traces from all recorded cells, all of which exhibited fast rising and decaying kinetics consistent with EPSCs.
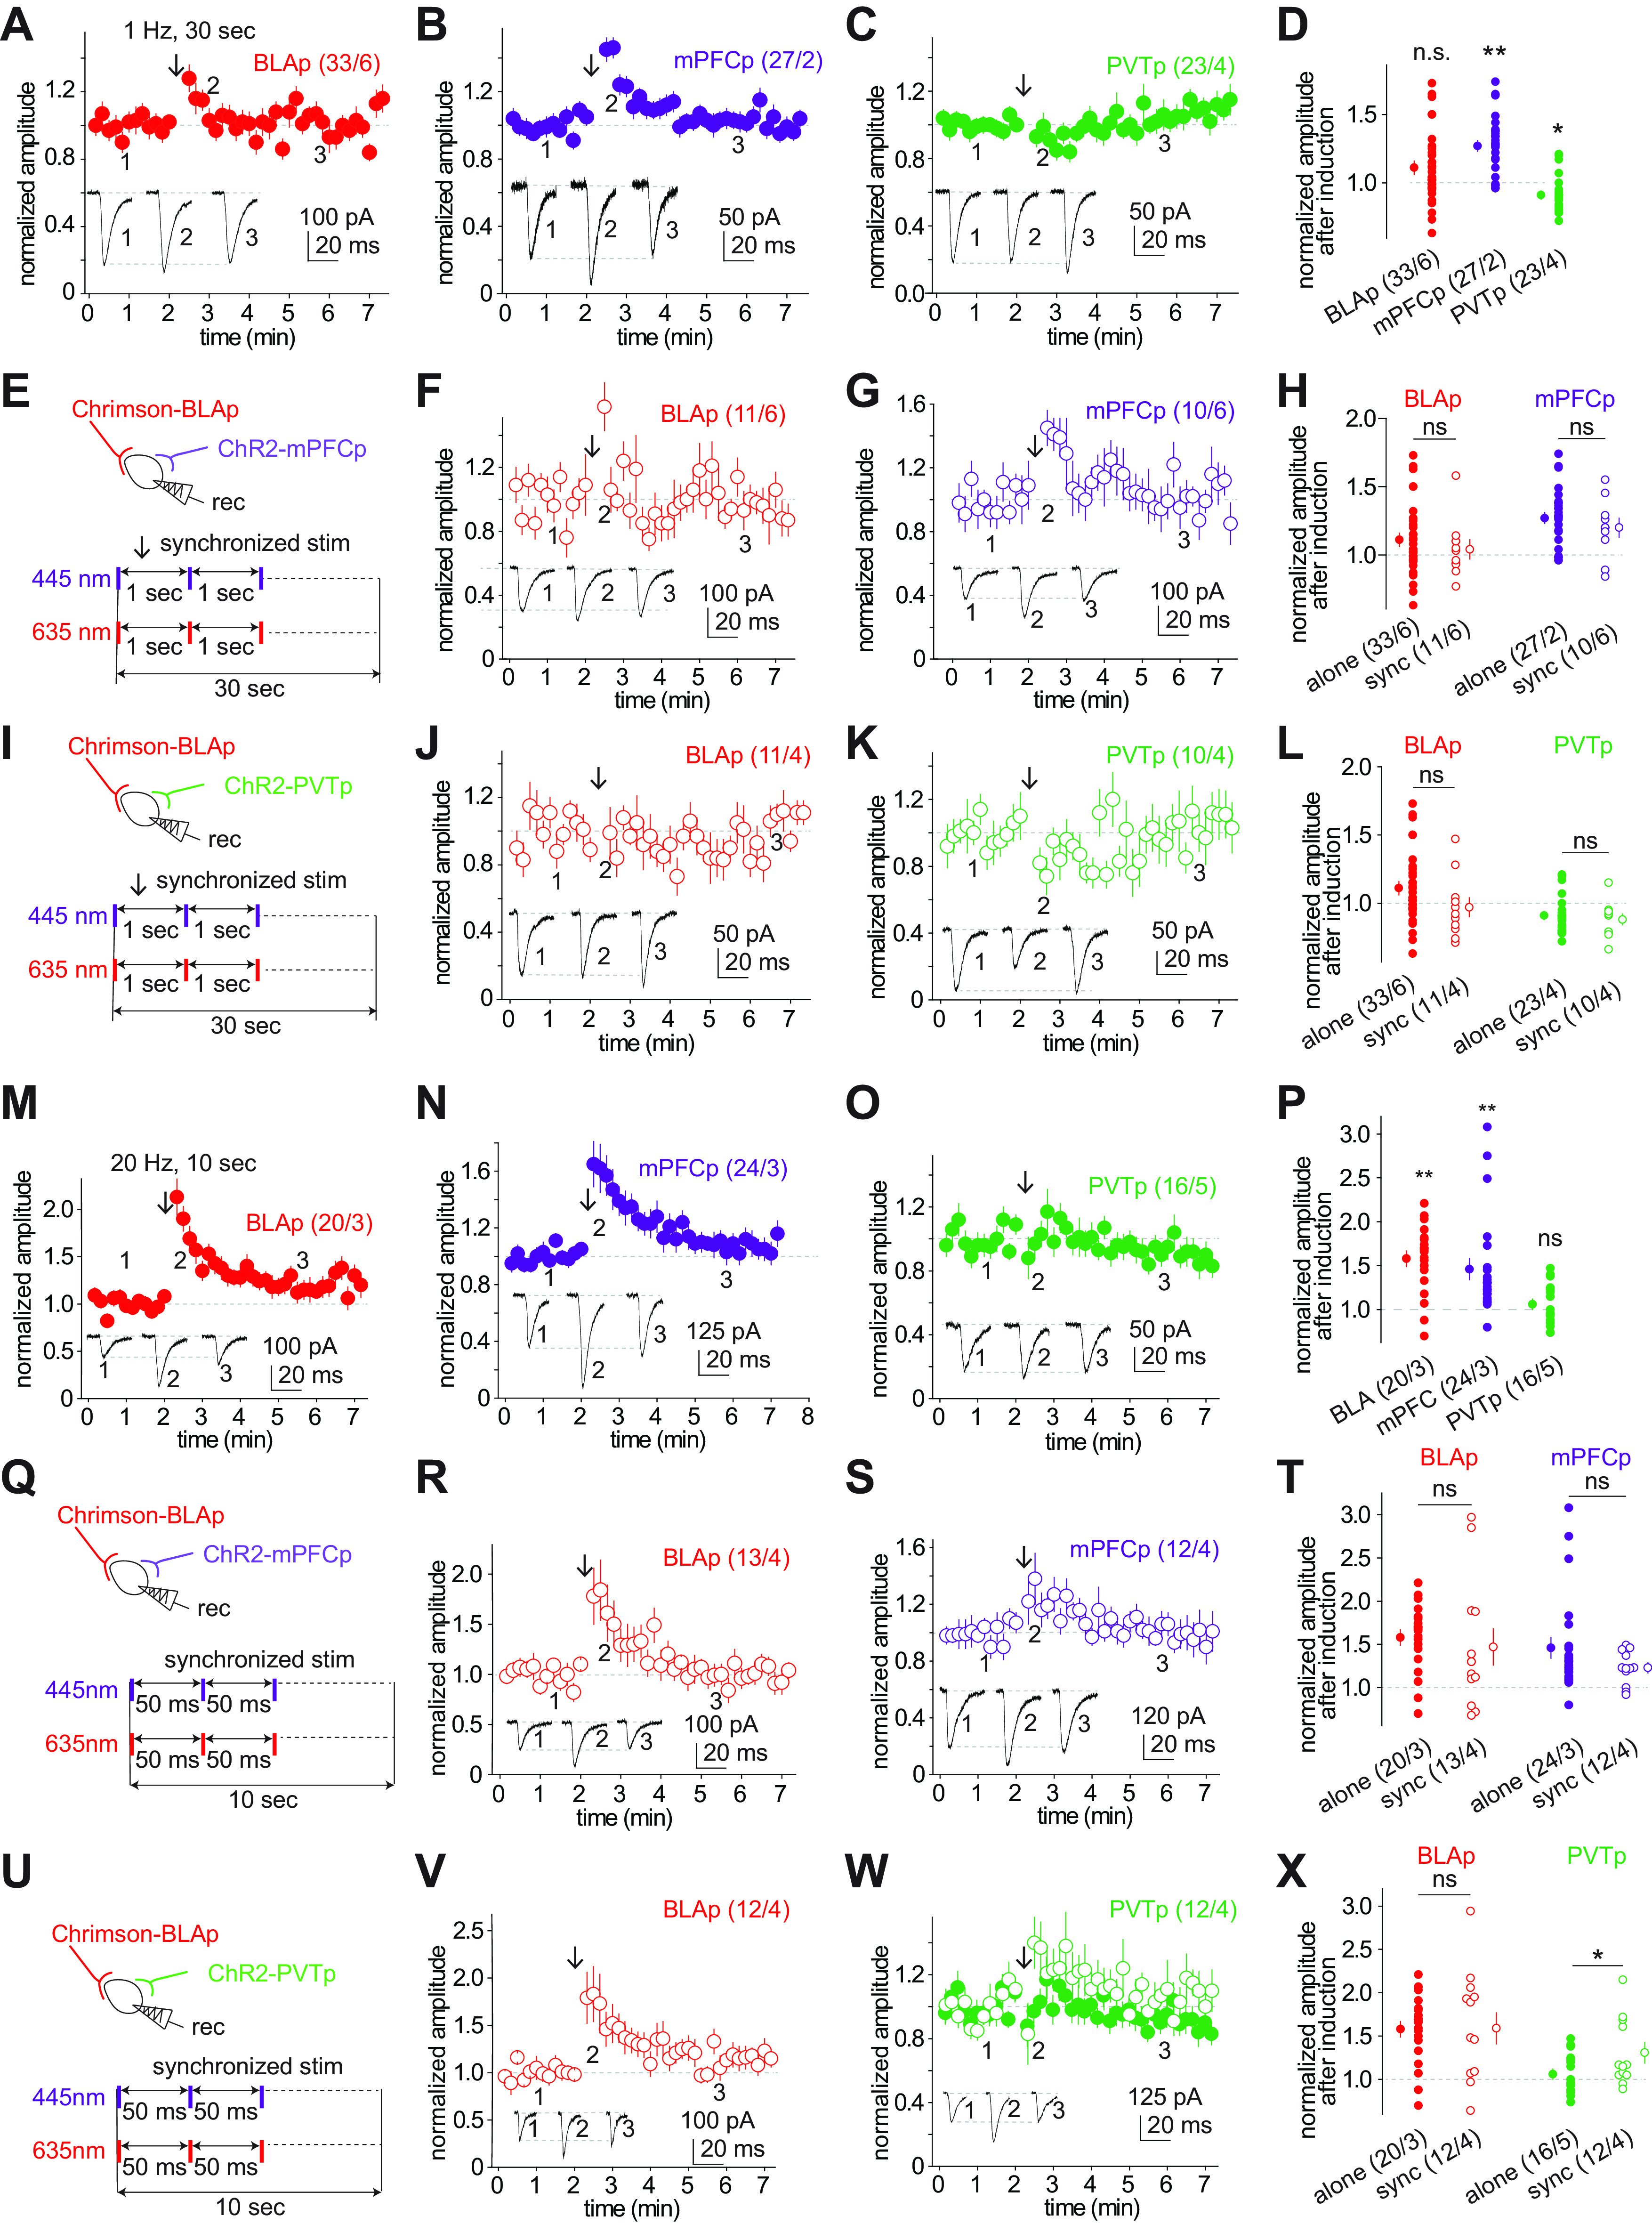
Figure 6.

Dual-rhodopsin system examining dendritic integration of glutamatergic projections to NAcSh MSNs. A, Diagrams showing injection of AAV-ChR2 into the mPFC and recording EPSCs from NAcSh MSNs on alternative stimulation of ChR2-expressing mPFCp by 445 and 635 nm lasers. B, Traces recorded in an example MSN evoked by 445 and 635 nm lasers at 0.5 mW. C, Summary showing that stimulation of ChR2-expressing presynaptic fibers by the 445 nm laser, but not the 635 nm laser, evoked EPSCs in NAcSh MSNs at both 0.5 and 1 mW. D, Diagrams showing injection of AAV-Chrimson into the BLA, and recording EPSCs from NAcSh MSNs on alternative stimulation of Chrimson-expressing BLAp by 445 and 635 nm laser. E, Traces recorded in an example MSN evoked by 445 and 635 nm lasers at 0.5 mW. F, Summary showing that stimulation of Chrimson-expressing presynaptic fibers by 635 nm laser evoked large EPSCs in NAcSh MSNs at both 0.5 and 1 mW, but no or much smaller EPSCs were evoked by the 445 nm laser. G, Diagrams illustrating that the mice with dual-rhodopsin expression in mPFC and BLA were prepared for NAcSh slice in which the mPFCp and BLAp expressed ChR2 and Chrimson, respectively. H, Example of the threshold test for a recording, in which the minimal power of the 635 nm laser that elicited EPSCs was determined. I, Schematics and examples showing EPSCs were alternatively evoked in an MSN from mPFCp and BLAp synapses. J, Schematics and examples showing that EPSCs were evoked in an MSN by synchronized activation of the mPFCp and BLAp. K, Summary showing the linearly summed EPSC amplitudes of both projections (from alternative stimulation) were not statistically different from the EPSC amplitudes by synchronized stimulation of the mPFCp and mBLAp. L, Diagrams illustrating that the mice with dual-rhodopsin expression in PVT and BLA were prepared for NAcSh slices in which the PVTp and BLAp expressed ChR2 and Chrimson, respectively. M, Example of the threshold test for the 635 nm laser. N, Schematics and examples showing EPSCs were alternatively evoked in an MSN from PVTp and BLAp synapses. O, Schematics and examples showing EPSCs were evoked by synchronized activation of the PVTp and BLAp. P, Summary showing that the linearly summed EPSC amplitudes of both projections were larger than the EPSC amplitudes by synchronized stimulation of the PVTp and mBLAp. *p < 0.05; **p < 0.01; ns p > 0.05.
Figure 7.

PPR between two projections to NAcSh MSNs. A, Diagram and schematics illustrating the PPR protocol in which optogenetic stimulation of the ChR2-expressing mPFCp and Chrimson-expressing BLAp was separated by Δt, which was 5 s for baseline recording and 50 ms for PPR recording. B, Example EPSCs from mPFCp and BLAp during baseline recording and PPR conditioning. C, D, Summaries showing no change of EPSC amplitudes at either mPFCp or BLAp synapses during the PPR conditioning of either Δt = 50 ms or Δt = −50 ms. E, Diagram illustrating experimental schematics. F, G, Summaries showing no change of EPSC amplitudes at either PVTp or BLAp synapses during the PPR conditioning of either Δt = 50 ms.
Figure 8.
Interprojection plasticity. A–C, Summaries showing that when a projection was examined independently, a low-frequency stimulation protocol (1 Hz for 30 s) was applied (application time is indicated by arrows) to induce potential plasticity in BLAp (A), mPFCp (B), and PVTp (C) transmissions. D, Summaries showing that this protocol did not affect the BLAp transmission, but induced a short-term potentiation in mPFCp and a depression in PVTp. E, Illustration showing synchronized stimulation of BLAp and mPFCp during the pairing protocol (1 Hz for 30 s). F, G, Summaries of normalized EPSC amplitudes at BLAp (F) and mPFCp (G) synapses before and after the pairing protocol. H, Summaries showing no additional effects of the pairing protocol on BLAp and mPFCp transmission compared with unpaired protocols. I, Illustration showing synchronized stimulation of BLAp and PVTp during the pairing protocol (1 Hz for 30 s). J, K, Summaries of normalized EPSC amplitudes at BLAp (J) and PVTp (K) synapses before and after the pairing protocol. L, Summaries showing no additional effects of the pairing protocol on BLAp and PVTp transmission compared with unpaired protocols. M–O, Summaries showing that when a projection was examined independently, a high-frequency stimulation protocol (20 Hz for 10 ms) was applied (application time is indicated by arrows) to induce plasticity in BLAp (M), mPFCp (N), and PVTp (O) transmission. P, Summaries showing a short-term potentiation was induced in the BLAp and mPFCp transmission without affecting the PVTp transmission. Q, Illustration showing synchronized stimulation of BLAp and mPFCp during the pairing protocol (20 Hz for 10 s). R, S, Summaries of normalized EPSC amplitudes at BLAp (R) and mPFCp (S) synapses before and after the pairing protocol. T, Summaries showing no additional effects of the pairing protocol on BLAp and mPFCp transmission compared with unpaired protocols. U, Illustration showing synchronized stimulation of BLAp and PVTp during the pairing protocol (20 Hz for 10 s). V, W, Summaries of normalized EPSC amplitudes at BLAp (V) and PVTp (W) synapses before and after the pairing protocol. X, Summaries showing no additional effects of the pairing protocol on the BLAp transmission but an additive enhancement of the PVTp transmission. *p < 0.05; **p < 0.01; ns p > 0.05.
Figure 9.

The minimal stimulation assay of potential presynaptic interaction. A, Diagram showing that synaptic transmission from two projections were evoked in a NAcSh MSN. B, Illustration of the 2 min pairing protocol during which the Chrimson-expressing projection was stimulated after or before the stimulation of ChR2-expressing projection by Δt. C, Example EPSCs evoked from the mPFCp by minimal stimulations and their time course before and after the pairing protocol applied to the BLAp. Successes and failures are labeled in black and gray, respectively. D, Example averaged EPSCs of all successes from minimal stimulation of the mPFCp before and after pairing with the BLAp. E, Example traces showing the programmed Δt of 8 ms while the measured Δt value between peaks of EPSCs from two projections was 9.55 ms. F, Summaries showing that the success rate, but not the amplitude of successes, of minimal stimulation-induced responses from the mPFCp was increased after pairing stimulation of the BLAp, while no effects were detected for the BLAp by pairing stimulation of mPFCp. Responses with peak Δt of −20 to 20 ms were pooled. G, Plot showing no correlation between the measured Δt and success rates of BLAp or mPFCp responses evoked by minimal stimulation after pairing stimulation of the coupled projection. H, Plot showing no correlation between the amplitudes of coupling EPSCs and success rates of BLAp and mPFCp responses evoked by minimal stimulation after pairing stimulation of the coupled projection. I, Summaries showing that neither the success rates nor the amplitudes of minimal stimulation-induced responses of the BLAp were changed after pairing stimulation of the coupled projection. J, Plot showing no correlation between the measured Δt values and the success rates of BLAp or mPFCp responses evoked by minimal stimulation after pairing stimulation of coupled projection. K, Plot showing a correlation between the amplitudes of coupling EPSCs from BLAp and success rates of PVTp responses evoked by minimal stimulation after the pairing stimulation, while such a correlation was not detected in the BLAp coupled with PVTp (r2 = 0.01). **p < 0.01; ns p > 0.05.
Data acquisition and statistics.
All results are shown as the mean ± SEM. Most experiments were replicated in 4–16 mice. All data collection was randomized. All data were assumed to be normally distributed, but this was not formally tested. No statistical methods were used to predetermine sample sizes, but our sample sizes were similar to those reported in previous publications with similar experimental designs (Huang et al., 2011; Ishikawa et al., 2013; Lee et al., 2013; Graziane et al., 2016; Neumann et al., 2016; Wright et al., 2020). All data were analyzed offline, and investigators were not blinded to experimental conditions during the analyses.
A total of 186 mice were used for this study, among which 41 mice were excluded from the final data analysis because of the following reasons: (1) 2 mice were excluded because of health issues after surgeries (e.g., >20% drop in body weight in a day); (2) 37 mice were excluded because of off-target stereotaxic injections or poor viral expression; and (3) 2 mice were excluded because of experimental failures (e.g., unsuccessful slice preparations, failed recordings, or other experimental incidents). No animals were excluded after data acquisition was accomplished.
Repeated experiments for the same group were pooled together for statistical analysis. For all datasets, the sample sizes are presented as n/m, where n is the number of cells or dendrites and m is the number of mice. The n-based statistics were used for all data analyses. Statistical significance was assessed using paired or unpaired t tests, or one-way or two-way ANOVA followed by Bonferroni post-test, as specified in the related text. Two-tailed tests were performed for all analyses, and statistical significance was set at p < 0.05. Statistical analyses were performed in GraphPad Prism (version 7) and SPSS version 19 (IBM).
Results
Dual-color SynaptoTag
To label BLAp axons with mPFCp or PVTp inputs simultaneously, we used a dual-color SynaptoTag approach by creating two AAV2/2 constructs, which expressed either synaptobrevin-2-linked mScarlet or EGFP, under the synapsin promoter (Fig. 1A). Synaptobrevin-2 is a presynaptic protein, expression of which leads the fluorescent marker protein toward and thus labels presynaptic terminals. We bilaterally injected mice with SynaptoTag EGFP into the BLA and SynaptoTag mScarlet into the mPFC or PVT (Fig. 1B). Five to 6 weeks later, we prepared coronal slices containing the NAcSh and backfilled MSNs with CF633, a dye with an excitation wavelength of 633 nm that can be differentiated from the excitation of Scarlet (561 nm) and EGFP (488 nm). CF633 filling depicted the detailed morphologies of MSNs, including the soma and different orders of dendrites, as well as dendritic spines (Fig. 1C). When merging with mScarlet or EGFP signals, the anatomic relationships between MSN dendritic spines and presynaptic terminals from the BLAp, mPFCp, or PVTp (Fig. 1D–F) could be visualized.
Figure 1.

Dual-color SynaptoTag combined with backfilling to image projection-specific innervation of NAcSh MSNs. A, AAV Constructs of the dual-color SynaptoTag system showing synaptobrevin2-tagged expression of EGFP or mScarlet. B, Diagram showing the dual-color SynaptoTag strategy. Intra-BLA expression of SynaptoTag EGFP combined with either intra-mPFC or intra-PVT expression of SynaptoTag mScarlet was used to label presynaptic terminals from two projection regions in the same mice. This approach was combined with backfilling of NAcSh MSNs with CF633 to manifest dendritic spines with a third color. C, Example NAcSh MSN backfilled with CF633 with different orders of dendrites and dendritic spines. D–F, Example images showing CF633-filled MSN dendrites and dendritic spines with SynaptoTag-labeled presynaptic terminals from the mPFC (D), PVT (E), and BLA (F). The z-stacked images from 0.2 µm consecutive sections.
Secondary dendrites are preferentially targeted
Dendrites are the primary locations for NAcSh MSNs to receive, integrate, and filter glutamatergic synaptic inputs. If homogeneous properties of dendrites are assumed, synaptic inputs from proximal dendrites typically exert a higher somatic impact compared with those from distal dendrites. In four mice with intra-BLA expression of SynaptoTag EGFP and intra-mPFC expression of SynaptoTag mScarlet (Fig. 2A), we screened the apparent contacts of labeled presynaptic terminals on primary, secondary, and tertiary dendrites of NAcSh MSNs (a total of 136 dendrites were examined; Fig. 2B). In stacked images with 0.2 µm increments, we preliminarily selected the dendritic spines with potential mScarlet- or EGFP-tagged presynaptic terminals as putative synapses connecting to mPFCp or BLAp, respectively (Fig. 2C). We then examined individual 0.2 µm images, and operationally defined the putative synapses with presynaptic and postsynaptic structures only overlapping within one or two adjacent 0.2 µm images as most probable “connecting synapses” (Fig. 2C). Among all labeled spines, we detected small percentages of such connecting BLAp and mPFCp synapses on primary, secondary, and tertiary dendrites, while the majority of spines was not connected to presynaptic SynaptoTag structures (Fig. 2D–F). These low connecting percentages may reflect low synaptic innervation rates from the BLAp and mPFCp on individual dendrites. Alternatively, because of the small amount of viral injection (0.15 µl), our SynaptoTag approach may only label a limited portion of the BLAp and mPFCp. Nonetheless, the connecting synapses from both the BLAp and mPFCp were primarily distributed onto secondary dendrites (F(2,18)= 41.61; p < 0.01, animal-based two-way ANOVA; p <0.01, mPFCp primary vs secondary; p < 0.01, mPFCp secondary vs tertiary; p < 0.01, BLAp primary vs secondary; p <0.01 BLAp secondary vs tertiary; with Bonferroni post-tests; Fig. 2G,H). Similarly, in the paired imaging of BLAp and PVTp from four mice (a total of 216 dendrites were examined; Fig. 3A–C), connecting synapses were detected in all orders of dendrites but enriched on secondary dendrites of NAcSh MSNs (F(2,18)= 21.27; p < 0.01, animal-based two-way ANOVA; p < 0.01, PVTp primary vs secondary; p = 0.16 PVTp, secondary vs tertiary; p < 0.01, BLAp primary vs secondary; p = 0.02, BLAp secondary vs tertiary; p = 0.04, BLAp primary vs tertiary; Bonferroni post-tests; Fig. 3D–H).
Figure 2.
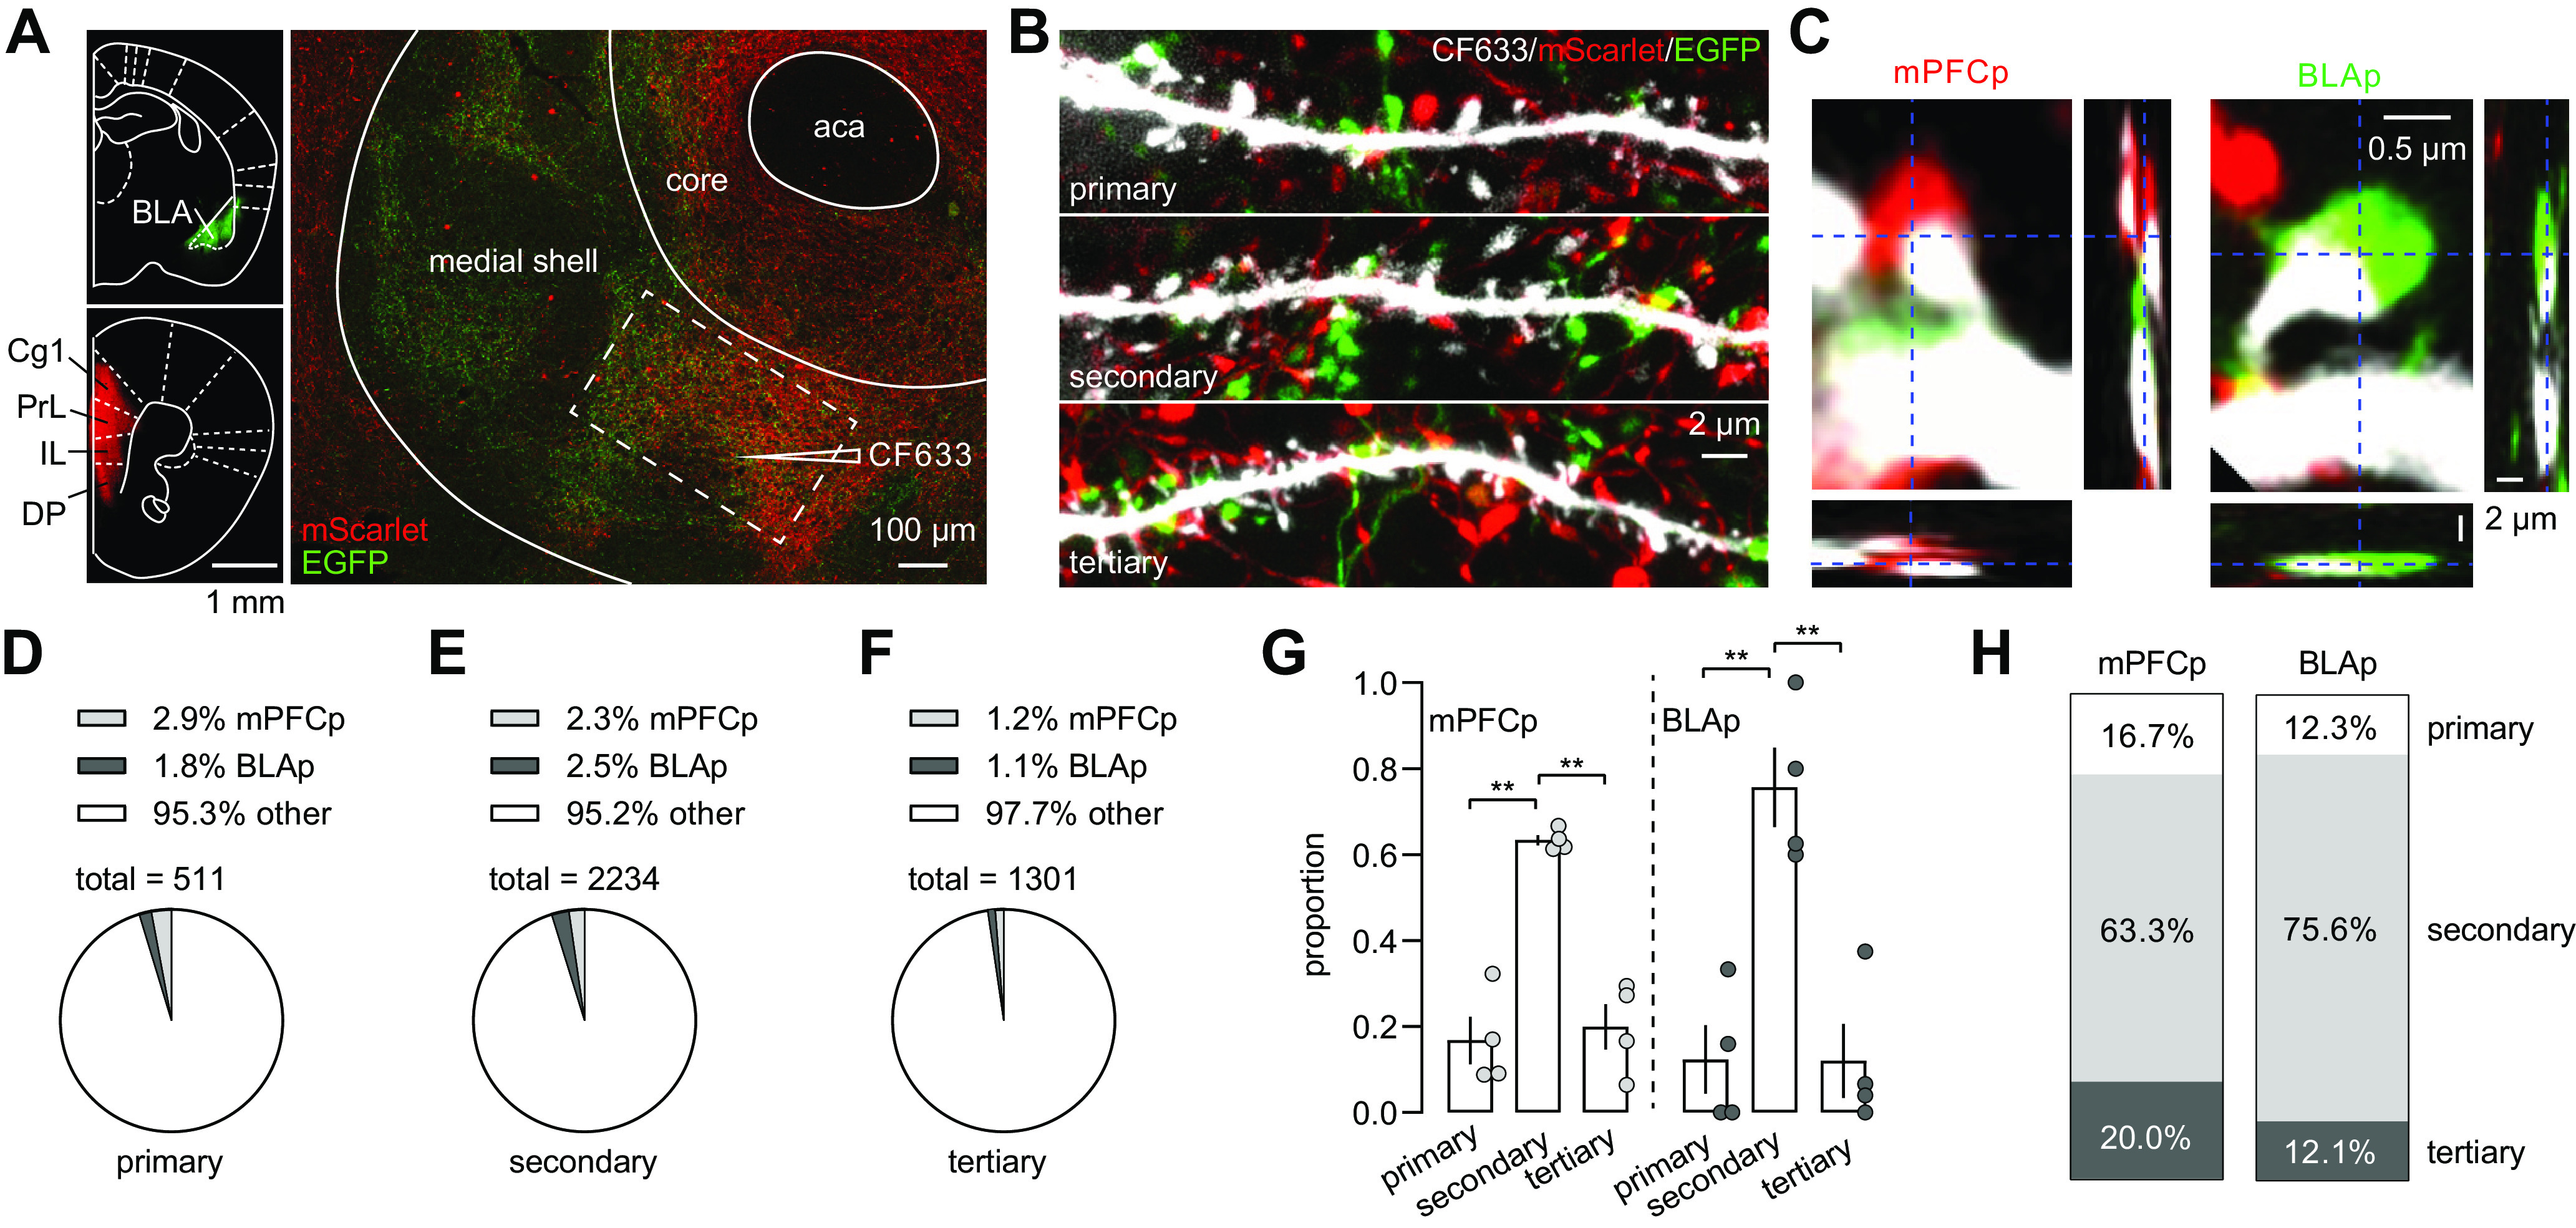
The BLAp and mPFCp primarily innervate secondary dendrites of NAcSh MSNs. A, Left, Example images of the BLA and mPFC where SynaptoTag EGFP and mScarlet were injected, respectively. Right, Example image showing the NAc where the EGFP- and mScarlet-tagged BLAp and mPFCp converged, and MSNs were backfilled by CF633. B, Example z-stacked images showing primary, secondary, and tertiary dendrites with presynaptic terminals from the mPFCp (mScarlet) and BLAp (EGFP). C, Images from 0.2-µm-thick sections showing putative presynaptic innervation of MSN dendritic spines by mPFCp (mScarlet, left) and BLAp (EGFP, right). Insets, Stacked images (∼5 µm) from the z-axis showing the spines and the putatively presynaptic terminals were within the same plane. D–F, Summaries showing low rates of spines from primary (D), secondary (E), and tertiary (F) dendrites putatively innervated by SynaptoTag-labeled presynaptic terminals from both the BLAp and mPFCp. G, H, Summaries showing that both the BLAp and mPFCp preferentially synapsed on secondary dendrites of NAcSh. **p < 0.01.
Figure 3.

The BLAp and PVTp primarily innervate secondary dendrites of NAcSh MSNs. A, Left, Example images of the BLA and PVT where SynaptoTag EGFP and mScarlet were injected, respectively. Right, Example image showing the NAc where the EGFP- and mScarlet-tagged BLAp and mPFCp converged, and MSNs were backfilled by CF633. B, Example z-stacked images showing primary, secondary, and tertiary dendrites with presynaptic terminals from the PVTp (mScarlet) and BLAp (EGFP). C, Images from 0.2-µm-thick sections showing putative presynaptic innervation of MSN dendritic spines by PVTp (mScarlet, left) and BLAp (EGFP, right). Insets, Stacked images (∼5 µm) from the z-axis showing the spines and the putatively presynaptic terminals were within the same plane. D–F, Summaries showing low rates of spines from primary (D), secondary (E), and tertiary (F) dendrites putatively innervated by SynaptoTag-labeled presynaptic terminals from both the BLAp and PVTp. G, H, Summaries showing that both the BLAp and mPFCp preferentially synapsed on secondary dendrites of NAcSh MSNs. *p < 0.05; **p < 0.01.
These results suggest that secondary dendrites receive the majority of synaptic inputs from the BLA, mPFC, and PVT, which is consistent with the general pattern of spine expression and glutamatergic innervation on striatal MSNs (Kemp and Powell, 1971b; Shepherd, 2009).
Dendritic interaction
A common form of synaptic integration occurs at the dendritic level, at which anatomically clustered synapses are prone to influence each other with higher interaction efficacy than dispersed synapses (Yuste, 2011). We therefore quantified the number of BLAp synapses that had adjacent, “clustered” synapses from another projection within 2 µm, a distance within the range over which synapses actively interact (Harvey and Svoboda, 2007; Murakoshi et al., 2011; Fu et al., 2012; Fig. 4A). In four BLAp-mPFCp SynaptoTag mice, we detected 161 connecting synapses among a total of 4046 sampled spines (Fig. 2). Among these 161 connecting synapses, we found 28 synapses that were aligned within the 2 µm range, either at the same or opposite sides of the dendrite (Fig. 4B–D). Most such clusters were detected on the secondary dendrites (four on tertiary and two on primary dendrites). The majority of clustered connected synapses involved the same projection (i.e., BLAp–BLAp or mPFCp–mPFCp pairs), whereas ∼20% of the clusters involved BLAp–mPFCp contacts (Figs. 4E, 5A,B). In four BLAp-PVTp SynaptoTag mice, we detected 299 connecting synapses among a total of 6967 sampled spines. Among these 299 connecting synapses, we found 54 clustered synapses, with ∼20% BLAp-PVTp contacts (Figs. 4F–I, 5G,H). Most clustered connected synapses were on secondary dendrites as well (7 on tertiary dendrites and 1 on primary dendrites).
Figure 4.

Clustering of BLAp synapses with mPFCp or PVTp synapses. A, Diagram illustrating the definition of synaptic clustering. B–D, Example clustering of BLAp–BLAp synapses (B), mPFC–mPFCp synapses (C), and BLAp–mPFCp synapses (D). E, Summary showing the relative portions of clustered mPFCp–mPFCp, BLAp–BLAp, and mPFCp–BLAp synapses among all clustered synapses. F–H, Example clustering of BLAp–BLAp synapses (F), PVTp–PVTp synapses (G), and BLAp–PVTp synapses (H). I, Summary showing the relative portions of clustered PVTp–PVTp, BLAp–BLAp, and PVTp–BLAp synapses among all clustered synapses. All above images were from 0.2-µm-thick sections.
Figure 5.

Putatively heterosynaptic interactions. A, B, Summary images (A) and example images (B) showing a low rate of clustering of mPFCp–BLAp synapses among all putative mPFCp and BLAp synapses. C, D, Summary (C) and example images (D) showing a low rate of cases in which the BLAp putatively synapsed on the neck of mPFCp synapses among all mPFCp synapses. E, F, Summary (E) and example images (F) showing a low rate of cases in which the mPFCp synapsed on the neck of BLAp synapses among all putative BLAp synapses. G, H, Summary images (G) and example images (H) showing a low rate of clustering PVTp and BLAp synapses among all putative PVTp and BLAp synapses. C, D, Summary images (C) and example images (D) showing a low rate of cases in which the BLAp putatively synapsed on the neck of PVTp synapses among all PVTp synapses. I, J, Summary (I) and example images (J) showing a low rate of cases in which the PVTp and BLAp synapsed on the same spines among all putative BLAp synapses. All above images were from 0.2-µm-thick sections. Insets aside images, Stacked images (∼5 µm) from the z-axis showing the spines and the putatively presynaptic terminals were within the same plane. K, L, Summary (K) and example images (L) showing a low rate of cases in which the BLAp and PVTp synapsed on the same spines.
The overall BLAp-mPFCp (28 of 4046) and BLAp-PVTp (54 of 6967) clustering rates were very low, suggesting that the majority of these projections operates relatively independently. However, among the clustered synapses in each preparation, ∼20% were BLAp–mPFCp and BLAp–pVTp clusters, respectively. Albeit at low rates, these close anatomic alignments would allow both mPFCp and PVTp synapses to interact with BLAp synapses for dendritic integration under certain circumstances.
Heterosynaptic interactions
We next explored the anatomic basis that may mediate a potentially heterosynaptic interaction. The synapse clustering elaborated above may provide such an anatomic alignment, but the clustering rate is low between BLAp and mPFCp synapses (data from four BLAp-mPFCp SynaptoTag-labeled mice; Figs. 4A–E, 5A,B). On the other hand, whereas the vast majority of connecting synapses contacted independent spines, we detected one case in which the BLAp was directly apposed to a mPFCp presynaptic terminal, and another case in which the mPFCp appeared in direct apposition to a BLAp presynaptic terminal (Fig. 5C–F). The images were verified in individual 0.2-µm-thick sections (see Materials and Methods), and so the detected alignment of these two presynaptic terminals was operationally defined as a heterosynaptic interaction. In addition to the above adjacent clusters, there were also a small number of cases where the spatial arrangements showed tighter pairing between projections and therefore were suggestive of potential heterosynaptic interactions.
As elaborated above (Fig. 4F–I), the clustering rate was also low between BLAp and PVTp synapses (data from four BLAp-PVTp SynaptoTag-labeled mice; Fig. 5G,H). Although the vast majority of labeled presynaptic terminals innervated spines independently, we observed four cases in which the BLAp was directly apposed to PVTp presynaptic terminals, and five cases in which both the BLAp and PVTp appeared to synapse onto the same spines (Fig. 5I–L).
Collectively, while the vast majority of the BLAp, mPFCp, and PVTp formed independent synaptic contacts, there is a low percentage of spatial alignments, which may allow heterosynaptic interactions between BLAp and mPFCp and between BLAp and PVTp synapses.
Dendritic versus somatic summation
The low percentage of anatomically adjacent and potentially heterosynaptic alignments of BLAp with mPFCp and PVTp presumed synapses (Figs. 4, 5) predicted that nonlinear dendritic summation may occur but might not be the primary means for these synapses to interact. To test this, we adopted a dual-rhodopsin optogenetic approach involving AAV2-mediated expression of ChR2 and Chrimson in two brain regions of the same mice. To verify this approach, we first examined the sensitivity of ChR2 versus Chrimson to the two individual lasers. For ChR2, we bilaterally injected the mice with ChR2-expressing AAV2/2 into the mPFC (Fig. 6A). Five weeks later, we prepared sagittal slices containing the NAcSh- and ChR2-expressing presynaptic projections (Fig. 6A). We performed a whole-cell voltage-clamp recording of NAcSh MSNs in response to optogenetic stimulation using the 445 or 635 nm laser (Fig. 6B). EPSCs could be evoked only by the 445 nm but not the 635 nm laser at both 0.5 and 1 mW, indicating that ChR2 was not sensitive to the 635 nm laser (0.5 mW: 445 nm laser, 210.0 ± 83.8 pA; 635 nm laser, 0.0 ± 0.0 pA; n/m = 7/2; p = 0.04; 1 mW: 445 nm laser, 263.6 ± 104.1 pA; 635 nm laser, 0.0 ± 0.0 pA; n/m = 7/2; p = 0.03, paired t test; Fig. 6C). In another set of mice, we bilaterally injected Chrimson-expressing AAV2/8 into the BLA (Fig. 6D) and performed the same experiment thereafter (Fig. 6E). While the 635 nm laser elicited large EPSCs in NAcSh MSNs at both 0.5 and 1 mW, in the same MSNs the 445 nm laser either failed to elicit or elicited minimal EPSCs at 0.5 mW, but elicited detectable EPSCs at 1 mW, albeit with amplitudes always lower than that elicited by the 635 nm laser (0.5 mW: 445 nm laser, 5.2 ± 3.8 pA; 635 nm laser, 140.5 ± 28.5, n/m = 8/2, p < 0.01; 1 mW: 445 nm laser, 26.7 ± 9.8 pA; 635 nm laser, 159.0 ± 16.1 pA; n/m = 8/2; p < 0.01, paired t test; Fig. 6F). Thus, with the laser power <0.5 mW and with additional verifications (see below), Chrimson-expressing projections can be selectively activated by the 635 nm laser but not the 445 nm laser in our experimental setup.
To examine the potential interaction between BLAp and mPFCp synapses, we prepared the mice with intra-BLA expression of Chrimson and intra-mPFC expression of ChR2 (Fig. 6G). After obtaining NAcSh slices, we first determined the minimal power of the 635 nm laser that elicited EPSCs in NAcSh MSNs (Fig. 6H). Because with the same power, the 635 nm laser always elicited Chrimson-induced EPSCs with higher amplitudes than the 445 nm laser (Fig. 6F), we used the 445 nm laser at or less than this minimal power to ensure no activation of Chrimson-expressing projection by the 445 nm laser. On the other hand, ChR2-induced EPSCs could never be triggered by the 635 nm laser (Fig. 6B,C), so we set the 635 nm laser at a power slightly higher than the minimal power. This laser power setup inevitably resulted in a small number of cases in which the 445 nm laser could not trigger EPSCs and thus excluded from the subsequent experiments, but it maximally minimized the potential contamination of two projections. We performed whole-cell voltage-clamp recording of NAcSh MSNs, and applied the 445 and 635 nm laser alternatively (apart by 5 s) such that EPSCs were sequentially and separately elicited from the mPFCp and BLAp, respectively (Fig. 6I). After 2 min of such recording to establish baseline responses, we synchronized the stimulation of the two lasers such that both projections were stimulated simultaneously, resulting in a single EPSC that combined the inputs from both mPFCp and BLAp synapses (Fig. 6J). If mPFCp and BLAp synapses were located sufficiently close to elicit strong heterosynaptic or dendritic interaction, the combined EPSCs should not be a linear summation of their separately measured EPSCs. However, our results show that the mean response to simultaneous activation of these two sets of synapses was a simple linear summation (220.6 ± 17.9 vs 234.9 ± 26.6 pA, n/m = 16/7; p = 0.25, paired t test; Fig. 6K).
In contrast, when using the same approach to examine the interaction between PVTp and BLAp synapses, we observed that the mean amplitudes of combined EPSCs were smaller than the linear summation of EPSCs from PVTp and BLAp synapses evoked individually (244.6 ± 22.7 vs 208.8 ± 21.5 pA; n/m = 17/5; p < 0.01, paired t test; Fig. 6L–P). This nonlinear summation suggested that the BLAp and PVTp interacted at the dendritic level (see Discussion). That is, the degree to which the BLAp and mPFCp converge at the same NAcSh dendrites and form nearby synapses is sufficiently high to produce a functional interaction.
It is worth noting that, despite different rhodopsins being used, EPSCs evoked at BLAp and mPFCp synapses exhibited similar activation and decay kinetics, which were shorter than those at PVTp synapses [EPSC rising to peak (in ms): BLAp, 2.58 ± 0.23; mPFCp, 2.70 ± 0.16; PVTp, 3.38 ± 0.16; F(2,31) = 5.7, p < 0.01, one-way ANOVA; p = 0.01, BLAp vs PVTp; p = 0.03, mPFCp vs PVTp; Bonferroni post-test; decay time constant (in ms): BLAp, 4.81 ± 0.34; mPFCp, 5.36 ± 0.28; PVTp, 7.26 ± 0.37; F(2,31) = 16.5, p < 0.01, one-way ANOVA; p < 0.01, BLAp vs PVTp and mPFC vs PVTp, Bonferroni post-test]. Thus, rather than because of potentially different activation–inactivation kinetics of ChR2 and Chrimson, these results may reflect different dendritic filtering properties. This notion is supported by the observation that onset delays of EPSCs at these synapses were similar (in ms: BLAp, 2.59 ± 0.07; mPFCp, 2.70 ± 0.10; PVTp, 2.82 ± 0.12; F(2,31) = 1.48, p = 0.24, one-way ANOVA), suggesting similar efficacies of presynaptic activation.
Lack of short-term heterosynaptic plasticity
The anatomic findings showed potential heterosynaptic interactions between projections, which may occur both presynaptically (Fig. 5J) and postsynaptically (Fig. 5L). To explore potential presynaptic interactions, we performed a so-called heterosynaptic paired-pulse ratio (PPR) test. In monosynaptic transmission, when two consecutive presynaptic stimulations are applied within a short interval (e.g., 50 ms), the second presynaptic release event is influenced by the residual calcium from the first stimulation, which often alters the release probability and thus the amplitude of the second EPSC compared with the first one. As such, the PPR, normally defined as the amplitude of the second EPSC over the amplitude of the first, is typically not equal to 1. In a heterosynaptic arrangement in which synapse A influences the presynaptic release of synapse B, sequential activation of A and B may result in a PPR-like effect on B-mediated EPSCs.
In the dual-rhodopsin arrangement, we first established the baseline EPSCs for the two projections by alternatively (5 s apart) applying the two lasers at 0.1 Hz, and then created a heterosynaptic PPR condition by setting the stimulation of one projection 50 ms before or after the other (Δt = +50 or −50 ms; Fig. 7A,B). In testing the BLAp–mPFCp interaction, neither of the PPR conditions (Δt = +50 or −50 ms) affected the amplitudes of the EPSCs at BLAp or mPFCp synapses (normalized amplitude during PPR with Δt = +50 ms: mPFCp, 0.98 ± 0.05, n/m = 13/5, p = 0.73; BLAp, 0.96 ± 0.05, n/m = 12/5, p = 0.39, paired t test; normalized current during PPR with Δt = −50 ms: mPFCp, 1.05 ± 0.03, n/m = 13/4, p = 0.16; BLAp, 1.08 ± 0.04, n/m = 14/4, p = 0.05, paired t test; Fig. 7C,D). Similarly, the heterosynaptic PPR conditioning did not induce detectable interactions between the BLAp and PVTp (Δt = 50 ms: PVTp 1.03 ± 0.02, n/m = 9/3, p = 0.18; BLAp, 1.08 ± 0.07, n/m = 9/3, p = 0.28, paired t test; Δt = −50 ms: PVTp, 1.02 ± 0.04, n/m = 10/3, p = 0.55; BLAp, 1.05 ± 0.04, n/m = 11/3, p = 0.24, paired t test; Fig. 7E–G). Together, these results do not support presynaptically heterosynaptic regulation as a key means for interaction of these glutamatergic projections.
Interprojection plasticity
Different glutamatergic inputs to the NAcSh are often synchronously activated in behaving animals, pushing MSNs into a persistent “upstate” (Mahon et al., 2006). To examine whether such synchronous activations induce intraprojection and interprojection plasticity, we first tested a relatively moderate coactivation conditioning protocol in the dual-rhodopsin setup, 1 Hz for 30 s, which may mimic relatively low-frequency coactivation. Application of this protocol was sufficient to induce certain degrees of intraprojection plasticity. Specifically, we recorded a baseline of EPSCs induced by optogenetic stimulation of the BLAp at 0.1 Hz, followed by the 1 Hz for 30 s protocol, and then returned to the 0.1 Hz testing stimulation. This 1 Hz protocol induced small changes at mPFCp and PVTp, but not BLAp synapses (normalized amplitudes of the second to seventh EPSCs after induction: BLAp, 1.07 ± 0.04, n/m = 33/6, p = 0.08; mPFCp, 1.22 ± 0.04, n/m = 27/2, p < 0.01; PVTp, 0.91 ± 0.03, n/m = 23/4, p = 0.01, paired t test; Fig. 8A–D), but induced a small increase in mPFC synapses and a small decrease in PVT synapses. We observed similar patterns of intraprojection plasticity at mPFCp synapses, but not PVTp synapses (Fig. 8B,C).
The above results show that intraprojection stimulation using this low-frequency protocol induced certain degrees of short-term synaptic changes. We then tested whether coactivation of two projections might induce interprojection effects. In NAcSh slices prepared from the BLAp-mPFCp dual-rhodopsin mice, we alternatively applied two lasers to establish baseline EPSCs from both projections, then coapplied the low-frequency protocol (1 Hz for 30 s) to both projections in a time-locked manner. This procedure did not induce synaptic changes at either BLAp or mPFCp synapses compared with the changes induced by intraprojection stimulation (BLAp after pairing, 1.04 ± 0.07, n/m = 11/6, p = 0.74 compared with unpairing; mPFCp after pairing, 1.20 ± 0.07, n/m = 10/6, p = 0.81 compared with unpairing, unpaired t test; Fig. 8E–H). Similarly, we did not detect any interprojection effects at BLAp or PVTp synapses after the low-frequency protocol was contingently applied to both projections (BLAp after pairing, 0.97 ± 0.07, n/m = 11/4, p = 0.21 compared with unpairing; PVTp, 0.88 ± 0.04, n/m = 10/4, p = 0.55 compared with unpairing, unpaired t test; Fig. 8I–K).
We then used a conditioning protocol of 20 Hz for 10 s to examine whether the high-frequency coactivation conditioning induced interprojection effects. In the intraprojection setup, this protocol induced an LTP-like monosynaptic plasticity at BLAp and mPFCp synapses, but not PVTp synapses (normalized amplitudes of the second to seventh EPSCs after induction: BLAp, 1.58 ± 0.09, n/m = 20/3, p < 0.01; mPFCp, 1.46 ± 0.12, n/m = 24/3, p < 0.01; PVTp, 1.06 ± 0.06, n/m = 16/5, p = 0.35, paired t test; Fig. 8M–P). In NAcSh slices prepared from dual-rhodopsin mice, coconditioning of the BLAp and mPFCp did not result in synaptic changes additive to the observed intraprojection plasticity (BLAp after pairing, 1.47 ± 0.21, n/m = 13/4, p = 0.59 compared with unpairing; mPFCp after pairing, 1.23 = 0.06, n/m = 12/4, p = 0.17 compared with unpairing, unpaired t test; Fig. 8Q–T). On the other hand, coconditioning of the BLAp and PVTp, while not additively affecting BLAp synapses, induced a small but significant additive augmentation of PVTp-mediated transmission compared with the PVTp transmission after monosynaptic application of the same protocol (BLAp after pairing, 1.56 ± 0.20, n/m = 12/4, p = 0.93 compared with unpairing; PVTp after pairing, 1.31 ± 0.12, n/m = 12/4, p = 0.047 compared with unpairing; Fig. 8U–X). This result echoed the above anatomic and physiological observations of a relatively higher rate of heterosynaptic alignments between the BLAp and PVTp than the BLAp and mPFCp (Fig. 5J), as well as a nonlinear summation of the BLAp and PVTp (Fig. 6L–P).
Presynaptic regulation of mPFCp by BLAp
The above anatomic and functional results (Figs. 5J, 6L–P, 8U–X) suggest a potential heterosynaptic regulation of PVTp by BLAp. To explore whether a presynaptic or postsynaptic mechanism was involved, we performed the minimal stimulation assay in the dual-rhodopsin setup, in which we minimized the power intensity of a laser to evoke small-amplitude EPSCs from the ChR2-expressing projection, mixed with failures. After obtaining a baseline of such EPSCs and failures from this projection over a period of 5 min, we coupled the activation of the first projection with the activation of the Chrimson-expressing projection for 2 min, either with perfect coincidence or a time shift (Δt), and then returned to recordings without the second projection coupling for another 5 min (Fig. 9A–E).
In this minimal stimulation assay, a change in the success rate reflects a change in the presynaptic release probability, while a change in the amplitude of successes may reflect a change in postsynaptic responsiveness of single synapses (Isaac et al., 1995; Liao et al., 1995; Huang et al., 2009). Our results show that the success rates, but not the amplitudes of successes, of mPFCp EPSCs were increased after the coupling activation of BLAp, whereas neither the success rate nor the amplitude of BLAp EPSCs were affected by the coupling activation of mPFCp (mPFCp: relative success rate, 1.2 ± 0.1, n/m = 8/5, p < 0.01; relative amplitude of successes, 1.0 ± 0.0, n/m = 8/5, p = 0.93, paired t test; BLAp: relative success rate, 0.9 ± 0.1, n/m = 12/4, p = 0.52; relative amplitude, 1.1 ± 0.1, n/m = 12/4, p = 0.89, paired t test; Fig. 9F). Furthermore, neither the coupling contingency (Δt; BLAp, r2 = 0.10; mPFCp, r2 = 0.17) nor the coupling intensity (i.e., EPSC amplitude of the coupling projection; BLAp, r2 = 0.09; mPFCp, r2 = 0.02) was correlated to the success rate of these projections after coupling with the other (BLAp: relative success rate, 0.9 ± 0.1, n/m = 19/3, p = 0.53; relative amplitude, 1.0 ± 0.1, n/m = 19/3, p = 0.32, paired t test; PVTp: relative success rate, 1.1 ± 0.1, n/m = 16/5, p = 0.47; relative amplitude, 1.2 ± 0.1, n/m = 16/5, p = 0.06, paired t test; Fig. 9G–I). These results show a potentially moderate presynaptic regulation of the mPFCp by BLAp, which echoes the anatomic results (Fig. 5D). On the other hand, we did not observe heterosynaptic effects between the BLAp and PVTp on the success rates (BLAp, r2 < 0.01; PVTp, r2 = 0.14; Fig. 9J). We did, however, detect a positive correlation between the success rates of PVTp transmission and the amplitudes of the coupling BLAp EPSCs (r2 = 0.30, p = 0.03; Fig. 9K).
Discussion
The BLAp, mPFCp, and PVTp are three key glutamatergic NAcSh afferents differentially implicated in various aspects of motivated behaviors. Although there is much evidence for complex interactions between these projections from in vivo studies, we only detected relatively weak support for these interactions in our anatomic and electrophysiological examinations, raising the possibility that the behaviorally manifested interactions may involve different dendrites of the same target neurons, interneuron-mediated feedforward circuits, or cellular convergence at subsequent levels of the network. Nonetheless, the anatomic and physiological interactions observed in the current study suggest that the BLAp can regulate, as well as be regulated by, the mPFCp and PVTp under certain circumstances. These potentially reciprocal regulations may serve as cellular and circuit mechanisms through which different emotional and motivational arousals are integrated and coordinated for influencing adaptive behavioral outputs.
Morphologically, NAcSh MSNs exhibit highly branching, multiordered dendrites containing high densities of spines that receive presynaptic glutamatergic projections (Shepherd, 2009). The fact that the BLAp, mPFCp, and PVTp contacted spines primarily on secondary dendrites (Figs. 1, 2) is not surprising. Systematic morphologic investigations of striatal and NAcSh MSNs reveal higher densities of spines on secondary dendrites than dendrites of other orders (Kemp and Powell, 1971b; Meredith et al., 1992; Shepherd, 2009). Indeed, secondary dendrites may not be preferentially targeted solely by the above three projections, but also other glutamatergic projections. In contrast, almost all primary dendrites that we examined were short (e.g., 20 µm) and exhibited low densities of spines. This is also consistent with the known morphology of striatal MSNs (Kemp and Powell, 1971a,b; Meredith et al., 1992). In our exclusion of these, we also noted the near absence of SynaptoTag-labeled presynaptic terminals in the vicinity, and as such, the actual proportion of primary dendrites receiving glutamatergic projections might be even lower than we reported. On the other hand, all visualized tertiary dendrites exhibited fairly dense spine distributions, but fewer SynaptoTag innervations compared with secondary dendrites. It remains to be determined whether the same afferent projections diverge onto both secondary and tertiary dendrites in the NAcSh.
The low rate observed for SynaptoTag-labeled projection profiles contacting individual dendrites (Figs. 2, 3) suggests two possible characteristics of glutamatergic innervation on NAcSh dendrites that are not mutually exclusive. One is that each of the BLAp, mPFCp, and PVTp forms divergent synapses in the NAcSh. Each of the NAc afferents extensively innervates MSNs. However, we detected a small number of connecting synapses on each examined dendrite. Thus, rather than preferentially innervating a single dendritic segment, these projections might disperse their synaptic inputs across multiple dendrites of the same MSN as well as large numbers of different MSNs. Such divergence would ensure that each glutamatergic projection communicates with many NAcSh MSNs for potential functional synchronicity. The other possible characteristic is convergence. The fact that only a few of the spines densely distributed on each dendritic segment received SynaptoTag-labeled presynaptic terminals suggests that the others were innervated by glutamatergic projections from other brain areas. With such a convergent arrangement, each segment of a dendrite would receive glutamatergic projections from different brain regions, with likely only a small portion from a single projection. Because NAcSh MSNs do not have intrinsic pace-making mechanisms, their activation is driven exclusively by glutamatergic synaptic inputs. The resting membrane potentials of NAcSh MSNs are considerably hyperpolarized (e.g., −80 mV; O'Donnell et al., 1997), which may effectively filter out the influence of sporadic activation of a small number of glutamatergic synapses and ensure responding only to synchronous activation of a large number of glutamatergic synapses (Ishikawa et al., 2009). Indeed, synchronous activation of glutamatergic inputs is a characteristic feature of NAcSh and striatal MSNs in vivo (O'Donnell et al., 1997; Stern et al., 1998).
Upon synchronous activation, integration, and interaction of different glutamatergic inputs may occur at the heterosynaptic, dendritic, or somatic level. We operationally defined heterosynaptic interactions as those that occur when different glutamatergic terminals synapse on each other or share common spines. Our morphologic studies detected a low percentage of BLAp contacts that made putatively heterosynaptic interactions with mPFCp and PVTp inputs (Fig. 5). Although the resolution of our anatomic approach cannot provide definitive evidence for these synaptic alignments, there are references to them in published studies. Most ultrastructural investigations report no synapses between terminal axons in the striatal complex, although a rare few have been noted (Kemp and Powell, 1971c; Kornhuber and Kornhuber, 1983). Studies using Golgi staining or fluorescent dye injection report that both striatal and NAcSh MSNs have low percentages of branched spines that share one spine neck, presumably innervated by multiple presynaptic glutamatergic terminals (Kemp and Powell, 1971a; Comery et al., 1996; Robinson and Kolb, 1997; Forlano and Woolley, 2010). While similar structures are rarely observed in the NAcSh using electron microscopy (French and Totterdell, 2003; French et al., 2005), they have been more commonly observed in the dorsal striatum (Kemp and Powell, 1971a). Together, the anatomic arrangements for heterosynaptic interaction among different afferents exist in the NAc, but the low rate of these arrangements may limit their functional manifestation.
Consistent with the above notion, signs of heterosynaptic interactions were observed in our electrophysiological studies. Specifically, nonlinear summation was observed on coactivation of the BLAp and PVTp (Fig. 5), and an increase in presynaptic release probability (assessed by success rates) was detected at mPFCp synapses when they were costimulated with BLAp synapses (Fig. 9). These regulations can be traced to the heterosynaptic arrangement of these synapses. For example, the heterosynaptic innervation of mPFCp by BLAp (Fig. 5) might allow a coactivation of BLAp to transiently upregulate presynaptic levels of Ca2+ in mPFCp synapses and increase the release probability. Furthermore, compared with the BLAp and mPFCp, the relatively high rate of heterosynaptic arrangements between the BLAp and PVTp may contribute to the manifestation of their nonlinear summation when synapses with all anatomic arrangements were sampled together (Fig. 6). However, the low percentage of observed putatively heterosynaptic arrangements (Fig. 5), low magnitude of nonlinear summation (Fig. 6), and lack of detectable heterosynaptic PPR (Fig. 7) together suggest that heterosynaptic interaction is not a dominant form of interaction between the BLAp and the other two projections to the NAcSh.
We operationally defined dendritic interactions as those that occur when synapses are anatomically independent but influence each other at local dendritic sites. Such arrangements may also contribute to the nonlinear summation observed between the BLAp and PVTp (Fig. 6). In most empirical studies of different brain regions, synaptic signals from the same dendrites are integrated linearly or slightly sublinearly (Burke, 1967; Cash and Yuste, 1998; Jia et al., 2010; Longordo et al., 2013). In the NAcSh, the fact that BLAp connection synapses were occasionally observed in clustered alignments with mPFC or PVTp contacts on the same dendritic segments (Fig. 4) suggests a likelihood of dendritic interactions and nonlinear summation. For example, when electrical signals from clustered synapses are generated synchronously, or sequentially within a short period of time, the shared local ionic conditions may not provide the same driving force as when synapses are otherwise activated with a long temporal or spatial separation. Hence, synaptic inputs that are both spatially and temporally clustered may result in compromised summation when measured from the soma through whole-cell recording (Spruston et al., 1994).
Beyond biophysical summation, clustered synapses may also biochemically influence each other through the cytosol. The discrete structure of spines provides a relatively confined space that reduces the diffusion of spinal contents, but CaMKII and other plasticity-associated signaling proteins can “spill out” and propagate to adjacent spines when abundantly generated (Bressloff, 2013). As such, relatively low levels of signaling components resulting from weak activations, such as the activation induced by the 1 Hz pairing protocol, could be effectively confined within individual spines with limited spine–spine cross talk. However, on strong activations, such as the 20 Hz pairing protocol used in this study (Fig. 8), it is possible that pro-LTP signaling proteins generated from BLAp spines might have diffused into adjacent PVTp spines, resulting in the observed BLAp-mediated regulation of plasticity at PVTp synapses (Fig. 8). Such biochemical influences add another potential mechanism for clustered synapses to locally influence dendritic dynamics.
While the above results and related discussions are exclusively focused on glutamatergic projections, it should be noted that the intraprojection and interprojection interaction of these projections may also involve dopaminergic transmission, which is often activated together with glutamatergic projections to the NAc and striatum during motivated behaviors (Sesack and Grace, 2010; Bamford et al., 2018). Midbrain dopaminergic axons synapse on dendrites and somas of NAc MSNs, which entail fast transmission as well as volume transmission for rapid versus sustained regulation, respectively, of ion channels that contribute to dendritic and somatic responses to excitatory inputs (Pickel et al., 1988; Sesack and Grace, 2010). Furthermore, a portion (<10%) of NAc spines that receive glutamatergic axon inputs from cortex or thalamus also receive convergent dopaminergic inputs (Totterdell and Smith, 1989; Pinto et al., 2003; Sesack and Grace, 2010). This triad configuration allows simultaneously activated dopaminergic signaling to regulate the ongoing glutamatergic inputs to specific spines. This potential timing-contingent dopaminergic regulation may critically regulate the response of MSN dendrites to synchronous glutamatergic inputs (West et al., 2003; Brady and O'Donnell, 2004), thus adding another layer of complexity for the heterosynaptic and dendritic summation of NAc afferent projections.
In summary, our current study characterizes several key features of the BLAp that suggest it can regulate, as well as be regulated by, the mPFCp and PVTp. These results may provide an anatomic and physiological basis for the integration of afferents conveying different emotional and motivational arousals in shaping the output of NAcSh-mediated behaviors.
Footnotes
The authors declare no competing financial interests.
This study was supported by National Institutes of Health National Institute on Drug Abuse Grants DA-043826 (Y.H.H.), DA-046491 (Y.H.H.), DA-047108 (Y.H.H.), DA-040620 (Y.D.), DA-047861 (Y.D.), DA-023206 (Y.D.), and NS-107604 (O.M.S.). We thank Jaryd Ross for technical support and Dr. Thomas C. Südhof for the SynaptoTag construct.
References
- Abivardi A, Bach DR (2017) Deconstructing white matter connectivity of human amygdala nuclei with thalamus and cortex subdivisions in vivo. Hum Brain Mapp 38:3927–3940. 10.1002/hbm.23639 [DOI] [PMC free article] [PubMed] [Google Scholar]
- Bamford NS, Wightman RM, Sulzer D (2018) Dopamine's effects on corticostriatal synapses during reward-based behaviors. Neuron 97:494–510. 10.1016/j.neuron.2018.01.006 [DOI] [PMC free article] [PubMed] [Google Scholar]
- Brady AM, O'Donnell P (2004) Dopaminergic modulation of prefrontal cortical input to nucleus accumbens neurons in vivo. J Neurosci 24:1040–1049. 10.1523/JNEUROSCI.4178-03.2004 [DOI] [PMC free article] [PubMed] [Google Scholar]
- Bressloff PC. (2013) Propagation of CaMKII translocation waves in heterogeneous spiny dendrites. J Math Biol 66:1499–1525. 10.1007/s00285-012-0542-9 [DOI] [PubMed] [Google Scholar]
- Burke RE. (1967) Composite nature of the monosynaptic excitatory postsynaptic potential. J Neurophysiol 30:1114–1137. 10.1152/jn.1967.30.5.1114 [DOI] [PubMed] [Google Scholar]
- Cash S, Yuste R (1998) Input summation by cultured pyramidal neurons is linear and position-independent. J Neurosci 18:10–15. [DOI] [PMC free article] [PubMed] [Google Scholar]
- Chen BT, Yau HJ, Hatch C, Kusumoto-Yoshida I, Cho SL, Hopf FW, Bonci A (2013) Rescuing cocaine-induced prefrontal cortex hypoactivity prevents compulsive cocaine seeking. Nature 496:359–362. 10.1038/nature12024 [DOI] [PubMed] [Google Scholar]
- Comery TA, Stamoudis CX, Irwin SA, Greenough WT (1996) Increased density of multiple-head dendritic spines on medium-sized spiny neurons of the striatum in rats reared in a complex environment. Neurobiol Learn Mem 66:93–96. 10.1006/nlme.1996.0049 [DOI] [PubMed] [Google Scholar]
- Dumitriu D, Rodriguez A, Morrison JH (2011) High-throughput, detailed, cell-specific neuroanatomy of dendritic spines using microinjection and confocal microscopy. Nat Protoc 6:1391–1411. 10.1038/nprot.2011.389 [DOI] [PMC free article] [PubMed] [Google Scholar]
- Everitt BJ. (2014) Neural and psychological mechanisms underlying compulsive drug seeking habits and drug memories–indications for novel treatments of addiction. Eur J Neurosci 40:2163–2182. 10.1111/ejn.12644 [DOI] [PMC free article] [PubMed] [Google Scholar]
- Feil J, Sheppard D, Fitzgerald PB, Yücel M, Lubman DI, Bradshaw JL (2010) Addiction, compulsive drug seeking, and the role of frontostriatal mechanisms in regulating inhibitory control. Neurosci Biobehav Rev 35:248–275. 10.1016/j.neubiorev.2010.03.001 [DOI] [PubMed] [Google Scholar]
- Ferenczi EA, Zalocusky KA, Liston C, Grosenick L, Warden MR, Amatya D, Katovich K, Mehta H, Patenaude B, Ramakrishnan C, Kalanithi P, Etkin A, Knutson B, Glover GH, Deisseroth K (2016) Prefrontal cortical regulation of brainwide circuit dynamics and reward-related behavior. Science 351:aac9698. 10.1126/science.aac9698 [DOI] [PMC free article] [PubMed] [Google Scholar]
- Forlano PM, Woolley CS (2010) Quantitative analysis of pre- and postsynaptic sex differences in the nucleus accumbens. J Comp Neurol 518:1330–1348. 10.1002/cne.22279 [DOI] [PMC free article] [PubMed] [Google Scholar]
- French SJ, Totterdell S (2002) Hippocampal and prefrontal cortical inputs monosynaptically converge with individual projection neurons of the nucleus accumbens. J Comp Neurol 446:151–165. 10.1002/cne.10191 [DOI] [PubMed] [Google Scholar]
- French SJ, Totterdell S (2003) Individual nucleus accumbens-projection neurons receive both basolateral amygdala and ventral subicular afferents in rats. Neuroscience 119:19–31. 10.1016/S0306-4522(03)00150-7 [DOI] [PubMed] [Google Scholar]
- French SJ, Ritson GP, Hidaka S, Totterdell S (2005) Nucleus accumbens nitric oxide immunoreactive interneurons receive nitric oxide and ventral subicular afferents in rats. Neuroscience 135:121–131. 10.1016/j.neuroscience.2005.06.012 [DOI] [PubMed] [Google Scholar]
- Fu M, Yu X, Lu J, Zuo Y (2012) Repetitive motor learning induces coordinated formation of clustered dendritic spines in vivo. Nature 483:92–95. 10.1038/nature10844 [DOI] [PMC free article] [PubMed] [Google Scholar]
- Graziane NM, Sun S, Wright WJ, Jang D, Liu Z, Huang YH, Nestler EJ, Wang YT, Schlüter OM, Dong Y (2016) Opposing mechanisms mediate morphine- and cocaine-induced generation of silent synapses. Nat Neurosci 19:915–925. 10.1038/nn.4313 [DOI] [PMC free article] [PubMed] [Google Scholar]
- Haight JL, Flagel SB (2014) A potential role for the paraventricular nucleus of the thalamus in mediating individual variation in Pavlovian conditioned responses. Front Behav Neurosci 8:79. 10.3389/fnbeh.2014.00079 [DOI] [PMC free article] [PubMed] [Google Scholar]
- Harvey CD, Svoboda K (2007) Locally dynamic synaptic learning rules in pyramidal neuron dendrites. Nature 450:1195–1200. 10.1038/nature06416 [DOI] [PMC free article] [PubMed] [Google Scholar]
- Hsu DT, Kirouac GJ, Zubieta JK, Bhatnagar S (2014) Contributions of the paraventricular thalamic nucleus in the regulation of stress, motivation, and mood. Front Behav Neurosci 8:73. 10.3389/fnbeh.2014.00073 [DOI] [PMC free article] [PubMed] [Google Scholar]
- Huang YH, Lin Y, Mu P, Lee BR, Brown TE, Wayman G, Marie H, Liu W, Yan Z, Sorg BA, Schlüter OM, Zukin RS, Dong Y (2009) In vivo cocaine experience generates silent synapses. Neuron 63:40–47. 10.1016/j.neuron.2009.06.007 [DOI] [PMC free article] [PubMed] [Google Scholar]
- Huang YH, Ishikawa M, Lee BR, Nakanishi N, Schlüter OM, Dong Y (2011) Searching for presynaptic NMDA receptors in the nucleus accumbens. J Neurosci 31:18453–18463. 10.1523/JNEUROSCI.3824-11.2011 [DOI] [PMC free article] [PubMed] [Google Scholar]
- Isaac JT, Nicoll RA, Malenka RC (1995) Evidence for silent synapses: implications for the expression of LTP. Neuron 15:427–434. 10.1016/0896-6273(95)90046-2 [DOI] [PubMed] [Google Scholar]
- Ishikawa M, Mu P, Moyer JT, Wolf JA, Quock RM, Davies NM, Hu XT, Schlüter OM, Dong Y (2009) Homeostatic synapse-driven membrane plasticity in nucleus accumbens neurons. J Neurosci 29:5820–5831. 10.1523/JNEUROSCI.5703-08.2009 [DOI] [PMC free article] [PubMed] [Google Scholar]
- Ishikawa M, Otaka M, Huang YH, Neumann PA, Winters BD, Grace AA, Schlüter OM, Dong Y (2013) Dopamine triggers heterosynaptic plasticity. J Neurosci 33:6759–6765. 10.1523/JNEUROSCI.4694-12.2013 [DOI] [PMC free article] [PubMed] [Google Scholar]
- Janak PH, Tye KM (2015) From circuits to behaviour in the amygdala. Nature 517:284–292. 10.1038/nature14188 [DOI] [PMC free article] [PubMed] [Google Scholar]
- Jentsch JD, Taylor JR (1999) Impulsivity resulting from frontostriatal dysfunction in drug abuse: implications for the control of behavior by reward-related stimuli. Psychopharmacology 146:373–390. 10.1007/pl00005483 [DOI] [PubMed] [Google Scholar]
- Jia H, Rochefort NL, Chen X, Konnerth A (2010) Dendritic organization of sensory input to cortical neurons in vivo. Nature 464:1307–1312. 10.1038/nature08947 [DOI] [PubMed] [Google Scholar]
- Johnson LR, Aylward RL, Hussain Z, Totterdell S (1994) Input from the amygdala to the rat nucleus accumbens: its relationship with tyrosine hydroxylase immunoreactivity and identified neurons. Neuroscience 61:851–865. 10.1016/0306-4522(94)90408-1 [DOI] [PubMed] [Google Scholar]
- Kelley AE. (2004) Ventral striatal control of appetitive motivation: role in ingestive behavior and reward-related learning. Neurosci Biobehav Rev 27:765–776. 10.1016/j.neubiorev.2003.11.015 [DOI] [PubMed] [Google Scholar]
- Kemp JM, Powell TP (1971a) The structure of the caudate nucleus of the cat: light and electron microscopy. Philos Trans R Soc Lond B Biol Sci 262:383–401. 10.1098/rstb.1971.0102 [DOI] [PubMed] [Google Scholar]
- Kemp JM, Powell TP (1971b) The termination of fibres from the cerebral cortex and thalamus upon dendritic spines in the caudate nucleus: a study with the Golgi method. Philos Trans R Soc Lond B Biol Sci 262:429–439. 10.1098/rstb.1971.0105 [DOI] [PubMed] [Google Scholar]
- Kemp JM, Powell TP (1971c) The synaptic organization of the caudate nucleus. Philos Trans R Soc Lond B Biol Sci 262:403–412. 10.1098/rstb.1971.0103 [DOI] [PubMed] [Google Scholar]
- Kerestes R, Chase HW, Phillips ML, Ladouceur CD, Eickhoff SB (2017) Multimodal evaluation of the amygdala's functional connectivity. Neuroimage 148:219–229. 10.1016/j.neuroimage.2016.12.023 [DOI] [PMC free article] [PubMed] [Google Scholar]
- Koob GF, Volkow ND (2016) Neurobiology of addiction: a neurocircuitry analysis. Lancet Psychiatry 3:760–773. 10.1016/S2215-0366(16)00104-8 [DOI] [PMC free article] [PubMed] [Google Scholar]
- Kornhuber J, Kornhuber ME (1983) Axo-axonic synapses in the rat striatum. Eur Neurol 22:433–436. 10.1159/000115598 [DOI] [PubMed] [Google Scholar]
- LaLumiere RT, Smith KC, Kalivas PW (2012) Neural circuit competition in cocaine-seeking: roles of the infralimbic cortex and nucleus accumbens shell. Eur J Neurosci 35:614–622. 10.1111/j.1460-9568.2012.07991.x [DOI] [PMC free article] [PubMed] [Google Scholar]
- Lee BR, Ma YY, Huang YH, Wang X, Otaka M, Ishikawa M, Neumann PA, Graziane NM, Brown TE, Suska A, Guo C, Lobo MK, Sesack SR, Wolf ME, Nestler EJ, Shaham Y, Schlüter OM, Dong Y (2013) Maturation of silent synapses in amygdala-accumbens projection contributes to incubation of cocaine craving. Nat Neurosci 16:1644–1651. 10.1038/nn.3533 [DOI] [PMC free article] [PubMed] [Google Scholar]
- Liao D, Hessler NA, Malinow R (1995) Activation of postsynaptically silent synapses during pairing-induced LTP in CA1 region of hippocampal slice. Nature 375:400–404. 10.1038/375400a0 [DOI] [PubMed] [Google Scholar]
- Longordo F, To MS, Ikeda K, Stuart GJ (2013) Sublinear integration underlies binocular processing in primary visual cortex. Nat Neurosci 16:714–723. 10.1038/nn.3394 [DOI] [PubMed] [Google Scholar]
- Ma Y-Y, Lee BR, Wang X, Guo C, Liu L, Cui R, Lan Y, Balcita-Pedicino JJ, Wolf ME, Sesack SR, Shaham Y, Schlüter OM, Huang YH, Dong Y (2014) Bidirectional modulation of incubation of cocaine craving by silent synapse-based remodeling of prefrontal cortex to accumbens projections. Neuron 83:1453–1467. 10.1016/j.neuron.2014.08.023 [DOI] [PMC free article] [PubMed] [Google Scholar]
- Mahon S, Vautrelle N, Pezard L, Slaght SJ, Deniau JM, Chouvet G, Charpier S (2006) Distinct patterns of striatal medium spiny neuron activity during the natural sleep-wake cycle. J Neurosci 26:12587–12595. 10.1523/JNEUROSCI.3987-06.2006 [DOI] [PMC free article] [PubMed] [Google Scholar]
- Mashhoon Y, Wells AM, Kantak KM (2010) Interaction of the rostral basolateral amygdala and prelimbic prefrontal cortex in regulating reinstatement of cocaine-seeking behavior. Pharmacol Biochem Behav 96:347–353. 10.1016/j.pbb.2010.06.005 [DOI] [PMC free article] [PubMed] [Google Scholar]
- Meredith GE, Agolia R, Arts MP, Groenewegen HJ, Zahm DS (1992) Morphological differences between projection neurons of the core and shell in the nucleus accumbens of the rat. Neuroscience 50:149–162. 10.1016/0306-4522(92)90389-j [DOI] [PubMed] [Google Scholar]
- Millan EZ, Ong Z, McNally GP (2017) Paraventricular thalamus: gateway to feeding, appetitive motivation, and drug addiction. Prog Brain Res 235:113–137. 10.1016/bs.pbr.2017.07.006 [DOI] [PubMed] [Google Scholar]
- Mogenson GJ, Jones DL, Yim CY (1980) From motivation to action: functional interface between the limbic system and the motor system. Prog Neurobiol 14:69–97. 10.1016/0301-0082(80)90018-0 [DOI] [PubMed] [Google Scholar]
- Murakoshi H, Wang H, Yasuda R (2011) Local, persistent activation of Rho GTPases during plasticity of single dendritic spines. Nature 472:100–104. 10.1038/nature09823 [DOI] [PMC free article] [PubMed] [Google Scholar]
- Neumann PA, Wang Y, Yan Y, Wang Y, Ishikawa M, Cui R, Huang YH, Sesack SR, Schlüter OM, Dong Y (2016) Cocaine-induced synaptic alterations in thalamus to nucleus accumbens projection. Neuropsychopharmacology 41:2399–2410. 10.1038/npp.2016.52 [DOI] [PMC free article] [PubMed] [Google Scholar]
- O'Donnell P, Lavín A, Enquist LW, Grace AA, Card JP (1997) Interconnected parallel circuits between rat nucleus accumbens and thalamus revealed by retrograde transynaptic transport of pseudorabies virus. J Neurosci 17:2143–2167. 10.1523/JNEUROSCI.17-06-02143.1997 [DOI] [PMC free article] [PubMed] [Google Scholar]
- Otis JM, Zhu M, Namboodiri VMK, Cook CA, Kosyk O, Matan AM, Ying R, Hashikawa Y, Hashikawa K, Trujillo-Pisanty I, Guo J, Ung RL, Rodriguez-Romaguera J, Anton ES, Stuber GD (2019) Paraventricular thalamus projection neurons integrate cortical and hypothalamic signals for cue-reward processing. Neuron 103:423–431.e4. 10.1016/j.neuron.2019.05.018 [DOI] [PMC free article] [PubMed] [Google Scholar]
- Peters J, LaLumiere RT, Kalivas PW (2008) Infralimbic prefrontal cortex is responsible for inhibiting cocaine seeking in extinguished rats. J Neurosci 28:6046–6053. 10.1523/JNEUROSCI.1045-08.2008 [DOI] [PMC free article] [PubMed] [Google Scholar]
- Pickel VM, Towle AC, Joh TH, Chan J (1988) Gamma-aminobutyric acid in the medial rat nucleus accumbens: ultrastructural localization in neurons receiving monosynaptic input from catecholaminergic afferents. J Comp Neurol 272:1–14. 10.1002/cne.902720102 [DOI] [PubMed] [Google Scholar]
- Pinto A, Jankowski M, Sesack SR (2003) Projections from the paraventricular nucleus of the thalamus to the rat prefrontal cortex and nucleus accumbens shell: ultrastructural characteristics and spatial relationships with dopamine afferents. J Comp Neurol 459:142–155. 10.1002/cne.10596 [DOI] [PubMed] [Google Scholar]
- Robinson TE, Kolb B (1997) Persistent structural modifications in nucleus accumbens and prefrontal cortex neurons produced by previous experience with amphetamine. J Neurosci 17:8491–8497. [DOI] [PMC free article] [PubMed] [Google Scholar]
- Sesack SR, Pickel VM (1992) Prefrontal cortical efferents in the rat synapse on unlabeled neuronal targets of catecholamine terminals in the nucleus accumbens septi and on dopamine neurons in the ventral tegmental area. J Comp Neurol 320:145–160. 10.1002/cne.903200202 [DOI] [PubMed] [Google Scholar]
- Sesack SR, Grace AA (2010) Cortico-basal ganglia reward network: microcircuitry. Neuropsychopharmacology 35:27–47. 10.1038/npp.2009.93 [DOI] [PMC free article] [PubMed] [Google Scholar]
- Setlow B, Holland PC, Gallagher M (2002) Disconnection of the basolateral amygdala complex and nucleus accumbens impairs appetitive pavlovian second-order conditioned responses. Behav Neurosci 116:267–275. 10.1037//0735-7044.116.2.267 [DOI] [PubMed] [Google Scholar]
- Shepherd G. (2009) The synaptic organization of the brain. Oxford: Oxford UP. [Google Scholar]
- Shiflett MW, Balleine BW (2010) At the limbic-motor interface: disconnection of basolateral amygdala from nucleus accumbens core and shell reveals dissociable components of incentive motivation. Eur J Neurosci 32:1735–1743. 10.1111/j.1460-9568.2010.07439.x [DOI] [PMC free article] [PubMed] [Google Scholar]
- Spruston N, Jaffe DB, Johnston D (1994) Dendritic attenuation of synaptic potentials and currents: the role of passive membrane properties. Trends Neurosci 17:161–166. 10.1016/0166-2236(94)90094-9 [DOI] [PubMed] [Google Scholar]
- Stern EA, Jaeger D, Wilson CJ (1998) Membrane potential synchrony of simultaneously recorded striatal spiny neurons in vivo. Nature 394:475–478. 10.1038/28848 [DOI] [PubMed] [Google Scholar]
- Stevenson CW, Gratton A (2003) Basolateral amygdala modulation of the nucleus accumbens dopamine response to stress: role of the medial prefrontal cortex. Eur J Neurosci 17:1287–1295. 10.1046/j.1460-9568.2003.02560.x [DOI] [PubMed] [Google Scholar]
- Stuber GD, Sparta DR, Stamatakis AM, van Leeuwen WA, Hardjoprajitno JE, Cho S, Tye KM, Kempadoo KA, Zhang F, Deisseroth K, Bonci A (2011) Excitatory transmission from the amygdala to nucleus accumbens facilitates reward seeking. Nature 475:377–380. 10.1038/nature10194 [DOI] [PMC free article] [PubMed] [Google Scholar]
- Suska A, Lee BR, Huang YH, Dong Y, Schlüter OM (2013) Selective presynaptic enhancement of the prefrontal cortex to nucleus accumbens pathway by cocaine. Proc Natl Acad Sci U S A 110:713–718. 10.1073/pnas.1206287110 [DOI] [PMC free article] [PubMed] [Google Scholar]
- Totterdell S, Smith AD (1989) Convergence of hippocampal and dopaminergic input onto identified neurons in the nucleus accumbens of the rat. J Chem Neuroanat 2:285–298. [PubMed] [Google Scholar]
- Wang Y, Liu Z, Cai L, Guo R, Dong Y, Huang YH (2020) A critical role of basolateral amygdala-to-nucleus accumbens projection in sleep regulation of reward seeking. Biol Psychiatry 87:954–966. 10.1016/j.biopsych.2019.10.027 [DOI] [PMC free article] [PubMed] [Google Scholar]
- West AR, Floresco SB, Charara A, Rosenkranz JA, Grace AA (2003) Electrophysiological interactions between striatal glutamatergic and dopaminergic systems. Ann N Y Acad Sci 1003:53–74. 10.1196/annals.1300.004 [DOI] [PubMed] [Google Scholar]
- Wolf ME. (2010) The Bermuda Triangle of cocaine-induced neuroadaptations. Trends Neurosci 33:391–398. 10.1016/j.tins.2010.06.003 [DOI] [PMC free article] [PubMed] [Google Scholar]
- Wright WJ, Graziane NM, Neumann PA, Hamilton PJ, Cates HM, Fuerst L, Spenceley A, MacKinnon-Booth N, Iyer K, Huang YH, Shaham Y, Schlüter OM, Nestler EJ, Dong Y (2020) Silent synapses dictate cocaine memory destabilization and reconsolidation. Nat Neurosci 23:32–46. 10.1038/s41593-019-0537-6 [DOI] [PMC free article] [PubMed] [Google Scholar]
- Xu W, Südhof TC (2013) A neural circuit for memory specificity and generalization. Science 339:1290–1295. 10.1126/science.1229534 [DOI] [PMC free article] [PubMed] [Google Scholar]
- Yu J, Yan Y, Li KL, Wang Y, Huang YH, Urban NN, Nestler EJ, Schlüter OM, Dong Y (2017) Nucleus accumbens feedforward inhibition circuit promotes cocaine self-administration. Proc Natl Acad Sci U S A 114:E8750–E8759. 10.1073/pnas.1707822114 [DOI] [PMC free article] [PubMed] [Google Scholar]
- Yuste R. (2011) Dendritic spines and distributed circuits. Neuron 71:772–781. 10.1016/j.neuron.2011.07.024 [DOI] [PMC free article] [PubMed] [Google Scholar]
- Zhou K, Zhu Y (2019) The paraventricular thalamic nucleus: a key hub of neural circuits underlying drug addiction. Pharmacol Res 142:70–76. 10.1016/j.phrs.2019.02.014 [DOI] [PubMed] [Google Scholar]
- Zhu Y, Wienecke CF, Nachtrab G, Chen X (2016) A thalamic input to the nucleus accumbens mediates opiate dependence. Nature 530:219–222. 10.1038/nature16954 [DOI] [PMC free article] [PubMed] [Google Scholar]